Abstract
On 5–6 July 2017 (J17), an unusual series of rainfalls induced a concentration of precipitations in Northern Kyushu, Japan, reaching 516 mm in 24 h in Asakura City, a first in its history since the beginning of observation in 1976. This triggered unprecedented hydro-meteorological hazards (landslides, debris flows, and floods) in forested mountainous areas, such as in the Akatani watershed, where the estimated discharge reached 520 m3/s at its outflow. It induced numerous deaths, structural damages, destruction of river channels, and deposition of sediment in flood plains. If smaller-scale hazards have usually driven authorities to build protection systems in the watershed, the J17 crisis called for a full remodeling of it, interrupting waterways and reshaping slope shapes and structures. Considering the means deployed by the central government for this reconstruction, the J17 event triggered a full “re-construction” of rivers, modifying the hydrosystem’s functioning at the watershed scale. Thus, our objective is to show that after the relative stability of Akatani watershed’s hydrosystem over 75 y, the exceptionality of the J17 crisis forced us to rethink the watershed’s organization, using this event as the reference for post-disaster reconstruction. The research relies on field surveys in 2019 and 2022, interviews of officials, and GIS analysis based on historical aerial photograph interpretation and geospatial data. It revealed that (a) the geometry of post-disaster channels was completely redesigned to match a new reference and (b) sediment control structures were multiplied to restructure slopes, breaking the slope angles into subwatersheds. The Akatani watershed case then illustrates the full range of structural measures developed by Japanese engineering to reduce hydrological risks.
1. Introduction
On 5–6 of July 2017 (J17), unstable atmospheric conditions caused an unusual series of rainfalls that triggered a set of hydro-meteorological hazards in the Fukuoka and Oita prefectures, Kyushu island (Figure 1) [1]. The region registered an unusual amount of daily rainfall, reaching 516 mm in 24 h in Asakura city [1]. Between 1977 and 2017, precipitation rates exceeded 600 mm on a monthly scale on nine occasions [2]. However, the J17 precipitation rate was exceptional, with an estimated occurrence probability higher than 1/200 [3], leading to thousands of landslides in the mountainous areas of subwatersheds on the right bank of the Chikugo River (CH) [1].
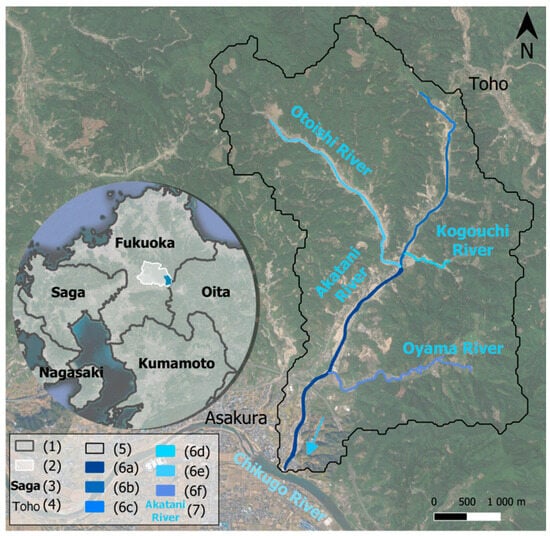
Figure 1.
Location of AK watershed (approximately 20 km2). (1) Prefecture boundaries; (2) Asakura boundaries; (3) prefecture name; (4) toponym; (5) AK watershed; (6a) AK downstream; (6b) AK mid-stream; (6c) AK upstream; (6d) KO stream; (6e) OT stream; (6f) OY stream; (7) hydronym.
Landslides were accompanied by debris flows and river floods, affecting mountainous villages and cities located in the CH’s floodplain. This resulted in several structural damages and deaths; damages were evaluated at JPY 224,070 M with 3067 dwellings impacted and 41 victims in Fukuoka and Oita prefectures, including 22 in the Akatani (AK) watershed (Figure 1) [4]. The amount of dragged sediment in the watershed approximately reached 2.9 M m3, floods inundated 106 ha, and 258 houses were affected by the disaster [3]. During the J17 crisis, the four rivers of the AK watershed (AK; OT: Otoishi; OY: Oyama; KO: Ogouchi) (Figure 1) were damaged, especially rivers AK and OT. We divide them into sections for calculations (Figure 1).
After natural disasters, the Japanese government usually sets up reconstruction plans. If previous events have usually driven the regional and local authorities to build protection systems in the AK watershed, the amplitude of J17 disaster called for a full remodeling of it, interrupting waterways, reshaping slope shapes and structures, and implicating the central government and about 30 dams and public works companies over 5 y. Our research aims to explain how after the relative period of stability, the exceptionality of the J17 crisis forced a rethink of the watershed’s organization, leading to the use of a new reference for post-disaster reconstruction plans.
We will show that (i) between 1947 and 2017, AK watershed organization was stable despite hydro-meteorological hazards registered for the period; (ii) the J17 crisis represents a low-frequency, high-magnitude (LFHM) phenomenon that caused severe damages in the watershed and forced the development of a large-scale post-disaster reconstruction with a new reference; and (iii) reconstruction policies induced by this crisis based on structural measures such as erosion control dams (ECDs) or channel enlargement reflect the engineering response of the Japanese government after a hydroclimatic disaster.
To verify our hypothesis, we will rely on (i) fieldwork and three interviews conducted in 2019 and 2022, (ii) digitalization of floods and mass movement in the AK watershed supported by data from the Geospatial Information Authority of Japan (GSI), (iii) diachronic analysis of river channel width and sinuosity between 1947 and 2022, and (iv) evolution of pre- and post-disaster number of ECDs.
2. Materials and Methods
To highlight the J17 disaster’s impacts and follow reconstruction policies, we based the methodology on a diachronic analysis of multi-source imagery from 1947 to 2022 (Figure 2). To show the relative stability of the AK watershed before 2017 and the disequilibrium the J17 crisis caused, we analyzed the watershed’s evolution over 75 y by comparing the (i) river sinuosity index, (ii) channel width, and (iii) construction of erosion control structures (ECSs). These comparisons were made with manually georeferenced aerial photographs (APs) for 1947, 2009 [5], and 2017 [6] and 2022 satellite images (Figure 2). Aps mainly cover the AK watershed area, with a focus on valley bottoms. Due to the physiography of the area, we used the polynomial 2 function for the georeferencing. We accepted a margin error of 1 to 2 pixels for each georeferenced AP. We used 2017 and 2022 images to georeference the 2009 APs. Due to the similarity of land use, we georeferenced the 1947 APs with the help of 1980s APs [6]. Margin errors are most important for 1947, due to the bad quality of the photos.
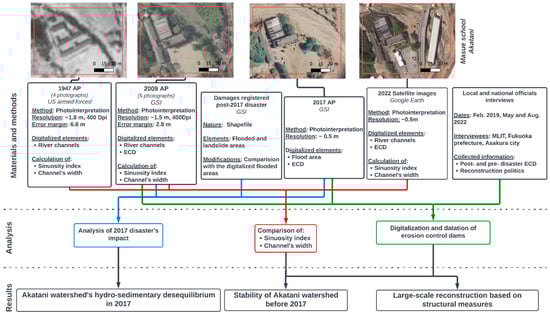
Figure 2.
Diagram of the used methods and materials.
With 1947, 2009, 2017, and 2022 resources, we digitalized river channels and ECDs (Figure 2). Because of the chosen method, errors may occur in the digitalization process. To calculate the margin error of the digitalized elements, we used two disconnected channels visible in 2022’s images (Figure 3). Every 15 m, we calculated and merged the difference between pre-disaster and disconnected channels for each bank (Figure 3). Errors may be due to the vegetation along rivers, limits of photointerpretation, or mismatches during the georeferencing process. To identify rivers’ modification, we calculated their width and sinuosity index for 3 periods (Figure 2). The following thresholds characterize the sinuosity indexes: <1.05: straight; 1.05–1.3: sinuous; 1.3–1.5: moderate meandering; >1.5: meandering form [7]. For their width, we calculated the mean length from one bank to the other with transects every 100 m.
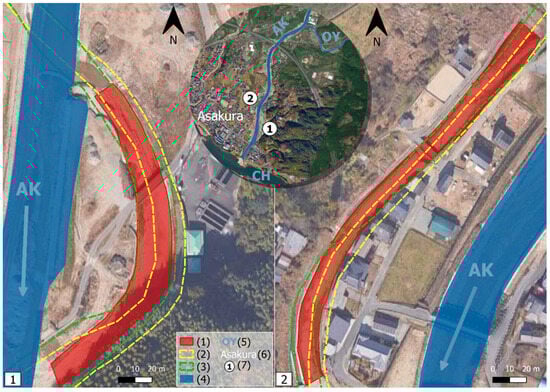
Figure 3.
Example of remaining channels used to calculate margin errors. (1) Disconnected channel; (2) 1947 channel; (3) 2009 channel; (4) 2022 channel; (5) hydronym; (6) toponym; (7) channel location.
In addition, we acknowledge damages in the watershed and follow its restoration through three field surveys conducted in February 2019, May, and August 2022. Three interviews with national and local officials involved in the reconstruction process completed our observations by allowing us to collect data related to ECSs (Figure 2). Within these structures, we inventoried two categories of ECDs: (i) sabo dams, constructed by the Ministry of Land, Infrastructures, Transport and Tourism (MLIT) and prefectures and (ii) chisan dams, managed by the Ministry of Agriculture, Forestry and Fisheries (MAFF). For dams lacking data, the comparison of the 2009, 2017, and 2022 images helped to approximately define their construction date and classify them as pre- or post-disaster constructions.
3. Results
The evolution of the AK watershed over 75 y and the role of the J17 crisis in the modification of the watershed’s organization can be described in three stages: (i) the J17 hydroclimatic event represents a complete disruption of the hydrosystem’s functioning; (ii) the organization of the AK watershed remains relatively stable before 2017, whereas after the J17 event, the watershed is subject to a complete restructuration of the river channel; (iii) and a very high number of ECD constructions.
3.1. From 1947, the Hydroclimatic Event of 2017 Completely Disrupted the Area
Heavy rainfalls concentrated in a short period of time such as the J17 event are rare in the AK watershed [2]. The Kyushu Regional Management Service Association (KRMSA) has registered significant disasters, such as hydroclimatic-related ones, since 679 for the Fukuoka prefecture. Very few registered events explicitly involve the AK watershed: one in 1921 and the J17 one [8]. This shows that hydro-meteorological hazards rarely trigger high-magnitude disasters in the watershed, strengthening the singularity of the J17 disaster. The AK watershed registered significant damages in 2017. In the mountains, landslides and debris flows were triggered in several sub-basins, carrying driftwood (Figure 4) [9]. Downstream, river floods inundated valley bottoms, carrying sediments from the upper slope erosion. In addition to the deaths, these hazards damaged building and transportation systems in the AK watershed [10].
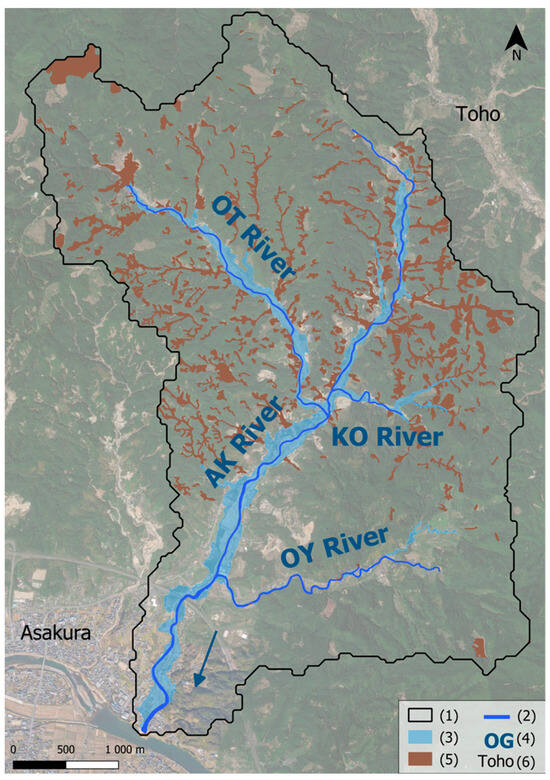
Figure 4.
Spatial coverage of hydroclimatic hazards after the heavy rainfall of the J17 event. (1) AK watershed area; (2) 2009 channel; (3) 2017 flood [11]; (4) hydronym; (5) landslide area [11]; (6) toponym.
Regarding the magnitude and the repercussions of the event, restoration works were considered necessary to (i) rehabilitate damaged structures and protection systems and (ii) protect inhabitants living in mountainous areas and downstream from future high-magnitude hazards. As the J17 event showed the limits of the previous protection systems for LFHM crises, the government undertook post-reconstruction plans based on rainfall rates with an occurrence probability of 1/50 [3], leading to the complete remodeling of river channels and the development of erosion protection systems in the watershed.
3.2. A Reconstruction of the Geometry of the Channel after 2017
After J17, river channels were redesigned to “increase the reliability of flood control” by widening and straightening rivers [12], increasing AK bankfull discharge from 50 m3/s to 330 m3/s at the CH’s confluence [3]. This evolution is detailed in Table 1 for each section presented in Figure 1.

Table 1.
Evolution of AK and OT channels’ mean width (in m).
From 1947 to 2022, the channels’ mean width globally increased (Table 1). AK downstream and mid-stream and OT width, respectively, increased by 142.9%, 75.4%, and 136%. The AK upstream is relatively stable over the 75 y. Between 1947 and 2009, the channels’ width varied sightly, decreasing in some cases (AK mid-stream and OT). We can assume that these variations fall within the margin of error.
In 1947, with a sinuosity index exceeding 1.05, channels were sinuous (Table 2). The AK downstream is the one with the highest sinuosity index (1.11), which may be due to its location in lowlands, while the other sections are in mountainous areas with narrow valley bottoms. In 2009, three of them remained sinuous (Table 2). The upstream part of the AK channel is the only one considered straight, with a sinuosity index less than 1.05. The highest indexes are for the downstream of the AK (1.10) and OT (1.07) channels. In 2022, a real shift in their sinuosity occurred, with all rates below 1.05. The AK downstream sinuosity index decreased the most, from 1.10 to 1.03 (Table 2). Figure 5 illustrates this straightening process in the AK downstream and OT. While the rivers’ paths were mainly similar in 1947 and 2009, the 2022 channels show an abrupt change.
Table 2.
Evolution of sinuosity index for the rivers AK and OT.
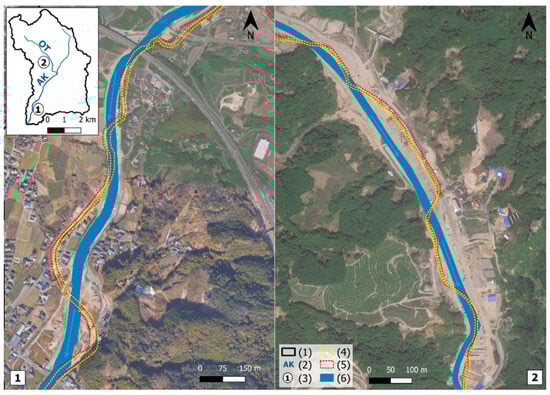
Figure 5.
Close-up of sinuosity index evolution. (1) AK watershed; (2) hydronym; (3) close-up location; (4) 1947 channel; (5) 2009 channel; (6) 2022 channel.
Calculating channel width and sinuosity evolutions allowed us to appreciate shifts induced by post-disaster reconstruction plans. By comparing 1947 and 2009, the AK watershed geometry was globally stable for 75 y. The disruption induced by the J17 crisis then forced the government to restore rivers. Instead of reconstructing identically, they decide to enlarge and straighten channels to cope with rainfall rates with a probability of occurrence of 1/50 [3]. In addition to the modification of rivers’ geometry, the government multiplied the number of erosion protection structures to limit sediment-related disasters in the area.
3.3. The Multiplication of ECSs since 2017
In addition to remodeling valley bottoms, the government added ECSs. Erosion control was valorized by governmental actors in the process of AK watershed reconstruction. Before 2017, there were 33 dams (Figure 6). Among them, 27 were managed by the MAFF and only 6 of them by the prefecture. After 2017, the central government planned the construction of 30 new sabo dams and the MAFF constructed 15 more chisan dams (Figure 6). In total, we inventoried 78 ECDs in the watershed in 2022. Between 2017 and 2022, the number of sabo dams was thus multiplied by 5.
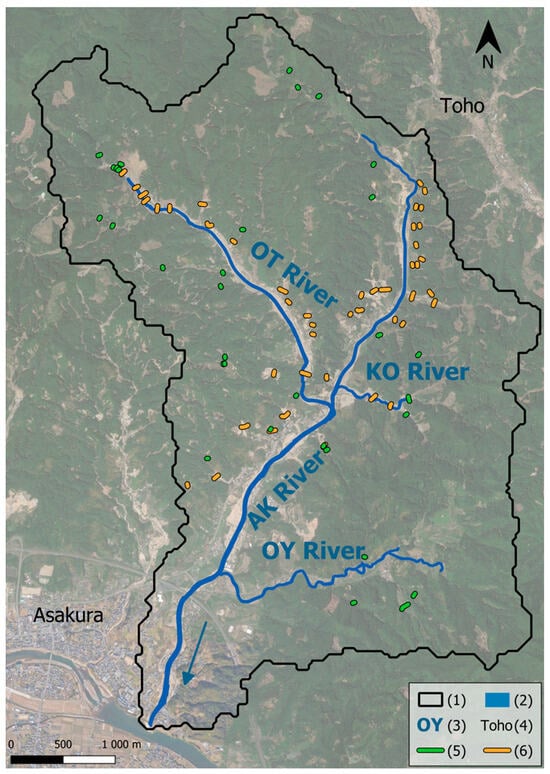
Figure 6.
ECDs constructed in the AK watershed before and after 2017. (1) AK watershed area; (2) 2022 channels; (3) hydronym; (4) toponym; (5) pre-2017 dams; (6) post-2017 dams.
ECDs are located in mountainous areas, and 92% of them were constructed in the AK or OT watersheds. New constructions are closer to valley bottoms than the pre-disaster ones (Figure 6). In the OT river, many sabo dams are at the outflow of mountainous subwatersheds [13]. Here, two main types of sabo dams were constructed: (i) closed-type dams, storing sediments, and (ii) slit dams, which catch large-scale debris and allow flow to circulate (Figure 7).
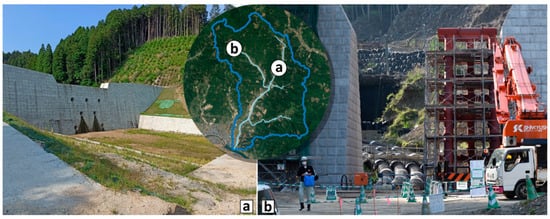
Figure 7.
Illustration of the sabo dam constructed in the AK River. (a) Closed-type sabo dam AK16, ©M. Dumont, 2022; (b) slit-type sabo dam OT15-6, ©V. Siccard, 2022.
The number of ECDs increased in the AK watershed. While they were mainly located in forested areas and constructed by the MAFF, sabo dams are now constructed outside of forested areas, sometimes in previously inhabited areas such as the upstream part of OT. In the AK mid-stream, OT, and KO rivers, they structure water flow and reduce sediment transfer coming from torrential subwatersheds. Between two dams, coffin streams replace pre-disaster channels. Thus, the J17 disaster also modified the sediment transfer management of the watershed.
4. Discussion
The J17 disaster can be considered as an LFHM hydroclimatic event. The disruption induced a different equilibrium from the previously existing one. Right after the crisis, aerial images showed a new river equilibrium with partly destructed river channels and an evolution of river style from single channels to braided ones. However, because of the necessity of reconstruction of the AK watershed, a new equilibrium was designed by the Japanese government. With the enlargement and the straightening of their channels, rivers are reaching a new balance between the pre- and post-disaster ones (Figure 8).
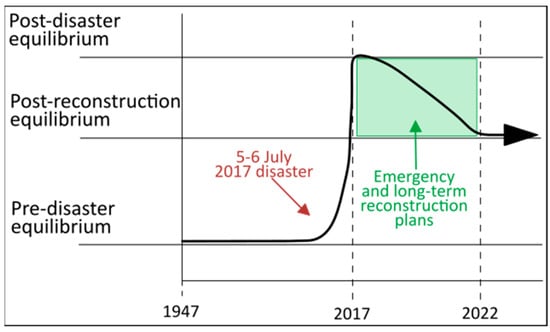
Figure 8.
Dynamic of AK watershed’s rivers. Adapted from Chorley and Kennedy (1971) [14].
5. Conclusions
After 75 y of stability, the J17 crisis disturbed AK watershed organization, which brutally reached a new equilibrium, causing structural damages and deaths. At this time, pre-disaster protection systems and river channels could not handle the magnitude of triggered hazards. After the disaster, the watershed required a large-scale reconstruction plan. Based on a new reference (1/50 probability of occurrence rainfall), the Japanese government answered the need for reconstruction with a strong engineering response, including a complete redesign of the AK watershed with enlarged and straightened channels and several erosion-control systems in mountainous areas. The new organization of the AK watershed illustrates the recurrent use of engineering methods in hydro-sedimentary-related hazards protection known as “River System Sabo”. Japan, in its own way, responds to the current concerns of politicians and civil society, who wish to protect themselves from hydroclimatic hazards, an issue that goes beyond the question of territoriality and borders with ongoing climate change.
Author Contributions
Conceptualization, M.D., G.A.-F. and C.G.; Methodology, M.D. and C.G.; Validation, M.D.; Formal Analysis, M.D.; Investigation, M.D. and C.L.; Resources, M.D. and C.L.; Data Curation, M.D.; Writing—Original Draft Preparation, M.D. and C.G.; Writing—Review & Editing, M.D., G.A.-F., C.G., C.L. and V.V.; Visualization, M.D.; Supervision, G.A.-F., C.G., C.L. and V.V.; Project Administration, M.D., C.G. and G.A.-F. All authors have read and agreed to the published version of the manuscript.
Funding
This research received no external funding.
Institutional Review Board Statement
Not applicable.
Informed Consent Statement
Not applicable.
Data Availability Statement
Created data during this research are not available in open access for the moment.
Conflicts of Interest
The authors declare no conflict of interest.
References
- Yamamoto, H.; Yamasaki, T.; Sakamoto, K.; Yamashita, N. Characteristics of heavy rainfall and disaster in northern part of Kyushu on 5 July 2017. J. Japan Soc. Nat. Disaster Sci. 2017, 36, 257–279. [Google Scholar] [CrossRef]
- Shimizu, M.; Kanai, S.; Hotta, N.; Lissak, C.; Gomez, C. Spatial Distribution of Drifted-Wood Hazard Following the July 2017 Sediment-Hazards in the Akatani River, Fukuoka Prefecture, Japan. Forum Geogr. 2020, 34, 96–111. [Google Scholar] [CrossRef]
- Technical Committee for the Rehabilitation of Erosion Control and River in Chikugo Right Bank Catchment. Report of the Technical Committee for the Rehabilitation of Erosion Control and River in Chikugo Right Bank Catchment. 2017, p. 130. Available online: http://www.qsr.mlit.go.jp/bousai_joho/H29hokubugouu/taisaku.html (accessed on 31 October 2022).
- Japan Society of Civil Engineers. Heavy Rainfall Disaster in Northern Kyushu in July 2017—Investigation Report. 2020, p. 175. Available online: https://committees.jsce.or.jp/report/node/209 (accessed on 31 October 2022).
- Geospatial Information Authority of Japan. Map and Aerial Photo Viewing Service. Available online: https://mapps.gsi.go.jp/maplibSearch.do#1 (accessed on 31 October 2022).
- Geospatial Information Authority of Japan. List of Geographical Survey Institute Tiles. Available online: https://maps.gsi.go.jp/development/ichiran.html (accessed on 31 October 2022).
- Horacio, J. River Sinuosity Index: Geomorphological Characterisation. Technical Note 2. 2014. Available online: https://europe.wetlands.org/publications/river-sinuosity-index-geomorphological-characterisation/ (accessed on 31 October 2022).
- Kyushu Regional Management Service Association. Chronological Database on Kyushu Disasters. Available online: http://saigairireki.qscpua2.com/hukuoka/ (accessed on 10 September 2022).
- Kyushu Regional Development Bureau, Ministry of Land, Infrastructure, Transport and Tourism. Tremendously Heavy Rainfall Has Occurred, Twice as Much as at Any Previously Recorded Time. 2017. Available online: http://www.qsr.mlit.go.jp/site_files/file/h29hokubugouu_panel_english.pdf (accessed on 31 October 2022).
- Department of Water Management and Land Conservation, Ministry of Land, Infrastructure, Transport and Tourism. Torrential Rainfall in Northern Kyushu in July 2017. 2017. Available online: https://www.cbr.mlit.go.jp/mie/river/conference/ryuiki/pdf/19th/19th_shiryou-08.pdf (accessed on 1 November 2022).
- Geospatial Information Authority of Japan, Orthographic Image Interpretation Map (Asakura Toho Area). 2017. Available online: https://www.gsi.go.jp/BOUSAI/H29hukuoka_ooita-heavyrain.html (accessed on 31 October 2022).
- Ministry of Land, Infrastructure, Transport and Tourism. Full-Scale Restoration of Rivers in the Akatani River Basin Carrying Out by the State on Behalf of the Prefecture (Second Phase of Delegation of Authority). 2017. Available online: https://www.qsr.mlit.go.jp/press_release/h29/bousai17120104.html (accessed on 11 September 2022).
- Kyushu Regional Development Bureau, Ministry of Land, Infrastructure, Transport and Tourism. Direct Erosion Control Project Plan. 2022. Available online: http://www.qsr.mlit.go.jp/s_top/gaiyo/2022gaiyo.html (accessed on 11 September 2022).
- Chorley, R.J.; Kennedy, B.A. Physical Geography: A Systems Approach; Prentice-Hall: London, UK, 1971; ISBN 978-0-13-669028-3. [Google Scholar]
Disclaimer/Publisher’s Note: The statements, opinions and data contained in all publications are solely those of the individual author(s) and contributor(s) and not of MDPI and/or the editor(s). MDPI and/or the editor(s) disclaim responsibility for any injury to people or property resulting from any ideas, methods, instructions or products referred to in the content. |
© 2023 by the authors. Licensee MDPI, Basel, Switzerland. This article is an open access article distributed under the terms and conditions of the Creative Commons Attribution (CC BY) license (https://creativecommons.org/licenses/by/4.0/).