Classification of Maize in Complex Smallholder Farming Systems Using UAV Imagery
by
 , , and
Ola Hall
1,* ,
,
Sigrun Dahlin
2,
Håkan Marstorp
2,
Maria Francisca Archila Bustos
1,
Ingrid Öborn
3,4,5 and
Magnus Jirström
1 1
Department of Human Geography, Lund University, 223 00 Lund, Sweden
2
Department of Soil and Environment, Swedish University of Agricultural Sciences, 750 07 Uppsala, Sweden
3
Department of Crop Production Ecology, Swedish University of Agricultural Sciences, 750 07 Uppsala, Sweden
4
World Agroforestry Centre, P.O. Box 161, Bogor 16001,West Java, Indonesia
5
Center for International Forestry Research, Sindang Barang, Bogor 16115, Indonesia
*
Author to whom correspondence should be addressed.
Drones 2018, 2(3), 22; https://doi.org/10.3390/drones2030022
Submission received: 5 June 2018
/
Revised: 19 June 2018
/
Accepted: 19 June 2018
/
Published: 22 June 2018
Abstract
:Yield estimates and yield gap analysis are important for identifying poor agricultural productivity. Remote sensing holds great promise for measuring yield and thus determining yield gaps. Farming systems in sub-Saharan Africa (SSA) are commonly characterized by small field size, intercropping, different crop species with similar phenologies, and sometimes high cloud frequency during the growing season, all of which pose real challenges to remote sensing. Here, an unmanned aerial vehicle (UAV) system based on a quadcopter equipped with two consumer-grade cameras was used for the delineation and classification of maize plants on smallholder farms in Ghana. Object-oriented image classification methods were applied to the imagery, combined with measures of image texture and intensity, hue, and saturation (IHS), in order to achieve delineation. It was found that the inclusion of a near-infrared (NIR) channel and red–green–blue (RGB) spectra, in combination with texture or IHS, increased the classification accuracy for both single and mosaic images to above 94%. Thus, the system proved suitable for delineating and classifying maize using RGB and NIR imagery and calculating the vegetation fraction, an important parameter in producing yield estimates for heterogeneous smallholder farming systems.
1. Introduction
Agricultural productivity and yields worldwide must be increased in order to alleviate current food insecurity and future challenges due to projected population and income growth [1,2]. Methods are therefore needed to assess crop yields and yield gaps on a large scale, in order to reveal factors limiting productivity in the real world outside experimental stations.
Remote sensing holds great promise for estimating crop yields and thus aiding in estimating yield gaps [3,4]. However, a major source of error in yield estimation by remote sensing is misclassification of crop type [4]. This type of error is particularly problematic where different crops with similar phenologies are grown together or intercropped, both of which are common in sub-Saharan Africa (SSA). Another problem is distinguishing between weeds and crop plants [5]. An increased spatial and spectral resolution in remote sensing is one way to rectify these problems. Satellite images are now available at a sub-meter resolution and contain several spectral bands useful for crop type identification. However, the increased spatial resolution is accompanied by decreased temporal resolution. The revisit time is sometimes so long that entire growing seasons are left without meaningful recorded images due to cloud cover, haze, or other unfavorable factors, especially in the humid and sub-humid tropics. The lack of well-timed imagery is particularly problematic for yield estimate analysis, where accurate imaging of vegetation development stages is crucial [6].
Unmanned aerial vehicles (UAVs) offer a solution, as they can be maneuvered at low altitudes below cloud cover to acquire sub-decimeter resolution imagery. Despite some constraints, UAV systems have the potential to bridge the gap between ground-based surveys and conventional remotely sensed data [7]. Pixel-based analysis of the very high resolution (VHR) data from UAV imagery is demanding in terms of time and computer capacity and also presents difficulties when analyzing larger areas covered by several images with partial overlap. This has led to the development of orthorectification and mosaicking methods employing object-based image analysis (OBIA), which emulates human visual interpretation by shifting the focus from pixels to objects as the basic unit [8,9]. The emergence of OBIA methods has been accompanied by the development of off-the-shelf commercial software that makes the analysis possible without programming skills.
The aims of the present pilot study were (i) to develop a geographic information system (GIS) processing system for identifying, classifying, and delineating maize plants in complex cropping systems; and (ii) to evaluate the usefulness of the system in vegetation fraction analysis and yield estimates in heterogeneous farming systems in the maize-cassava belt in Ghana.
2. Materials and Methods
2.1. Study Area
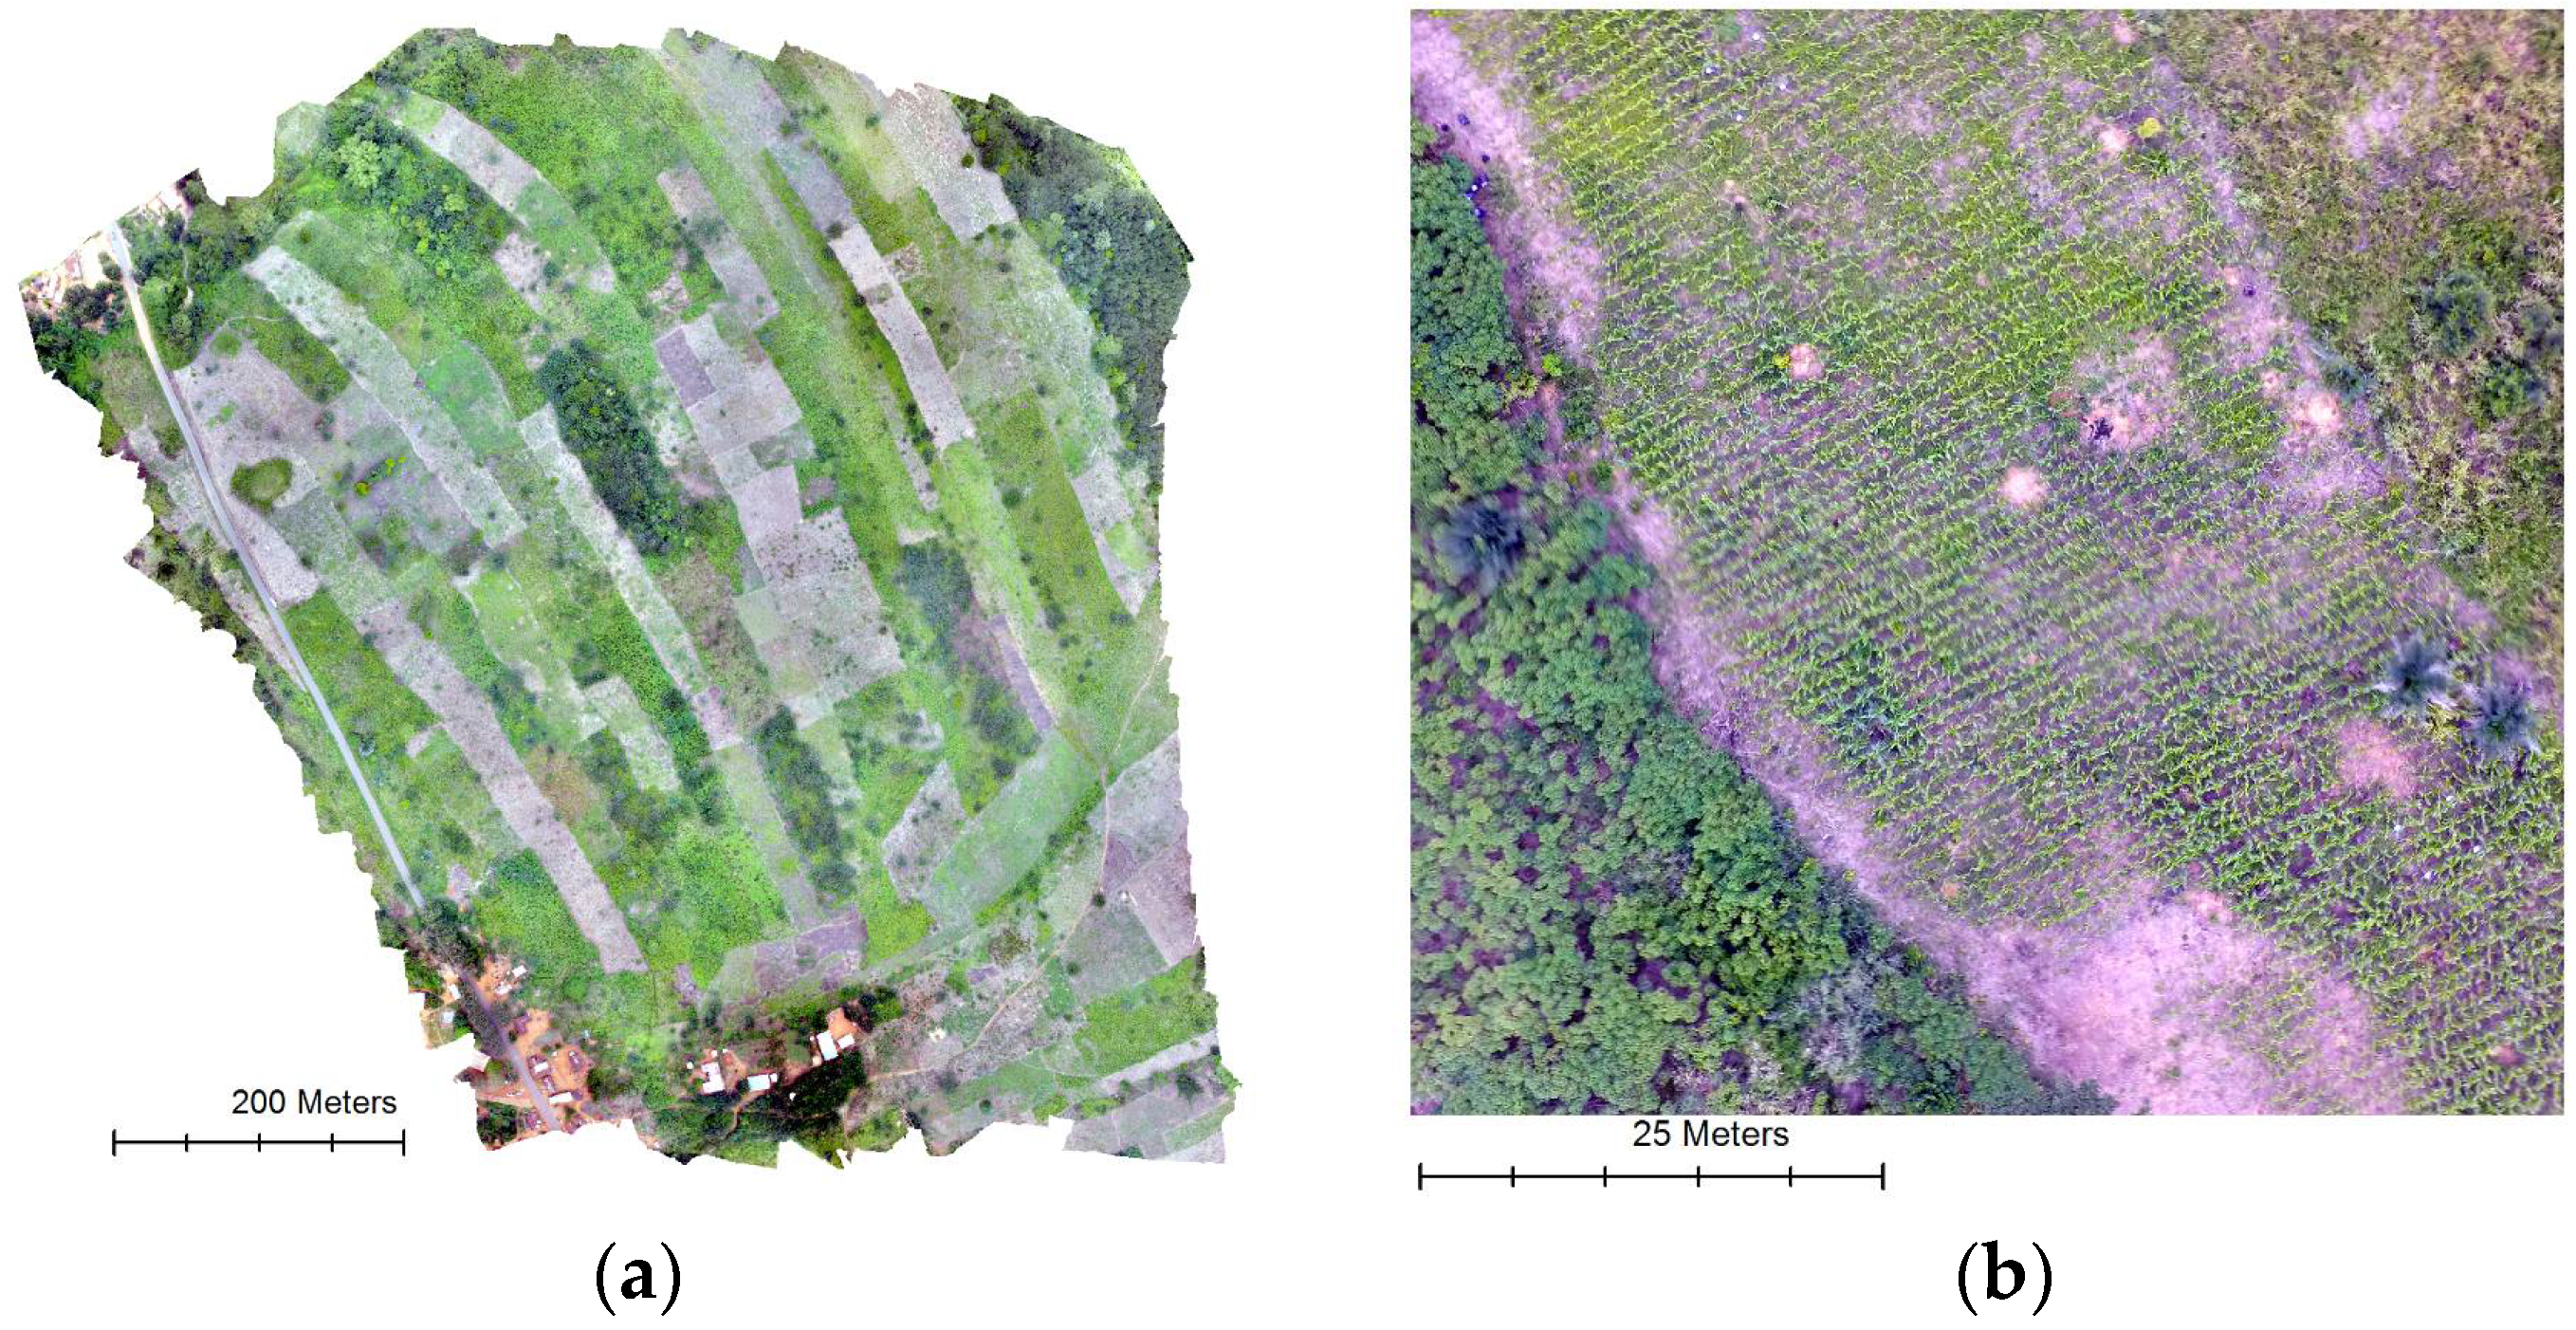
Akatiwia village (N 6.28178, W 0.12937; ~220 m.a.s.l.) is located in Eastern Region, Ghana. The weather pattern is clearly bimodal, with total annual precipitation of around 1200 mm and annual mean minimum and mean maximum temperatures of 24 °C and 27 °C, respectively. Soils in the region are highly variable, with mostly Leptosols on hillsides and Acrisols and Planosols on plains. Farmers cultivate an average of two hectares, with the most important field crops being maize and cassava, frequently intercropped with legumes and/or non-legumes [10]. Herbicides are used for land preparation and subsequent weed management, leading to only moderate weed pressure. UAV imagery for the study area was acquired between 29 September and 1 October 2015. Images of a maize field with patches of dense, mainly graminaceous weeds and with cassava as the neighboring crop were chosen for data analysis. The maize in this field was at development stage V7 [11,12]. A top-dressing of urea had been applied but, due to dry weather, the fertilizer largely remained on the soil surface. The nitrogen status of the maize was variable, as indicated by paler and smaller plants at one end of the field, and some plants in the field showed symptoms of potassium deficiency.
2.2. Image Acquisition
The platform used was a fully autonomous global positioning system (GPS)-guided unmanned aircraft with a pixhawk GPS flight control. The UAV flew to pre-determined waypoints according to flight plans designed using the Ardupilot Mission planner software. It carried two sets of GoPRO Hero4 Silver 12 megapixel cameras (GoPro Inc., San Mateo, CA, USA). One camera set was modified to record the normally blocked near-infrared (NIR) wavelengths into the red channel. This was done by unscrewing the 5.4 mm 1/2.3” IR CUT MP-10 lens and replacing it with a 5.4 mm 1/2.3” IR MP-10 lens (both lenses, GoPro Inc., San Mateo, CA, USA). The bands for these GoPRO-cameras are typically not spectrally well defined. The spectral sensitivity can be derived from laboratory measurements with monochromatic light sources (Lebourgeois, Bégué et al., 2008); however, such testing was not performed for this particular study.
The other camera was left unmodified, recording red, green, and blue (RGB) light. Both cameras were also fitted with non-distortion lenses that change the characteristic fisheye view of the GoPRO-cameras to normal view. The cameras were not GPS-enabled. Instead, time-synchronization between the camera and the internal computer clock was used for geotagging images. Images were acquired with an 80% side overlap and 50% forward overlap, at a flight speed of approximately 12 m/s and approximately 100 m altitude. The altitude was set to be safely below Ghana UAV regulations (max 121 m, 400 feet), which also helped to produce datasets which were not too large. In addition, the system was not equipped to track or follow changes in terrain so lower flight altitudes were avoided. The total image footprint was approximately 110 m wide and 70 m tall. Images from these flights were mosaicked into a single image and orthorectified with 3 cm pixel resolution. Some individual images were also orthorectified and used for validation and training of algorithms.
2.3. Image Analysis
Image analysis was performed on both the mosaic and single images (Figure 1). The purpose of this was to evaluate the effect of mosaicking on classification results, as the accuracy was expected to decrease due to distortions introduced by the mosaicking process. The broad spectral bands in the GoPRO consumer-grade cameras were enhanced by the addition of texture measures and intensity, hue, and saturation (IHS) transform. Texture measures were used to quantify perceived structures (e.g., contrast) in the images and provide information on spatial arrangement of colors and intensities [13]. The IHS-transform process was used to separate image data into intensity (which refers to total brightness), hue (which refers to dominant color or wavelength), and saturation (which refers to the purity of colors) [14], in order to add information and increase the accuracy in segmentation and classification.
The set-up was essentially as described by [7], except for the addition of an NIR band and the exclusion of some of the gray-level co-occurrence matrices (GLCM) texture bands, which were reported to provide little information [15]. The pre-selection reduced computer calculation times. The following band combinations were evaluated: RGB, RGB + IHS, RGB + texture, RGB + IHS + texture and NIR-RGB, NIR-G-B + IHS, NIR-GB + texture and NIR-GB + IHS + texture. The analysis was performed with Ecognition Developer 9.3 (2015, Trimble Ltd., San Diego, CA, USA), an image analysis software specifically developed for handling VHR images. The processing system involved three steps: multiresolution segmentation, image classification, and accuracy assessment.
A multiresolution segmentation algorithm was applied to merge pixels into image objects [16]. This was done by combining color and shape, where color homogeneity was based on the standard deviation of the spectral colors and shape homogeneity was based on deviations in compact shape. Parameterization involved defining the relative weighting scheme for shape and compactness criteria. Several combinations were tested, following the approach in [17]. A third parameter was used to control average image object size and was derived following the concept of local variance defined by [18]. The final setting thus became: scale 25, shape 0.3, and compactness 0.5. This produced the visually best objects. The output from this step was homogeneous image-objects of different sizes.
Accordingly, image classification was performed on image-objects as they are often more useful for classification than pixels because they can be classified based on texture, shape, or some other contextual information. The classifier algorithm used was a support vector machine (SVM) shown to have high robustness and accuracy [19,20,21]. The SVM was trained with a sample size of 215, where samples were collected as vector points based on visual inspection of UAV imagery. The classes of interest were maize, cassava, soil, and undergrowth, where the latter was mainly weeds.
The accuracy assessment was performed by using the best high-resolution imagery for each section. A validation dataset was assembled from visual identification of the classes of interest. Samples were picked to account for as much of the class variation as possible. As a rule-of-thumb, 10 times the number of classes is recommended [22]. Here, more than 50 validation points per class were used. Overall accuracy was calculated by dividing the total number of correctly classified objects by the total number of objects in the error matrix.
3. Results
3.1. Classification Accuracy
For single image RGB, the visual impression was satisfactory (Figure 2) and was complemented with a quantitative evaluation. However, images produced from the RGB camera alone were not sufficient to resolve the four classes of interest, with the exception of “soil”. As can be seen in Figure 1, soil had a very characteristic color that was handled well by the classifier algorithm. The best overall accuracy (OA), 89%, and Kappa index of agreement (KIA), 85%, was achieved when a single RGB image was combined with IHS and texture. The best user accuracy (UA) for maize was achieved when RGB was combined with IHS (84%) and the best producer accuracy (PA) when RGB was combined with IHS and texture (97%). Maize was sometimes confused with cassava and sometimes with undergrowth.
The substitution of NIR into the red channel made a strong addition to the classification accuracy in general by, on average, 10%. The accuracy increased only slightly with the addition of IHS and texture. The best KIA and OA values were achieved with NIR and texture, and NIR, texture, and IHS. The best UA was achieved by the latter combination, with undergrowth in particular gaining better resolution (UA = 89–94%).
The RGB images organized into a mosaic were expected to perform less well than single RGB images and, according to the KIA and OA values obtained, this was essentially the case. Between-class confusion was similar with the exception of cassava, which had a lower UA value for the mosaic compared with the single RGB image. The best OA (85%) and KIA (80%) were achieved for the mosaic based on RGB, IHS, and texture.
The best OA (94%) and KIA (92%) were achieved with inclusion of NIR, IHS, and texture or just by adding texture to the NIR-based mosaic. The UA was relatively high for both combinations and the main issue was resolution of undergrowth. The PA was also increased when IHS and texture were added.
3.2. Maize Objects
Maize objects in a 550 m2 portion of the maize field were extracted using the best single image combination for further analysis (Figure 3). As can be seen in the image, the linear planting structure was clearly visible in the diagonal pattern. It was also possible to see that the maize objects visually corresponded well with the maize plants (Figure 3). Some of the maize plants were over-segmented, meaning that a plant was formed by two or more image-objects. The vegetation fraction (maize) in this field was estimated to be 0.32/m2.
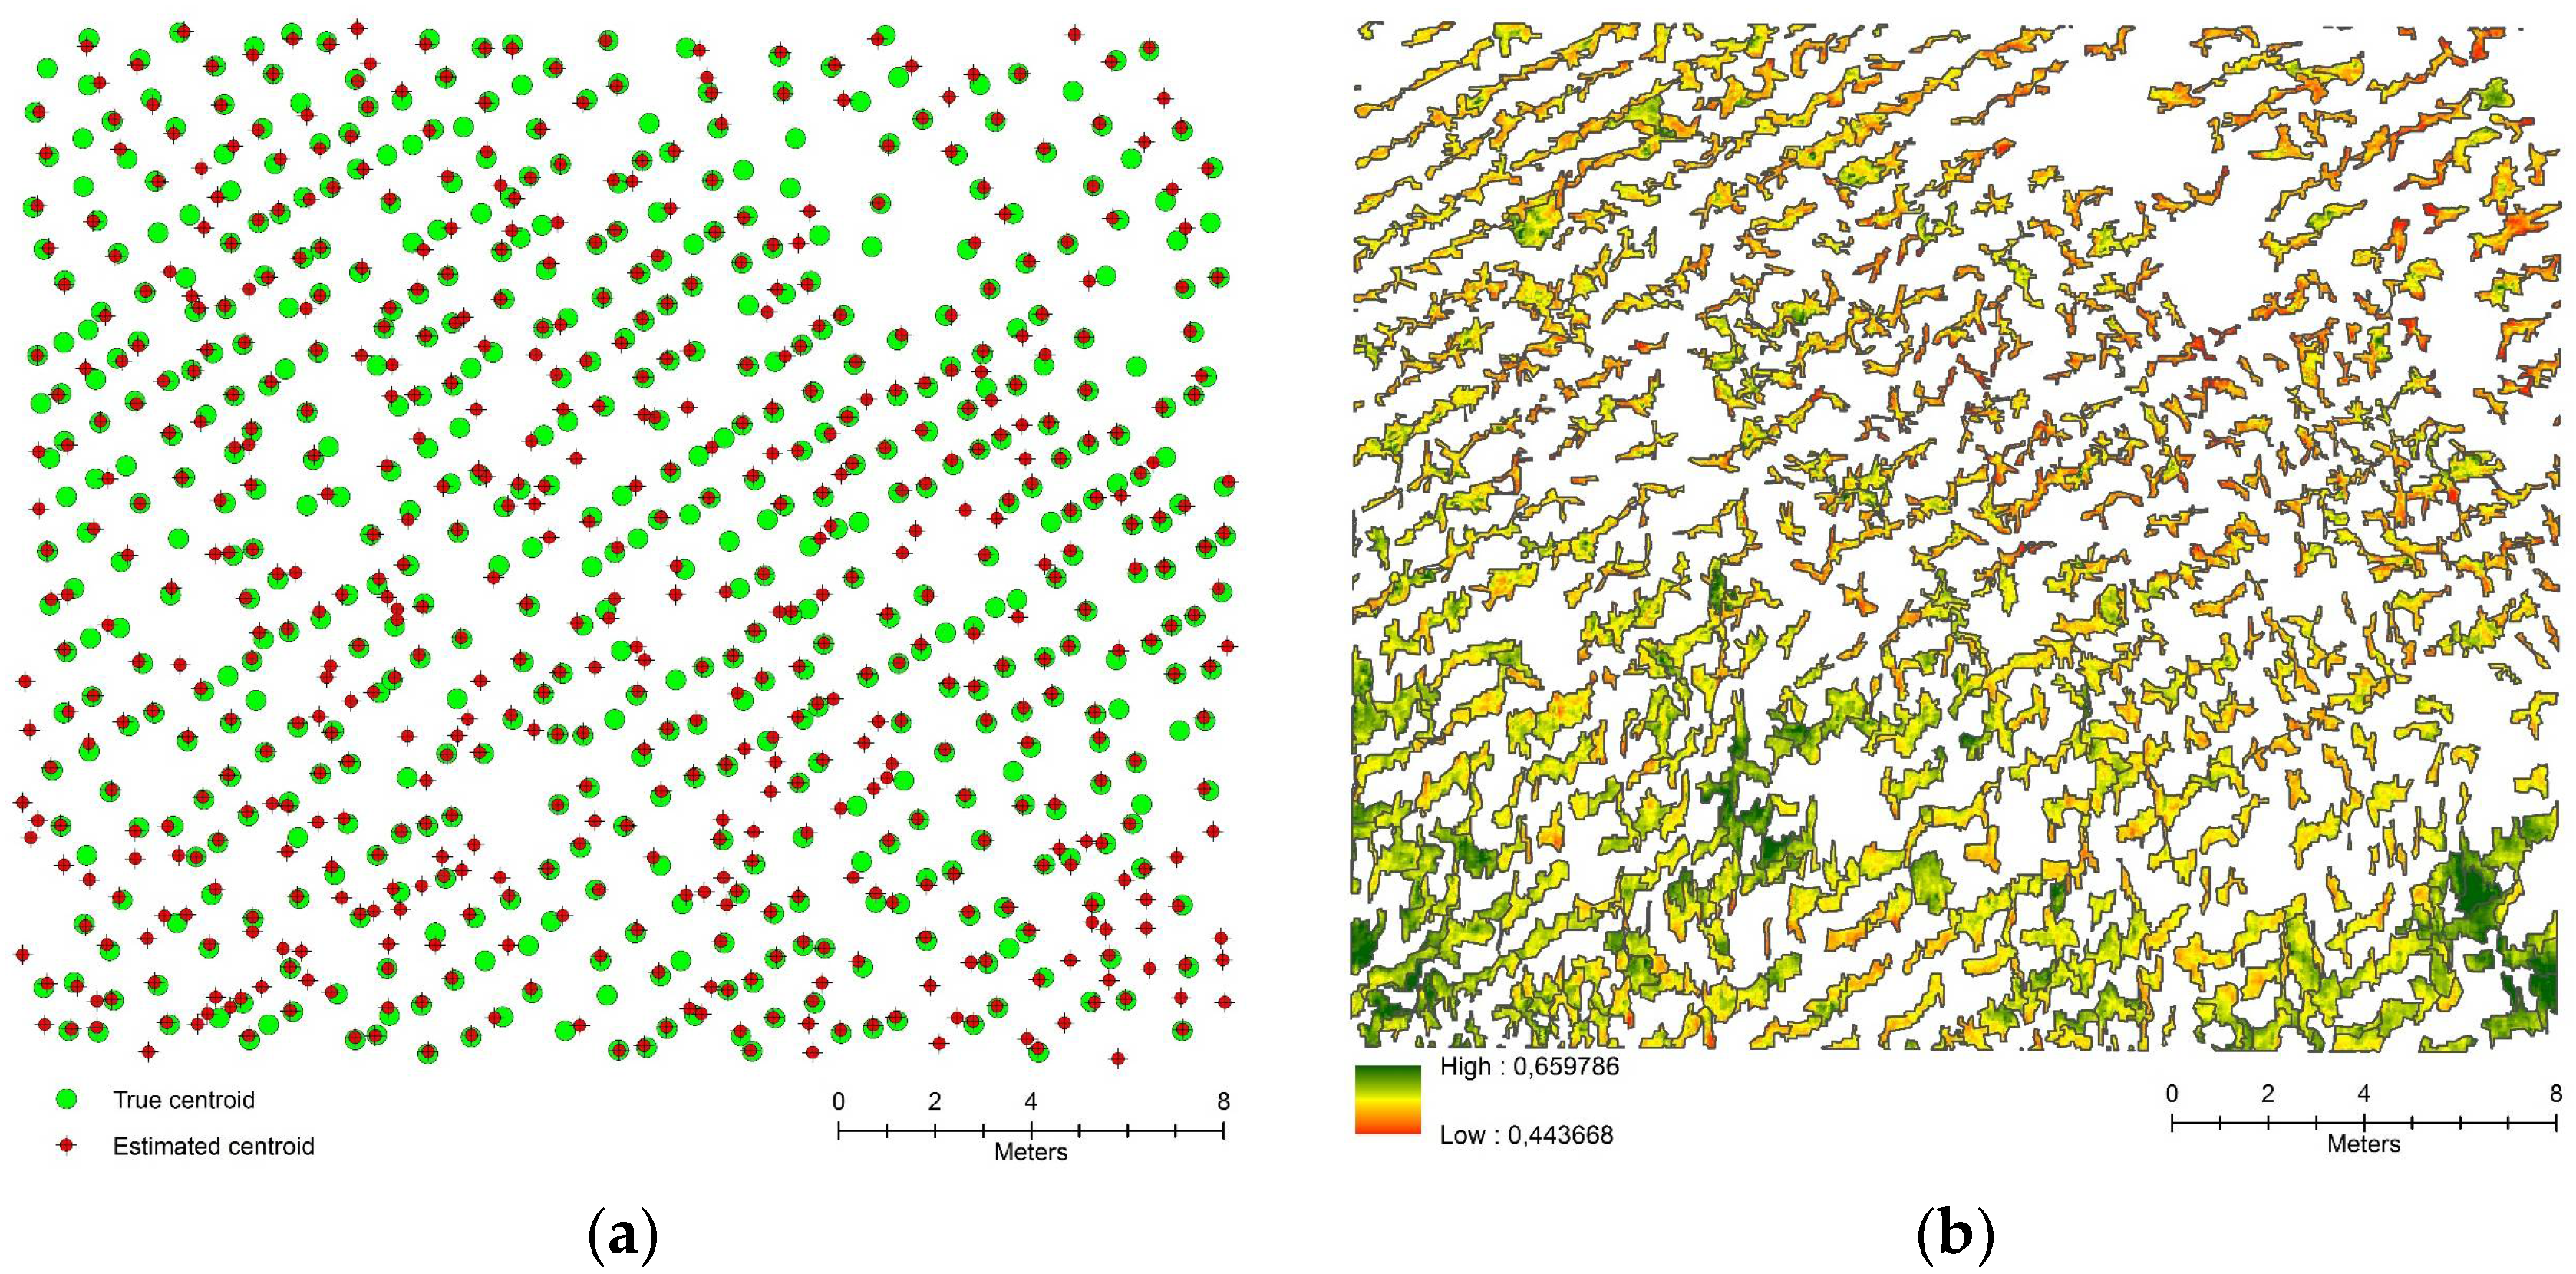
To assess the performance of the image analysis system developed, the center points (centroids) were visually determined for each maize plant in the maize field and the centroid of each maize object was then automatically estimated (Figure 4a). It is clear that some overestimation of objects occurred, particularly in the lower portion of the field. The number of maize plants was counted to be 558, but 663 were automatically detected. The main reason for this was probably the blurring that is visible in the lower section of Figure 3. It can also be seen that the maize objects in Figure 3a (lower part) are slightly larger for the same reason.
4. Discussion
The classification accuracies produced using the system developed in this pilot study were similar to or higher than those in other studies using UAV imagery and object-oriented approaches [7,23]. The inclusion of an NIR channel clearly increased the classification accuracy, by as much as 10% both for single images and mosaics. This is in accordance with how green vegetation strongly reflects NIR light [24]. RGB imagery alone performed rather well, but it needs to be complemented with derivatives such as texture calculations or the IHS-transform, as pointed out by [7].
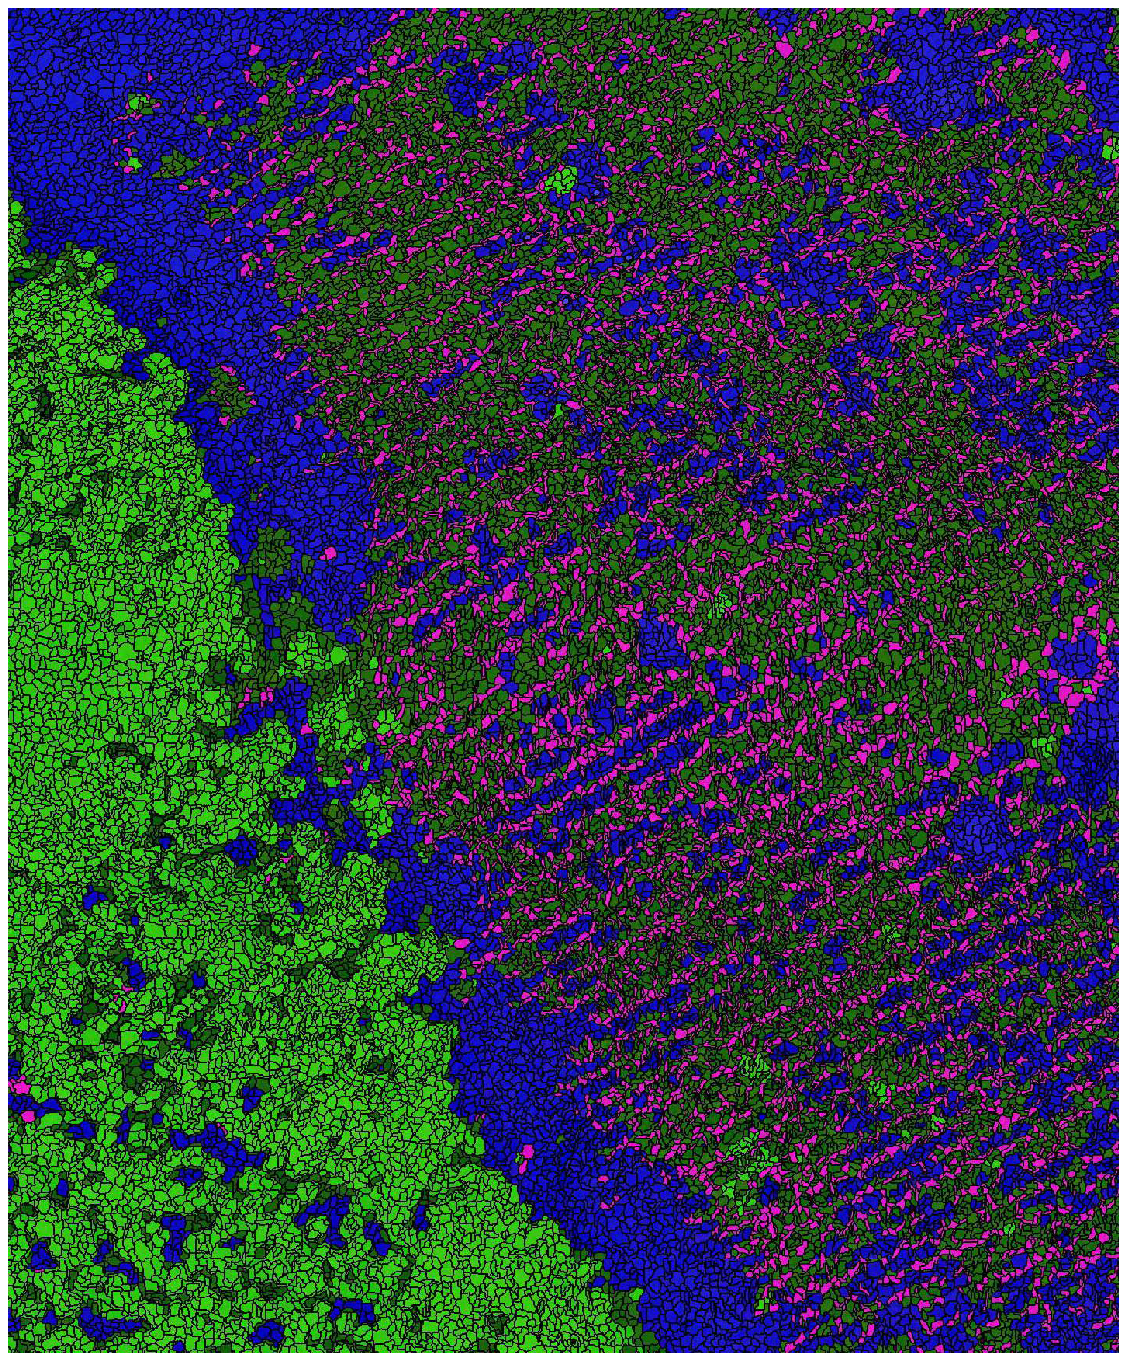
Mosaic images increased the spatial coverage but decreased the classification accuracy. The mosaic combination that performed best was NIR-GB with the inclusion of IHS and texture, with an overall accuracy of 94%. This can be compared to single imagery classification derived from the combination of NIR-GB and texture, for which OA was 98%. The general problem for the classifier to resolve was the confusion between undergrowth (weeds) and maize plants. These grew closely together and had a similar color, but weeds usually formed large patches and shared few of the structural features of maize and could therefore be successfully delineated and separated from the maize (Figure 2).
Overall, this meant that maize plants could be automatically segmented and classified into meaningful geographic objects, and the important vegetation fraction could thus be calculated. The inclusion of a blue-notch filter in the cameras compensated for the lack of an NIR channel and increased the classification accuracy. Importantly, however, it also enabled calculation of vegetation indices (Figure 4b). Vegetation index values, in combination with vegetation fraction values, are essential inputs for estimating biomass and yields [4].
Automatic counting overestimated the number of plants by 15%. This was mostly due to the over-segmentation of maize plants and was affected by, e.g., image quality, but also by the row spacing used in maize seeding. The difficulties in automatic counting of crop plants can therefore be expected to increase over the growing season up to maximum crop coverage and with increasing crop density. However, that is not a problem for vegetation fraction calculations, since the plant itself can be identified and classified correctly.
The system presented here is rather simplistic, particularly in terms of the imaging system. Nevertheless, it was found that maize, which is an important crop in large parts of SSA, could be delineated and classified with high accuracy using the system, thus rendering more sophisticated sensors unnecessary. The limitation of the system is mainly the lack of an upward-pointed sensor that could measure incoming light and thus enable calculations of true surface reflectance. This limits the use for time-series analysis of imagery and makes images site-specific. However, setting out calibration plates on the ground for each mission is a simple and feasible solution to overcome this limitation [25].
5. Conclusions
A system based on UAV imagery with the inclusion of RGB and NIR spectra was developed and successfully used for delineating and classifying maize. The system can be applied, e.g., for the calculation of vegetation fraction, an important input for yield estimates for heterogeneous farming systems.
Author Contributions
Conceptualization, O.H.; Methodology, O.H., S.D.; Software, O.H.; Validation, O.H., S.D., M.F.A.B., H.M. and I.Ö.; Formal Analysis, O.H.; Investigation, O.H.; Resources, S.D., H.M. and I.Ö.; Writing-Original Draft Preparation, O.H.; Writing-Review & Editing, S.D., H.M., M.F.A.B. and I.Ö.; Visualization, O.H.; Project Administration, I.Ö. and M.J.; Funding Acquisition, I.Ö. and M.J.
Funding
This work was funded by the Swedish Research Council for Environment, Agricultural Sciences and Spatial Planning (Formas) and the Swedish Research Council and the Crafoord Foundation.
Acknowledgments
The authors thank the Swedish Research Council, FORMAS and the Crafoord foundation for funding the project. We are very grateful for the thorough and helpful comments from the reviewers of the manuscript.
Conflicts of Interest
The authors declare no conflict of interest. The funders had no role in the design of the study; in the collection, analyses, or interpretation of data; in the writing of the manuscript, and in the decision to publish the results.
References
- Foley, J.A.; Ramankutty, N.; Brauman, K.A.; Cassidy, E.S.; Gerber, J.S.; Johnston, M.; Mueller, N.D.; O’Connell, C.; Ray, D.K.; West, P.C.; et al. Solutions for a cultivated planet. Nature 2011, 478, 337–342. [Google Scholar] [CrossRef] [PubMed] [Green Version]
- Godfray, H.C.J.; Beddington, J.R.; Crute, I.R.; Haddad, L.; Lawrence, D.; Muir, J.F.; Pretty, J.; Robinson, S.; Thomas, S.M.; Toulmin, C. Food Security: The Challenge of Feeding 9 Billion People. Science 2010, 327, 812–818. [Google Scholar] [CrossRef] [PubMed] [Green Version]
- Moulin, S.; Bondeau, A.; Delecolle, R. Combining agricultural crop models and satellite observations: From field to regional scales. Int. J. Remote Sens. 1998, 19, 1021–1036. [Google Scholar] [CrossRef]
- Lobell, D.B. The use of satellite data for crop yield gap analysis. Field Crop. Res. 2013, 143, 56–64. [Google Scholar] [CrossRef]
- Torres-Sánchez, J.; Peña, J.; De Castro, A.; López-Granados, F. Multi-temporal mapping of the vegetation fraction in early-season wheat fields using images from UAV. Comput. Electron. Agric. 2014, 103, 104–113. [Google Scholar] [CrossRef] [Green Version]
- Atzberger, C. Advances in remote sensing of agriculture: Context description, existing operational monitoring systems and major information needs. Remote Sens. 2013, 5, 949–981. [Google Scholar] [CrossRef]
- Laliberte, A.S.; Rango, A. Incorporation of texture, intensity, hue, and saturation for rangeland monitoring with unmanned aircraft imagery. In Proceedings of the The International Archives of the Photogrammetry, Remote Sensing, and Spatial Information Sciences, Calgary, AB, Canada, 5–8 August 2008. [Google Scholar]
- Hay, G.J.; Castilla, G. Object-based image analysis: Strengths, weaknesses, opportunities and threats (SWOT). In Proceedings of the 1st International Conference on Object-based Image Analysis (OBIA 2006), Salzburg, Austria, 4–5 July 2006. [Google Scholar]
- Hall, O.; Hay, G.J. A multiscale object-specific approach to digital change detection. Int. J. Appl. Earth Obs. Geoinf. 2003, 4, 311–327. [Google Scholar] [CrossRef]
- Dzanku, F.; Sarpong, D. Agricultural Diversification, Food Self-Sufficiency and Food Security in Ghana–the Role of Infrastructure and Institutions. In African Smallholders: Food Crops, Markets and Policy; CABI: Oxfordshire, UK, 2010; pp. 189–213. [Google Scholar]
- O’Keeffe, K. Maize Growth & Development; NSW Department of Primary Industries: Sydney, Australia, 2009.
- Colless, J.M. Maize Growing; NSW Agriculture: Orange, Australia, 1992.
- Haralick, R.M. Statistical and structural approaches to texture. Proc. IEEE 1979, 67, 786–804. [Google Scholar] [CrossRef]
- Koutsias, N.; Karteris, M.; Chuvico, E. The use of intensity-hue-saturation transformation of Landsat-5 Thematic Mapper data for burned land mapping. Photogramm. Eng. Remote Sens. 2000, 66, 829–840. [Google Scholar]
- Laliberte, A.S.; Rango, A. Texture and scale in object-based analysis of subdecimeter resolution unmanned aerial vehicle (UAV) imagery. IEEE Trans. Geosci. Remote Sens. 2009, 47, 761–770. [Google Scholar] [CrossRef]
- Benz, U.C.; Hofmann, P.; Willhauck, G.; Lingenfelder, I.; Heynen, M. Multi-resolution, object-oriented fuzzy analysis of remote sensing data for GIS-ready information. ISPRS J. Photogramm. Remote Sens. 2004, 58, 239–258. [Google Scholar] [CrossRef] [Green Version]
- Baatz, M.; Schäpe, A. Multiresolution Segmentation: An Optimization Approach for High Quality Multi-Scale Image Segmentation; Herbert Wichmann Verlag: Berlin, Germany, 2000; Volume 58, pp. 12–23. [Google Scholar]
- Woodcock, C.E.; Strahler, A.H. The factor of scale in remote sensing. Remote sens. Environ. 1987, 21, 311–332. [Google Scholar] [CrossRef]
- Tzotsos, A.; Argialas, D. Support vector machine classification for object-based image analysis. In Object-Based Image Analysis; Springer: Berlin, Germany, 2008; pp. 663–677. [Google Scholar]
- Huang, C.; Davis, L.; Townshend, J. An assessment of support vector machines for land cover classification. Int. J. Remote Sens. 2002, 23, 725–749. [Google Scholar] [CrossRef]
- Foody, G.M.; Mathur, A. A relative evaluation of multiclass image classification by support vector machines. IEEE Trans. Geosci. Remote Sens. 2004, 42, 1335–1343. [Google Scholar] [CrossRef] [Green Version]
- Congalton, R.G. A review of assessing the accuracy of classifications of remotely sensed data. Remote Sens. Environ. 1991, 37, 35–46. [Google Scholar] [CrossRef]
- Laliberte, A.S.; Goforth, M.A.; Steele, C.M.; Rango, A. Multispectral remote sensing from unmanned aircraft: Image processing workflows and applications for rangeland environments. Remote Sens. 2011, 3, 2529–2551. [Google Scholar] [CrossRef]
- Mather, P.M. Computer Processing of Remotely Sensed Data; John Wiley & Sons: New York, NY, USA, 1987; 111p. [Google Scholar]
- Jensen, A.; Clemens, S.R.; McKee, M.; Zaman, B. Retrieval of Spectral Reflectance of High Resolution Multispectral Imagery Acquired with an Autonomous Unmanned Aerial Vehicle. Photogramm. Eng. Remote Sens. 2014, 80, 1139–1150. [Google Scholar] [CrossRef]
Figure 1.
Red–green–blue (RGB) mosaic of the study area (a); Single image of a field with mainly maize in the center, cassava to the left, and several patches of bare soil (b).
Figure 1.
Red–green–blue (RGB) mosaic of the study area (a); Single image of a field with mainly maize in the center, cassava to the left, and several patches of bare soil (b).

Figure 2.
Output from classification. Light green = cassava, dark green = undergrowth (weeds), blue = soil and pink = maize.
Figure 2.
Output from classification. Light green = cassava, dark green = undergrowth (weeds), blue = soil and pink = maize.

Figure 3.
Maize objects (grey) isolated from other objects (a); red–green–blue (RGB) image for comparison, where purple is the soil background, which is clearly visible at this stage of maize development (b). Note how the blurring (green) observed in Figure 3b translates into larger maize objects in Figure 3a.
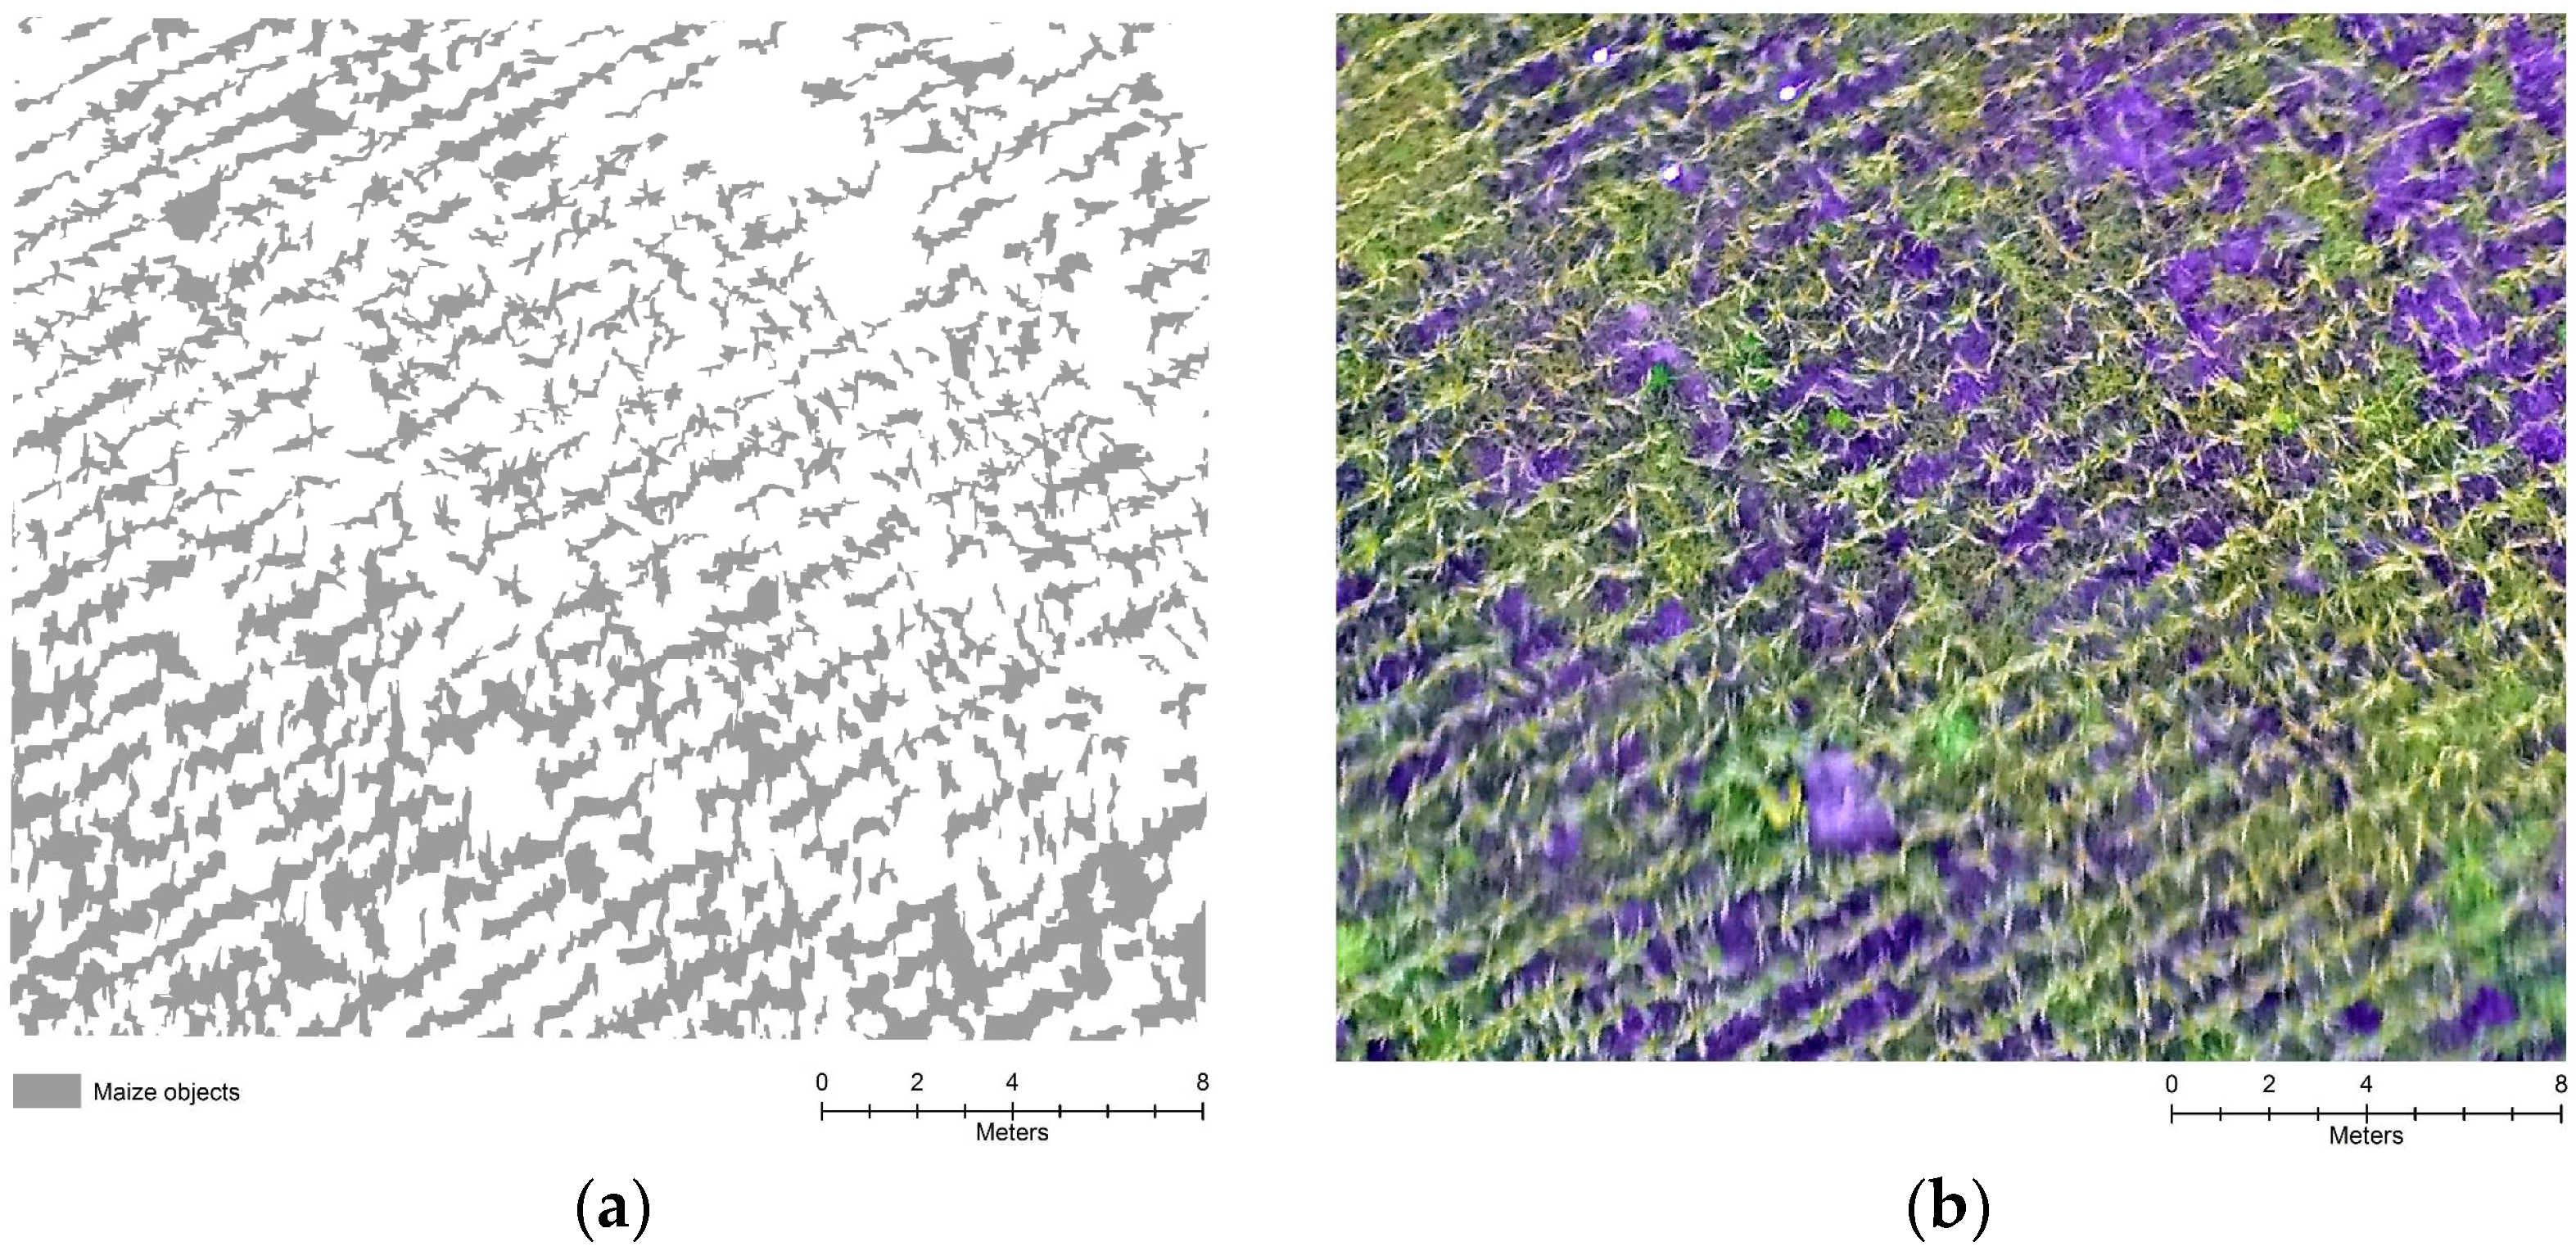
Figure 4.
Comparison between true maize plant centroids and estimated centroids (a); normalized difference vegetation index (NDVI) calculated and superimposed for all maize objects (b).
Figure 4.
Comparison between true maize plant centroids and estimated centroids (a); normalized difference vegetation index (NDVI) calculated and superimposed for all maize objects (b).

© 2018 by the authors. Licensee MDPI, Basel, Switzerland. This article is an open access article distributed under the terms and conditions of the Creative Commons Attribution (CC BY) license (http://creativecommons.org/licenses/by/4.0/).
Share and Cite
MDPI and ACS Style
Hall, O.; Dahlin, S.; Marstorp, H.; Archila Bustos, M.F.; Öborn, I.; Jirström, M. Classification of Maize in Complex Smallholder Farming Systems Using UAV Imagery. Drones 2018, 2, 22. https://doi.org/10.3390/drones2030022
AMA Style
Hall O, Dahlin S, Marstorp H, Archila Bustos MF, Öborn I, Jirström M. Classification of Maize in Complex Smallholder Farming Systems Using UAV Imagery. Drones. 2018; 2(3):22. https://doi.org/10.3390/drones2030022
Chicago/Turabian StyleHall, Ola, Sigrun Dahlin, Håkan Marstorp, Maria Francisca Archila Bustos, Ingrid Öborn, and Magnus Jirström. 2018. "Classification of Maize in Complex Smallholder Farming Systems Using UAV Imagery" Drones 2, no. 3: 22. https://doi.org/10.3390/drones2030022