Article

An Efficient Mobility Model for Improving Transmissions in Multi-UAVs Enabled WSNs

by
Mohd. Abuzar Sayeed
*,† and
Rajesh Kumar
Computer Science and Engineering, Thapar Institute of Engineering and Technology (TIET), Patiala 147004, Punjab, India
*
Author to whom correspondence should be addressed.
Drones 2018, 2(3), 31; https://doi.org/10.3390/drones2030031
Submission received: 23 July 2018 / Revised: 23 August 2018 / Accepted: 28 August 2018 / Published: 1 September 2018
(This article belongs to the Special Issue Advances in Drone Communications, State-of-the-Art and Architectures)

Abstract

:
Multi-Unmanned Aerial Vehicle (UAV) enabled Wireless Sensor Networks (WSNs) provide a wide range of applications, covering civilian and military expeditions along with geographical navigation, control, and reconnaissance. The coordinated networks formed between the UAVs and the WSNs help in enhancing the issues related to quality as well as coverage. The overall coverage issues result in starvation as an effect of long waiting time for the nodes, while forwarding the traffic. The coverage problem can be resolved by an intelligent choice of UAV way-points. Therefore, a specialized UAV mobility model is required which takes into account the topological structure as well as the importance of strategic locations to fix UAV way-points and decide the data transmission paradigm. To resolve this problem, a novel mobility model is proposed, which takes into account the attraction factor for setting up the way-points for UAV movements. The model is capable of deciding between the locations which result in more coverage, increased throughput with lesser number of UAVs employed, as justified by the simulation results and comparative evaluations.

1. Introduction

Unmanned aerial vehicles (UAVs) have shown tremendous growth, both in the areas of research and application. UAVs are capable of supporting a wide range of civilian and military applications as a result of their flexible movements and ease of configurations [1,2]. UAVs can further be deployed to form collaborative networks with the ground nodes. The cooperation between ground and aerial nodes has resulted in significant gains in data dissemination, monitoring, and control over strategic locations. UAVs also prove significant when it comes to data gathering from inaccessible locations. One such case is autonomous networking where UAVs help with raising the problem of coverage, failures, limiting guidance and dead nodes by acting as supervisors [3]. Efficient and intelligent surveying is one of the key aspects of UAV networks. Nature-based algorithms help in performing cooperative rendezvous and efficient task allocation for coordinated UAV networks [4]. A cooperative ground to air surveillance mechanism that employs UAVs for broad coverage and ground nodes for a detailed zoomed in picture of the area under surveillance is presented in [5,6,
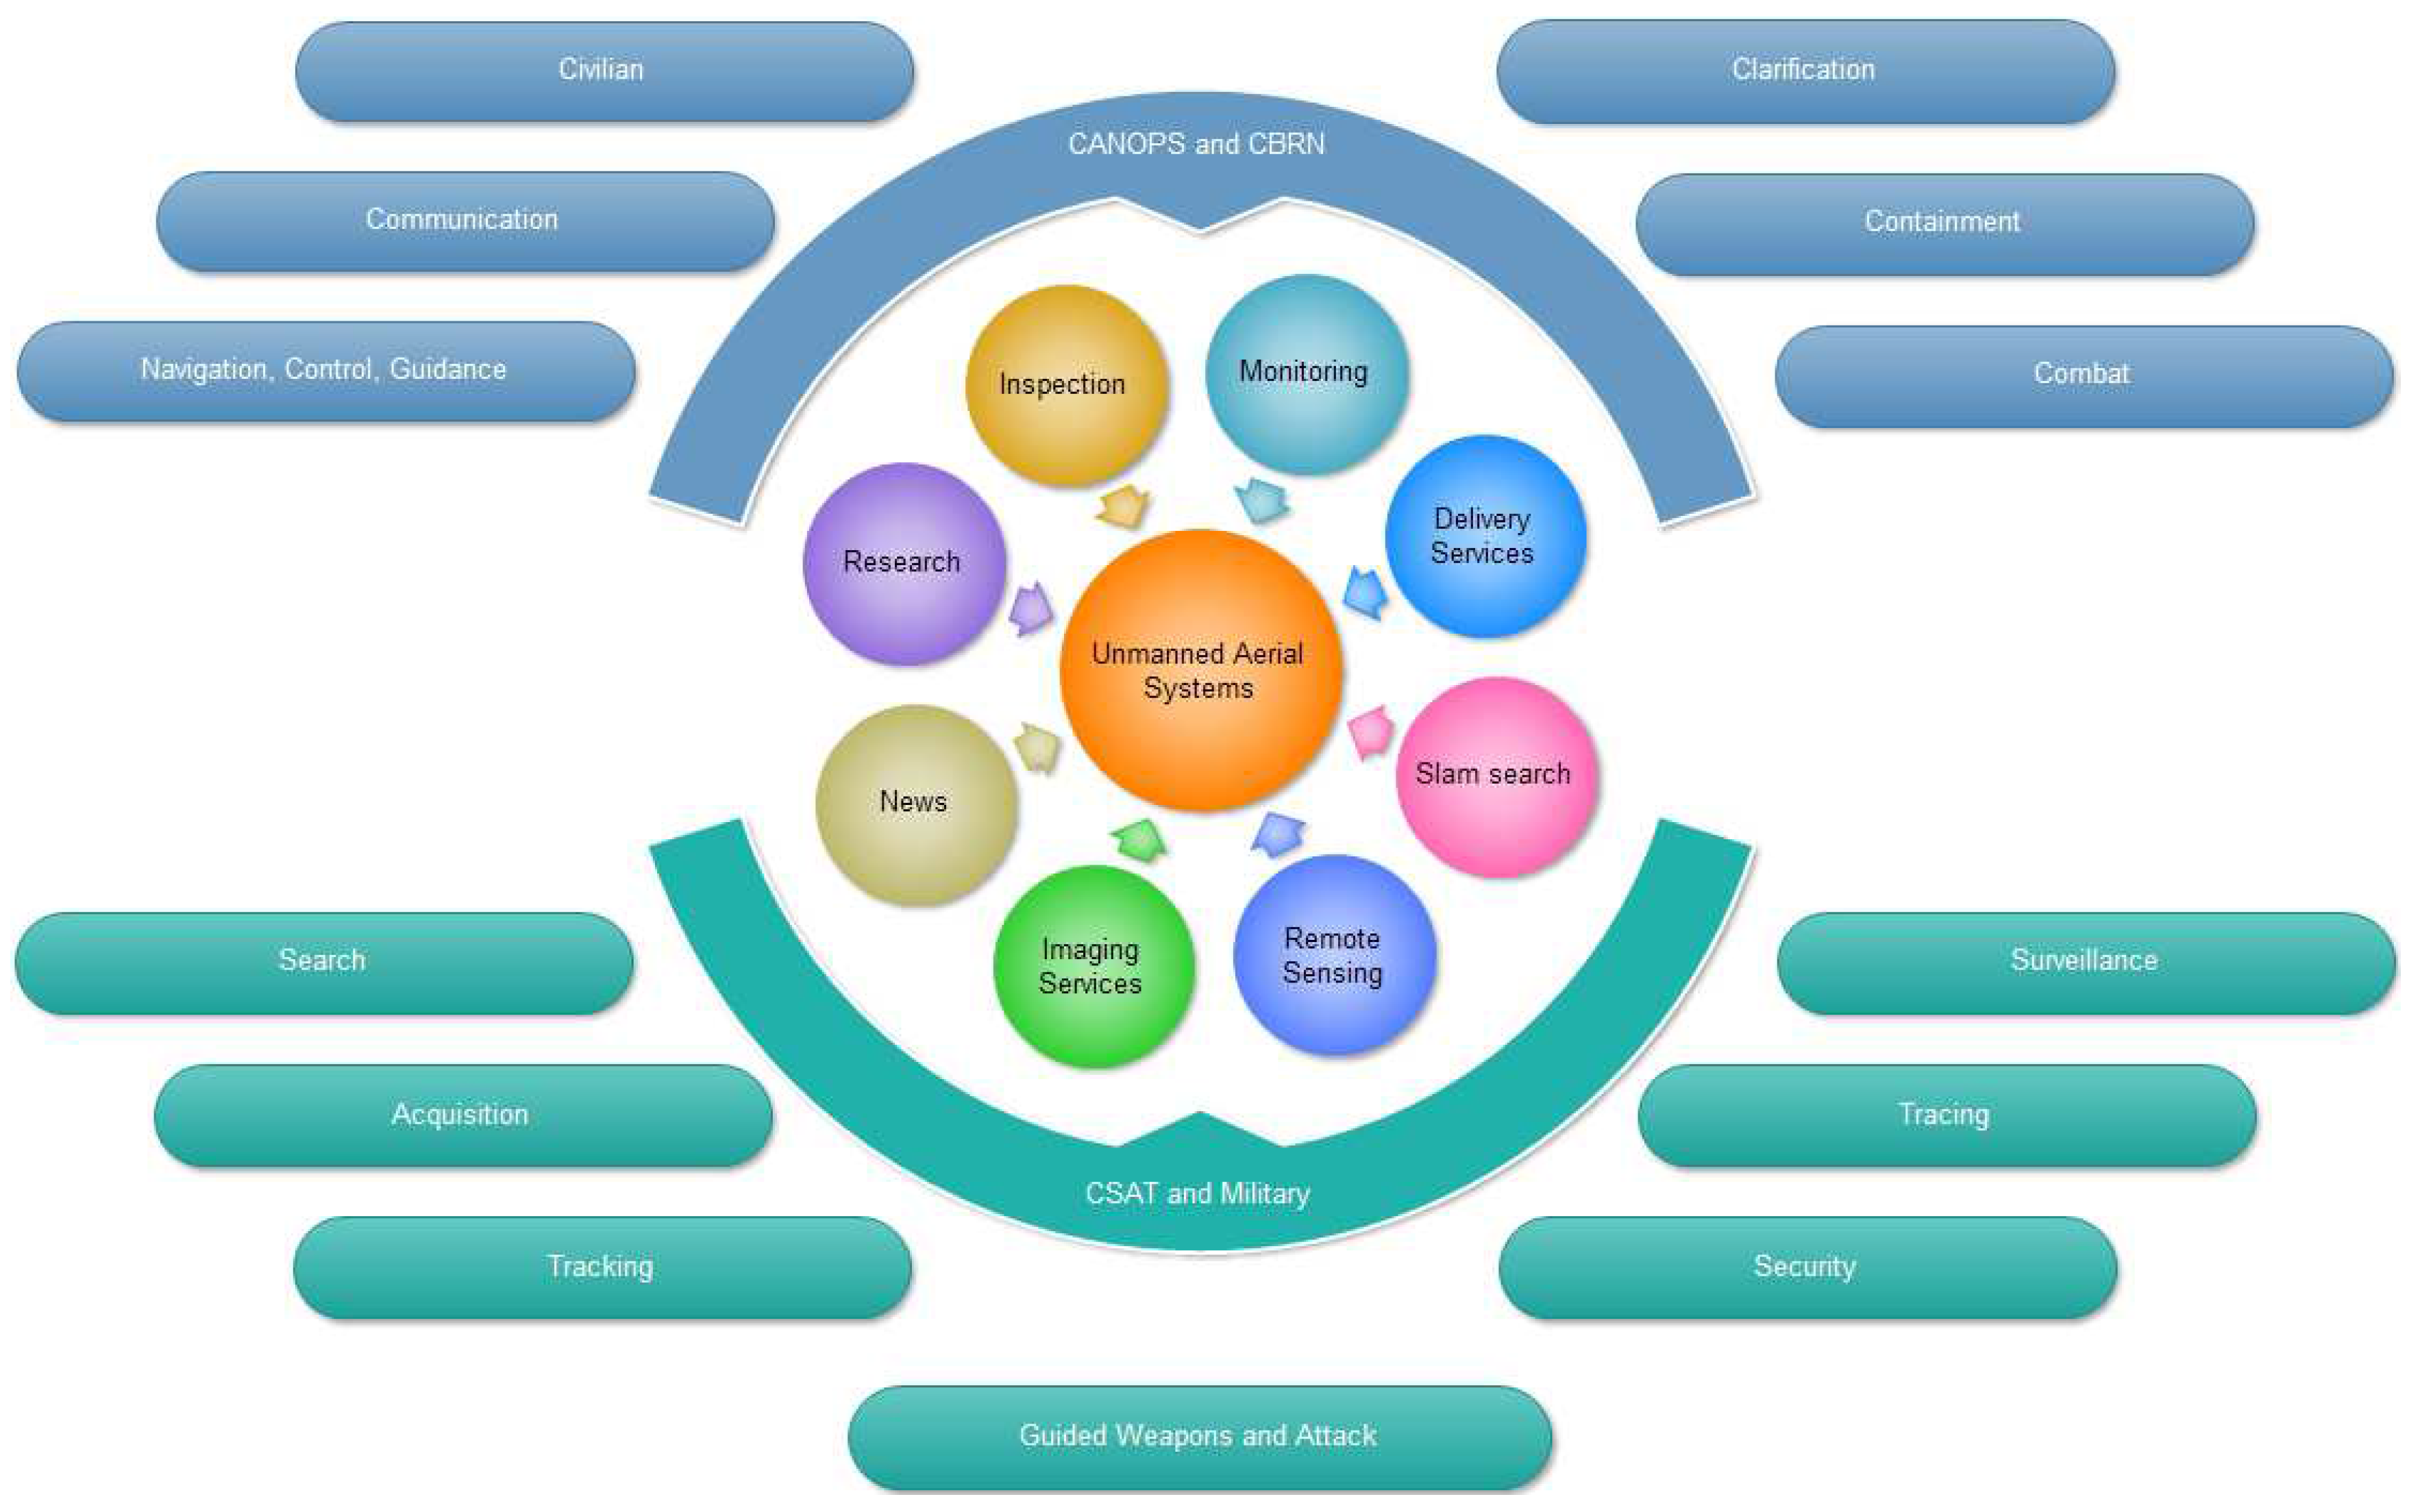
7]. The various UAV application scenarios are presented in Figure 1. The multi-hop characteristics of WSN data transmission were replaced by direct communication between UAV and sensor nodes where UAVs served as sinks [7,8]. Alongside available performance gains, the network formation and setting up way-points for UAV movements are an issue. Efficient deployment of available resources can help improve the coverage and reduce the number of hops, in turn, boosting the overall throughput.
Wireless Sensor Networks are spatially dispersed energy concentric dedicated sensor nodes, largely deployed in inaccessible locations. A few major applications of WSN include air pollution monitoring, forest fire detection, landslide detection, water quality monitoring, natural disaster prevention, industrial monitoring, machine health monitoring, data center monitoring, data logging, waste water monitoring, structural health monitoring and wine production [9,10,11]. Due to their small size and ease of deployment, WSNs have found their applications in varying fields, but this comes with an inherent drawback. WSNs are energy sensitive devices and suffer from depletion constantly. Moreover, they are deployed in such specific areas where human intervention is not necessarily possible. A major amount of energy is depleted while finding an optimal path and multi-hopping transmissions. This optimal path finding becomes a major issue as the sensor nodes die frequently due to their charge depletion resulting in iterative re-searching. Also together with path selection, the multi-hopping produces un-necessary traffic, delays and packet drops. These issues present an opportunity towards an efficient mobility model where WSN nodes are applied alongside UAV and also help facilitate efficient data dissemination.
In order to test protocols, real-time scenarios or disaster management practices, simulations serve as a major test bed. To adapt to the real-time traffic and realistic environment conditions, the mobility model must be able to represent a realistic scenario. The mobility model defines a movement scheme that mimics the real world movements, traffic and response scenarios. One key characteristic of a good mobility model is its ability to adapt to the dynamically changing network behavior. The major vehicular mobility models are classified as synthetic, survey-based, trace-based and traffic simulation-based models. Synthetic models include the mathematical representation of the realistic scenarios, whereas survey based models are basically derived from the movement surveys conducted by authoritative organizations.
Trace-based models are built over real-time mobility traces. Trace based models are preferred over both survey and synthetic models as it is not always possible to devise a mathematical representation of the mobility or conduct a survey in order to gather information. Simulation-based models are characterized by the near realistic simulated behavior [12]. The coordination between WSN and UAV nodes is characterized by the erratic and dynamic behavior of the networks. Vehicular models like synthetic, survey and simulation-based approaches don’t suffice as the inherent inconsistencies of the erratic network behavior hinder the overall mathematical formulation of the scenario as well as the survey and simulation of every single scenario is not feasible. Trace-based models don’t suffice under disaster conditions, military applications, and unforeseen events. In order to entertain the collaborative network formation, a mobility model is required that understands the overall dynamic nature of the network and can react to ever-changing topological conditions.
In this article, a novel mobility model for multi-UAV enabled Wireless Sensor networks is proposed which takes into account the attraction factor for setting up the way-points for UAV movements. The way-points are configured in order to increase the coverage without over application of the UAV nodes and minimize the number of hops. The efficiency of the approach comes from its simplicity and easily implementable nature. The proposed approach is compared against the entity mobility models i.e., 3D Random Way Point, 3D Random Walk and the Gauss–Markov Mobility Model [13]. The proposed mobility scheme is also compared against traditional techniques of fixed UAV maneuvers.
The rest of the paper is organized as follows: Section 2 gives the detailed view of the problem and our contribution. Section 3 consists of related works. 
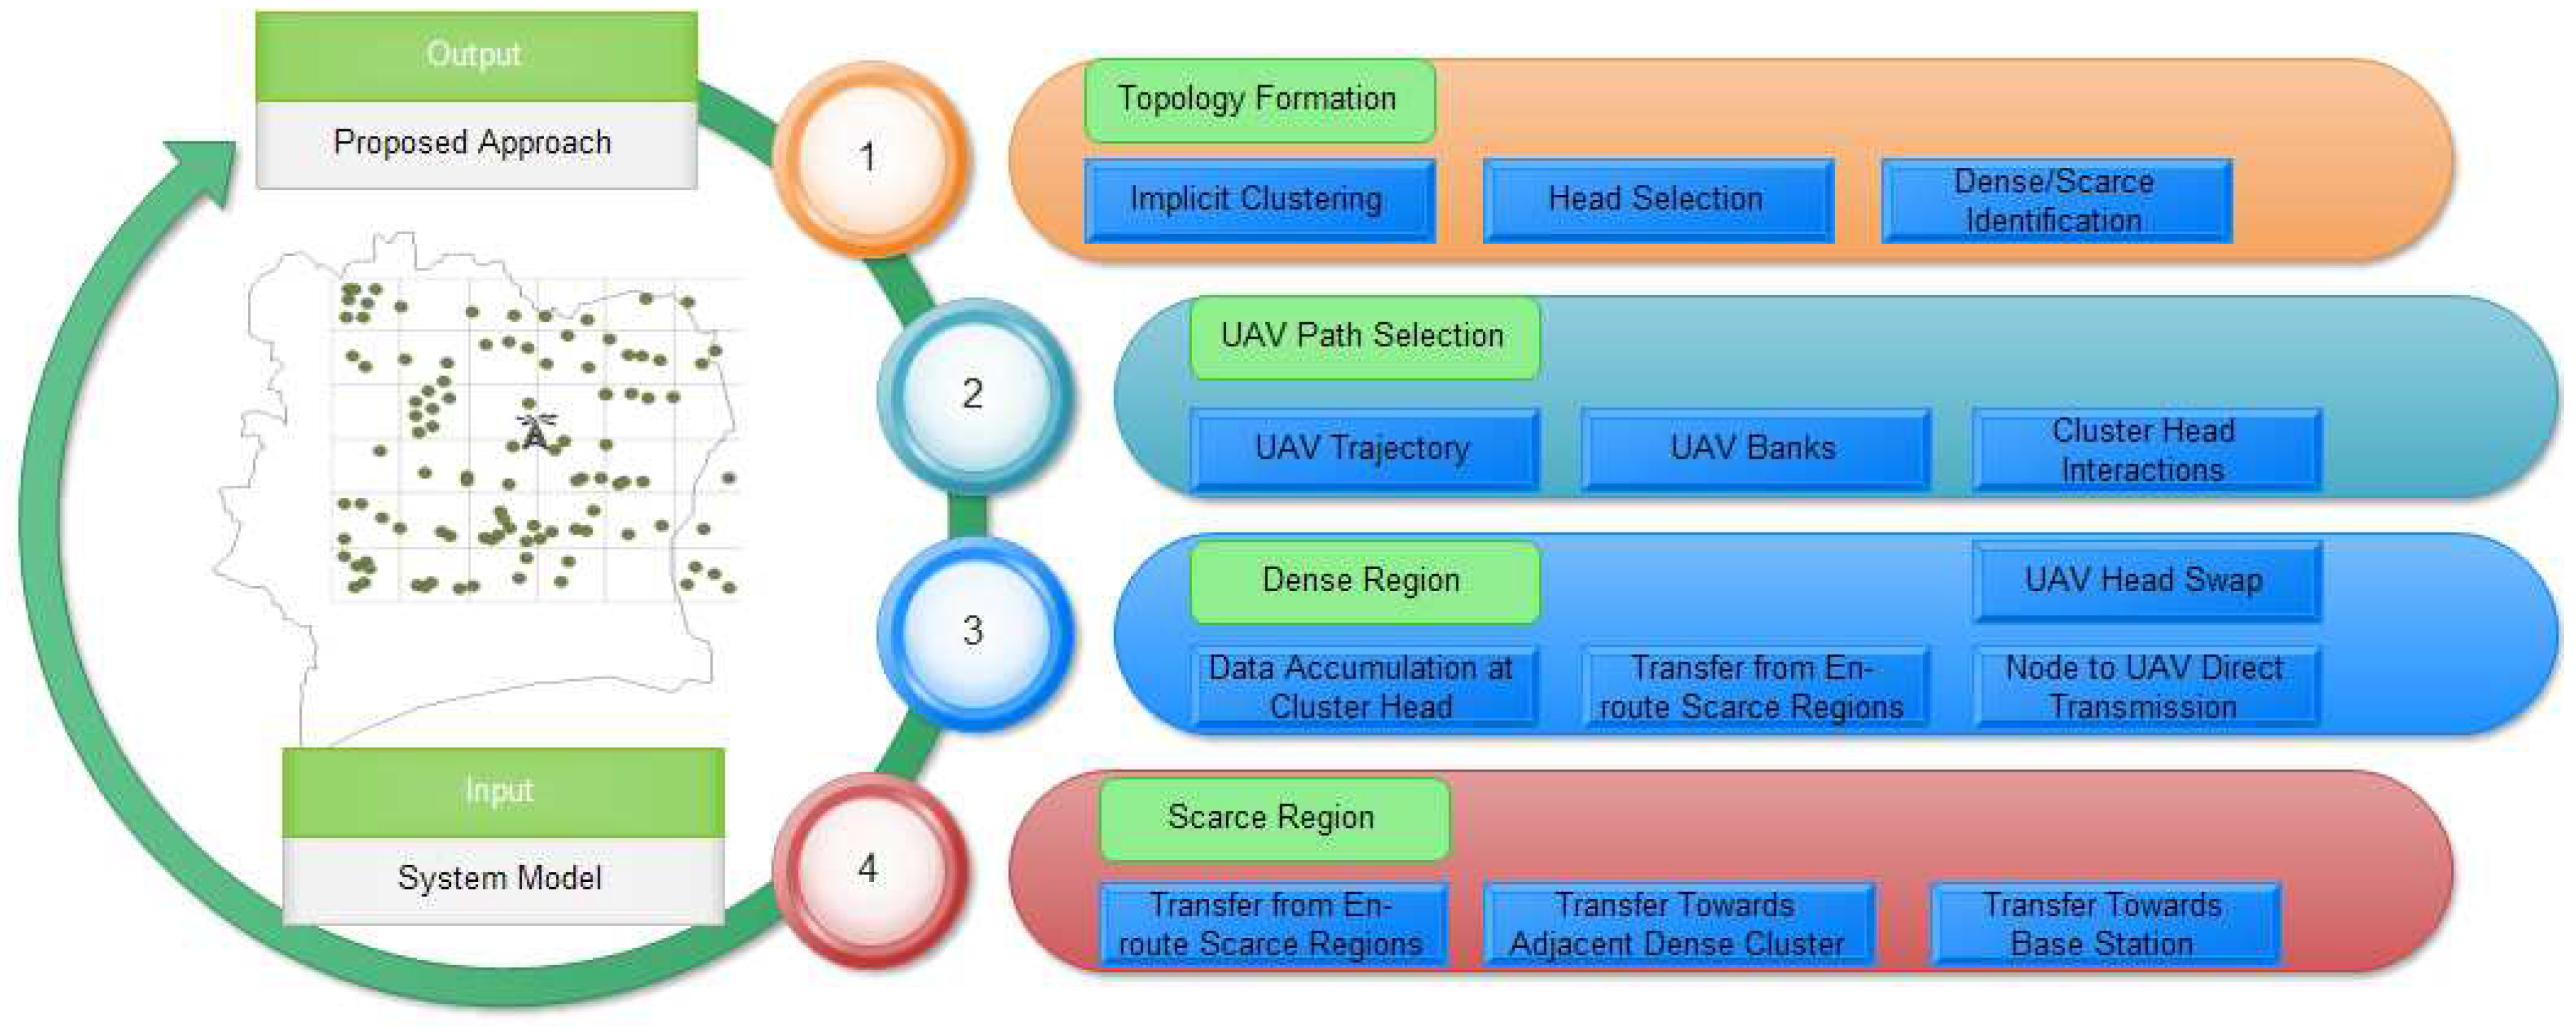
Section 4 presents the system model and the proposed approach. Section 5 evaluates the performance and finally Section 6 concludes the paper.

2. Problem Statement and Our Contribution

Multi-UAV enabled WSNs prove to be of considerable advantage, but, at the same time, require careful selection of the metrics. A random choice of way-points or a scheme that restricts UAV to a fixed particular topology leads to poor coverage and node starvation. Clustering techniques are helpful to prevent long-range broadcasting, collisions, and multi-hopping, but a large number of clusters in a geographical region prevents every node from getting an equal opportunity as well as increasing the waiting time. Strategically important locations can range from dense to scarce based on the number of active nodes. Developing attraction metrics from node density and message relay timings can help in topographic UAV movements and help prevent loss of important information.
The proposed system model incorporates an easy and efficient UAV movement technique that helps increase the coverage as well as provides reliable data dissemination. An efficient scheme for clustering and head selection that provides every node with an opportunity to transmit as well prevent the overhead communication between the cluster head and the node whenever UAV is in the range is also presented. The stand-alone regions/not in range of UAV, are also provided with a mechanism to transmit whenever they have data to send. Based on existing issues and the above-mentioned shortcomings, the proposed framework provides the following contributions:
  • A simple, easy to implement mobility model that divides the overall topology into densely and scarcely populated regions. This division is on the basis of average transmission densities of the regions. These densely and scarcely populated regions, in turn, serve as the basis for UAV way-point selection.
  • An implicit self-clustering scheme for data accumulation whenever UAV is not in range. Cluster head swapping mechanism, which provides every node with a direct UAV link in order to achieve increased transfer rates. The implicit clustering also serves as the basis for UAV way-point selection.
  • A modified version of Dijkstra’s Single Source Shortest Path algorithm where edge weight is calculated not on the basis of region density but on the average transmission density (attraction factor), providing preference to the strategically important locations.
  • An easy mechanism that facilitates data transfer for the nodes that don’t fall along the mobility path of the UAV. These scarce nodes can send data transmissions either towards the base station or the nearest cluster head according to an easy comparison.
The major advantage of the proposed approach is in its simplicity as it doesn’t require any special configurations. It employs the existing hardware, software and available specifications in a more effective and efficient manner.

3. Literature Review

Mobility models that define velocity, direction and change in acceleration over the course of simulation or real-time environments in ad hoc networks have been around for quite some time. Mobility models find specific applications while testing new protocols and applications, which imposes a restriction on them for being real-world feasible and easy to implement. We segregate the literature into two parts. Initially, major ad hoc mobility models are described in brief. Then, recent contributions towards the field of UAV mobility as well as the data dissemination techniques that rely on the mobility paradigm are discussed in detail.
The Random Walk model derived from the Brownian motion is the most widely used mobility model. The movements of the random walk model are characterized either by a constant time or constant distance, i.e., the mobile nodes can change direction either after traveling a certain distance or a certain time interval. Because of its simplicity and ability to simulate the spontaneous behavior of the mobile nodes, many variants of the model have been proposed in the literature [13,14,15,16]. The Random Way-point model is another memory less mobility model. The only addition to the random way-point model is that it maintains a miniature pause time between swaps. The mobile node moves from one destination to another with the speed chosen between a predefined maximum and minimum speed after the pause interval [13,17]. The random way-point model without the mandatory pause has also been implemented in literature [18]. The Gauss–Markov model for ad hoc networks can handle the inherent randomness of the mobile nodes more efficiently. The nodes are initialized with specific speed and time. Then, the speed and direction are updated regularly with the help of a tuning parameter. To keep the nodes from edges, they are pushed away when nodes reach within a specific distance from the edge [13,19,20]. Table 1 presents some of the ad hoc mobility models proposed in the literature, which are centered around UAVs as relays.
Sharma and Kumar [3] presented a framework for multi-UAV guided ground ad hoc networks. The authors have discussed how the network is formed among the multiple UAVs and an efficient mechanism for making the search non-redundant. Bayesian Kalman filtering is employed for the purpose of estimating the location of the Concepts, which, in turn, is used for updating previous maps. The new concept of Topology Organizing Maps is also introduced by the authors who determine the positioning of the nodes with respect to the introduced Virtual Concepts, which are identified during cognitive mapping. The authors have successfully demonstrated the cooperative network formation with the help of constant prediction and estimation with the help of neural models and Kalman filtering.
Sharma et al. [27] proposed that a nature-inspired algorithm can solve the problem of optimized routing and congestion control as well. The authors presented an optimized fruit fly based routing protocol for aerial and ground ad hoc networks. The algorithm also includes enhanced congestion control mechanisms. The algorithm relies on the principle that all nodes playing food sources should calculate their smell index, which, in turn, is used by source nodes to calculate the fruit fly index. The base of the protocol is that the node acting as a source is called the fly and the relays for path formation are considered as a food source, thus a node when evaluating itself is a fly and when evaluating others is a food source. The route discovery, route maintenance, and route recovery are the three stages of the protocol. The route discovery phase starts more or less like a link state protocol by broadcasting hello messages. However, this is it for the link state. The hello messages are generated by each node acting as a fly. When receiving a hello message, the node with the help of modeling equations calculates the smell index and the sender node on receiving the acknowledgment calculates a fruit fly index. The greater the value of this index, the more chances of the node getting selected as a relay point. The feedback mechanism also exists which has beacons to keep everyone updated about the network state. Each node maintains a forward connectivity and a flash feedback table. The route maintenance takes into account the acknowledgments and periodic updates. The proposed mechanism employs the estimation and prediction of the proposed window size. A watchdog policy is also employed to have a check on a maximum number of interacting food sources. The smell index is used to fix the initial length of the congestion window and a smell probabilistic model takes care of increase or decrease of the window size. A route rehabilitation procedure is employed because there a certain violation that is inevitable and the network demands recovery. The concluding remark on the protocol is that it provides an efficient routing mechanism and congestion avoidance when routing between two different kinds of networks [23].
A demand-based UAV placement model is discussed in [28], which employs a neural-based cost model to estimate the zones where UAV is placed. The model is driven by the principle of demand patterns, which, in turn, assign cast and density to separate areas and UAVs. A neural-based model that applies multiple UAVs instead of a huge amount of small cells provides a less complex and more efficient load balanced system. A huge application of small cells is also not cost effective. UAVs, when used as flying access points, can provide reliable connectivity to failure-prone areas. However, above all, a very fine and efficient approach is mandatory for UAV topology formation and coverage issues. The proposed model that is driven by density and cost functions that compute areas with high demands and UAVs are deployed based on these metrics. The target is not only to find efficient positioning but also the altitude, as high altitude is more resilient to interference but involves additional delays. Test results demonstrate that the efficiency increases by one third if UAVs are employed instead of small cells.
A multi-objective genetic algorithm with objectives’ delivery hit rate, delivery cost, and delivery latency, respectively, for data dissemination in delay tolerant UAV networks is presented in [29]. Delay Tolerant Networks (DTNs) prove to be very useful in disaster scenarios, intelligent transport systems, wireless sensor networks, etc. A probabilistic cut node based forwarding scheme for delay tolerant UAV networks is presented in [30]. The cut nodes belong to two different networks if the network is viewed as a disconnected graph. Jaccard distance is used to measure the dissimilarity between the nodes so as to judge which nodes belong to the same social network and still have an outside connection. A traveling salesman based smooth path construction mechanism was proposed in [31]. A three-dimensional UAV rotational and polarization model is presented in [32]. Han et al. [25,33] proposed a heuristic based adaptive scheme for UAV deployment. A Delaunay triangulation mechanism is used to increase connectivity and the changing topology is monitored constantly in order to adapt to the inevitable dynamic topology. Another adaptive algorithm for filtering UAV movements using Kalman Filters is presented in [34]. UAV deployment and movement models are also considered in [35,36,37,38].

4. System Model and Proposed Approach

4.1. System Model

The proposed approach aims at improving the coverage and reliability of multi-UAV enabled WSN. The article provides a novel self-clustering technique and a novel technique for setting way-points for UAV movements. The network is comprised of UAV, WSN nodes and a base station. The UAVs act as a relay between sensor nodes and the base station. The topology is classified as dense, scarce and scarce but in proximity of the base station. The division is strictly based on network characteristics according to the frequency of transmissions recorded in a particular region. The scarce regions are effectively those regions which are not strategically important. Also decaying charge of sensor nodes leads to the formation of scarce regions. The overall geography can be visualized as a matrix with row-column coordinates serving as the way-points for successive UAV banks. Figure 2 presents a detailed view of the system model.
The static WSN nodes are randomly deployed over a certain geography of area | D | , which is a subset of the Euclidean space R d , according to the Poisson distribution, where a node k can transmit anytime. k belongs to the Set (WSN) of the wireless sensor nodes. Each node k can transmit messages x according to Equation (2):
k S e t ( W S N ) , S e t ( W S N ) = 1 , 2 , 3 , , n ,
P x = e λ | D | λ | D | x x ! .
λ is defined as the likelihood parameter that estimates the average expected transmissions by a set of WSN nodes:
λ = 1 n i = 1 n k i ,
where n is the number of WSN nodes, k i = 0 , 1 , 2 , 3 , , i and i = 0 , 1 , 2 , 3 , , n are the observed occurrences of a transmission.
The overall area is marked in the form of successive checks with the base station placed in any of the square or at the edge of the geography. The base station is capable of accepting direct communication from the WSN nodes as well as the transmissions occurring from the UAVs, acting as a relay between base station and the ground nodes.
The aerial vehicles that are effectively serving as relays move from one dense region to another accepting the transmissions from the nodes lying in these regions as well as the regions falling in the path between two successive banks of the UAV. The UAV is equipped with two antennas. One omni-directional antenna is responsible for sensing the underlying topology for incoming transmissions and broadcasting the messages regarding the availability of the UAV in a specific region. The other bi-directional antenna provides the channel for incoming and outgoing transmissions. During transmission phase, the omni-directional antenna is used for broadcasting a blocking message for other WSN nodes. The scarce regions that do not directly fall under the UAV antennas facilitate transmission by multi-hopping towards the base station or the cluster head of adjacent dense region. The symbols used in the proposed article are summarized in Table 2. The next subsection describes the proposed approach in detail.

4.2. Proposed Approach

The proposed approach initiates by grouping together the ground nodes into clusters and then segregating them on the basis of dense and scarce. The density of a particular cluster is associated with the number of transmissions originating from the cluster in a given time interval. As the UAV banking is based on the coordinates of the particular row-column of the subdivided area matrix, the square space as a whole is considered to be one cluster. The WSN nodes falling into a particular sector (block of the matrix) are default considered into the same cluster. Equation (4) outlines the cluster head selection process, where H d is the average one hop distance. Equation (5) gives the metric calculation for a single node:
M i n ( H d ) ,
H d i = i = 1 C n D h o p C n ,
where H d i is the node under consideration, D h o p are one hop distance from the node under consideration, given that the node coordinates lie within ( c , x i , y i ) , ( c , x j , y j ) , ( c , x k , y k ) , ( c , x l , y l ) that is within the same sector, where c i is the base station, and C n is the number of nodes in the self-cluster.
The transfer between UAV and sensor nodes always happens through the cluster-head, with the condition of Head Swap. The nodes with data to send forward this data towards their cluster head where data is accumulated. When UAV is in range of the cluster head, the Head Swap occurs. UAV becomes the cluster head of the sector to facilitate transfer not only from the designated cluster head, but also allows the cluster members to send data directed towards the UAV.
The UAV way-points are set in a way that it moves from one dense cluster head towards another dense cluster head. UAV way-points are decided on the basis of transmission density and distance. Equation (6) defines the calculation of attraction function F A by means of transmission density:
F A = R T S i × C n S a ,
where R T is the number of transmissions per unit time in a sector, S i is the number of nodes transmitting per unit time in a given sector, C n is the number of nodes in a sector and S a is the sector area.
Similarly, the F A s y s for the whole system is calculated according to Equation (7):
F A s y s = R T s y s S i s y s × C n s y s S a s y s ,
where R T s y s is the number of transmissions per unit time in the whole system, S i s y s is the number of nodes transmitting per unit in the system, C n s y s is the number of nodes in the system and S a s y s is the overall area.
The average number of transmissions in a given area or square which is effectively a self-cluster and the overall average transmissions in the system are given by Equations (8) and (9):
T A , a r e a = i C n R T C n C n ,
T A , s y s t e m = i C n s y s R T s y s C n s y s C n s y s ,
where T A , a r e a and T A , s y s t e m are the average number of transmissions in a self-cluster and overall system, respectively.
The inequality in Equation (10) identifies the dense clusters from the scares ones. The clusters lying on the left side of the inequality are considered to be dense clusters, whereas the clusters lying on the right side of the inequality are considered to be scarce clusters:
T A , a r e a F A < T A , s y s t e m .
The model uses a modified version of Dijkstra’s Single Source Shortest Path algorithm where edge weights are given by Equations (11) and (12):
W e = i C n R T C n C n i C n s y s R T s y s C n s y s C n s y s 2 ,
W e + = 1 F A s y s W e ,
where W e is the edge weight and W e + are the normalized edge weights used by the Single Source Shartest Path (SSSP) algorithm.
The densely populated sectors are serviced by UAV maneuvers directly along with the sectors which fall in line with two consecutive UAV banks. The scarce sectors that don’t fall in the path of UAV are the designated Lone sectors. Lone sectors send hello packets towards nearby dense regions and the base station when the network is initialized. The purpose of the hello packets is to determine the number of active nodes in the region and number of hops required to reach dense sector and base station, respectively. Cluster heads belonging to the lone sectors forward packets towards the base station when the inequality in Equation (13) is satisfied; otherwise, packets are forwarded towards dense regions of the geographical area:
D b D d ,
where D b and D d are the average number of hop counts from the base station and nearest dense cluster, respectively.
The overall proposed approach is presented in Figure 3 in the form of an activity flow scenario. The complete Mobility Model alongside cluster and way-point selection is underlined in Algorithm 1. Algorithm 1 on initiation calls Algorithm 2, which deals with cluster head selection and overall topology formation. The algorithm further identifies the regions as dense and scarce. The link costs that are further used for deciding the UAV traversal routine are also determined by the Algorithm 2. The UAV path is generated by the Algorithm 3. Algorithm 4 is responsible for the control and coordination of data transmission. The algorithm facilitates transfer of data from scarce clusters, the clusters that don’t directly fall under the UAV path. These clusters are identified as the Lone clusters. The Lone clusters or regions estimate their average hop distance from the base station and the adjacent dense region. This hop count information is used for facilitating the data transmission to and from the Lone regions.
Algorithm 1 Proposed Approach
Initialize Algorithm
Topology Formation ();
UAV Path Generation ();
Data Transmission ();
Data Transmission Lone Regions ();
 Exit
 End
Algorithm 2 Topology Formation
 Start
Input: Set of WSN Nodes W i
Initialize Network
Mark sensor nodes to a sector w.r.t ( c , x i , y i ) , ( c , x j , y j ) , ( c , x k , y k ) , ( c , x l , y l )
Cluster Head selection of a square M i n ( H d )
    H d i = i = 1 C n D h o p C n
Calculate Attraction Factor
    F A = R T S i × C n S a
    F A s y s = R T s y s S i s y s × C n s y s S a s y s
Calculate average transmissions
    T A , a r e a = i C n R T C n C n
    T A , s y s t e m = i C n s y s R T s y s C n s y s C n s y s
Identify dense and scarce clusters
   Dense T A , s y s t e m F A
   Scarce F A < T A , s y s t e m
 Calculate link costs W e = i C n R T C n C n i C n s y s R T s y s C n s y s C n s y s 2
Normalize Link Cost
    W e + = 1 F A s y s W e
 Exit
 End
Algorithm 3 UAV Path Generation
 initialize D b s = 0 , P a t h = [ ]
while w q do              w q q u e u e o f c l u s t e r h e a d s
  Select cluster head C i with min W e + i
   D b s = W e + i
  for E v e r y N e i g h b o r C j of C i do
   Calculate D j
        D j = W e + i + W e + i j
   if D j < W e + j then
     D b s = D j
   End If
  End For
   P a t h = C i C j
  Return Path, D b s
End while
 Exit
 End
Algorithm 4 Data Transmission Lone Regions
Node from Lone sector
 Identify Neighboring dense sectors.
 Broadcast “Hello” ← Estimate Hop Count
 Sort clusters, base station in Order of Hop Count.
while Node with data do
  Select Optimal Cluster or Base Station
  if Node With Data then
   transmit
  else
   Select next optimal Cluster or Node
  End If
  Iterate till Node with data = FALSE
End While
 Exit
 End

5. Performance Evaluations

The proposed technique relies heavily on, as well as exploits, the movement characteristics of UAV in order to achieve significant gains over the already existing models. The evaluation and testing of the approach are done on a model consisting of the base station, WSN motes and the UAVs serving as relays by using NS-3 (version ns-3.28, NSNAM, Washington, DC, USA) and Matlab (version R2018a Online Licence, MathWorks, Natick, MA, USA). The testing is performed on a 1200 × 1200 m 2 area. Table 3 lists the detailed simulation settings for the proposed model.
The following parameters are used for the testing of the model:
  • Coverage: Network Coverage is defined as the geographical area covered by the network. In the proposed approach, Coverage is defined as the number of nodes served along the path of the UAV given a certain time interval.
  • Throughput: Throughput is defined as the number of successful transmissions over the network. In the proposed approach, average throughput is measured across the network. A throughput variation chart is also presented in order to demonstrate consistency and QoS levels of the proposed approach.
  • Latency: Latency is described in terms of propagation delay and serialization delay, where propagation delay is a function of the distance between the nodes and speed of the carrier, and serialization delay is a function of packet size and transmission rate. The amount of data flowing through a network or a network bottleneck can be visualized as the function of latency and directly affects the throughput of the system irrespective of the technology used.
  • Delay: Delay is defined as congestion or link unavailability and is generally considered a measure of the amount of time a signal takes from source to destination. The model aims at limiting the delay to a constant factor by facilitating direct communication between UAV and WSN nodes.
  • Jitter: The non-deterministic behavior of the network is outlined by jitter. Delay sensitive models are also sensitive to jitters and can be described as the variation in delay.
  • Packet Delivery Ratio (PDR): PDR is defined as the ratio of packets sent to the number of packets successfully delivered. Throughput serves as an effective measure of performance of a node or a section, but PDR addresses the quality of network design that can lead to poor overall throughput.
  • Data Transferred: Data transferred is the overall data transferred from source to destination nodes throughout the network. It serves as the metric that estimates data over a given connection during the given time interval.
  • End To End Delivery (EED): End To End Delivery is a parameter that estimates per packet delivery from source to destination. Unlike throughput, which treats the whole model as an entity and calculates the average, the EED is a per packet successful evaluation from source to destination.
  • Packet Drop: Packet drop is the measure of the number of unsuccessful transmissions across the network. The packet drop is measured with respect to the number of packets lost in contrast with the number of packets sent. Packet drop can be caused by UAV, not in range or congestion in the network. The frequent broadcasts from the WSN nodes can also result in packet drop. The topological awareness and route calculation of the UAV aims at limiting the packet drop to minimum levels.
The proposed approach was evaluated against the above-defined metrics in comparison with the 3D Random Way Point, 3D Random Walk, Gauss–Markov Mobility Model and fixed UAV maneuvers.
The most critical point over which a mobility model can be evaluated is the coverage. Coverage in terms of collaborative networks is defined as the number of ground nodes served or guided over the course of time. The proposed approach provides a steep coverage of 98%.
The random way-point and random walk models are characterized by following the same direction for longer tenures. Both the models provide excellent coverage if the ground nodes are laid across their movement diagonal, which is not always, the case, in real-time scenarios. The random way-point and random walk models provide 91% and 90% coverage, respectively. In the Gauss–Markov model, the next way-point relies heavily on the previous speed and direction. It possesses the tendency to skip densely populated regions as the next way-point is not selected on the basis of density and transmission characteristics of the nodes. The model provides 55% coverage.
The fixed maneuver for a proactive model performs well over its fixed coordinates, but the overall geography demands constant survey and analysis to manually fix new coordinates over time. The 10% coverage provided by the model comes from the path fixed previously without considering the ever-changing patterns of the erratic dynamic network. Figure 4 presents the overall coverage comparisons.
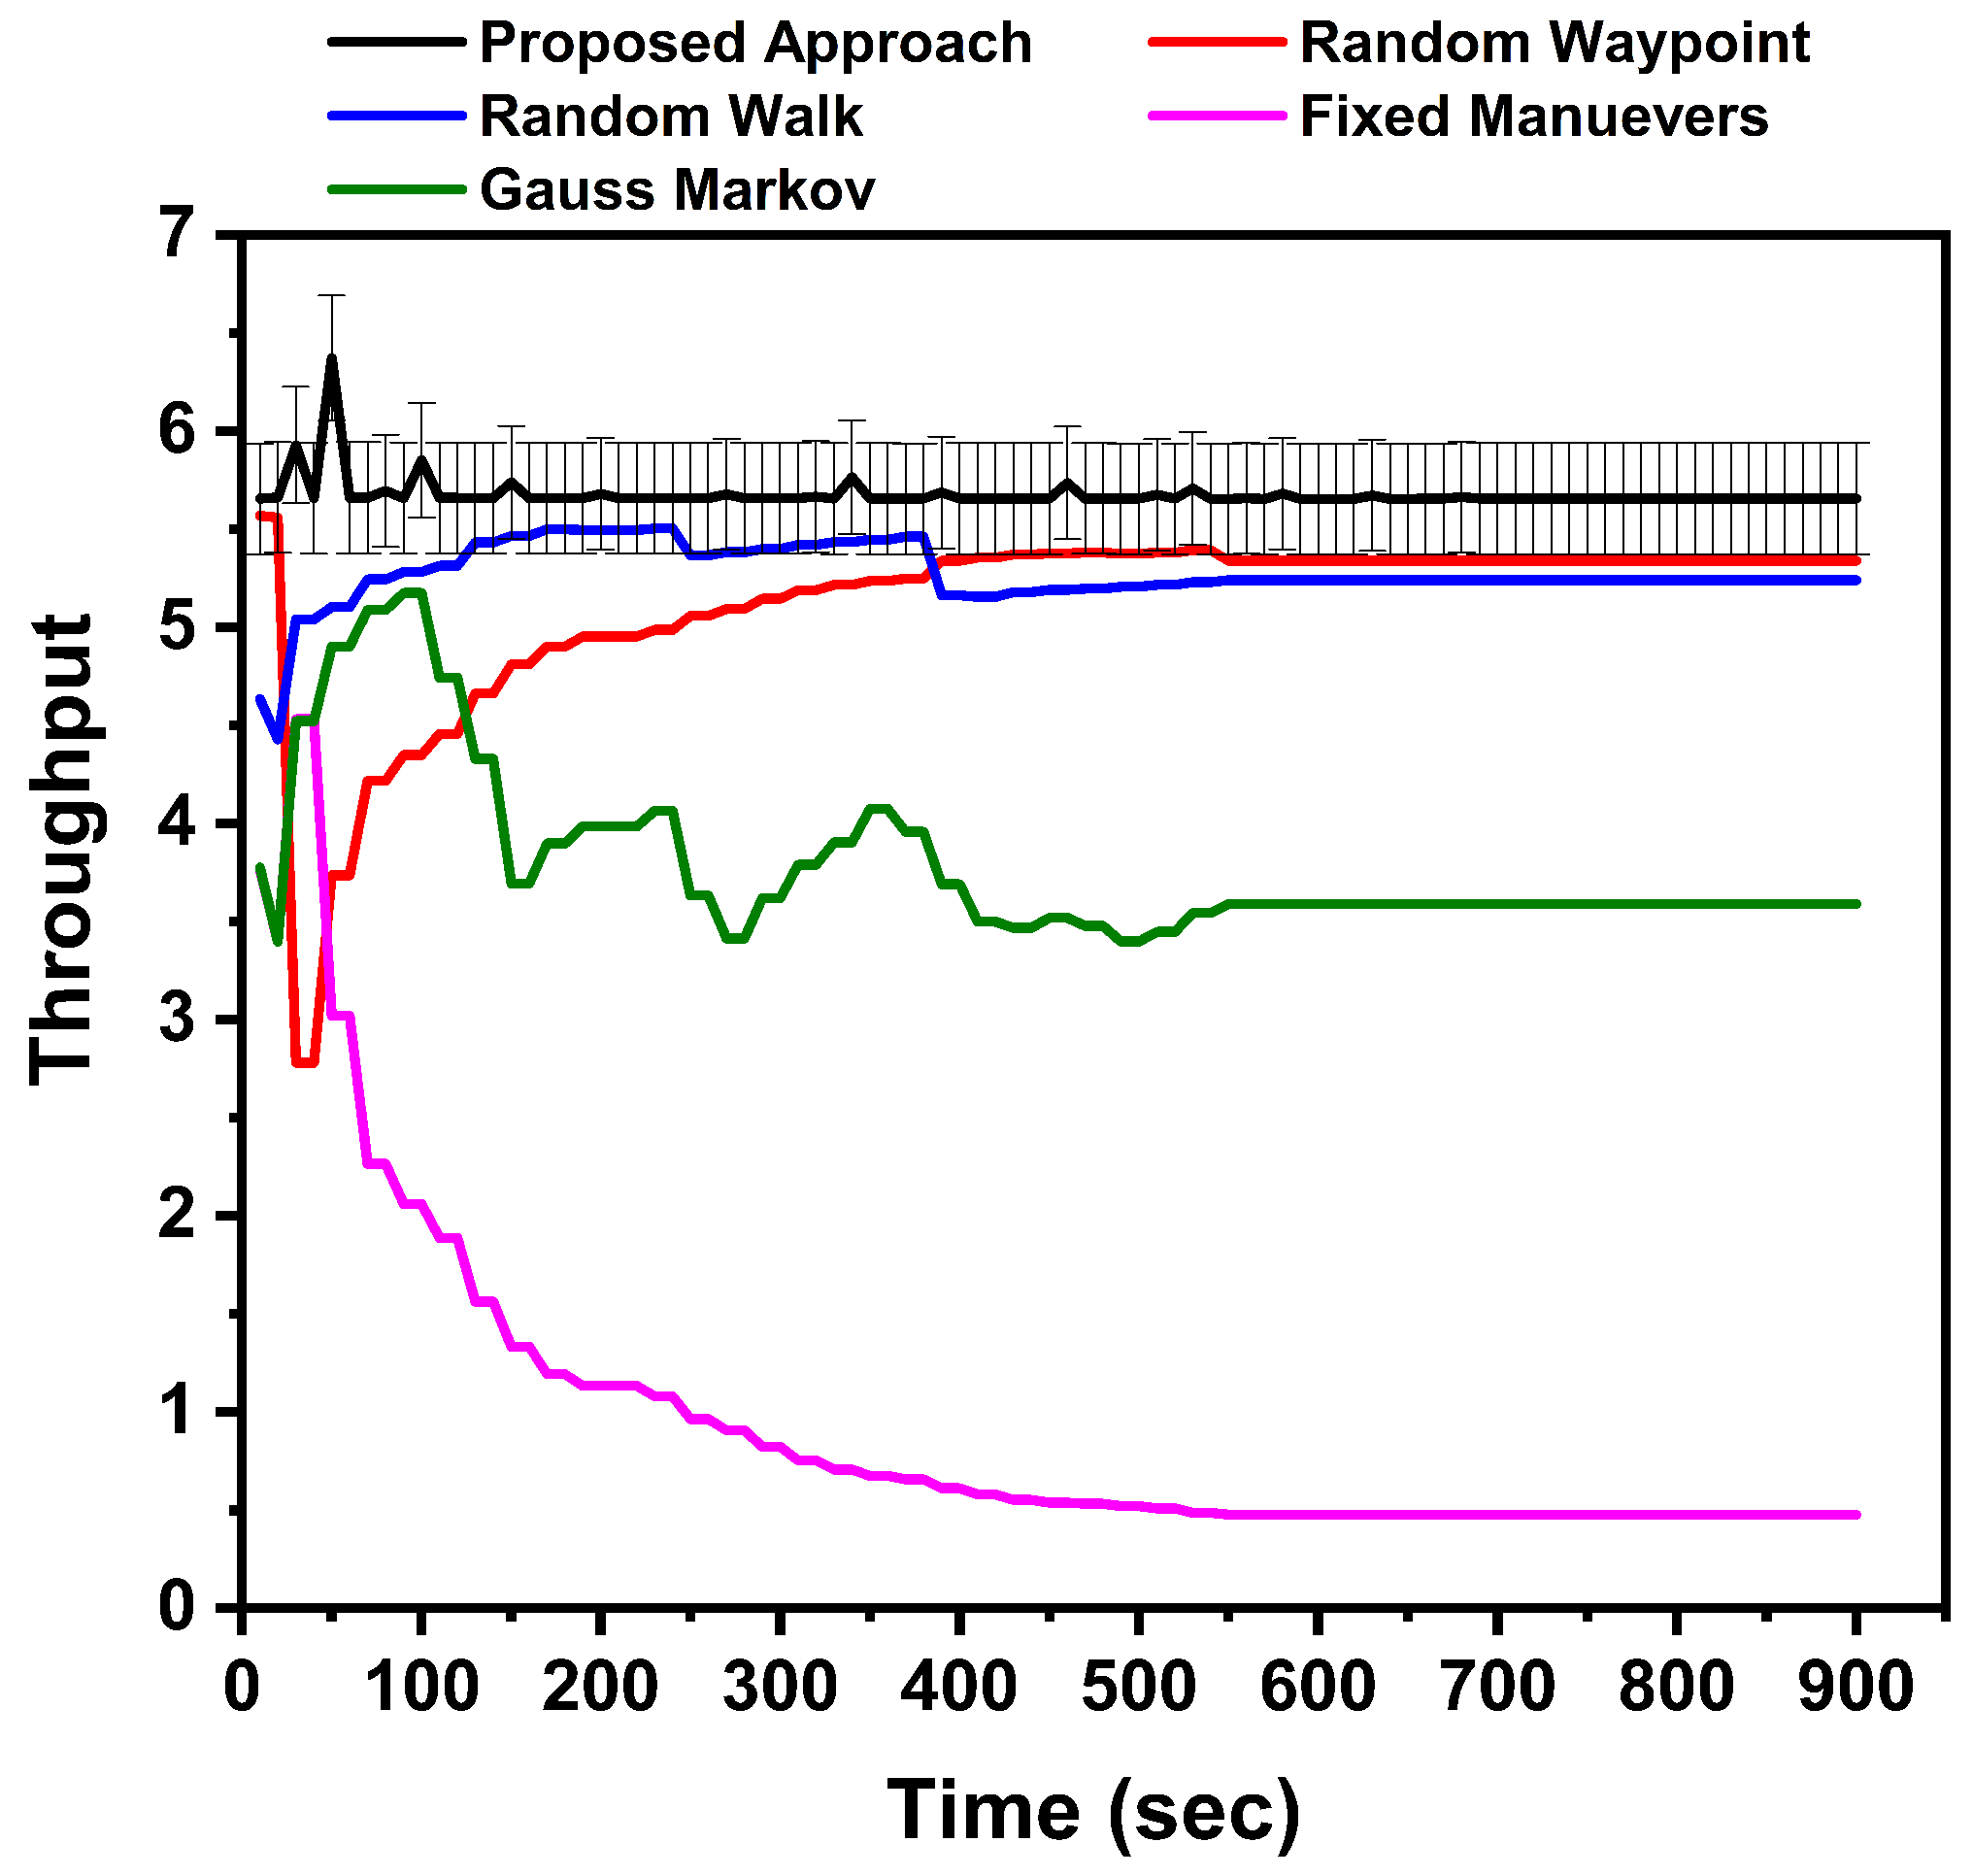
Throughput is directly proportional to the coverage. The greater the coverage, the more ground nodes gets serviced or receive a chance to forward data. Throughput is also affected by the density of the areas served. The close-packed areas tend to have more ground nodes thus increasing the chance of data transmission. The approach works better as it focuses on identifying the denser areas from the scarce ones and then selecting way-points accordingly instead of random movement or movements dictated by speed and direction. The pre-fixed maneuvers do not suffice as both life and transmission density of the WSN nodes is dynamic, and the technique cannot adapt to the changes. The proposed technique provides throughput levels of 82%.
The random-way-point and random walk models achieve 74% and 72% throughput, respectively. The Gauss–Markov model achieves a throughput of 55.7% while the fixed technique significantly underperforms with throughput levels of 7.5%. Figure 5 presents the throughput evaluation of approaches in confederation. To test the Quality of Service provided by the proposed approach, the increases and decreases in throughput levels over the course of simulation are presented in the bar graph. The test results demonstrate consistent throughput levels for the proposed approach. Figure 6 presents the QoS comparison based on the throughput levels for the stated approaches. Although random way-point and random walk are evenly matched, they underperform significantly.
The latency of the system, which is a measure of a signal’s travel time from source to destination, plays an important role in the applicability of a model. The system throughput drastically declines with the increase in latency. The system performance degrades, as with increasing latency, the packet drop also increases. The proposed model features an overall latency of 9%. The random way-point, random walk, Gauss–Markov and fixed models have 12.5%, 12.5%, 15% and 85% latency, respectively. The latency comparisons are presented in Figure 7.
The minimized average delay is a necessary condition for an efficient model. Facilitation of direct communication between UAV and sensor nodes as well as a reduction in the multi-hopping nature of data transmission effectively brings down the overall delay. The statistically important areas are served directly by the UAV and very few of the remaining scarce areas resort to multi-hopping. The average delay of the proposed model is restricted to 0.625%.
The random way-point and random walk models have 11.25% and 35.625% delays, respectively. The Gauss–Markov model with its variable velocity property restricts the average delay to 5%. The fixed models have an important characteristic of following their well-defined path and always staying in connection to the base station, thus effectively matching the proposed model with 0.625% average delays. However, this delay is with respect to their coverage and throughput values.
Figure 8 gives the average delays for the different approaches. Jitter, which is the measure of the variations in delay, is presented in Figure 9. With the minimized delay, the proposed approach features the jitter value around 2% and the fixed maneuver model matches the jitter values of the proposed approach. The random way-point, random walk, and Gauss–Markov models have 9%, 6%, and 5% jitter, respectively.
PDR, which measures the number of packets delivered successfully across the network over the course of time, is an important metric for the mobility model evaluation. The proposed approach that features movement from one dense to another dense region and also collecting data from scarce regions by means of multi-hopping or direct transmission towards base station has a high PDR value of 99%. The random way-point and random walk models that boast of their capabilities of traversing the whole geographical area slowly also possess high PDR of 91% and 90%, respectively, which is slightly less than the proposed approach. The Gauss–Markov model has a PDR of 62%, while the fixed model due to lack of its coverage has a resultant PDR of 12%. Figure 10 presents the PDR comparisons.
The overall data transferred and the end-to-end delivery comparisons are presented in Figure 11 and Figure 12. The proposed approach features 91% average data transferred statistics. The random way-point and random walk models are at 74% and 72%, respectively. Gauss–Markov and fixed models deliver data transfer average of 49% and 7%, respectively.
The proposed approach features a constant EED delivery timing statistics, which is 0.8%. The random way-point and random walk models result in 12.5% and 24.1%, respectively. Gauss–Markov had an EDD of 3.3% and the fixed model matches the proposed approach as it is following its fixed trajectory and consistent connection with the base station. However, this improved characteristic of the fixed model is compromised by their lesser throughput and coverage values.
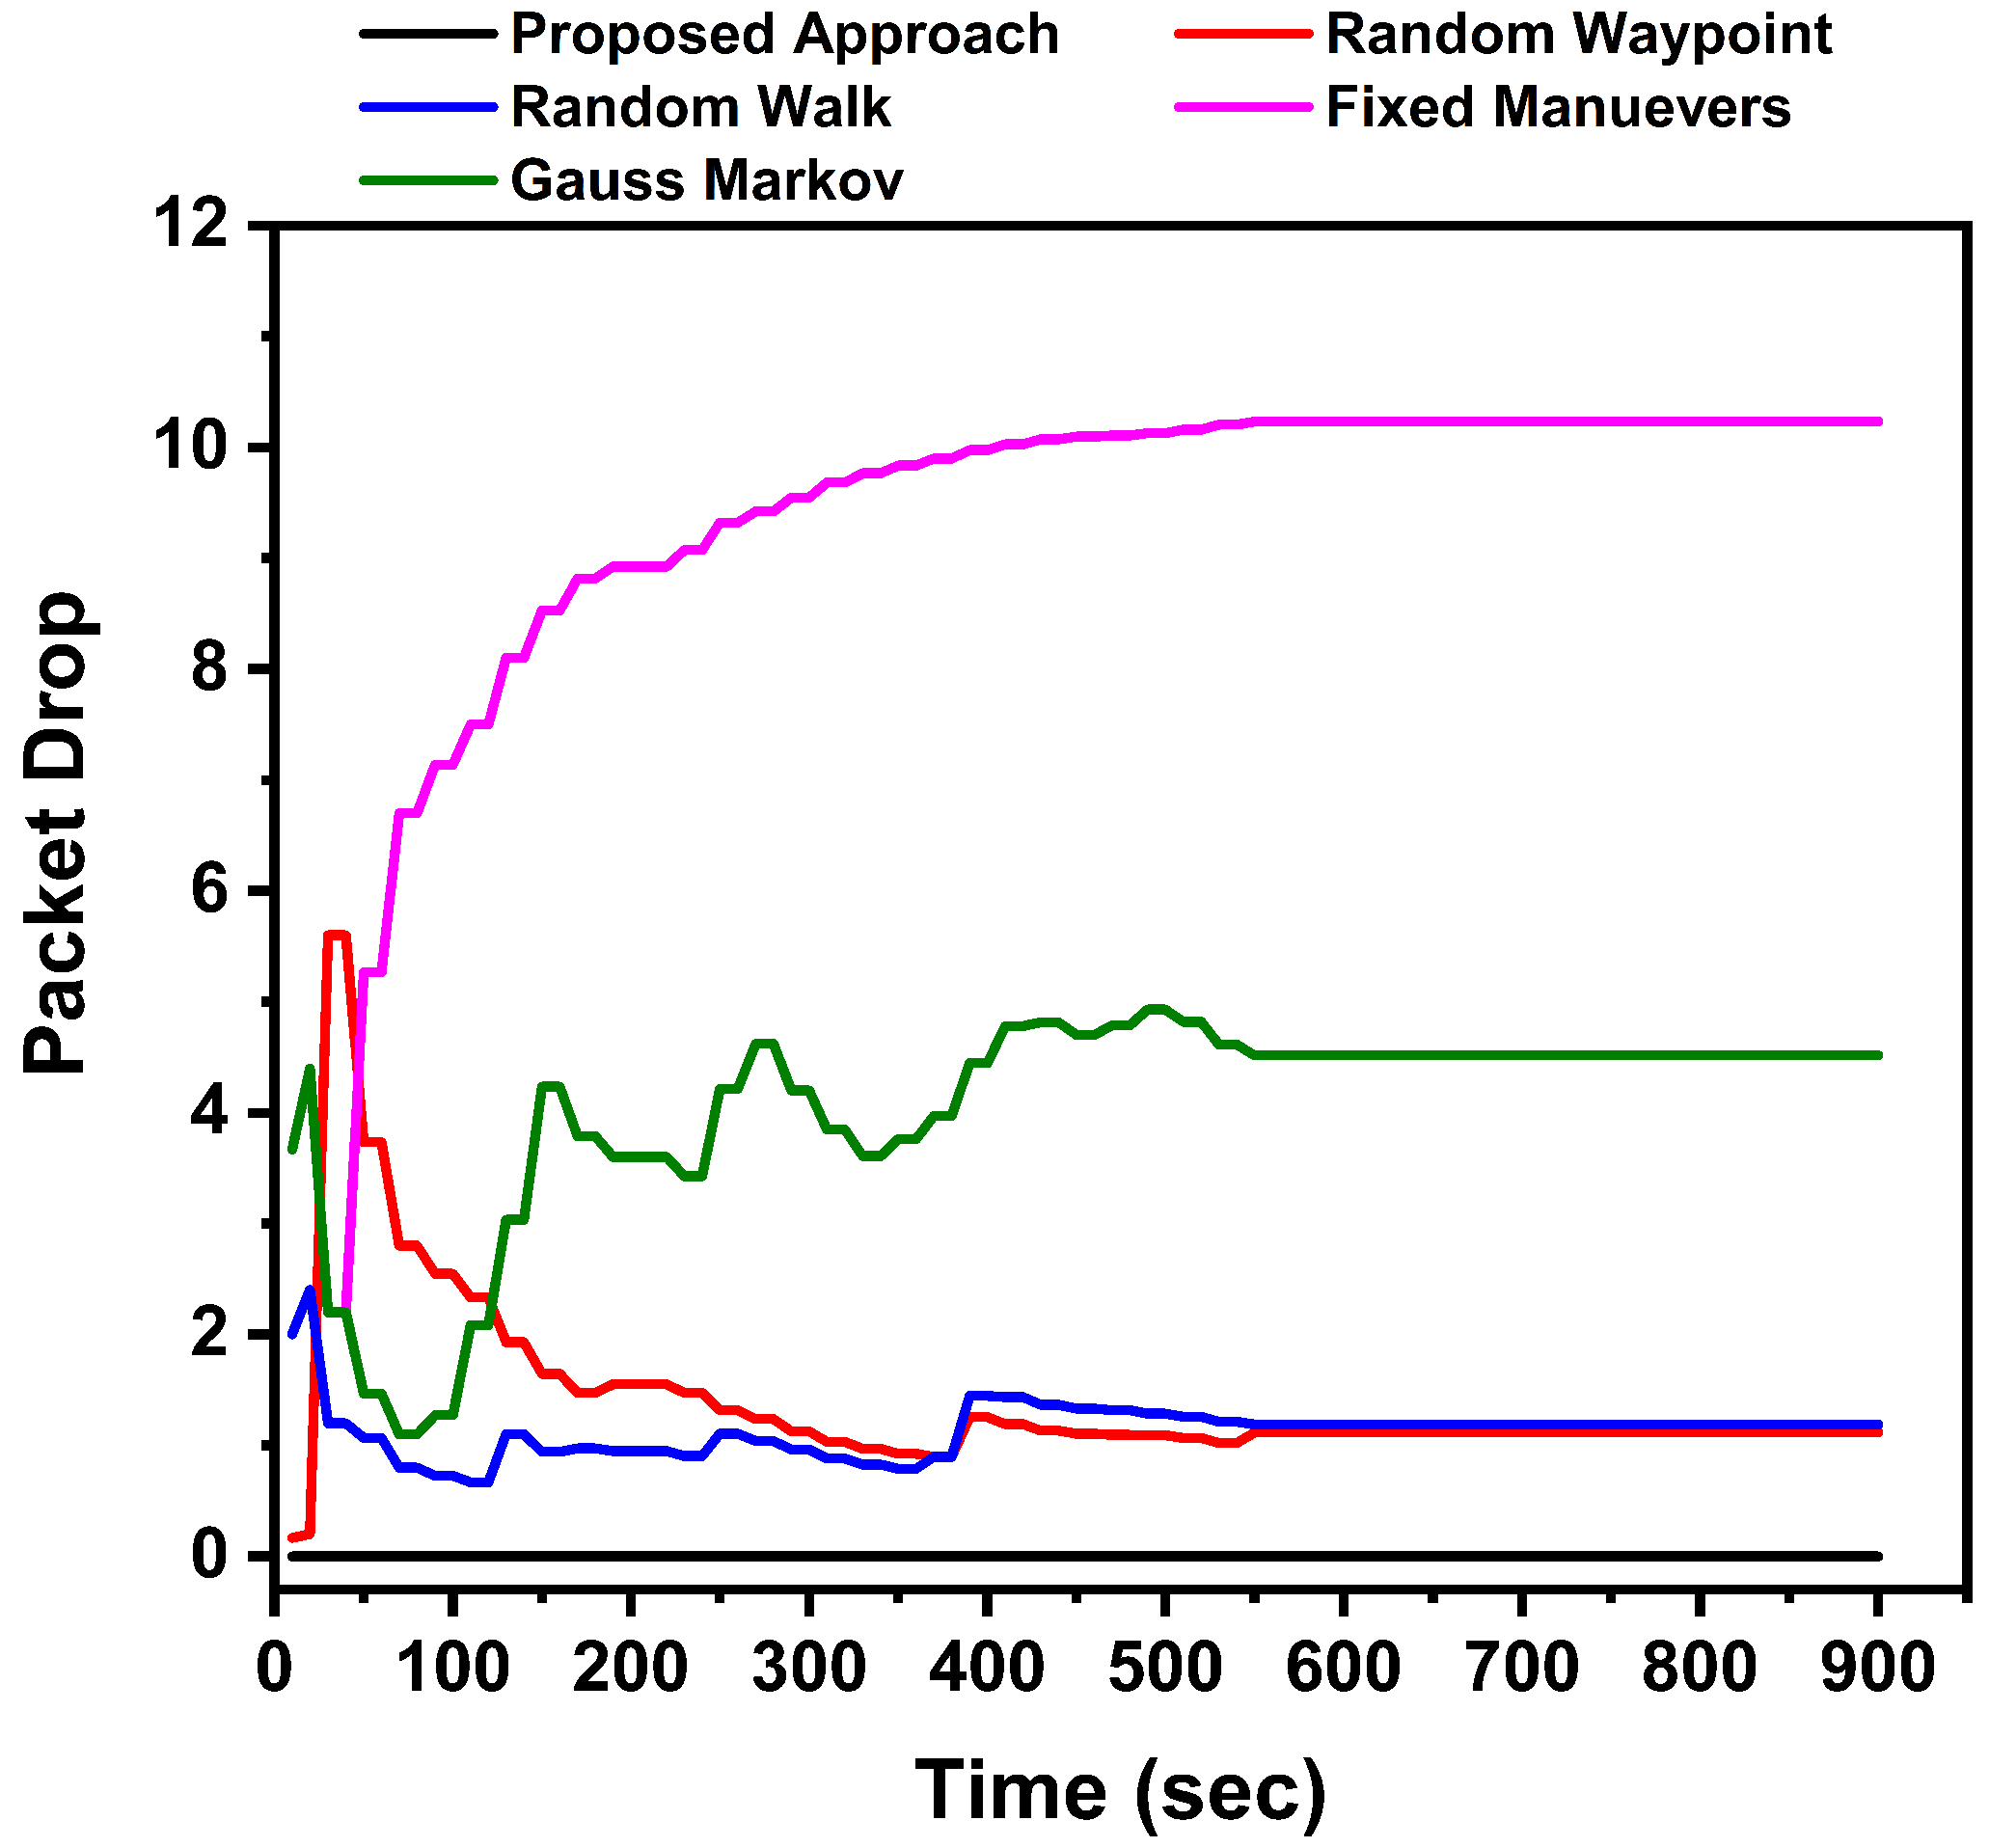
Packet drop specifies the ability of the model to avoid creating congestion or not allowing nodes to generate unnecessary traffic. Unnecessary traffic mostly comes from request-reply or data broadcast messages. Figure 13 presents the comparison of packet drop in the specified approaches. The fixed models have the highest packet drop of 83%. This high packet drop of the model is due to most of the nodes resorting to multi-hopping or frequent contestation among the nodes for data transfer. The Gauss–Markov model has a packet drop of 35%. The random way-point and random walk models have slow convergence, but coverage is high. They have a drop rate of 4.1%. The proposed approach has a high coverage, less end-to-end delivery times and delay. The packet drop ratio of the proposed approach is 0.8%.
The overall comparative analysis of the proposed approach against the standard discussed approaches is presented in Table 4. The statistical variations among the proposed and compared approaches are presented in Table 5.

6. Conclusions and Future Work

Efficient topological formations and coordinated movements help to achieve effective and sustainable UAV-coordinated WSNs. In this article, a novel mobility scheme based on the transmission density of the WSN nodes is proposed for moving UAVs in a coordinated manner for improved coverage and better performance. The proposed approach is evaluated against Random way-point, Random Walk, Gauss–Markov and Fixed Maneuver UAV movements. The random models produce close but considerably fewer performance levels as long as the WSN nodes lie in their movement corridor. The Gaussian model gives results on average performance when applied to the UAV movements. The fixed maneuvering scheme produces less delay but with a huge compromise on throughput, coverage, and latency. The proposed approach shows significant gains in coverage, throughput, jitter, and data transfer ratios. The packet drop rate is decreased exponentially and massive gains are observed for packet delivery ratio.
The proposed approach presents a generalized model for UAV traversals according to the transmission statistics of the underlying geography. The model can be extended to include multi-path traversals that will effectively result in better coverage, throughput and data transfer results in less time. The proposed approach can also be incorporated into Software Defined Networks as a controller component and thus increase its applicability towards various system models and approaches.

Author Contributions

M.A.S. and R.K. have equal contributions towards Conceptualization, Methodology, Validation, Formal Analysis and Editing. The Software Components, Simulations and Initial Writing was completed by M.A.S.

Funding

This research received no external funding

Acknowledgments

A part of this paper in the form of a security variant is submitted to the workshop associated with the 12th International Conference on Provable Security to be held on 25–28 October 2018, Jeju, South Korea.

Conflicts of Interest

The guest editor shared a similar affiliation with the authors during his earlier employment and has previously published articles with the authors. However, this study is the sole contribution of the two authors and the review works of this article were handled by the academic editor of Drones MDPI.

References

  1. Gu, J.; Su, T.; Wang, Q.; Du, X.; Guizani, M. Multiple Moving Targets Surveillance Based on a Cooperative Network for Multi-UAV. IEEE Commun. Mag. 2018, 56, 82–89. [Google Scholar] [CrossRef]
  2. Hua, M.; Wang, Y.; Zhang, Z.; Li, C.; Huang, Y.; Yang, L. Power-Efficient Communication in UAV-Aided Wireless Sensor Networks. IEEE Commun. Lett. 2018, 22, 1264–1267. [Google Scholar] [CrossRef]
  3. Sharma, V.; Kumar, R. A cooperative network framework for multi-UAV guided ground ad hoc networks. J. Intell. Robot. Syst. 2015, 77, 629–652. [Google Scholar] [CrossRef]
  4. Sharma, V.; Reina, D.; Kumar, R. HMADSO: A novel hill Myna and desert Sparrow optimization algorithm for cooperative rendezvous and task allocation in FANETs. Soft Comput. 2017, 22, 1–24. [Google Scholar] [CrossRef]
  5. Grocholsky, B.; Keller, J.; Kumar, V.; Pappas, G. Cooperative air and ground surveillance. IEEE Robot. Autom. Mag. 2006, 13, 16–25. [Google Scholar] [CrossRef] [Green Version]
  6. Uddin, M.A.; Mansour, A.; Jeune, D.L.; Ayaz, M.; Aggoune, E.H.M. UAV-Assisted Dynamic Clustering of Wireless Sensor Networks for Crop Health Monitoring. Sensors 2018, 18, 555. [Google Scholar] [CrossRef] [PubMed]
  7. Sharma, V.; You, I.; Kumar, R. Energy efficient data dissemination in multi-UAV coordinated wireless sensor networks. Mob. Inf. Syst. 2016, 2016, 8475820. [Google Scholar] [CrossRef]
  8. Ho, D.T.; Shimamoto, S. Highly reliable communication protocol for WSN-UAV system employing TDMA and PFS scheme. In Proceedings of the GLOBECOM Workshops (GC Wkshps), Houston, TX, USA, 5–9 December 2011; pp. 1320–1324. [Google Scholar]
  9. Yu, T.; Wang, X.; Jin, J.; McIsaac, K. Cloud-orchestrated physical topology discovery of large-scale IoT systems using UAVs. IEEE Trans. Ind. Inform. 2018, 14, 2261–2270. [Google Scholar] [CrossRef]
  10. Alcarria, R.; Bordel, B.; Manso, M.Á.; Iturrioz, T.; Pérez, M. Analyzing UAV-based remote sensing and WSN support for data fusion. In Proceedings of the International Conference on Information Theoretic Security, Libertad city, Ecuador, 10–12 January 2018; Springer: Berlin, Germany, 2018; pp. 756–766. [Google Scholar]
  11. Weng, C.E.; Sharma, V.; Chen, H.C.; Mao, C.H. PEER: Proximity-Based Energy-Efficient Routing Algorithm for Wireless Sensor Networks. J. Internet Serv. Inf. Secur. 2016, 6, 47–56. [Google Scholar]
  12. Harri, J.; Filali, F.; Bonnet, C. Mobility models for vehicular ad hoc networks: A survey and taxonomy. IEEE Commun. Surv. Tutor. 2009, 19–41. [Google Scholar] [CrossRef]
  13. Camp, T.; Boleng, J.; Davies, V. A survey of mobility models for ad hoc network research. Wirel. Commun. Mob. Comput. 2002, 2, 483–502. [Google Scholar] [CrossRef] [Green Version]
  14. Chiang, K.H.; Shenoy, N. A 2-D random-walk mobility model for location-management studies in wireless networks. IEEE Trans. Veh. Technol. 2004, 53, 413–424. [Google Scholar] [CrossRef]
  15. Hong, X.; Gerla, M.; Pei, G.; Chiang, C.C. A group mobility model for ad hoc wireless networks. In Proceedings of the 2nd ACM International Workshop on Modeling, Analysis and Simulation of Wireless and Mobile Systems, Seattle, WA, USA, 20 August 1999; pp. 53–60. [Google Scholar]
  16. Bettstetter, C. Smooth is better than sharp: A random mobility model for simulation of wireless networks. In Proceedings of the 4th ACM International Workshop on Modeling, Analysis and Simulation of Wireless and Mobile Systems, Rome, Italy, 15–20 July 2001; pp. 19–27. [Google Scholar]
  17. Bettstetter, C.; Hartenstein, H.; Pérez-Costa, X. Stochastic properties of the random way-point mobility model. Wirel. Netw. 2004, 10, 555–567. [Google Scholar] [CrossRef]
  18. Ko, Y.B.; Vaidya, N.H. Location-Aided Routing (LAR) in mobile ad hoc networks. Wirel. Netw. 2000, 6, 307–321. [Google Scholar] [CrossRef]
  19. Ariyakhajorn, J.; Wannawilai, P.; Sathitwiriyawong, C. A comparative study of random way-point and gauss-markov mobility models in the performance evaluation of manet. In Proceedings of the International Symposium on Communications and Information Technologies (ISCIT’06), Bangkok, Thailand, 18–20 October 2006; pp. 894–899. [Google Scholar]
  20. Broyles, D.; Jabbar, A.; Sterbenz, J.P. Design and analysis of a 3–D gauss-markov mobility model for highly-dynamic airborne networks. In Proceedings of the International Telemetering Conference (ITC), San Diego, CA, USA, 5–8 November 2010. [Google Scholar]
  21. Kuiper, E.; Nadjm-Tehrani, S. Mobility models for UAV group reconnaissance applications. In Proceedings of the International Conference on Wireless and Mobile Communications (ICWMC’06), Bucharest, Romania, 29–31 July 2006; p. 33. [Google Scholar]
  22. Atten, C.; Channouf, L.; Danoy, G.; Bouvry, P. UAV fleet mobility model with multiple pheromones for tracking moving observation targets. In Proceedings of the European Conference on the Applications of Evolutionary Computation, Porto, Portugal, 30 March–1 April 2016; pp. 332–347. [Google Scholar]
  23. Daniel, K.; Wietfeld, C. Using Public Network Infrastructures for UAV Remote Sensing in Civilian Security Operations; Technical Report; Dortmund University: Dortmund, Germany, 2011. [Google Scholar]
  24. Bouachir, O.; Abrassart, A.; Garcia, F.; Larrieu, N. A mobility model for UAV ad hoc network. In Proceedings of the 2014 International Conference on Unmanned Aircraft Systems (ICUAS), Orlando, FL, USA, 27–30 May 2014; pp. 383–388. [Google Scholar]
  25. Han, Z.; Swindlehurst, A.L.; Liu, K.R. Optimization of MANET connectivity via smart deployment/movement of unmanned air vehicles. IEEE Trans. Veh. Technol. 2009, 58, 3533–3546. [Google Scholar] [CrossRef] [Green Version]
  26. Kharchenko, V.; Kuzmenko, N. Minimization of unmanned aerial vehicle trajectory deviation during the complicated obstacles overfly. Proc. Natl. Aviat. Univ. 2012, 51. [Google Scholar] [CrossRef]
  27. Sharma, V.; You, I.; Kumar, R.; Chauhan, V. OFFRP: Optimised fruit fly based routing protocol with congestion control for UAVs guided ad hoc networks. Int. J. Ad Hoc Ubiquitous Comput. 2018, 27, 233–255. [Google Scholar] [CrossRef]
  28. Sharma, V.; Bennis, M.; Kumar, R. UAV-assisted heterogeneous networks for capacity enhancement. IEEE Commun. Lett. 2016, 20, 1207–1210. [Google Scholar] [CrossRef]
  29. Reina, D.; Ciobanu, R.I.; Toral, S.; Dobre, C. A multi-objective optimization of data dissemination in delay tolerant networks. Expert Syst. Appl. 2016, 57, 178–191. [Google Scholar] [CrossRef]
  30. Ciobanu, R.I.; Reina, D.; Dobre, C.; Toral, S.; Johnson, P. JDER: A history-based forwarding scheme for delay tolerant networks using Jaccard distance and encountered ration. J. Netw. Comput. Appl. 2014, 40, 279–291. [Google Scholar] [CrossRef]
  31. Wichmann, A.; Korkmaz, T. Smooth path construction and adjustment for multiple mobile sinks in wireless sensor networks. Comput. Commun. 2015, 72, 93–106. [Google Scholar] [CrossRef]
  32. Chandhar, P.; Danev, D.; Larsson, E.G. Massive MIMO as enabler for communications with drone swarms. In Proceedings of the 2016 International Conference on Unmanned Aircraft Systems (ICUAS), Arlington, VA, USA, 7–10 June 2016; pp. 347–354. [Google Scholar]
  33. Han, Z.; Swindlehurst, A.L.; Liu, K.R. Smart deployment/movement of unmanned air vehicle to improve connectivity in MANET. In Proceedings of the Wireless Communications and Networking Conference (WCNC 2006), Las Vegas, NV, USA, 3–6 April 2006; Volume 1, pp. 252–257. [Google Scholar]
  34. Tovkach, I.O.; Neuimin, O.S.; Zhuk, S.Y. Filtration of parameters of the UAV movement based on the RSS-measurement at the unknown power of the transmitter. In Proceedings of the 2018 14th International Conference on Advanced Trends in Radioelecrtronics, Telecommunications and Computer Engineering (TCSET), Lviv-Slavske, Ukraine, 20–24 February 2018; pp. 57–60. [Google Scholar]
  35. Wang, W.; Guan, X.; Wang, B.; Wang, Y. A novel mobility model based on semi-random circular movement in mobile ad hoc networks. Inf. Sci. 2010, 180, 399–413. [Google Scholar] [CrossRef]
  36. Zhao, J.; Gao, F.; Kuang, L.; Wu, Q.; Jia, W. Channel Tracking with Flight Control System for UAV mmWave MIMO Communications. IEEE Commun. Lett. 2018, 22, 1224–1227. [Google Scholar] [CrossRef]
  37. Liu, L.; Zhang, S.; Zhang, R. CoMP in the sky: UAV placement and movement optimization for multi-user communications. arXiv, 2018; arXiv:1802.10371. [Google Scholar]
  38. Yang, D.; Wu, Q.; Zeng, Y.; Zhang, R. Energy trade-off in ground-to-UAV communication via trajectory design. IEEE Trans. Veh. Technol. 2018, 67, 6721–6726. [Google Scholar] [CrossRef]
Figure 1. UAV application scenarios.
Drones 02 00031 g001
Figure 2. System model.
Drones 02 00031 g002
Figure 3. Proposed approach activity flow.
Drones 02 00031 g003
Figure 4. Geographical coverage comparison among the Proposed Approach, Random Waypoint, Random Walk, Fixed Manuevers and Gauss Markov.
Drones 02 00031 g004
Figure 5. Throughput comparison among the Proposed Approach, Random Waypoint, Random Walk, Fixed Manuevers and Gauss Markov.
Drones 02 00031 g005
Figure 6. QoS comparison among the Proposed Approach, Random Waypoint, Random Walk, Fixed Manuevers and Gauss Markov based on throughput levels.
Drones 02 00031 g006
Figure 7. Latency comparison among the Proposed Approach, Random Waypoint, Random Walk, Fixed Manuevers and Gauss Markov.
Drones 02 00031 g007
Figure 8. Delay comparison among the Proposed Approach, Random Waypoint, Random Walk, Fixed Manuevers and Gauss Markov.
Drones 02 00031 g008
Figure 9. Jitter comparison among the Proposed Approach, Random Waypoint, Random Walk, Fixed Manuevers and Gauss Markov.
Drones 02 00031 g009
Figure 10. Packet Delivery Ratio comparison among the Proposed Approach, Random Waypoint, Random Walk, Fixed Manuevers and Gauss Markov.
Drones 02 00031 g010
Figure 11. Amount of Data Transferred comparison among the Proposed Approach, Random Waypoint, Random Walk, Fixed Manuevers and Gauss Markov.
Drones 02 00031 g011
Figure 12. End-to-End Delivery comparison among the Proposed Approach, Random Waypoint, Random Walk, Fixed Manuevers and Gauss Markov.
Drones 02 00031 g012
Figure 13. Packet Drop comparison among the Proposed Approach, Random Waypoint, Random Walk, Fixed Manuevers and Gauss Markov.
Drones 02 00031 g013
Table 1. UAV Mobility Models.
ApproachAuthorMotivationFundamental ProcessFeaturesAnalysis
UAV Group ReconnaissanceKuiper and Nadjm Tehrani [21]Reconnaissance, Search, AcquisitionRandom Movement, Pheromone DrivenVisited Areas Marked by Pheromone Trails, Banking Decisions by Pheromone Smell IndexReal Time
Fleet Mobility ModelAtten et al. [22]Area Surveillance, Target Detection, Global UAV Connectivity, Tracking Lost TargetsNature Based Mobility using Ant Colony optimization (ACO)Marking Area using Repulsive Pheromone, Attraction Pheromone to Allow Target Detection and Follow upSimulated
Public Infrastructure for UAV Remote SensingDaniel and Wietfeld [23]Reconnaissance, Surveillance, Communication, Concept of Operations (CONOPS), Chemical, Radiological, Biological and Nuclear (CBRN)Public Wireless Infrastructure Driven, Wireless UAS BackboneHigh and low Altitude Coverage, Air to Air link, Ground level Coverage, Air to Ground link, Cellular Base StationProposed Approach
Paparazzi Mobility ModelBouachir et al. [24]Development of a Realistic Model based on Paparazzi UAV MovementsPaparazzi Movements: Stay-at, Way-Points, Eight, Scan, OvalImproved Geometric (Clustering, Frequency, Meeting, Neighbor) Measures as well as Network ParametersOmnet++
Semi-Random Circular Movement (SRCM)Wang et al. [25]Mobility Model Capable of Adapting to the Spatial RandomnesSmooth Transition Movements, Constant Radial TurnsScanning Large Areas in less Time, Potentially Increased Flight Time, Avoiding Unreasonable Flight PathsNS2
Ground Node Based UAV deploymentHan et al. [25]Optimized Mobile Ad Hoc Network (MANET) ConnectivityHeuristic UAV Placement Algorithm, Managed Velocity and Movement Direction for Increased ConnectivityIncreased Probable Message Propagation, Decreased Probable Network DivisionMiniature Hardware
Minimized Trajectory DeviationKharchenko and Kuzmenko [26]UAV collision avoidanceDimensions of State Information (vertical, horizontal or three dimensional), Conflict Detection Threshold, Conflict Resolution MethodMinimized Trajectory DeviationReal Time
Table 2. Symbol Table.
SymbolDescription
H d Average One Hop Distance
R T Number of Transmission per Unit Time
S i Number of Nodes Transmitting per Unit Time
C n Number of Nodes in a Sector/Square/Region
S a Sector Area
R T s y s Number of Transmissions per Unit Time in the System
S i s y s Number of Nodes Transmitting per Unit Time in the System
C n s y s Number of Nodes in the System
S a s y s Overall System Area
T A , a r e a Average number of Transmissions in a Self Cluster
T A , s y s t e m Average number of Transmissions in Overall System
F A Attraction Function of a Sector/Square/Region
F A s y s Attraction Function for the Overall System
W e Edge Weight
W e + Normalized Edge Weight
D b Average Hops Towards Base Station
D d Average Hops Towards Neighbouring Dense Sector/Square/Region
Table 3. Simulation Settings.
Simulation SettingsValues
Ground Nodes100
UAV1
Ground Node TypeStatic WSN
Area 1200 × 1200 m 2
WSN-WSN CommunicationIEEE 802.11, Direct Sequence Spread Spectrum (DSSS) Rate 1 Mbps
WSN UAV CommunicationLow Power Wide Area Network (LPWAN), 2 km Line of Sight Transmission
Propagation Loss ModelFiss Propagation Loss Model
Packet Size512 bytes
Data Rate5120 bytes/s
Data Burst10 s
Bit RateConstant
ProtocolUser Datagram Protocol (UDP)
SimulationNS3
AnalysisMatlab
Table 4. Comparative Analysis of the Proposed Approach against the featured techniques.
MetricsProposed ApproachRandom Way-PointRandom WalkGauss MarkovFixed Maneuvers
Coverage98%91%90%55%10%
Throughput82%74%72%55.7%7.1%
Latency8.3%12.5%12.5%16%86%
Delay0.625%11.25%35.625%5%0.625%
Jitter2%9%6%5%2%
PDR99%91%90%60%12%
Data Transferred91%74%72%49%7%
EED0.8%12.5%24.1%3.3%0.8%
Packet Drop0.8%4.1%4.1%35%83%
Table 5. Statistical variation among proposed and compared approaches.
MeanStd. Dev.Std. Error of MeanVarianceModeMedian
Coverage
Proposed Approach67.3730.813.25949.56100.0073.50
Random Waypoint63.9028.883.04833.8989.0079.00
Random Walk65.8827.702.92767.3290.0079.00
Fixed Maneuvers7.900.670.070.458.008.00
Gauss–Markov43.9916.911.78285.9059.0051.00
Data Transferred
Proposed Approach411,306195,463.9898820,603.713623.82062  × 10 10 632,340432,540
Random Waypoint369,756164,153.4694117,303.294972.69464  × 10 10 511,920453,060
Random Walk371,694155,860.5364616,429.143092.42925  × 10 10 508,680443,340
Fixed Maneuvers46,9323952.15976416.594221.56196  × 10 7 47,52047,520
Gauss–Markov254,61096,515.7573610,173.654119.31529  × 10 9 340,740292,140
Delay
Proposed Approach0.012984.3795  × 10 4 4.61639  × 10 5 1.918  × 10 7 0.012740.01306
Random Waypoint0.193160.229990.024240.052890.093230.10398
Random Walk0.614130.203250.021420.041310.510450.51045
Fixed Maneuvers0.002080.00191.998  × 10 4 3.59281  × 10 6 0.001040.00117
Gauss–Markov0.022590.018010.00193.2448  × 10 4 0.04450.00903
End to End Delivery
Proposed Approach0.006942.72533  × 10 4 2.87275  × 10 5 7.42745  × 10 8 0.006860.00688
Random Waypoint0.121330.158180.016670.025020.051690.05744
Random Walk0.365070.136330.014370.018590.294290.29429
Fixed Maneuvers0.006195.29694  × 10 5 5.58346  × 10 6 2.80575  × 10 9 0.006190.00619
Gauss–Markov0.019140.01670.001762.78986  × 10 4 0.039480.00578
Jitter
Proposed Approach0.006243.28373  × 10 4 3.46136  × 10 5 1.07829  × 10 7 0.005920.00626
Random Waypoint0.099540.118810.012520.014120.047850.05345
Random Walk0.345260.120740.012730.014580.278260.27826
Fixed Maneuvers9.41456  × 10 4 8.51129  × 10 4 8.97169  × 10 5 7.2442  × 10 7 4.69991  × 10 4 5.31537  × 10 4
Gauss–Markov0.011710.010220.001081.04357  × 10 4 0.024140.0037
Latency
Proposed Approach0.08810.001181.24404  × 10 4 1.39287  × 10 6 0.088390.08838
Random Waypoint0.099360.014690.001552.15671  × 10 4 0.093630.09363
Random Walk0.094950.003113.27508  × 10 4 9.65355  × 10 6 0.095420.09542
Fixed Maneuvers0.765250.321490.033890.103361.048320.92693
Gauss–Markov0.133030.012870.001361.65581  × 10 4 0.139340.13934
Packet Drop
Proposed Approach0.0000.0000.0000.0000.0000.000
Random Waypoint1.4090.8500.0900.7221.1161.116
Random Walk1.1350.2440.0260.0601.1891.189
Fixed Maneuvers9.2801.7330.1833.00210.23210.095
Gauss–Markov4.0280.9590.1010.9204.5164.516
Packet Delivery Ratio
Proposed Approach1.000000.000000.000000.000001.000001.00000
Random Waypoint0.871950.077240.008140.005970.898560.89856
Random Walk0.896780.022060.002330.000490.891980.89198
Fixed Maneuvers0.169480.154890.016330.023990.084210.09524
Gauss–Markov0.634990.086800.009150.007530.591070.59107
Throughput
Proposed Approach5.676420.083610.008810.006995.656835.65727
Random Waypoint5.103920.503640.053090.253655.340295.34029
Random Walk5.271200.160140.016880.025645.240215.24021
Fixed Maneuvers0.959800.877020.092450.769160.476960.53941
Gauss–Markov3.800160.438920.046270.192653.588433.58843

