
Drones, Deep Learning, and Endangered Plants: A Method for Population-Level Census Using Image Analysis

1
College of Science, Utah Valley University, Orem, UT 84058, USA
2
Shrub Sciences Laboratory, Rocky Mountain Research Station, USDA Forest Service, Provo, UT 84606, USA
*
Author to whom correspondence should be addressed.
Drones 2021, 5(4), 126; https://doi.org/10.3390/drones5040126
Submission received: 13 September 2021
/
Revised: 15 October 2021
/
Accepted: 25 October 2021
/
Published: 28 October 2021
(This article belongs to the Special Issue Ecological Applications of Drone-Based Remote Sensing)
Abstract
:A census of endangered plant populations is critical to determining their size, spatial distribution, and geographical extent. Traditional, on-the-ground methods for collecting census data are labor-intensive, time-consuming, and expensive. Use of drone imagery coupled with application of rapidly advancing deep learning technology could greatly reduce the effort and cost of collecting and analyzing population-level data across relatively large areas. We used a customization of the YOLOv5 object detection model to identify and count individual dwarf bear poppy (Arctomecon humilis) plants in drone imagery obtained at 40 m altitude. We compared human-based and model-based detection at 40 m on n = 11 test plots for two areas that differed in image quality. The model out-performed human visual poppy detection for precision and recall, and was 1100× faster at inference/evaluation on the test plots. Model inference precision was 0.83, and recall was 0.74, while human evaluation resulted in precision of 0.67, and recall of 0.71. Both model and human performance were better in the area with higher-quality imagery, suggesting that image quality is a primary factor limiting model performance. Evaluation of drone-based census imagery from the 255 ha Webb Hill population with our customized YOLOv5 model was completed in <3 h and provided a reasonable estimate of population size (7414 poppies) with minimal investment of on-the-ground resources.
1. Introduction
The use of deep learning (AI or artificial intelligence) methodology for object identification is a fast-moving area of research that has only recently been applied to the analysis of UAV (drone) imagery [1]. In this paper we describe an application of the deep learning object detection model YOLOv5 [2] to locate, identify, and enumerate individual plants of a single plant species in its desert habitat. This work represents the next step in our efforts to perform a range-wide census based on drone imagery for the endangered dwarf bear poppy (Arctomecon humilis), an evergreen perennial species endemic to gypsum badlands habitat at the northeastern edge of the Mojave Desert of southwestern Utah, USA [3,4].
All known dwarf bear poppy populations occur in close proximity to a rapidly expanding urban area, St. George, Utah. It is estimated that the species has already suffered extirpation due to urban development over half of its original range [4]. Detailed knowledge of plant abundance and patterns of distribution (i.e., population-level data) is fundamental to understanding the ecology of rare plant species and is especially important for implementing effective conservation measures [5,6,7,8]. According to the US Fish and Wildlife Service, population-level census data are essential for management planning to mitigate further losses in the face of intensive off-road recreational use, urban development, and other anthropogenic threats to the dwarf bear poppy [4].
Arctomecon humilis is sparsely and discontinuously distributed across 3650 ha of fragile and largely inaccessible habitat (Figure 1); see [4] for map. Concerns over disturbance of biological soil crust in this unique environment have precluded the use of traditional on-the-ground census methodologies, which would often not be feasible due to the rugged, steep, and fragile nature of the terrain. Consequently only 5% of the area has ever been systematically censused, and even rough estimates are unavailable for the Red Bluffs population, which occupies over two-thirds of the total range [4]. This species is a good candidate for a remote sensing approach because it grows in sparsely vegetated habitat (Figure 1), and because of its unique blue-green color and mounding growth form (Figure 2b).
We began our efforts to use drone imagery analysis to census this species in 2018 and have completed census for three of the eight formally recognized populations [4] based on visual analysis of the resulting imagery [3,9]. Relatively inexpensive and easy-to-use drones equipped with high resolution cameras are capable of low-altitude flights over relatively large areas in short time frames. This has made it possible for us to complete imagery acquisition for the species across its entire 3650 ha range. However, a major drawback is the time required for imagery processing and analysis, particularly the visual enumeration of individual plants. To solve this problem, we investigated how drone-acquired census imagery could be analyzed using deep learning models to identify and count the individuals of our species of interest in the imagery.
Many studies have used drones along with deep learning models to collect data in agriculture [10,11,12,13], and there are publications describing this approach for a variety of wild organisms, including plant species in general [14,15,16,17,18,19] and especially invasive species [20,21,22,23]. Interest in using drone imagery as a tool in rare plant conservation is increasing [14], but to our knowledge no published studies to date have successfully applied a deep learning approach to drone-acquired imagery with the goal of enumerating individuals of a rare plant species. Reckling et al. [24] were able to visually identify individuals of their herbaceous target species with the aid of an a priori species distribution model, but they were not successful in their efforts to use AI for species recognition in drone imagery. Our specific objectives in this study were to: (1) report on detection accuracy of the YOLOv5 model trained on a custom drone-based imagery dataset for dwarf bear poppy, (2) compare the accuracy of the YOLOv5 model against a human worker trained in identifying dwarf bear poppy in drone imagery, (3) evaluate the effect of image quality on model accuracy, and (4) present the results of a drone/AI census for one population of the target species (Webb Hill). We emphasize our approach for building a deep learning model in an effort to provide a beginning road map to aid conservation researchers considering the use of AI for drone-based census of other plant species.
2. Materials and Methods
2.1. Study Area
In the current study, we conducted a drone-based census of the Webb Hill population, which represents roughly 12% of the total suitable habitat for the poppy. We were limited to census of the lands managed by the Bureau of Land Management (BLM) along with some state and county-managed lands for a total of 255 ha. We were unable to census any of the privately-owned land, mainly because these areas were under construction or already built upon. Additionally, we analyzed census and validation flights from across a small subset of the Red Bluffs population as an area of interest (n = 6 flights) for testing the deep learning model against a human worker with imagery that differed in quality from the Webb Hill imagery.
2.2. Drone Flights and Imagery Processing
Our protocol for acquiring and processing drone imagery for analysis is described in detail in our earlier papers [3,9]. For the present work, drone flights were made using DJI Phantom 4 Pro V2 drones (SZ DJI Technology Co. Ltd. Shenzhen, China), which were equipped with a stock 20 MP camera (f/2.8-f/11, 84° FOV). Drone census flights at Webb Hill were conducted during the late fall of 2019 (October–November). Flights were made at 40 m above ground level (AGL) with the following settings adjusted within the flight planning app: 70/70 side/front image overlap, ISO 100, “Auto” shutter speed (vs aperture or shutter priority), and white balance set to “Cloudy”. We carried out 36 census flights across the population, capturing 9666 images and covering roughly 255 ha of habitat. Due to poor image quality, imagery captured from two flights (flights 10 and 32, respectively) were excluded from analysis. In addition to census flights, we conducted 15 m AGL validation flights across a subset (n = 6 plots) of areas flown for census in order to validate the poppy detection at census-level.
All drone census and validation flights were carried out by a two-person team, each operating a drone. Both drone operators were Part 107 licensed with the Federal Aviation Administration (FAA) and were authorized to conduct flights with the FAA, BLM, and U.S. Fish and Wildlife Service (USFWS). The total time in the field was 24 h per person for a total of 48 person hours.
The collected images were organized by flight and copied into an in-house imagery storage database. All imagery was processed in Adobe Photoshop (Photoshop CC 2020, Adobe Systems Inc., San Jose, CA, USA) to correct for light and color distortions within the imagery as described in our earlier work [3]. The images were then processed into orthomosaics using Pix4D software (Pix4D S.A., Lausanne, Switzerland) and each orthomosaic was loaded into ArcGIS Pro (ESRI, Redlands, CA, USA) for further analysis. Orthomosaics were used as the basis of the training imagery that was used to build the deep learning model, to conduct the model-versus-human comparison of detection accuracy, and to carry out the full Webb Hill drone-based census.
2.3. Building the Deep Learning Model
2.3.1. YOLOv5 Basics
For poppy detection in drone imagery, we used the “You Only Look Once”, or YOLOv5, model, the 5th version of the YOLO family of object detection models [2]. The YOLOv5 model comes pre-trained on the COCO dataset [25], which provides baseline weights for hyperparameter settings, resulting in drastically reduced training times when training on a customized dataset. This version of YOLO was designed to be particularly accessible to people who do not necessarily come from a computer programming background [26]. The YOLOv5 model uses the PyTorch framework (as opposed to Darknet), which makes integrating a local GPU for training and inference (using the trained model to detect objects and predict classes) relatively easy. This was ideal for our purposes.
In simple terms, the YOLO model works by first creating features in the training image (backbone), which are then passed to the next layer; these features are then mixed, matched, and combined in various ways (neck); and then finally, bounding boxes are drawn around predicted objects (Figure 3a; passed features from previous layers), and a class prediction with level of confidence is made for each predicted object (head). The model then runs inference on an internal validation dataset. Based on the results, the model adjusts the hyperparameters and applies the changes during the next epoch. This is why the model is said to “learn”. For more detailed information on how YOLOv5, as well as other YOLO models are designed and function, please see these references [2,27,28,29,30].
We experimented with several different sizes of the YOLOv5 model by training with our dataset on both the local GPU (NVIDIA GeForce GTX 1080) and cloud-based GPU (Google CoLaboratory Pro. Google LLC. Mountain View, CA, US; Tesla P100) for a relatively short amount of time (≥250 epochs). We selected the YOLOv5 small model for poppy detection due to its relatively fast training times, as well as high detection accuracy. Training results from the other model sizes were comparable in accuracy but much slower in training-times.
2.3.2. Training Imagery Selection
To build a training dataset of poppy images, we first had to ensure the images being fed to the model were confirmed poppies. This may seem obvious, but images of poppies collected from 40-m AGL were often blurred or color distorted and were sometimes not easy to distinguish from similar-looking plants or from the background (Figure 3a). To mitigate this problem, we used only census (40 m AGL) imagery from areas that also had validation (15 m AGL) imagery. The visual difference in image quality from 40 to 15 m AGL is quite dramatic (Figure 3), and the majority of poppies can be reliably confirmed in the 15 m AGL imagery [9]. Training images were obtained from across all poppy populations for which drone imagery was available. However, the majority of the training images were from the Webb Hill and Red Bluffs populations.
2.3.3. Imagery Annotation and Model Training
The YOLOv5 model requires an input of annotated training images representing the target object class, along with a corresponding comma separated values (csv) file containing bounding box coordinates and class labels, for each image. We chose two target classes to train the model: poppy, specifically non-flowering poppies; and similar vegetation. We found that providing the model with additional objects (other plant or plant-like objects from the same census imagery) that were labelled as not poppies (i.e., similar vegetation) resulted in higher model precision. The source training imagery was from the individual census flight orthomosaics. To use orthomosaics for training, we first had to divide the larger orthomosaic into individual tiff images of 416 × 416 pixels each. We used images of this size to speed up model training, and because this area was sufficiently small to draw bounding boxes closely around our target objects. The model can use images of various sizes, but use of larger-sized images greatly increases the model training time.
We used the python-based tool LabelImg [31] to annotate all images. Annotation was done by manually drawing bounding boxes around the target objects and labeling each box with its appropriate class. We annotated 389 images resulting in 1975 total annotations—755 poppy annotations, and 1220 similar plant annotations. We uploaded the images into an image processing framework, Roboflow (Roboflow, Inc. Des Moines, IA, USA), to separate the images into training and validation, as well as to perform additional image augmentations. Within Roboflow, the images were randomly separated into training and validation subsets of 245 training and 144 validation images, respectively. Further, each of the 245 images had three additional “augmentations” performed per image, resulting in 980 training images for model input. The augmentations were randomly selected from the following five user-selected options: 90° rotate (clockwise, counterclockwise); crop (0% to 39%); saturation (between -29% and 29%); brightness (between -25% and 25%); and exposure (between -8% and 8%). Each specific augmentation was randomly applied within the settings shown in parenthesis above. Augmentations were subjectively chosen in order to bolster the number of training images and to give the model a wide variety of possibilities for how poppies could appear in the imagery.
Using the YOLOv5s model baseline weights (from the COCO dataset), we trained our custom model for 9000 epochs across five separate training runs (4 runs for 1000 epochs, 1 run for 5000 epochs) taking roughly 10.4 h to complete. The final weights file was saved for inference use or for additional model training. The training was done in the cloud with Google Colab Pro.
2.4. A.I. Model vs. Human Poppy Detection
To test the utility of using our customized model for census across relatively large areas, we ran model inference on imagery in test plots that had not been previously used for model training or validation, but for which both census (40 m) and validation (15 m) imagery were available. The same area was also evaluated by a worker trained to visually detect poppies in the imagery. We used precision and recall as our metrics for evaluating the accuracy of both the model inference and human evaluation results. Precision is calculated as the number of correctly marked objects divided by the total number of marked objects (error of commission), whereas recall is the number of correctly marked objects divided by the total number of objects present (error of omission). We evaluated n = 11 plots from two poppy populations, Webb Hill (n = 5) and an area of interest (AOI, n = 6) at the Red Bluffs population. Each test plot was made up of 48 images of 416 × 416 pixels (approximately 4.78 × 4.78 m) each, representing a contiguous area within the plot. The total area examined across the test plots was approximately 1.21 hectares. All test plots had poppies present in ≥ 1 image, but poppies were not present in many of the individual images of the respective test plot. As mentioned previously, the Webb Hill imagery was collected in late fall 2019 (Oct-Nov), while the Red Bluffs imagery was collected in spring 2020 (March) prior to poppy flowering (Figure 2b). We used imagery from two populations to compare the results of model inference and human evaluation on higher quality imagery relative to the lower quality Webb Hill imagery. We suspected the obvious, that the higher quality imagery would yield better evaluation results, but we also wanted to better understand what the optimal imagery capture conditions are for the dwarf bear poppy. In the Webb Hill imagery, poppies were far less conspicuous due to the presence of spent inflorescences. These largely obscured the distinct blue-green poppy foliage, making them difficult to separate from similar vegetation or even from the background. In contrast, the Red Bluffs imagery was taken in the spring following a rainstorm, which made the blue-green poppy foliage stand out against the wet and darkened background. Additionally, the previous season’s spent inflorescences were mostly no longer present on the plants (Figure 2b).
We used the methods developed by Rominger and Meyer [3] as the basis of our evaluation and validation of the test plots. All the census tiles in each plot were passed through model inference and separately evaluated by the human worker. Worker evaluation was done in Adobe Photoshop, where scale and zoom could be manipulated to closely examine and ultimately mark each plant. Any basic photo software could be used for this type of evaluation, as long as the software has a zoom-in function. After the model and the human worker completed detections on the test plots, each set of results was evaluated and scored against the validation imagery by a second trained worker who did not take part in the test plot evaluations. Each object detected by either the model or by the human worker was checked against the validation imagery to confirm if the identified plants were poppies and to identify any poppies that were missed. Plants were scored as either marked/not confirmed, marked/confirmed, or missed. Detected plants that could not be confirmed in the validation imagery as poppies were scored as marked/not confirmed, which drove the precision metric (confirmed/marked). Poppies that were not detected were scored as missed, which negatively impacted the total recall percentage (confirmed/actual). However, poppies that were <5 cm in diameter were excluded from consideration, regardless of whether they were detected or missed by either the model or worker. This was because poppies <5 cm could not always be reliably identified in the validation imagery. The time required for model inference and for visual evaluation of each plot was also recorded.
2.5. Drone/AI Census of Webb Hill
2.5.1. Model Inference
To accurately perform model inference, the same image size used for model training was required as input for the trained model. We processed our previously generated census-level orthomosaics (n = 36) into individual 416 × 416 px images, resulting in ~147,000 individual images for inference. We developed a customized python script to automate the process of tiling the orthomosaics into individual tiff files, moving the files to the inference directory, and merging the resulting inference csv files into one csv for each individual flight.
All 147,000 images were run through inference on the local GPU. The detection threshold was set to 50% confidence, meaning that only objects predicted with >50% confidence were displayed. At this level of confidence, we obtained higher precision, but at the cost of lower recall. If the confidence was set lower, better recall was achieved, but at the cost of lower precision. This tradeoff is unavoidable, so we used a balanced confidence level that worked well for our purposes. When the model detected a poppy, a bounding box was drawn around the poppy (Figure 3a) and a copy of the corresponding image was saved, along with a separate csv file containing coordinates of the bounding box(es), class, and confidence level. From the csv files for each flight, we tabulated the number of detected poppies, as well as the duration of inference, and entered these data into a spreadsheet for further analysis.
We validated the bounding boxes in the census areas that had corresponding validation imagery using the same validation methods described earlier (Section 2.5.1) across n = 6 validation flight areas. For the purpose of estimating true population size, an accounting of missed and misidentified poppies was needed. We calculated a correction factor to apply to the final number of poppies detected by the model that takes these errors into account. The correction factor was calculated as precision multiplied by the inverse of recall. This made the correction factor for missed poppies a number >1, which increased the estimated number of plants, thereby accounting for missed or undetected poppies. Finally, multiplying by precision (which is always ≤1) decreased the total number of estimated poppies, thereby accounting for mis-identified detections. The visual validation process took roughly 2 h for each validation plot.
3. Results
3.1. A.I. Model Accuracy
Model accuracy was evaluated by the precision and recall metrics after training for 9000 epochs. The final custom-trained YOLOv5 model had an average precision of 0.64 and an average recall of 0.55. However, this result reflects both training classes (poppy and similar vegetation). Looking specifically at the poppy class precision (Figure 4a), the model consistently performed at greater than 0.8 at nearly all confidence levels. Poppy class recall was not as high as precision but was still reasonably accurate between 0.5 and 0.8 recall until around 0.85 confidence when it sharply declined (Figure 4b). At 0.5 confidence, recall was still greater than 0.6, which provided sufficient accuracy. We found that these predicted metrics for precision and recall reflected favorable model performance relative to the metrics obtained by visual detection in our earlier work [3].
3.2. A.I. Model vs. Human Comparison
3.2.1. All Test Plots
In comparing test plot evaluations carried out by a trained worker to the AI model inference results, the AI model had higher precision and recall across all test plots as well as when plots were evaluated by population, with the exception of slightly lower recall across the Red Bluffs plots (Table 1). The model was 1.36× higher in precision than the human worker: model 0.83 precision vs. human 0.67. It was also slightly better at recall: 0.74 recall vs. 0.71 for the trained worker. In measuring inference/evaluation time across each plot as well as all plots pooled, the AI model was significantly faster than the human worker. Inference by the model for all plots required less than one minute (0.56 min), while the worker evaluation required 657 min (ca. 11.0 h), for an inference/evaluation improvement of over 1100 times by the AI model. All other metrics being equal, these time savings alone would make the drone/AI census method much more advantageous when scaled up to the entire 255 ha census area than either visual detection in the imagery or traditional on-the-ground methods.
3.2.2. Imagery Quality Difference: Webb Hill vs. Red Bluffs Plots
Breaking down the test plot evaluations into their respective populations showed higher precision and recall for both the model and the human worker with the Red Bluffs imagery (Table 1). This result was not surprising, as we knew the Webb Hill imagery quality was not as good as the imagery from Red Bluffs, due to the non-optimal condition of the plants in the late fall season as well as often shadowy conditions due to the short day length. However, given the lower quality imagery at Webb Hill, the model still had 0.78 precision and 0.66 recall, which was much higher than the human worker (0.64 and 0.58 for precision and recall, respectively). These results underscore the usefulness of obtaining imagery under optimal flight conditions in the field, in terms of both plant phenology and light conditions and that poppy detections for both AI and human were more accurate when imagery is captured in more favorable conditions.
3.3. Webb Hill Census Imagery Analysis
Orthomosaics representing the Webb Hill census imagery covered a total area of 246.2 ha and consisted of 34 flights (accounting for the two flights that were not analyzed) that varied in area covered ranging from 0.28–19.3 ha (Table 2). Processing the imagery into orthomosaics took 4248 min (70.8 h), which is mostly computer runtime rather than worker labor. Once the orthomosaics were tiled into 416 × 416 px images for analysis, total model inference time was 147.2 min (2.45 h), with inference times that were approximately proportional to flight area and that ranged from 0.7 min (flight 13) to 14.8 min (flight 7; Table 2). Of the 147,411 image tiles passed through inference, the model detected and drew bounding boxes on poppies in 4994 individual images (Figure 5, only 3.4% of total images had poppies detected). The total number of poppies marked in the imagery was 6283, which means that some tiles contained ≥ 1 detected poppy (Table 2). Most marked poppies (74%) were concentrated in the ten most-populated flight areas, while the 10 least-populated flight areas collectively included only 5.4% of total marked poppies. Much of this difference was due to differences in the areal extent of the flights, but even when area is taken into account, the flights that included 74% of the poppies only accounted for 38% of the area, indicating that poppies were concentrated in these areas. The ten least-populated flight areas occupied 21% of the total area, so that poppies at 5.4% of the total were markedly underrepresented.
Overall, the density of marked poppies was extremely low (26.5 poppies-ha−1). Much of the area, although comprised of gypsum soils, was likely not suitable habitat, resulting in clustering of the poppies in the most favorable areas, an effect observed in previous census evaluations for this species [3]. This demonstrates the utility of drone-based census methods as opposed to on-the-ground census, as locating so few poppies scattered over such a large area would be a daunting task on the ground.
When the correction factor based on precision (0.78) and recall (0.66) was applied to the number of marked poppies at Webb Hill, we obtained an estimate of 7414 poppies in the census area in autumn 2019. The total time to complete the census and analysis was 7995 min (~133 h). The on-the-ground/field time was 48 h, or 37% of the total time, with the remaining 63% or 82 h consisting of computer runtime with very little worker time involved.
4. Discussion
In this paper, we present evidence that we have solved a major limitation of the previous drone-based census methodology that this work was built upon [3]. By incorporating the use of an AI model to detect poppies in drone imagery, we have essentially eliminated the bottleneck of visual imagery evaluation. We also showed that the AI model performed better than a trained worker in both precision and recall. Finally, we presented the results of the drone-based Webb Hill census and AI poppy detection and enumeration to show that the AI approach is feasible at the population level. Our results show that we have developed a viable census method worth investigating for additional plant species.
4.1. Limitations of Drone Census and AI Evaluation Methods
There are some limitations to using drones and AI models for poppy census. One of our biggest issues with detection accuracy was differences in image quality. Using imagery taken from 40 m AGL was problematic, especially when captured in unfavorable seasons. We did not anticipate the presence of spent inflorescences on the poppies to obscure the blue/green poppy foliage (Figure 5). In fact, we thought the inflorescences would make the poppies even more distinct in the imagery. Additionally, even between-flight imagery quality was an issue (Table 2); this was mainly due to the drone not maintaining a consistent 40 m AGL. We flew the Webb Hill population in late 2019, well before we began methods development to use an AI-based object detector. Ideally, we would have flown test plots and used that imagery directly with a trained AI model. The results could then have guided us in mission planning in terms of how many validation plots were needed, or even to a conclusion that census flights would need to be flown at lower altitude. Imagery quality is the key to AI model detection success, and we learned the hard way that some of our imagery was not adequate for higher precision and recall results. By greatly reducing the time needed for image analysis, AI will potentially make it possible to better optimize conditions for image acquisition, as there will be more time to spend in the field and more opportunity to choose the best seasonal window for image acquisition.
There will always be a lower detection limit, whether using deep learning technology or with human workers. We made the decision to limit the size threshold for poppies based on how well we could reliably verify them in validation imagery. We settled on excluding poppies <5 cm in diameter, as poppies this small are not big enough to flower, which is a metric for determining if a seedling has recruited into the population. We know that there are many occasions when poppies can be detected and verified reliably when they are <5 cm in diameter; however, both precision and recall are greatly improved when poppies below this size threshold are excluded.
The final limitation discussed here is imagery processing time. Though most imagery processing time is computer runtime rather than worker labor, imagery processing is still a very time-consuming process. We processed 33 census flights that required 72.9 h of computer runtime for the Webb Hill census, an average of about 2 h of computer runtime per flight (Table 2) using a relatively high-powered workstation. This process can likely be dramatically improved by processing with a supercomputer either in the cloud or locally. To use drone-based plant census methods for larger populations, processing times for producing orthomosaics from raw imagery will need to be greatly improved.
4.2. Advantages of Drone Census and AI Evaluation Methods
There are, however, many advantages to using drones for plant census. One of the big advantages is the sheer amount of data that can be gleaned from imagery in addition to counts of individuals of the target species. Processing imagery into orthomosaics using Pix4D also allows for the creation of digital elevation models (DEMs), from which additional environmental variables can be extracted (such as slope, aspect, hydrology features, etc.) and analyzed for use in other models (i.e., a fine-scale species distribution model (SDM)). The detected poppy bounding boxes output csv file allows for plotting the poppies into mapping software where geospatial tools can be employed to look at clustering patterns or distance relationships and relationships with environmental variables. The amount of information that can be extracted from drone imagery is staggering.
Our work in this project has focused on analyzing census-level data to get counts of individuals in the population. However, using deep learning to perform classification within the target species could also be used to look at and measure other types of information. This could make it possible to develop a method for large-scale monitoring and demographic studies, similar to our earlier demographic study for the dwarf bear poppy [15], much more efficiently over even larger areas. For example, with imagery taken during the flowering season, poppies could be sub-classified by flowering class (i.e., flowering, non-flowering) and size. If a minimal on-the-ground component is added to collect flowering and fruit data along with imagery obtained during the same time period, the number of seeds produced could be calculated across an entire population [15]. Up until very recently, this kind of large-scale demographic data was thought to be virtually impossible to obtain.
Traditional on-the-ground census methods are often not feasible for population-level data collection over large areas. At the heart of this lack of feasibility, it usually comes down to time and cost. Obviously, drones can cover more habitat in a given time frame than on-the-ground workers, but another advantage of drone census coupled with AI detection methods potentially addresses a well-documented issue in plant census, survey, and monitoring studies, namely observer error [31,32,33,34]. Plant species with low abundance, such as dwarf bear poppy, are particularly prone to observer error, primarily as observer failure to detect the plant (false absence or error of omission). This was true even when decoy plants with readily distinguishable morphology or phenological stage (including plants in full bloom) [31] were deployed. In our method, we systematically exclude poppies that are ≤5 cm in diameter due to difficulty in confirming their identification. In contrast, even skilled observers on the ground often fail to detect individuals of the target species [32], with failure increasing with increased size of search area [31] and longer time spent searching [34]. Drone/AI-based plant census methods have a detection threshold that is objective, measurable, and subject to modification as needed, unlike the omission error in on-the-ground census methods that attempt to detect every plant.
One of our main objectives when setting out to do this work was to design innovative methods that are also inexpensive, as we were thinking in terms of utility for land managers or researchers attempting to collect population-level plant data. Relative to funding for animal species research, plant conservation research is notoriously underfunded [35], which often makes the cost of data collection the biggest driver of decisions as to what data can be collected and over how large an area. Our total time to complete a 246-ha population-level census, including drone flights, imagery processing, validation, and inference, was 133 h, with most of that time accounted for in computer processing. Even the 48 h spent conducting drone flights was mostly flight time, with some time for workers to navigate to different flight areas. We do not have data available to directly compare this to on-the-ground census of poppy habitat. However, Zhang et al. [35] conducted species-richness surveys across 356 quarter-hectare plots in boreal forest habitat with 12 observers (1 observer/plot) and found that the average survey time per plot was 82 min, ranging from 20-194 min per plot depending on density. Species richness surveys are generally more time consuming than counting individuals of one species; however, this example shows that the potential time invested in on-the-ground survey efforts over larger areas can be high, and ultimately very expensive, relative to drone/AI census methods.
The ability to analyze drone imagery using deep learning methodology has reduced the time investment for plant census by orders of magnitude relative to human visual analysis. The method presented here can be used to collect and analyze an enormous amount of data over a relatively large area. The method is especially suited to species with distinctive morphology in sparsely vegetated habitat. Many edaphically restricted species of conservation concern, particularly those found in semiarid and arid environments, meet these criteria. We think that with a well-designed training program and an initial investment in a drone and a computer with software capable of processing and visualizing imagery, our methods could readily be incorporated by conservation botanists as well as land managers and their contractors.
5. Conclusions
The next steps in developing our improved drone-based population-level census methodology for more widespread use are: (1) complete image processing and AI analysis of our range-wide census imagery for dwarf bear poppy, (2) develop a procedure to project census points onto maps to examine spatial patterns of distribution and environmental correlates, (3) incorporate these spatial data to build a species distribution model that will be used to identify potential areas for the establishment of new dwarf bear poppy populations, and (4) apply our methodology to additional species of conservation concern. We have been invited by our funding partners to try drone-based census on two additional rare plant species, which gives us the opportunity to test the applicablity of our method to species with different morphologies and that occupy different habitats.
Author Contributions
Conceptualization, K.R.R. and S.E.M.; methodology, K.R.R.; software, K.R.R.; validation, K.R.R. and S.E.M.; formal analysis, K.R.R.; investigation, K.R.R. and S.E.M.; resources, S.E.M.; data curation, K.R.R.; writing—original draft preparation, K.R.R. and S.E.M.; writing—review and editing, K.R.R. and S.E.M.; visualization, K.R.R.; supervision, S.E.M.; project administration, K.R.R.; funding acquisition, S.E.M. All authors have read and agreed to the published version of the manuscript.
Funding
This project was carried out with the aid of funding to Utah Valley University through Grant # F104790 from The Nature Conservancy and through Challenge Cost Share Grant # F19AP00568 from the US Fish and Wildlife Service, as well as through Bureau of Land Management Utah State Office Interagency Agreement #L18PG00120 to the US Forest Service Rocky Mountain Research Station.
Data Availability Statement
The data presented in this study are available as part of this.
Acknowledgments
We thank Jena Lewinsohn of the US Fish and Wildlife Service and Elaine York of The Nature Conservancy for their unflagging support of our work. Sydney Houghton and Eli Hartung of Utah Valley University carried out the drone flights at Webb Hill.
Conflicts of Interest
The authors declare no conflict of interest.
References
- Liu, M.; Wang, X.; Zhou, A.; Fu, X.; Ma, Y.; Piao, C. UAV-YOLO: Small Object Detection on Unmanned Aerial Vehicle Perspective. Sensors 2020, 20, 2238. [Google Scholar] [CrossRef] [Green Version]
- Jocher, G.; Stoken, A.; Borovec, J.; Chaurasia, A.; Liu, C.; Xie, T.; Abhiram, V.; Hogan, A.; Hajek, J.; Diaconu, L.; et al. Ultralytics/Yolov5: V5.0—YOLOv5-P6 1280 Models, AWS, Supervise.Ly and YouTube Integrations. Zenodo 2021. [Google Scholar] [CrossRef]
- Rominger, K.R.; Meyer, S.E. Application of UAV-based methodology for census of an endangered plant species in a fragile habitat. Remote Sens. 2019, 11, 719. [Google Scholar] [CrossRef] [Green Version]
- United States Fish and Wildlife Service. Dwarf Bear-Poppy, Arctomecon humilis Coville, Five-Year Review: Summary and Evaluation; US Fish and Wildlife Service, Utah Field Office: Salt Lake City, UT, USA, 2016; 55p. [Google Scholar]
- Elzinga, C.L.; Salzer, D.W.; Willoughby, J.W.; Gibbs, J.P. Monitoring Plant and Animal Populations: A Handbook for Field Biologists; John Wiley & Sons: Hoboken, NJ, USA, 2009. [Google Scholar]
- Reisch, C.; Schmid, C.; Hartig, F. A Comparison of Methods for Estimating Plant Population Size. Biodivers. Conserv. 2018, 27, 2021–2028. [Google Scholar] [CrossRef]
- Busch, V.; Reisch, C. Population Size and Land Use Affect the Genetic Variation and Performance of the Endangered Plant Species Dianthus Seguieri ssp. glaber. Conserv. Genet. 2016, 17, 425–436. [Google Scholar] [CrossRef]
- Matthies, D.; Bräuer, I.; Maibom, W.; Tscharntke, T. Population Size and the Risk of Local Extinction: Empirical Evidence from Rare Plants. Oikos 2004, 105, 481–488. [Google Scholar] [CrossRef]
- Rominger, K.R.; DeNittis, A.; Meyer, S.E. Using drone imagery analysis in rare plant demographic studies. J. Nat. Conserv. 2021, 62, 126020. [Google Scholar] [CrossRef]
- Aich, S.; Stavness, I. Leaf counting with deep convolutional and deconvolutional networks. In Proceedings of the IEEE International Conference on Computer Vision Workshops, Venice, Italy, 22–29 October 2017; pp. 2080–2089. [Google Scholar]
- Feng, A.; Zhou, J.; Vories, E.; Sudduth, K.A. Evaluation of cotton emergence using UAV-based imagery and deep learning. Comput. Electron. Agric. 2020, 177, 105711. [Google Scholar] [CrossRef]
- Liu, H.; Sun, H.; Li, M.; Iida, M. Application of color featuring and deep learning in maize plant detection. Remote Sens. 2020, 12, 2229. [Google Scholar] [CrossRef]
- Chen, W.; Lu, S.; Liu, B.; Li, G.; Qian, T. Detecting Citrus in Orchard Environment by Using Improved YOLOv4. Sci. Program. 2020, 2020, 1–13. [Google Scholar] [CrossRef]
- Cerrejon, C.; Valeria, O.; Marchand, P.; Caners, R.T.; Fenton, N.J. No place to hide: Rare plant detection through remote sensing. Divers. Distrib. 2021, 27, 948–961. [Google Scholar] [CrossRef]
- Garzon-Lopez, C.X.; Lasso, E. Species classification in a tropical alpine ecosystem using UAV-Borne RGB and hyperspectral imagery. Drones 2020, 4, 69. [Google Scholar] [CrossRef]
- James, K.; Bradshaw, K. Detecting plant species in the field with deep learning and drone technology. Methods Ecol. Evol. 2020, 11, 1509–1519. [Google Scholar] [CrossRef]
- Li, J.Y.Q.; Duce, S.; Joyce, K.E.; Xiang, W. SeeCucumbers: Using Deep Learning and Drone Imagery to Detect Sea Cucumbers on Coral Reef Flats. Drones 2021, 5, 28. [Google Scholar] [CrossRef]
- López-Jiménez, E.; Vasquez-Gomez, J.I.; Sanchez-Acevedo, M.A.; Herrera-Lozada, J.C.; Uriarte-Arcia, A.V. Columnar cactus recognition in aerial images using a deep learning approach. Ecol. Inform. 2019, 52, 131–138. [Google Scholar] [CrossRef]
- Zhou, H.; Fu, L.; Sharma, R.P.; Lei, Y.; Guo, J. A hybrid approach of combining random forest with texture analysis and VDVI for desert vegetation mapping Based on UAV RGB Data. Remote Sens. 2021, 13, 1891. [Google Scholar] [CrossRef]
- Abeysinghe, T.; Simic Milas, A.; Arend, K.; Hohman, B.; Reil, P.; Gregory, A.; Vázquez-Ortega, A. Mapping Invasive Phragmites australis in the Old Woman Creek Estuary Using UAV Remote Sensing and Machine Learning Classifiers. Remote Sens. 2019, 11, 1380. [Google Scholar] [CrossRef] [Green Version]
- Gonçalves, C.; Santana, P.; Brandão, T.; Guedes, M. Automatic Detection of Acacia longifolia Invasive Species Based on UAV-Acquired Aerial Imagery. Inf. Process. Agric. 2021. [Google Scholar] [CrossRef]
- Papp, L.; van Leeuwen, B.; Szilassi, P.; Tobak, Z.; Szatmári, J.; Árvai, M.; Mészáros, J.; Pásztor, L. Monitoring Invasive Plant Species Using Hyperspectral Remote Sensing Data. Land 2021, 10, 29. [Google Scholar] [CrossRef]
- Wang, Q.; Cheng, M.; Xiao, X.; Yuan, H.; Zhu, J.; Fan, C.; Zhang, J. An Image Segmentation Method Based on Deep Learning for Damage Assessment of the Invasive Weed Solanum Rostratum Dunal. Comput. Electron. Agric. 2021, 188, 106320. [Google Scholar] [CrossRef]
- Reckling, W.; Mitasova, H.; Wegmann, K.; Kauffman, G.; Reid, R. Efficient Drone-Based Rare Plant Monitoring Using a Species Distribution Model and AI-Based Object Detection. Drones 2021, 5, 110. [Google Scholar] [CrossRef]
- Lin, T.-Y.; Maire, M.; Belongie, S.; Bourdev, L.; Girshick, R.; Hays, J.; Perona, P.; Ramanan, D.; Zitnick, C.L.; Dollár, P. Microsoft COCO: Common Objects in Context. arXiv 2015, arXiv:1405.0312. [Google Scholar]
- YOLOv5 New Version—Improvements and Evaluation. Available online: https://blog.roboflow.com/yolov5-improvements-and-evaluation/ (accessed on 12 August 2021).
- Bochkovskiy, A.; Wang, C.-Y.; Liao, H.-Y.M. YOLOv4: Optimal Speed and Accuracy of Object Detection. arXiv 2020, arXiv:2004.10934. [Google Scholar]
- Redmon, J.; Farhadi, A. Yolov3: An incremental improvement. arXiv Prepr. 2018, arXiv:1804.02767. [Google Scholar]
- Thuan, D. Evolution of YOLO Algorithm and YOLOv5: The State-of the-Art Object Detection Algorithm. Bachelor’s Thesis, Oulu University, Oulu, Finland, 2021. Available online: https://www.theseus.fi/handle/10024/452552 (accessed on 12 September 2021).
- Tzutalin, D. LabelImg. Git Code. Available online: https://github.com/tzutalin/labelImg (accessed on 12 August 2021).
- Chen, G.; Kéry, M.; Plattner, M.; Ma, K.; Gardner, B. Imperfect Detection Is the Rule Rather than the Exception in Plant Distribution Studies. J. Ecol. 2013, 101, 183–191. [Google Scholar] [CrossRef] [Green Version]
- Archaux, F.; Gosselin, F.; Bergès, L.; Chevalier, R. Effects of Sampling Time, Species Richness and Observer on the Exhaustiveness of Plant Censuses. J. Veg. Sci. 2006, 17, 299–306. [Google Scholar] [CrossRef]
- Morrison, L.W.; Young, C.C. Observer Error in Sampling a Rare Plant Population. Plant Ecol. Divers. 2016, 9, 289–297. [Google Scholar] [CrossRef]
- Havens, K.; Kramer, A.T.; Guerrant, E.O. Getting Plant Conservation Right (or Not): The Case of the United States. Int. J. Plant Sci. 2014, 175, 3–10. [Google Scholar] [CrossRef] [Green Version]
- Zhang, J.; Nielsen, S.E.; Grainger, T.N.; Kohler, M.; Chipchar, T.; Farr, D.R. Sampling Plant Diversity and Rarity at Landscape Scales: Importance of Sampling Time in Species Detectability. PLoS ONE 2014, 9, e95334. [Google Scholar] [CrossRef]
Figure 1.
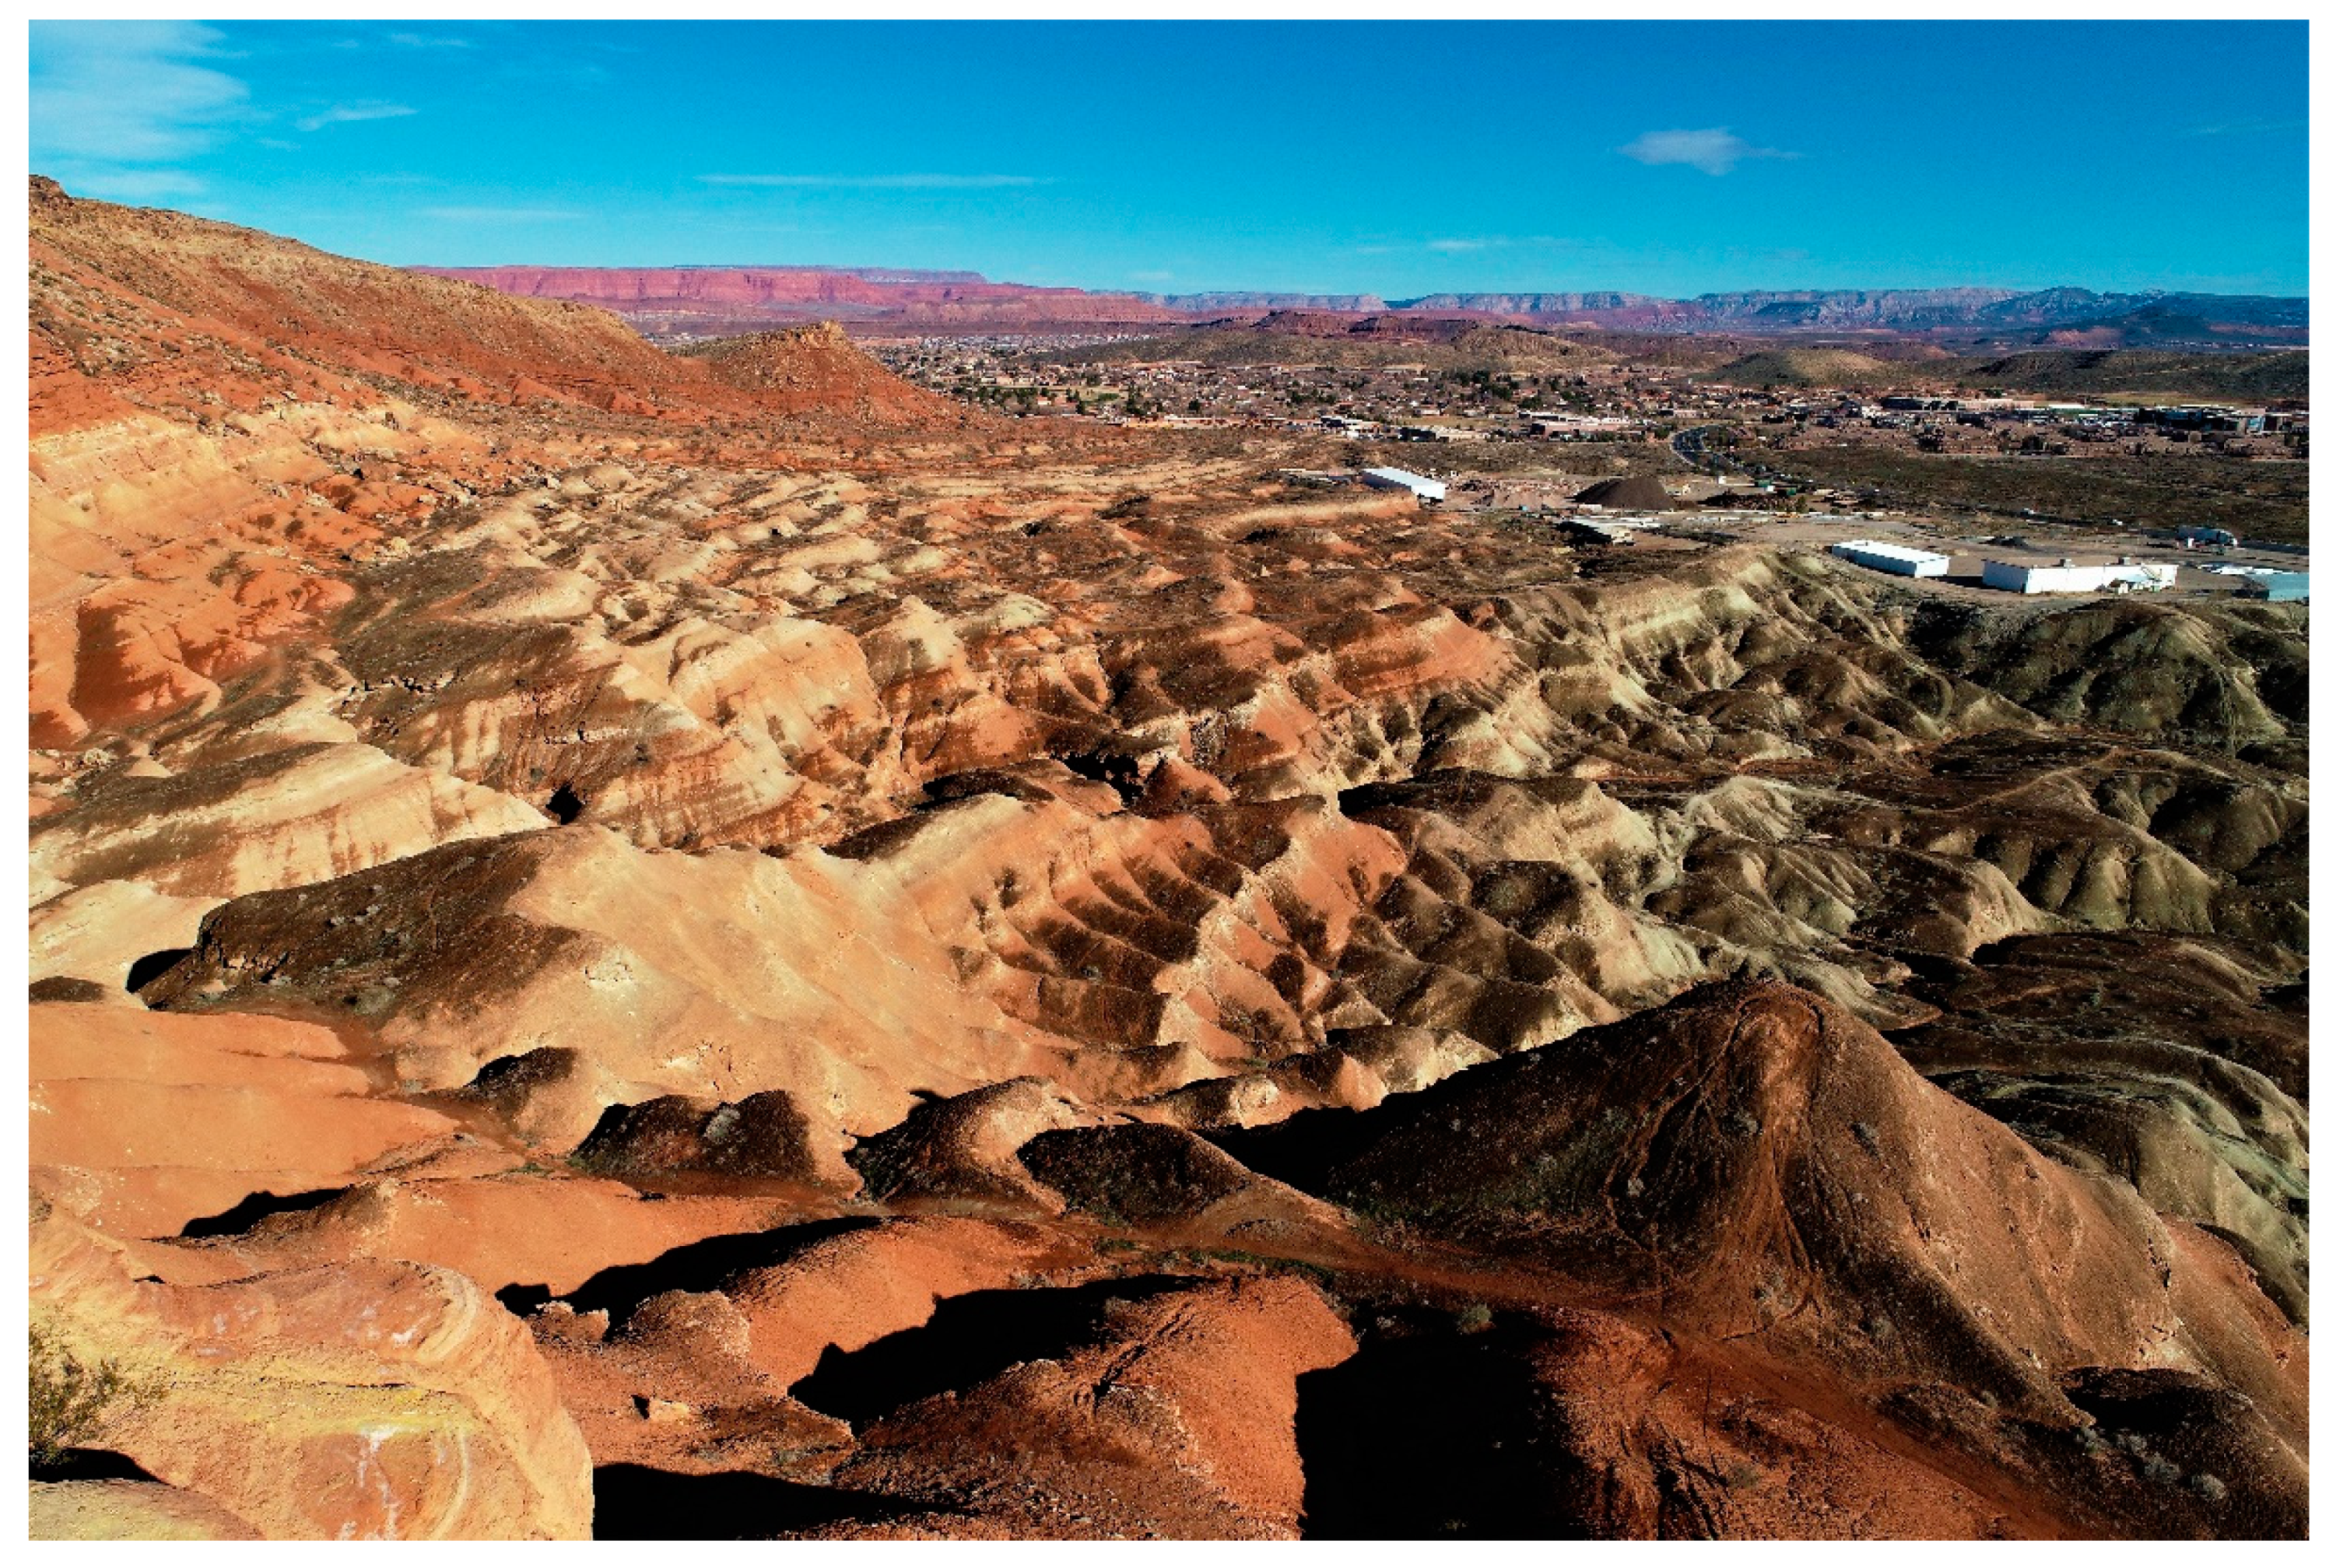
Drone view looking across the northeastern area of the Webb Hill population (roughly 50 ha) demonstrating why this terrain would be difficult to census using traditional on-the-ground methods.
Figure 1.
Drone view looking across the northeastern area of the Webb Hill population (roughly 50 ha) demonstrating why this terrain would be difficult to census using traditional on-the-ground methods.

Figure 2.
(a) Example of a mature dwarf bear poppy in full flower; (b) example of blue/green foliage and mounding growth form that differentiates the poppy from other herbaceous plant species in the habitat.
Figure 2.
(a) Example of a mature dwarf bear poppy in full flower; (b) example of blue/green foliage and mounding growth form that differentiates the poppy from other herbaceous plant species in the habitat.

Figure 3.
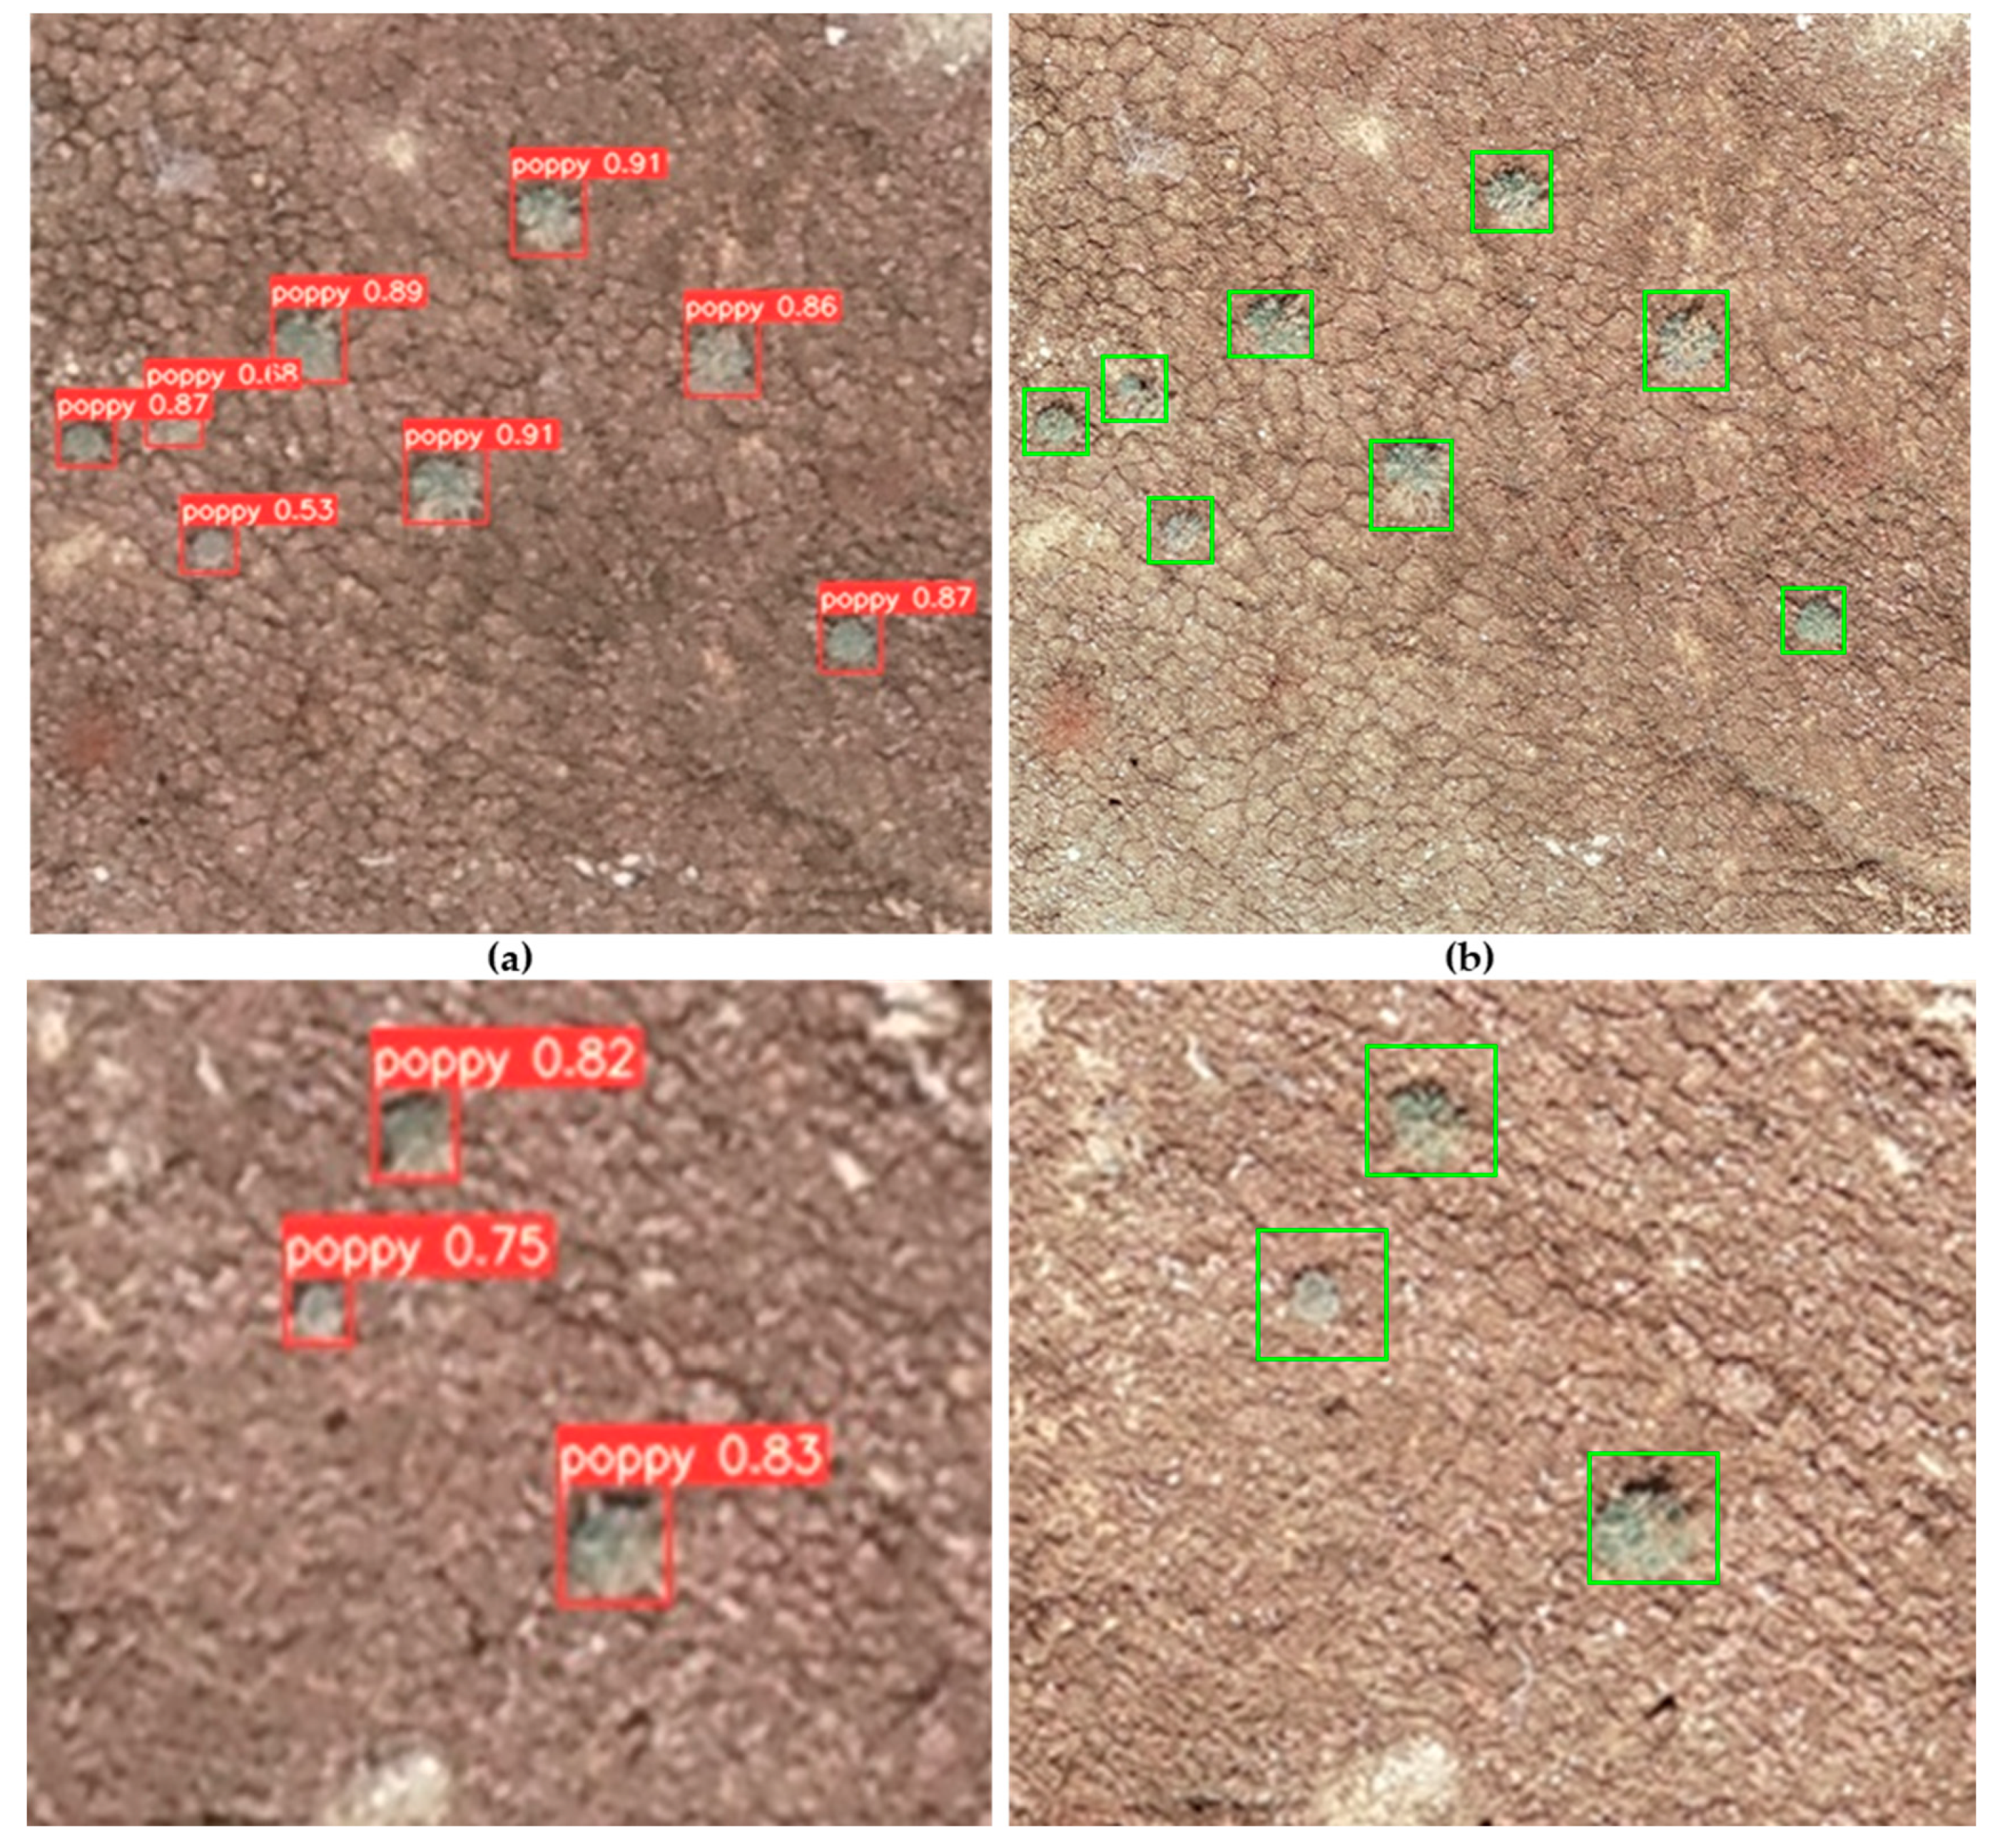
Example of model inference output at two plots. Panels on the left (a) are from census imagery (40 m AGL), while panels on the right (b) are from validation imagery (15 m AGL) over the same area. Red boxes were the model predictions (with confidence level), and green boxes were visually confirmed as poppies.
Figure 3.
Example of model inference output at two plots. Panels on the left (a) are from census imagery (40 m AGL), while panels on the right (b) are from validation imagery (15 m AGL) over the same area. Red boxes were the model predictions (with confidence level), and green boxes were visually confirmed as poppies.

Figure 4.
(a) Final model precision for the poppy class (light blue line) and similar vegetation class (orange line), as well as overall precision (dark blue line); (b) final model recall for the poppy (light blue line) and similar vegetation (orange line) classes, as well as overall recall (dark blue line).

Figure 5.
Inference output example from two individual census flights at Webb Hill. Red boxes represent model predicted poppies.
Figure 5.
Inference output example from two individual census flights at Webb Hill. Red boxes represent model predicted poppies.


Table 1.
Summary of results for AI model inference (left panel) vs. human worker evaluation (right panel) of n = 11 validation plots (top panel). Middle (Red Bluffs, n = 6 plots) and bottom (Webb Hill, n = 5 plots) panels compare evaluation results for plots separated by population.
Table 1.
Summary of results for AI model inference (left panel) vs. human worker evaluation (right panel) of n = 11 validation plots (top panel). Middle (Red Bluffs, n = 6 plots) and bottom (Webb Hill, n = 5 plots) panels compare evaluation results for plots separated by population.
| AI Model | Human Worker | |||||||||||||
|---|---|---|---|---|---|---|---|---|---|---|---|---|---|---|
| All Plots | Marked | Confirm | Missed | Actual | Precision | Recall | Time 1 | Marked | Confirm | Missed | Actual | Precision | Recall | Time 1 |
| Plot 1 | 31 | 21 | 4 | 25 | 0.68 | 0.84 | 0.06 | 17 | 8 | 17 | 25 | 0.47 | 0.32 | 78 |
| Plot 2 | 39 | 34 | 10 | 44 | 0.87 | 0.77 | 0.05 | 49 | 34 | 10 | 44 | 0.69 | 0.77 | 54 |
| Plot 3 | 5 | 4 | 1 | 5 | 0.80 | 0.80 | 0.08 | 6 | 4 | 1 | 5 | 0.67 | 0.80 | 51 |
| Plot 4 | 1 | 0 | 3 | 3 | 0.00 | 0.00 | 0.03 | 5 | 1 | 2 | 3 | 0.20 | 0.33 | 63 |
| Plot 5 | 6 | 4 | 3 | 7 | 0.67 | 0.57 | 0.06 | 13 | 7 | 0 | 7 | 0.54 | 1.00 | 81 |
| Plot 6 | 1 | 1 | 2 | 3 | 1.00 | 0.33 | 0.06 | 6 | 3 | 0 | 3 | 0.50 | 1.00 | 57 |
| Plot 7 | 20 | 19 | 2 | 21 | 0.95 | 0.90 | 0.03 | 18 | 15 | 6 | 21 | 0.83 | 0.71 | 54 |
| Plot 8 | 30 | 30 | 4 | 34 | 1.00 | 0.88 | 0.06 | 43 | 33 | 1 | 34 | 0.77 | 0.97 | 60 |
| Plot 9 | 7 | 5 | 8 | 13 | 0.71 | 0.38 | 0.06 | 16 | 11 | 2 | 13 | 0.69 | 0.85 | 54 |
| Plot 10 | 15 | 13 | 12 | 25 | 0.87 | 0.52 | 0.05 | 13 | 10 | 15 | 25 | 0.77 | 0.40 | 57 |
| Plot 11 | 14 | 10 | 1 | 11 | 0.71 | 0.91 | 0.04 | 16 | 10 | 1 | 11 | 0.63 | 0.91 | 48 |
| Total 2 | 169 | 141 | 50 | 191 | 0.83 | 0.74 | 0.58 | 202 | 136 | 55 | 191 | 0.67 | 0.71 | 657 |
| Red Bluffs | ||||||||||||||
| Plot 3 | 5 | 4 | 1 | 5 | 0.80 | 0.80 | 0.08 | 6 | 4 | 1 | 5 | 0.67 | 0.80 | 51 |
| Plot 5 | 6 | 4 | 3 | 7 | 0.67 | 0.57 | 0.06 | 13 | 7 | 0 | 7 | 0.54 | 1.00 | 81 |
| Plot 6 | 1 | 1 | 2 | 3 | 1.00 | 0.33 | 0.06 | 6 | 3 | 0 | 3 | 0.50 | 1.00 | 57 |
| Plot 7 | 20 | 19 | 2 | 21 | 0.95 | 0.90 | 0.03 | 18 | 15 | 6 | 21 | 0.83 | 0.71 | 54 |
| Plot 8 | 30 | 30 | 4 | 34 | 1.00 | 0.88 | 0.06 | 43 | 33 | 1 | 34 | 0.77 | 0.97 | 60 |
| Plot 11 | 14 | 10 | 1 | 11 | 0.71 | 0.91 | 0.04 | 16 | 10 | 1 | 11 | 0.63 | 0.91 | 48 |
| Total 2 | 76 | 68 | 13 | 81 | 0.89 | 0.84 | 0.33 | 102 | 72 | 9 | 81 | 0.71 | 0.89 | 351 |
| Webb Hill | ||||||||||||||
| Plot 1 | 31 | 21 | 4 | 25 | 0.68 | 0.84 | 0.06 | 17 | 8 | 17 | 25 | 0.47 | 0.32 | 78 |
| Plot 2 | 39 | 34 | 10 | 44 | 0.87 | 0.77 | 0.05 | 49 | 34 | 10 | 44 | 0.69 | 0.77 | 54 |
| Plot 4 | 1 | 0 | 3 | 3 | 0.00 | 0.00 | 0.03 | 5 | 1 | 2 | 3 | 0.20 | 0.33 | 63 |
| Plot 9 | 7 | 5 | 8 | 13 | 0.71 | 0.38 | 0.06 | 16 | 11 | 2 | 13 | 0.69 | 0.85 | 54 |
| Plot 10 | 15 | 13 | 12 | 25 | 0.87 | 0.52 | 0.05 | 13 | 10 | 15 | 25 | 0.77 | 0.40 | 57 |
| Total 2 | 93 | 73 | 37 | 110 | 0.78 | 0.66 | 0.25 | 100 | 64 | 46 | 110 | 0.64 | 0.58 | 306 |
1 Time is reported in total minutes of inference/evaluation per plot. 2 Totals for marked, confirmed, missed, actual, and time reported as sum of plots; total for precision calculated as total confirmed/total marked; total for recall calculated as total confirmed/actual.
Table 2.
Summary of the drone census and the YOLOv5 inference results at the Webb Hill poppy population. Results presented by individual census flight. Census flights 10 and 32 were excluded from analysis.
Table 2.
Summary of the drone census and the YOLOv5 inference results at the Webb Hill poppy population. Results presented by individual census flight. Census flights 10 and 32 were excluded from analysis.
| Flight # | #Images | Area 1 | GSD 2 | F-time 3 | P-Time 4 | #Poppy | #Tiles | #PopTiles 5 | #Pop/Tiles 6 | I-Time 7 |
|---|---|---|---|---|---|---|---|---|---|---|
| 1 | 333 | 11.1 | 2.13 | 22 | 152 | 356 | 1472 | 257 | 0.00174 | 14.8 |
| 2 | 308 | 8.6 | 1.17 | 17 | 144 | 256 | 3850 | 209 | 0.00142 | 3.5 |
| 3 | 316 | 8.5 | 1.03 | 17 | 106 | 350 | 5092 | 283 | 0.00192 | 5.1 |
| 4 | 352 | 9.3 | 1.04 | 17 | 129 | 443 | 5120 | 318 | 0.00216 | 4.8 |
| 5 | 245 | 8.1 | 1.28 | 14 | 114 | 99 | 3564 | 88 | 0.00060 | 4.2 |
| 6 | 226 | 6.1 | 0.91 | 12 | 98 | 146 | 5390 | 135 | 0.00092 | 9.7 |
| 7 | 357 | 8.5 | 0.78 | 21 | 164 | 838 | 11,000 | 657 | 0.00446 | 1.4 |
| 8 | 318 | 7.9 | 1.08 | 20 | 108 | 51 | 4928 | 45 | 0.00031 | 4.5 |
| 9 | 253 | 6.1 | 0.84 | 14 | 128 | 38 | 6700 | 36 | 0.00024 | 6.1 |
| 11 | 362 | 9.5 | 1.01 | 19 | 163 | 65 | 5810 | 63 | 0.00043 | 3.7 |
| 12 | 446 | 12.3 | 1.2 | 25 | 133 | 60 | 5916 | 60 | 0.00041 | 2.8 |
| 13 | 139 | 0.58 | 0.68 | 7 | 65 | 2 | 806 | 2 | 0.00001 | 4.3 |
| 14 | 460 | 12.2 | 1.06 | 25 | 200 | 102 | 9600 | 95 | 0.00064 | 3.3 |
| 15 | 192 | 5.9 | 1.11 | 10 | 89 | 69 | 5148 | 54 | 0.00037 | 4.3 |
| 16 | 107 | 0.28 | 0.32 | 4 | 56 | 14 | 1683 | 13 | 0.00009 | 8.2 |
| 17 | 161 | 6.2 | 1.52 | 9 | 72 | 164 | 2925 | 130 | 0.00088 | 4.0 |
| 18 | 270 | 9.8 | 1.66 | 17 | 163 | 141 | 2840 | 116 | 0.00079 | 3.5 |
| 19&20 8 | 619 | 19.3 | 1.84 | 65 | 205 | 697 | 3680 | 500 | 0.00339 | 3.8 |
| 21 | 495 | 9.7 | 1.09 | 25 | 220 | 545 | 5356 | 432 | 0.00293 | 2.9 |
| 22 | 251 | 7.6 | 1.09 | 15 | 122 | 441 | 3996 | 348 | 0.00236 | 6.0 |
| 23 | 363 | 9.3 | 1.21 | 20 | 156 | 401 | 10,275 | 286 | 0.00194 | 4.5 |
| 24 | 317 | 9.6 | 1.23 | 17 | 125 | 337 | 5824 | 269 | 0.00182 | 5.7 |
| 25 | 103 | 3.3 | 1.1 | 5 | 45 | 43 | 1980 | 42 | 0.00028 | 4.8 |
| 26 | 239 | 6.1 | 1.09 | 15 | 131 | 26 | 3283 | 26 | 0.00018 | 2.9 |
| 27 | 203 | 5.1 | 0.95 | 14 | 133 | 80 | 4235 | 60 | 0.00041 | 5.5 |
| 28 | 227 | 6.1 | 0.99 | 13 | 131 | 117 | 4736 | 103 | 0.00070 | 1.6 |
| 29 | 225 | 7.8 | 1.46 | 12 | 116 | 52 | 3410 | 48 | 0.00033 | 2.0 |
| 30 | 162 | 6.2 | 1.41 | 11 | 74 | 34 | 3422 | 32 | 0.00022 | 2.1 |
| 31 | 205 | 6.9 | 1.39 | 11 | 91 | 70 | 3416 | 64 | 0.00043 | 7.0 |
| 33 | 307 | 5.1 | 1.06 | 11 | 159 | 91 | 3597 | 83 | 0.00056 | 5.0 |
| 34 | 292 | 4.8 | 1.03 | 11 | 164 | 76 | 3429 | 63 | 0.00043 | 2.8 |
| 35 | 193 | 4.7 | 1.07 | 7 | 145 | 40 | 2444 | 38 | 0.00026 | 2.1 |
| 36 | 213 | 3.6 | 1.16 | 8 | 147 | 39 | 2484 | 39 | 0.00026 | 0.7 |
| Total | 9259 | 246.2 | n/a | 530 | 4248 | 6283 | 147411 | 4994 | 0.03388 | 147.2 |
| Avg | 280.6 | 7.5 | 1.15 | 16.1 | 128.7 | 190.4 | 4467 | 151.3 | 0.00103 | 4.5 |
1 Flight area (hectares); 2 GSD calculated as cm2/pixel; 3 F-time = drone flight time (mins) 4 P-time = imagery processing time (mins); 5 #PopTiles = number of tiles with detected poppies; 6 #Pop/Tiles = total number of tiles with poppies/sum of all tiles; 7 I-time = AI inference time (mins); 8 Flights 19 and 20 were processed and analyzed together.
Publisher’s Note: MDPI stays neutral with regard to jurisdictional claims in published maps and institutional affiliations. |
© 2021 by the authors. Licensee MDPI, Basel, Switzerland. This article is an open access article distributed under the terms and conditions of the Creative Commons Attribution (CC BY) license (https://creativecommons.org/licenses/by/4.0/).
Share and Cite
MDPI and ACS Style
Rominger, K.R.; Meyer, S.E. Drones, Deep Learning, and Endangered Plants: A Method for Population-Level Census Using Image Analysis. Drones 2021, 5, 126. https://doi.org/10.3390/drones5040126
AMA Style
Rominger KR, Meyer SE. Drones, Deep Learning, and Endangered Plants: A Method for Population-Level Census Using Image Analysis. Drones. 2021; 5(4):126. https://doi.org/10.3390/drones5040126
Chicago/Turabian StyleRominger, Kody R., and Susan E. Meyer. 2021. "Drones, Deep Learning, and Endangered Plants: A Method for Population-Level Census Using Image Analysis" Drones 5, no. 4: 126. https://doi.org/10.3390/drones5040126