

Gusts Encountered by Flying Vehicles in Proximity to Buildings

1
School of Engineering, RMIT University, Melbourne, VIC 3001, Australia
2
Mechanical Engineering and Mechanics, Lehigh University, Bethlehem, PA 18015, USA
3
Department of Aerospace Engineering, University of Maryland, College Park, MD 20742, USA
*
Author to whom correspondence should be addressed.
Drones 2023, 7(1), 22; https://doi.org/10.3390/drones7010022
Submission received: 27 October 2022
/
Revised: 19 December 2022
/
Accepted: 23 December 2022
/
Published: 28 December 2022
/
Corrected: 31 May 2023
(This article belongs to the Special Issue Urban Air Mobility (UAM))
Abstract
:There is a growing desire to operate Uncrewed Air Vehicles (UAVs) in urban environments for parcel delivery, and passenger-carrying air taxis for Advanced Air Mobility (AAM). The turbulent flows and gusts around buildings and other urban infrastructure can affect the steadiness and stability of such air vehicles by generating a highly transient relative flow field. Our aim is to review existing gust models, then consider gust encounters in the vicinity of buildings as experienced by flight trajectories over the roof of a nominally cuboid building in a suburban atmospheric boundary layer. Simplified models of fixed- and rotary-wing aircraft are used to illustrate the changes in lift and thrust experienced by flight around the building. The analysis showed that fixed-wing aircraft experienced a substantial increase in angle of attack over a relatively short period of time (<1 s) as they fly through the shear layer at a representative forward velocity, which can be well above typical stall angles. Due to the slow flight speeds required for landing and take-off, significant control authority of rotor systems is required to ensure safe operation due to the high disturbance effects caused by localized gusts from buildings and protruding structures. Currently there appears to be negligible certification or regulation for AAM systems to ensure safe operations when traversing building flow fields under windy conditions and it is hoped that the insights provided in this paper will assist with future certification and regulation.
Keywords:
turbulence; gust; UAV; urban; severe; limitation; survey; CFD; city; urban air mobility; buildings; infrastructure; air taxi; advanced air mobility; certification; regulation; vertiports1. Background and Objectives
It is well documented that aircraft of all sizes are adversely affected by turbulence and gusts; as identified by the Federal Aviation Administration (FAA) and the US Transporta-tion Safety Board as a leading cause of accidents—costing over USD 100M p.a. [1]. Severe injuries are reported, such as those in the 2015 Air Canada flight AC088, which injured 21 passengers, including three children [2]; and 2019 Qantas Flight QF108 whereby 3 cabin staff had head and neck injuries [3]. Accidents still continue to occur with more recent ac-cidents that resulted in injured passengers [4] and even a passenger death [5]. As the size, mass and speed of aircraft decrease, the susceptibility to turbulence and gusts increases [6,7]; or in sum, due to lower wing loading [8]. Smaller general aviation aircraft and helicop-ters also tend to fly more at lower altitudes within the Atmospheric Boundary Layer (ABL) which is dominated by high turbulence intensities from ground protruding structures [7,9]. This has led to reported accidents directly relating to turbulence [10,11,12,13]. Even the tran-sition through the ABL can be detrimental to aircraft that are designed to fly at very high altitudes such as Facebook’s Aquila Uncrewed Air Vehicle (UAV) and Airbus’ Zephyr UAV, whereby both had fatal crashes due to turbulence and/or gusts [14,15].
The advent of Advanced Air Mobility (AAM) vehicles involves operating fleets of UAVs in urban environments far more frequently than we have ever anticipated, for the purpose of transporting parcels and passengers. This exposes the fleet of aircraft to a wide range of challenging flow conditions; specifically large-scale gusts induced by urban infrastructure which can persist up to several kilometers away from the source and interact in complex ways. AAM will more than often involve operation in close-proximity to physical structures (e.g., inspection of infrastructure, or take-off and landing operations from building rooftops). In the presence of large-scale gusts, significant flight path deviations can occur, increasing risk of collision with objects. Aircraft collisions with high-rise buildings is not unheard of [16], and the routine operation of UAVs in cities further increases the risk of collisions. There is a need for both research and regulation efforts to enhance safety and minimize the risk through considering vertiport and vehicular design.
The most relevant aspect of aviation to AAM is the operation of helicopters which also fly in urban environments, albeit less frequently and with a human pilot onboard. Landing on buildings poses a specific challenge in some cases, warranting further aerodynamic studies and field wind measurements being prudent [17]. From a vehicular design standpoint, the AAM vehicles’ design and flight dynamics are different from the conventional helicopter and airplane design which warrants an exploration into novel design features and technologies that enable lower sensitivity to turbulence and precise maneuvering [1]. From a vertiport standpoint, the existing heliport infrastructure can potentially support AAM; however there is a need for purpose-built buildings (for ease of public access and to account for the autonomy of UAVs). The characterization of the flow fields for different wind conditions around vertiports is warranted, similar to those conducted for heliports [18,19,20,21]. New research is, thus, required to characterize the temporal and spatial variation in the flow fields around buildings and vertiports. This will inform vertiport design and site selection to minimize the risk imposed by the local wake of the building from affecting flight safety as well as passenger ride quality.
In recent years, considerable attention has focused on measurements in ground-test facilities or computations that replicate some idealized flow unsteadiness such as a pitching and/or plunging maneuver or an imposed well-characterized gust [22,23,24,25,26,27,28,29]. However, perhaps the most obvious gust problem for UAV flight is steady level operation, or at least, intended steady level operation through the atmospheric boundary layer (ABL), where no discrete obstacle (or associated wake) is present. Previous studies on UAV flight through the ABL [30,31] have shown that three-dimensional (3-D) turbulent structures induce particularly strong disturbances in UAV roll response owing to variation in effective angle of attack along the wingspan. This disturbance in roll was also noted in comments from pilots attempting to hold steady level flight in well-mixed turbulence [32]. Roll disturbances not only degrade payload performance (particularly the blurring of images from optical sensors) but may also lead to undesired flight path deviations. The most critical parts of UAV urban operations entail flight in very close proximity to buildings and may include entering buildings through windows or air vents or landing on their rooftops (see Figure 1). Whilst the flow field around buildings has been extensively studied from a fixed reference frame (e.g., by wind engineers for the purposes of structural loadings [33,34], dispersion of pollutants [35,36], pedestrian wind comfort [37,38], etc.), there appear to be very few studies from the reference frame of the moving aircraft and at the relevant frequencies [39]. We therefore examine this relative flow field with an overall aim to reveal the characteristics of a “severe” gust for UAVs in close proximity to buildings.
In this paper we first review turbulence in the ABL to frame a taxonomy of gusts and consider their relevance to UAVs. The more challenging flight environment for vehicles passing through the local wakes of buildings is then considered and compared to flight in the ABL. Flight in the urban environment is expected to yield gusts of high severity (frequency and/or amplitude), most likely leading to unwanted, severe force spikes and flow separation about the aircraft wing. While the problem is inherently 3D, we first investigate a 2D longitudinal-only case by examining the relative flow near the centerplane of the building. The outcome of this work is an assessment of the most basic research question to characterize the urban environment: What are the disturbances in effective angle of attack and relative flight speed magnitude in a flight-relevant urban gust encounter?
2. Turbulence
Turbulence is defined as a chaotic, random, highly nonlinear and unpredictable flow [40]. In the atmosphere, the characteristics of turbulence are influenced by the thermal stability of the ABL (adiabatic, or various degrees of stability). However, under strong winds mechanical mixing tends to dominate the turbulence generation mechanisms and thermal stability plays a smaller role. Thus, in the current work we ignore thermally driven turbulent flows, as they only tend to dominate under light winds, which are unlikely to generate severe gusts. The ABL extends from the Earth’s surface up to an altitude where the wind is no longer influenced by the roughness of the ground, which may include geological or civil structures. The mean wind speeds increase from zero at the Earth’s surface up to the “gradient” wind speed, i.e., that which occurs at the gradient height, typically 1–2 km depending upon terrain roughness. Above this height the air is generally smooth, except for bursts of “clear air turbulence,” which are not considered here. The ABL is well documented from stationary measurements for various purposes, including meteorological and wind engineering studies (e.g., [41,42,43]). The interaction of the ABL with obstacles such as buildings, bridges and other infrastructure will generate coherent turbulence structures with length scales of a similar size to the obstacle, as depicted in a 3-D computational fluid dynamics (CFD) simulation shown in Figure 2, from [44]. The building shown is nominally a cuboid of dimension 43 m, and the simulation includes a representation of the velocity and intensity profiles in the approaching ABL. Figure 3 further illustrates the decaying nature of turbulence in an urban scenario, whereby the coherent structures dissipate downstream of obstacles, and a well-mixed turbulent wake then develops (as can be seen downstream of the building in the figure). These flow features yield a velocity field with a broad spectral content that contains a wide range of length and time scales.
3. Prior Gust Models
Aircraft encounter different types of turbulence while flying through the ABL, and there exists a significant body of knowledge relevant to manned flight focused on the temporal and spatial characteristics of the flow environment that is well-removed from local effects and (usually) from the influence of the ground. These prior works include continuous gust models that represent the structure of the statistically random flow fluctuations in the atmosphere as power spectral functions. These spectra allow for predictions of the mean-square values of the flight vehicle and aeroelastic responses, provided that a transfer function between the gust and response can be established from deterministic or other means [45,46].
The most common continuous gust spectra of Von Karman [47], as well as those of Diederich and Drischler [48], Dryden [49]) are one-dimensional, i.e., they yield three orthogonal velocity components at a single point, a restriction that neglects gradients in the gust across the aircraft as well as any altitude-dependent wind shear effects. These gust models are built up from the statistical theory and measurements of isotropic turbulence. The von Kármán model form interpolates between the isotropic scaling results of Heisenberg [50] at low frequency and the higher-frequency scaling of Kolmogorov [51] in the inertial subrange. The Dryden model instead assumes a functional form that fits experimental measurements of the isotropic turbulent energy spectrum in the early stages of decay; see Liepmann, Laufer [52] for further discussion and comparison of these gust models. The choice of the simpler Dryden form over the more theoretically-grounded von Kármán model is largely a matter of engineering convenience; the correctness advantage of the von Kármán model is important only if significant spectral content relevant also to the flight and aeroelastic dynamics is centered in the microscale range, a decade or more above the integral scale break frequency where the isotropic inertial subrange begins [53]. The isotropic turbulence assumption, central to both models, is valid for turbulence at high altitude. However, at lower altitudes relevant to UAVs/AAM (less than about 2000 ft), anisotropic effects of the ABL without the influence of urban structures may be modeled by adjusting the turbulence intensity and turbulence length scales in the isotropic models according to empirical design specifications. Such specifications at low altitude for the von Kármán and Dryden models, as well as a discussion of more sophisticated gust models, are organized by Standard [53]. Continuous gust models may be compared with traditional discrete gust models including the sharp-edged gust and “1-cosine” gust used to establish severe aeroelastic scenarios. However, if desired, one may readily construct a continuous gust from a known series of discrete gusts [54], and the continuous and discrete models may be superposed provided that the flow disturbances and resulting structural motions are sufficiently small to retain linearity.
Flows within an urban environment are generally inhomogeneous, anisotropic, and time-varying and, therefore, violate many of the core assumptions of traditional gust models. Near the ground, turbulence length scales and intensities vary rapidly with altitude and depend strongly on the terrain [55]; there is a lack of viable models to describe the broad range of general turbulent flows possible in this environment. The introduction of AAM and UAVs further complicates the modelling challenge of the urban environment. Wind shears from the terrain and from multi-scale arrays of buildings produce longitudinal and vertical gusts that generate significant roll and yaw moments, which must be characterized and accounted for in the gust and vehicle dynamics models [56]. In the absence of buildings and terrain, the length scales of the most energetic eddies in the ABL are much larger than the UAV feature lengths, and the high-frequency content of the turbulence spectrum is therefore expected to play a more significant role in the vehicle gust response. However, the urban landscape affects this turbulent flow and can introduce gust length scales pertinent to the air vehicle response. Furthermore, the gusts encountered by UAVs near buildings may be large relative to the local background flow and can lead to catastrophic nonlinear effects, such as stall-induced pitch-up. In light of these challenges, the next sections survey experimental measurements and computational simulations to characterize the three-dimensional gust fields of canonical urban landscapes and investigate scenarios of vehicle trajectories in this environment.
4. Turbulence Experienced by Moving Vehicles (Relative Turbulence)
Turbulence Intensity (Ti) is defined as the standard deviation of the fluctuating component of wind velocity (u’) divided by the mean wind velocity (),
The variation in the intensities and scales with height from the ground from a stationary perspective (i.e., with reference to the ground) is described in Watkins, Thompson [30], and a database compiled from a wide range of measurements can be found in ESDU 85020 [57]. Movement through the turbulence field at different speeds and directions changes how the turbulence is perceived by moving vehicles. The effect of a moving measurement reference frame has been explored by Watkins and Cooper [58] for ground-based vehicles, where two-component data (in the horizontal plane) obtained from hot-wire anemometers mounted above a vehicle were compared for fixed and moving vehicle frameworks. Turbulence intensities measured from the moving vehicle were found to be in good agreement with those predicted from the measured vehicle-fixed data in relatively smooth domains, well-removed from local wakes such as buildings. However, when data were obtained in rougher terrains, which included traversing local wakes, a significant increase in turbulence intensity was found in the data from the moving vehicle. The lateral intensities were considerably higher than values predicted from ground-fixed data, whereas only slight increases in longitudinal intensities were noted. This result was attributed to the fact that turbulence from a stationary perspective (referenced to the ground) was measured at locations specifically chosen to be removed from local wakes.
Watkins, Milbank [6] extended this work to include three-component data obtained from four laterally spaced, dynamically calibrated, multi-hole Cobra probes. This extension was carried out to understand the turbulent flow environment of UAVs, whereby the lateral separation between the probes could be altered to document the flow impinging at different spanwise locations on a UAV wing. Data were collected over various types of terrain, and under a range of wind speeds and vehicle speeds that included some data closer to buildings than in earlier hot-wire measurements. The closest that the measurement tracks came to buildings was about 5 m due to the vehicle being driven on public roads. The study provided data relating the measured turbulence intensities to relative flight velocity (Figure 4), demonstrating a reduction with increasing freestream speed. In the moving case, the denominator in the turbulence intensity (Equation (1)), , becomes Vr, which is the vehicle speed relative to the air (i.e., the wind speed). Figure 5 illustrates the vector addition used to compute Vr,
It is therefore important to differentiate between Ti and the Relative Turbulence Intensity (J), which takes into account the relative velocity, Vr:
5. Relevant Gust Characteristics
Excessively large gusts (i.e., those with length scales significantly larger than the vehicle’s characteristic dimension) can often be considered quasi-steady, and their effects are relatively easily compensated for [6]. Gust scales equivalent to or smaller than the characteristic length are more deleterious and introduce significant asymmetrical forces and moments. As a gust impacts the leading edge of an aerodynamic surface such as a wing, the flow angle and velocity are altered, inducing variations in the load distribution as illustrated in Figure 6. Gusts of a 3-D nature that are smaller than the wing span will lead to uneven lift distribution over the wings, inducing a rolling motion. Lissaman [59] demonstrated that a sinusoidal load distribution with a period relating to a dimension that is slightly larger than the span of the aircraft results in the maximum roll moment.
Gusts in well-mixed turbulence are highly three-dimensional in nature and it has been shown that out of the possible six degrees of freedom, rolling motion is the most significant disturbing factor for UAVs [6]. Atmospheric measurements in well-mixed turbulence removed from building wakes illustrate the three-dimensionality of gusts, whereby significant flow pitch variations are evident across typical UAV wingspans or rotor diameters. Figure 7a shows a typical time record of the angle of attack, α, recorded by four laterally separated probes during a two-second sampling time, showing large fluctuations of the order of ±10°. At first, it might seem that there is a strong correlation between the pitch angles measured from the four probes. However, closer examination of the data presented in Figure 7b reveals that there are considerable differences, and at some instances the variation is ≈15° across probes with a lateral separation of 150 mm.
For fixed wings, Thompson, Watkins [60] showed that typical lateral variations in α are more significant than the associated velocity magnitude variations in generating potential rolling moments (using data from measurements of well-mixed atmospheric turbulence close to the ground applied to simple wing strip theory). The experimental work by Mohamed, Watkins [31] confirmed the high sensitivity of the roll axis to α variation. For rotary wings, among the most relevant work was that conducted by Wang, Dai [61] in which it was found that a variable pitch helicopter blade encountering a downward gust experiences a significant reduction in thrust force. It was also found that the sharper the gust, the more adverse the response is with respect to aerodynamic forces and structural deflection. This behavior is particularly relevant when travelling through shear layers at higher speeds, causing the relative encountered gust front to be perceived as a sharp gust front.
6. Gust Taxonomy
It is desirable to approximate gusts as quasi 1-D or 2-D (see Figure 8) for fundamental studies on the transient flow field around airfoils through, for example, pitch and/or plunge motions in fundamental experiments. However, the reality of well-mixed atmospheric turbulence is intrinsically three-dimensional in nature. Discrete gusts can be categorized as either 1-D or 2-D in the streamwise or transverse directions. Streamwise 1D gusts involve a momentary change in streamwise velocity. For example, as streamwise velocity increases, the corresponding lift over an airfoil also increases, which if not corrected, will result in a translation of the airfoil upwards (due to lift) and backwards (due to the increased drag). Non-symmetric velocity changes along the span of a wing will result in a rolling and yawing motion if not taken into consideration. It is worth noting that Thompson, Watkins [60], using a simple strip theory model, found that angular flow changes typically have a tenfold greater effect on lift compared to the magnitude changes in atmospheric turbulence. This behavior implies that travelling through a transverse gust will result in a stronger generation of lift than from a streamwise gust.
7. Severe Gusts around Buildings: Case Studies
Let us now consider the flow field around a nominally cuboid building in a suburban environment. At the juncture between the building and the ground plane, there is the usual horseshoe vortex, perhaps with associated finer structures [63]. Near the building rooftop, there is expected to be a separated flow with meandering shear layers of time-varying position, width, and intensity. Depending on the building’s geometry and wind direction, vortices may also be present near the rooftop. Using the taxonomy discussed in the previous section, possible gust encounters by UAV flight in urban environments are illustrated in Figure 9. Given that the angular flow changes typically have a greater effect on sectional lift coefficient in contrast to magnitude changes [31], the most detrimental case in this set is likely to be a transverse gust given the rapidity of the encounter with respect to the flight trajectory. The latter scenario will therefore be the focus of a case study presented in the remainder of this paper, whereby we use the flow field around a representative cuboid building computed by Mohamed, Carrese [44] (see Figure 2) to estimate variations in the lift and rolling moment coefficients of representative UAVs. The CFD simulation representing an urban environment uses an Improved Delayed Detached Eddy Simulation (IDDES) turbulence model. Mohamed, Carrese [44] validated the simulation by demonstrating excellent agreement of the solution strategy with the experimental and large eddy simulation (LES) data of similar but simpler cases. The validation cases examined were: (1) developed channel flow, (2) flow over a backward-facing step, (3) flow over periodic 2D hills, (4) wall-mounted hump flow, and (5) trailing-edge separation over a hydrofoil. Full details of the basis of these simulations can be found in [44] and comparison with point-probe atmospheric measurements is carried out in [39,64].
In the simulation, inflow boundary conditions replicate the relevant velocity and intensity profiles of a suburban ABL. Due to the mesh resolution near the building (~0.05 m), the scales of the resolved turbulence are suitable for the UAV spans discussed in this paper. Initialization of the IDDES simulation was provided using a steady-state k—ω SST model. The RANS momentum field is converted to an instantaneous momentum field before commencing the transient run. The pressure-based Non-Iterative Time-Advancement (NITA) fractional-step solver is utilized, with bounded second-order temporal discretization. The time step is normalized by the ratio of (l∞/U∞) with a non-dimensional time-step of ∆t∗ = 0.003 for the total time of the simulation t∗T = 600 with sampling statistics collected from t∗ > 200. An average wind speed of 3 m/s at a height of 10 m was used in the upstream boundary condition representing the ABL, and the mean wind direction was normal to the southerly face (i.e., along the x-axis in the figures below). The modelling requirements and profiles for the ABL were obtained from the work of Blocken, Stathopoulos [65], and the ABL velocity profile U(y) was estimated using
where u* is the friction velocity, U∞ and y∞ are the reference velocity and height, κ is the von Kármán constant, and y0 is the equivalent aerodynamic roughness height. The profiles for the turbulence kinetic energy k and specific dissipation ω were estimated using:
7.1. Flight Trajectory Modelling
Consider a UAV flying at speed VV in close proximity to a building. Depending on the flight path and the direction of the wind, a wide range of perturbations may be perceived (i.e., the gusts experienced relative to the moving UAV will vary with flight path and wind). Severe gusts are taken to be those that result in a large step change in aerodynamic forces or moments. Realizing that the atmospheric wind can vary from calm to extreme (i.e., storm) levels, it is necessary to select a single atmospheric wind speed and direction, then investigate flight paths relative to the building flow field that would generate the severe cases.
We consider the flight trajectories outlined in Figure 10, representing two flight paths towards the leading edge of the building (0° and 45° flight path angle), performed at some height above the rooftop, thus encountering the shear layers shed from the building structure. The 0° flight path represents the simpler case where the vehicle encounters the gust head-on, and there are no gust-induced rolling moments. The 45° flight path provides insight into the rolling moment that arises due to lift imbalance as one wing is immersed into the shear flow before the other wing. In reality, the UAV’s trajectory will be influenced by the flow field. We ignore these vehicle dynamics and any coupling of the vehicle’s flow field with that of the building and assume that the vehicle acts as a massless point-particle UAV. Thus, we assume “frozen” turbulence; that is, the computed wind field is sampled at one instant in time, and the “turbulence” encountered by the UAV is the variations in the relative flow field velocity as the vehicle proceeds in its idealized, steady level flight. While such simplification is unrealistic from the viewpoint of airplane flight mechanics, it is arguably sufficient to define a realistic “severe case” to be studied.
The flow fields around a building were extracted from the CFD model (see Figure 11) to identify the gusts encountered as perceived by a moving aircraft. These flow fields were imposed on a simplified model of a fixed wing UAV in a way similar to that by Thompson, Watkins [60] as well as an actuation disk model of a single rotor, in order to extract severe cases during a straight flight path. The chosen aircraft speeds were 5 m/s and 15 m/s with respect to the ground (i.e., typical velocities for UAVs).
The flow extracted from the CFD simulation is presented in this section. The wind along a representative flight path (at fixed points along the flight trajectory) is shown in Figure 12. The flow field for various heights is depicted in Figure 13, and the flow extracted from the CFD simulation is given in Figure 14. The wind velocity is plotted as if it were in polar coordinates following the convention shown in Figure 12. The “flow pitch angle” is the direction of local flow at a h/H value of 0.0023 where h is the height of flight path above the rooftop and H is the building height. The trajectory closest to the roofline is at height ratio of h/H = 0.0023, or 10 cm above the roof, which is immersed in a boundary layer of the building itself. This boundary layer is present even at the intermediate trajectory height of h/H = 0.14, which is physically 6 m above the building. In this region, from 0 to −1 on the abscissa of Figure 13, the wind speed is low, but highly variable. At h/H = 0.25 and 0.33, the flight trajectory is above this building boundary layer and the flow pitch angle variation has settled down to a range within approximately 0–20°. The normalized velocity is the wind speed magnitude normalized by the aforementioned 3 m/s reference velocity. If the wind field were uniform and parallel to the building roof, the flow pitch angle would be zero, and the “normalized velocity” would be a constant. Instead, there are considerable variations in both angle and magnitude. The angle variations are not to be regarded as an angle of attack; at this point in the discussion, the airplane flight has not yet been introduced in the analysis. (Figure 13 and Figure 14 represent the shape of the gust flow independent of the aircraft).
The changes in velocity magnitude are greatest very close to the building’s top leading edge, whereas the changes in flow pitch angles are smaller. From the results presented in Figure 13 and Figure 14, it is evident that a sharp increase in flow pitch angle at nondimensional position −1 on the abscissa exists at the trailing edge of the building. At the leading edge of the building, 0 on the abscissa, the flow pitch angle drops sharply. The normalized velocity, meanwhile, undergoes no change at the building trailing edge, but rises very sharply at the building leading edge. This rise is closer to the building leading edge for lower h/H, but it is essentially the same in magnitude for all trajectories up to h/H = 0.14 (6 m above the roof). This implies that a large change in wind amplitude is experienced by the UAV as it approaches the building edge, even if the desired trajectory is not particularly close to the building itself. In the presentation of Figure 13, wind speeds and angles are the result of the wind field computation, i.e., from a fixed reference frame. We next turn to how the very same results affect candidate UAVs of various kinds, i.e., from the UAVs’ frame of reference.
7.2. Estimations of Perceived Gust for Fixed-Wing
Now we consider the flight path of a fixed-wing UAV above the building roof as indicated in Figure 12 at representative speeds of 5 m/s and 15 m/s. Consider how the combined effects of flow angle and magnitude are perceived along one flight path by superimposing the vehicle flight speed VV onto the vertical speed Vvert and horizontal speed Vhoriz of the wind, Vvert and Vhoriz being the Cartesian analog of the “polar” results given in Figure 13. The superposition of the flight velocity and wind speed enables the relative velocity and angle of attack to be computed. The effective angle of attack, α(t), is calculated using
The results for two nominal cruise speeds (5 m/s and 15 m/s), converted back into velocity magnitude and angle of attack, are given in Figure 15. The immediately obvious feature of Figure 15 occurs near the building leading edge, “0” of the abscissa. As expected from Figure 13, the shear layer atop the building results in the worst-case perceived gust encounter: at the lower flight velocity (5 ms−1) a ≈20° change in aircraft relative angle of attack is accompanied by an approximately 50% increase in velocity magnitude, all over a time increment of 0.25 s. At a higher flight velocity of 15 ms−1, the perceived angle of attack is lower (≈10°), accompanied by a 25% increase in velocity over a time increment of 0.11 s. Using a simple linear relationship between the incident flow changes (angle of attack and relative velocity magnitude) and lift coefficient, and assuming a 2π lift curve slope and an unperturbed flight path (i.e., steady level flight), this gust represents changes in CL of 8.5 and 2 for a flight velocity of 5 ms−1 and 15 ms−1, respectively. For flight paths at 45° (where one wing is immersed into the gust before the other) the roll moment coefficient CLp presented in Figure 15 is calculated from the lift imbalance between the aircraft’s wings:
Taking time lags into consideration, conventional attitude sensing and control systems of a fixed wing UAV travelling at 10 ms−1 will typically take 0.52 s to react (from sensing to actuation) [7,66] which can be insufficient to mitigate this gust. The combination of phase-advanced sensors, where flow, forward of the UAV, is measured and used as a control input [67], and novel control techniques may be needed [68] to achieve flight control in this type of environment. Examples of the latter include rotations of the entire wing, leading-edge control surfaces [68], or “fast flaps” at the trailing edge [69], which are intended to deflect faster than one convective time, producing lift transients well beyond what would be considered quasi-steady.
7.3. Estimations of Perceived Gust for a Rotor
For multirotor aircraft, gust disturbances do not affect the aircraft in the same manner as fixed wing aircraft, especially in forward flight versus hover. This difference is due to the nature in which lift is created via its rotors and the forward motion flight state that requires a multirotor to tilt forward the rotors to generate forward speed. The purpose of this section is to explore the effect of the encountered gust on the total thrust generated while being agnostic about geometrical features of the rotor. This approach is key to making the analysis non-specific to a particular rotor and configuration but more generic and applicable to different multirotor configurations and even hybrid vehicles (i.e., fixed wing with rotors for Vertical Take-Off and Landing, VTOL). We will therefore use momentum disk theory and consider thrust of a single rotor. Aircraft designers can replicate this study and approximate the moments around the center of gravity for any number of rotors they intend to use. There are, however, limitations to this method, as it cannot account for geometric interferences between rotors and/or lifting surfaces, stall conditions, induced downwash effects from forward rotors, and other interactional aerodynamics of the configuration it may be modelling. However, it is sufficient for purposes of analyzing gust response within the context presented.
We consider two types of vehicles as outlined in Table 1 which represent two different scales of rotorcraft. The first vehicle represents a relatively small quadrotor delivery drone while the second is a larger octorotor AAM used for carrying human passengers. The tabulated specifications are generic for purposes of the presented analysis for two configurations which are likely to fly around buildings. The disk loading is determined by the hover weight divided by the total rotor area.
A single rotor disturbance model is used and is shown in Figure 16. Similar models have previously been used for turbulence and disturbance analysis for small multirotor aircraft with success [70,71].
The total induced thrust of the rotor can be represented b
where the velocity components can be written as the induced velocity of the thrusting disk (), the wind velocity (), and the summation of the two vectors resulting in total induced speed ().
The wind disturbance model allows the oncoming wind vector to be separated into its horizontal and vertical components to resolve the total induced speed vector using
where is the induced angle between the rotor disk and the relative oncoming wind vector. As induced angle is influenced by the rotor tilt angle () required for forward flight, induced angle can be calculated using
With no gust disturbance, the relative induced angle between the disk and the oncoming wind vector is completely perpendicular (). A purely vertical gust would result in a wind vector at zero or radians with the thrusting vector parallel to the disk in hover. Vertical disturbances affect the angle of the disk relative to the oncoming wind vector, which allows oncoming gusts to approach the model between the angles of .
Tilt angles relative to the ongoing wind vector are calculated to be 34° and 63° using forward flight speeds of 5 ms−1 and 15 ms−1 by resolving the induced angle from Equation (12) assuming no wind gust disturbance. The upper flight velocity of 15 ms−1 is regarded as high in terms of the normal flight speeds of multirotor aircraft at this scale; however, we offer this analysis to directly compare to the fixed wing case shown earlier. Referring to Figure 17, large variations are seen in the relative induced angle of the flow relative to the rotor. The most obvious effect can be seen at the buildings edge where larger variations of relative induced flow angle cause significant changes to thrust. The variation in thrust is more significant at the lower flight speed of 5 ms−1. The higher flight speed of 15 ms−1 yields lower thrust variance due to a higher relative thrust required to maintaining flight and relatively lower gust vector. In other words, the faster the drone speed, the lower overall effect of the gust on the rotor as the thrusting vector to maintain flight becomes more dominant. Rotor thrust reactions to turbulence are more erratic and greater in magnitude than lift variations seen for the fixed wing aircraft found in the previous fixed wing study featured in this paper. On a rotor disk, turbulent flow vectors from all directions directly influence the aircraft incidence angle, the thrust required for steady level flight, and any perturbations which result in altitude loss or gain. All these directly influence the amount of thrust produced and incidence angle of the rotor significantly.
The fixed wing aircraft seems to be more passively tolerant to turbulence (although further experimental studies are required to explore this). Lower tolerance of rotary wing is assumed to be due to the loss in forward flight of the disk when traversing though the gust resulting in increased power and induced velocity while inducing larger rotor tilt angles to maintain attitude and flight speed. As both lift and forward flight is maintained by propulsive means, large variations in power/thrust are required when each are influenced and have a compounding effect when traversing through a gust.
Flight altitudes closest to the building produce the most unsteadiness in rotary wing thrust variation, which is a direct result of the relatively thin shear layer producing a relatively sharp flow vector change. These effects near the building are consistent with the fixed wing aircraft in the previous analysis. We observe that upward gusts result in additional thrusting force required to maintain flight speed and altitude, which is clearly seen when the UAV experiences the large upward gust in Figure 17 at a normalized position between −0.4 and 0. The induced flow vector is altered in this region and results in a higher thrust production in the direction of flight. Flight altitudes of h/H = [0.0023, 0.047 and 0.14] demonstrate similar trends in thrust. All stabilizes when the disk traverses past the edge of the building to free stream flow which is upwind of the building. Flight altitudes of h/H = [0.25,0.33] involve flight through a less sharp gust as perceived by the UAV whereby less variations in thrust are observed. This is due to the UAV flying above the shear layer and recirculating flow area caused by the leading edge of the building, where only gradual changes in relative flow angle impinge on the disk. Unlike most fixed wing aircraft, multirotor aircraft are inherently unstable and rely heavily on stabilization through the variation of the thrust of each rotor. The response of the thrusting system (i.e., propellor, motor, and controller) is the limiting factor in correcting for disturbances. Slow-flying multirotor systems traversing through a building-induced gust will experience a relatively high magnitude of thrust variation and will thus require an active stabilization response to maintain steady level flight.
Figure 18 displays the same analysis presented in Figure 17 but for a larger AAM vehicle capable of carrying a human passenger, thus resulting in higher disk loading and thrust. Consequently, the vehicle is relatively less sensitive to the gust, whereby the induced velocity through the rotor, the overall thrust, and the non-dimensional thrust (T/Th) all show a lower thrust magnitude relative to the delivery drone. These changes are further highlighted in the non-dimensional thrust subplot where the maximum variance near the leading edge of building is ΔT/Th > 0.4, while the maximum variance for the delivery drone is greater at values of ΔT/Th > 0.8 at the same flight altitude and speed of 5 m/s. Variance in thrust magnitude is greater in all instances for the delivery drone relative to the urban mobility vehicle. In both flight examples, the variance occurs more so in the locations of highly separated and mixed flow featured at heights between 0.0023 < h/H < 0.14. Greater heights show smaller flow vector variation, suggesting regions of flow that are out of the turbulence shear layer. For both vehicles, the turbulence effects cannot be neglected and require active turbulence mitigation through autopilot stabilization. The suitability of stabilization systems depends on the actuation speed achievable for the given scale of the aircraft. Higher actuation speeds will reduce the sensing-to-actuation time-lag which thus enables the vehicle to mitigate sharper and higher-amplitude gusts. Light-weight rotors, high-torque motors, greater excess thrust, and power will all contribute to required turbulence reaction speeds.
7.4. Airframe Design and Certification Considerations
Considerable recent published work has considered the alleviation of gust loads on aircraft [72,73,74,75,76] and in some cases even harvesting it [77,78,79]. Severe gusts around buildings can pose a major challenge for flight of different vehicular scales and configurations. Smaller UAVs are more sensitive to the disturbances, however larger UAVs are still affected albeit to a lesser extent. The latter will depend on the relative magnitude and scale of a gust with respect to the aircraft’s scale. Also, the UAV configuration (rotary vs fixed wing) will respond differently to the disturbances. Hybrid configurations which have a combination of lifting surfaces (i.e., fixed wing) and an array of thrusting disks (i.e., rotary wing) are well suited for close proximity flight to buildings. However, there is a spectrum of design possibilities which require careful design choices to truly alleviate the disadvantages of both fixed and rotary wing. Further research is required to identify the intrinsic aerodynamic deficiencies of these hybrid configurations and what are they particularly susceptible to. For example, fixed-wing craft will stall if flown too slow, while rotary wing craft are susceptible to the vortex ring state and weather cock stability. Some deficiencies may be resolved with hybrid configurations while others may persist or even give rise to new deficiencies especially during hover. Vehicles with large surface areas facing the wind direction (e.g., tilt wings) will experience significant attitude control and flight-path tracking challenges due to the relatively large forces generated by these surfaces. Such designs should be avoided where possible if a UAV is expected to fly at low speeds near buildings and gust-generating infrastructure. The frontal projection area of the UAV regardless of the configuration needs to be minimized most critically during proximity flight. This may be even achieved through active wing area reduction, but the structural and mechanical challenges of an airframe capable of reducing area or changing its wing planform. This design challenge is complex but not impossible. There are also other means of mitigating turbulence and gusts through the control systems [80,81,82], aerodynamic configuration [68,83,84,85,86], and novel sensors [66,67,87]. Counteracting such flow disturbances comes at the cost of increased weight and power demands which will affect range and battery consumption. The question then becomes, how smooth of a flight will the passenger demand? How much control will we need to give to the pilot and/or the system?
As a hybrid UAV flies slow and in proximity to a building, any fixed wing control surface on the airframe become ineffective in controlling attitude due to low speed. The effectiveness or relative force of control surfaces reduces by the square of the flow velocity it is exposed to. In this case the UAV relies mainly on the rotary wings for lift and attitude control. There are opportunities for unconventional fixed wings designs to increase the control authority and rapidity [84,85], however the rotary wings will be required to achieve the majority of the control and lifting work in such scenarios, and therefore require the ability to rapidly adjust thrust to mitigate any gusts encountered. Variable-pitch propellers are effective in generating rapid actuation and more efficient thrust vectoring to enable the vehicle to approach a vertiport at low approach speeds with more control authority and stability.
From a certification standpoint, AAM airframes need to demonstrate the ability to counter attitude disturbances and flight path deviations for a reasonable range of wind speeds and gust conditions to make AAM operational for the majority of the year despite weather. Coping with high wind speeds, certification should include a demonstration of limits on the angular perturbations allowed in the vehicles’ three axes during the highest operational wind and gust magnitudes. These angular limits should be selected to ensure that the physical extremities of the vehicle do not collide with the vertiport during touchdown or take-off. Limits should also be imposed on how much flight-path drift occurs for a range of wind and gust speeds to reduce risk of collision with infrastructure. Airframe manufacturers can either conduct physical experimentations to demonstrate compliance with the limitations imposed or utilize numerical-based modelling (with a form of validation) [61].
Helicopter certifications requirements rely on the presence of human pilots on board that can assess hazardous situations. Regulations for autonomous UAV operations in cities (especially large air taxis) will be different and rely on measurable numerical thresholds, which are used by the flight control system for automated decision making and planning, given there is no human-in-the-loop to make such rapid judgments:
- “Operating in close proximity to obstructions can lead to recirculation and loss of performance. Aerodromes, geographically situated in hilly, mountainous areas, including certain coastal regions, can be subject to hazardous turbulent conditions in moderate to strong wind conditions. Pilots should be aware that, in certain cases, aircraft performance can be severely affected. History has shown, in extreme cases, that turbulence has prevented the aircraft from climbing or being controlled near the ground and has also caused structural damage”.
- “In winds below 15 kts, the turbulence may be experienced in the lee of an obstruction, vertically to about one third higher than the height of the obstruction. Above 20 kts, turbulence may be experience on the leeward side of an obstruction to a distance of 10–15 times the obstruction height and up to twice the obstruction height above the ground”.
- “During take-off or landing in gusty wind situations where wind shear is likely to be present, may require a greater power margin to deal with varying power demands or an unexpected loss of airspeed and accompanying sink. Large anti-torque pedal inputs to maintain directional control also act to reduce the excess power available”.
Regulations for autonomous UAV operations in cities (especially large air taxis) will have to be more detailed and require the reliance on measurable numerical thresholds, which are used by the flight control system for automated decision making and planning, given there is no human-in-the-loop to make such rapid judgments.
7.5. Vertiport Design and Certification Considerations
Currently, a small body of knowledge exists around specific heliport requirements that deal with the surrounding turbulence levels from nearby buildings [13,88,89]. There also exists some regulations that can be used as a basis to guide the design and location of vertiport landing infrastructure [20,89]. A turbulence criterion was introduced for helicopters to ensure safe flight is maintained [89]. The criterion sets a threshold on the standard deviation of the vertical flow velocity, which results in a high helicopter pilot workload. Mentzoni and Ertesvåg [88] later suggested the use of turbulence energy instead as a criterion, arguing its benefits over the standard deviation of vertical velocity. Similarly, a new criterion or threshold is needed for the autonomous operation of AAM vehicles, which relies on the limitations of the flight control system instead of the workload of human pilots. The results presented here have implications for vertiport design and a similar analysis can be used to identify thresholds for such a criterion.
Most of the research on building aerodynamics presented in the literature focuses on surface pressure measurements for predicting facade loadings. However, the advent of AAM requires a unique understanding of the velocity field induced by the interaction of the wind with the building on which UAVs will be operating form. Specifically, the shear layers that form and their impact on flight. A thorough characterization of the flow field for different wind directions is essential for each vertiport to be designed since each one will have a unique flow environment. Similar methods and tools, such as those used in the field of wind engineering, can be used.
Vertiport designers will need to avoid design features that generate turbulence or sharp gusts of high amplitude and of length scales that are detrimental to UAVs. A few studies explore this area [13,19,21,90]; however, more research is needed, with full-scale validation. There exists a body of knowledge on designing wind sheltering systems (such as porous fences) for road and rail vehicles which will be relevant. Similarly, building design features, such as round corners and porous deflectors near rooftops, can help reduce the sharpness of the perceived gust, which translates to a lower actuation requirement, thus providing a UAV’s flight control system with more time to react and counter the flow disturbance. Another key parameter is the unobstructed air gap below the landing platform, which will also influence the severity of the shear layer by allowing more air to flow underneath the platform. The ideal height of the air gap will be different for each building since it is a function of the building’s geometry. A 1.8 m minimum air gap is cited by the FAA in the Heliport Design Advisory Circular AC 150/5390-2D [91]. The document points to research published in FAA/RD-84/25 [19], but it is unclear how the 1.8 m criteria were derived. Regardless, there is enough justification for exploring a new threshold for AAM vehicles. The new US Federal Aviation Administration (FAA) guidelines for vertiport design has a small section on turbulence with high-level recommendations on using turbulence-mitigating design measures [92]. As technology matures and more research is conducted in this area, specific metrics and criterion can be included in future revisions of the guidelines providing design standards, which will need to be met. It is also strongly believed that aviation authorities should provide their own guidelines and regulations on turbulence and gust thresholds around vertiports instead of relying on existing building guidelines and regulations (e.g., [93]), which focus on reducing adverse wind effects that affect the quality and usability of outdoor spaces and pedestrian comfort. The modeling and measurements for the latter are very different from that required for AAM flight paths around the buildings from a probe placement and mesh refinement perspective.
Modelling building aerodynamics and the local flow fields can be performed using classical wind tunnel methods on scale buildings, or utilizing CFD similar to that presented here. There is a need to provision for the surrounding wind environment and its interaction with not only the vertiport structure but also neighboring structures which will have an impact on the local flow field [19] and can result in overspeed regions which are difficult to predict. An additional analysis, which can complement wind tunnel testing and CFD, is full scale measurements using airborne wind anemometers such as the one developed by Prudden, Fisher [94]. A swarm of such sensors are ideal for rapid simultaneous measurements that can map out the flow field accurately at full scale and later used for validation of CFD or comparison with scale experiments to account for any Reynolds number effects. Given the mobility of such systems, it can also be used to measure the perceived gust along the flight paths of UAVs.
8. Concluding Remarks
UAVs used for both delivery and human carrying systems are being introduced internationally and are intended to integrate into various civil domains. Urban and city environments provide the greatest operational challenge due to the safety considerations of operating in highly populated environments. Under even moderate winds, landing and take-off maneuvers are subjected to high levels of turbulence intensities and gusts that will impact the stability and control of these vehicles. Furthermore, the integral length scale of turbulence may be such that they are similar to the scales of UAVs; these will provide considerable control challenges in holding relatively steady flight. We are guided by existing literature on helicopter landing and take-off procedures, which is not extensive and is lacking in terms of autonomous operation. Minimization of turbulence and gusts via building or vertiport design are limited and warrant further research.
In this paper we used a CFD simulation of the ambient wind field around a nominally cuboid building in a suburban atmospheric boundary layer. Unperturbed flight paths near the building’s roof were superimposed onto the simulated wind field. A possible worst-case gust for the specified wind speed and building geometry was identified when the flight path traverses the shear layer from the building’s top leading edge, resulting in significant lift force variations. The analysis showed that UAVs would experience a substantial increase in angle of attack over a relatively short period of time (<1 s) as they fly through shear layer at a representative forward velocity, which can be well above typical stall angles. Due to the slow flight speeds required for landing and take-off, significant control authority of rotor systems is required to ensure safe operation due to the high disturbance effects caused by localized gusts from buildings and protruding structures. The analysis is then flowed by regulation and certification recommendations for AAM vehicles and vertiports.
CFD simulation of atmospheric flows is challenging and warrants experimental validation via collection of careful gust measurements either in a wind tunnel environment or by flying aircraft, which should be fitted with responsive anemometers capable of resolving turbulence length scales smaller than a UAV’s characteristic length [94]. The resulting datasets, both computational and experimental, should be interrogated to identify two- and three-dimensional severe gusts. Subsequent work should include furthering the understanding of the transfer functions between a gust flow and the resulting aerodynamic response of the UAV, which could then be used to understand disturbances and control methods to minimize them. This paper used computational gust data to develop basic disturbance models to understand the response of a fixed wing and thrusting disk. In both instances, the effect of a gust around a cuboid building is significant and may cause significant flight perturbations that cannot be ignored. Furthermore, for larger UAV, the magnitude of corrective control required must be acknowledged and considered in the design phase when such vehicles are developed.
Author Contributions
Conceptualization, A.M.; methodology, A.M.; software, A.M. and M.M.; validation, A.M. and M.M.; formal analysis, A.M. and M.M.; investigation, All; resources, All; data curation, A.M. and M.M.; writing—original draft preparation, A.M.; writing—review and editing. All; visualization, A.M. and M.M.; project administration, A.M.; funding acquisition, A.M. All authors have read and agreed to the published version of the manuscript.
Funding
This work has been partially funded and supported by the US Air Force Office for Scientific Research (AFOSR) FA2386-22-1-4078, and Defence Science Institute (DSI) (RHD-0189).
Data Availability Statement
Not applicable.
Acknowledgments
This research was undertaken as part of the RMIT Uncrewed Aircraft Systems Research Team (ruasrt.com), within the Sir Lawrence Wackett Centre, at RMIT University. The work is part of NATO RTO AVT-282 “Unsteady Aerodynamic Response of Rigid Wings in Gust Encounters” and AVT-347 “Large-Amplitude Gust Mitigation Strategies for Rigid Wings”and input of the NATO team is appreciated. The authors are thankful for the insight provide by Mr Rex J Alexander, President of the Five-Alpha LLC and ex-Head of Aviation Infrastructure at Uber.
Conflicts of Interest
The authors declare no conflict of interest.
References
- Stough, P.; Scanlon, C. Numerous research projects support efforts to overcome weather-related hazards. ICAO J. 1999, 20–29. [Google Scholar]
- Kohut, T. 21 Sent to Hospital after Severe Turbulence Diverts Flight AC088 to Calgary; Global News: Toronto, ON, Canada, 2015; Available online: https://globalnews.ca/news/2427003/flight-with-20-injuries-diverted-to-calgary-international-airport/ (accessed on 10 December 2022).
- Bedo, S. Qantas Cabin Crew Injured in Turbulence Scare. 2019. Available online: https://www.news.com.au/national/qantas-cabin-crew-injured-in-turbulence-scare/news-story/528899b3886f77242887e946a78f9c35 (accessed on 1 March 2020).
- Souza, L. Twelve Passengers Injured Due to Severe Turbulence on an Aerolineas Argentinas Airbus A330. 2022. Available online: https://simpleflying.com/twelve-passengers-injured-severe-turbulence-aerolineas-argentinas-airbus-a330/ (accessed on 10 December 2022).
- Pande, P. SpiceJet Passenger Injured In Turbulence Dies Five Months Later. 2022. Available online: https://simpleflying.com/spicejet-turbulence-passenger-death/ (accessed on 10 December 2022).
- Watkins, S.; Milbank, J.; Loxton, B.; Melbourne, W. Atmospheric winds and their effects on micro air vehicles. AIAA J. 2006, 44, 2591–2600. [Google Scholar] [CrossRef]
- Mohamed, A.; Massey, K.; Watkins, S.; Clothier, R. The Attitude Control of Fixed-Wing MAVS in Turbulent Environments. Prog. Aerosp. Sci. 2014, 66, 37–48. [Google Scholar] [CrossRef]
- Hoblit, F.M. Gust Loads on Aircraft: Concepts and Applications; American Institute of Aeronautics and Astronautics: Reston, VA, USA, 1988. [Google Scholar]
- Mohamed, A.; Watkins, S.; OL, M.; Jones, A. Flight-Relevant Gusts: Computation-Derived Guidelines for Micro Air Vehicle Ground Test Unsteady Aerodynamics. J. Aircr. 2020, 1–7. [Google Scholar] [CrossRef]
- Thorn, A. Turbulence Factor in R44 Crash that Killed Pilot and Trainee. 2022. Available online: https://australianaviation.com.au/2022/04/turbulence-factor-in-r44-crash-that-killed-pilot-and-trainee/ (accessed on 10 December 2022).
- Severe Turbulence Caused B.C. Helicopter Crash That Seriously Injured 2, Investigation Finds. 2022. Available online: https://ca.news.yahoo.com/severe-turbulence-caused-b-c-194736055.html?guccounter=1&guce_referrer=aHR0cHM6Ly93d3cuZ29vZ2xlLmNvbS8&guce_referrer_sig=AQAAAJG9lcsg3uLYEePQR4Eh2qW8ph7sHzRJsRQ-E7iDNKjjW9AlwiXj1WRyxzJs_ckdOwlVnGC2J1I_xZeZ7sgx_xdefW7GUvFAK9zMxoNmG1V6YsiR7juy2jse3VeaHKJk8y6a8j40oTrWVYIqdF_yCQ55auAOJlbJOrAFy8GdysH1 (accessed on 10 December 2022).
- Severe Turbulence Led to Helicopter Collision with Terrain on Bowen Island, British Columbia. 2022. Available online: https://canadianaviationnews.wordpress.com/2022/07/29/severe-turbulence-led-to-helicopter-collision-with-terrain-on-bowen-island-british-columbia/ (accessed on 10 December 2022).
- Smith, A.; Bell, A.; Hackett, D. Trade-Offs in Helipad Sitting & Design; Rowan Williams Davies & Irwin Inc.: Guelph, ON, Canada, 2017; pp. 1–10. [Google Scholar]
- Glaser, A. Here’s Why Facebook’s Massive Drone Crashed in the Arizona Desert. 2016. Available online: https://www.vox.com/2016/12/18/13998900/facebooks-drone-crash-aquila-arizona-structural-failure (accessed on 8 December 2020).
- Lye, H. Second Airbus Zephyr UAS Crashes during a Test Flight. 2019. Available online: https://www.airforce-technology.com/news/second-airbus-zephyr-uas-crashes-during-a-test-flight/ (accessed on 10 December 2022).
- Mangan, D.; Breuninger, K. One Dead after Helicopter Crash-Lands on Roof of Midtown Manhattan Building. 2019. Available online: https://www.cnbc.com/2019/06/10/helicopter-crashes-into-building-in-midtown-manhattan.html (accessed on 3 March 2020).
- Farell, C.; Sitheeq, M.M.; Ellis, C.R.; Voigt, R.L., Jr. Fairview Riverside Medical Center Helistop, Minneapolis, Minnesota: Design and Operational Issues; St. Anthony Falls Hydraulic Laboratory: Minneapolis, MN, USA, 1995. [Google Scholar]
- Horn, J.F.; Keller, J.D.; Whitehouse, G.R.; McKillip, R.M., Jr. Analysis of Urban Airwake Effects on Heliport Operations at the Chicago Children’s Memorial Hospital. In Final Report Submitted to Illinois Department of Transportation; Researchgate: Berlin, Germany, 2011. [Google Scholar]
- McKinley, J.B. Evaluating Wind Flow around Buildings on Heliport Placement; West Palm Beach Fl Champlain Technology; Systems Control Technology Inc.: Idaho Falls, ID, USA, 1984. [Google Scholar]
- Civil Aviation Authority. Helideck Design Considerations–Environmental Effects; CAA Paper: Norwich, UK, 2008; Volume 3. [Google Scholar]
- Nakayama, M.; Uchiami, Y.; Watagami, K.; Ui, K. Wind tunnel test to design helidecks on the rooftops of high-rise buildings. J. Wind. Eng. Ind. Aerodyn. 1991, 38, 459–468. [Google Scholar]
- Perrotta, G.; Jones, A.R. Unsteady forcing on a flat-plate wing in large transverse gusts. Exp. Fluids 2017, 58, 101. [Google Scholar]
- Andreu-Angulo, I.; Babinsky, H.; Biler, H.; Sedky, G.; Jones, A.R. Effect of transverse gust velocity profiles. AIAA J. 2020, 58, 5123–5133. [Google Scholar] [CrossRef]
- Biler, H.; Sedky, G.; Jones, A.R.; Saritas, M.; Cetiner, O. Experimental investigation of transverse and vortex gust encounters at low Reynolds numbers. AIAA J. 2021, 59, 786–799. [Google Scholar] [CrossRef]
- Granlund, K.; Monnier, B.; Ol, M.; Williams, D. Airfoil longitudinal gust response in separated vs. attached flows. Phys. Fluids 2014, 26, 027103. [Google Scholar] [CrossRef]
- Biler, H.; Badrya, C.; Jones, A.R. Experimental and computational investigation of transverse gust encounters. AIAA J. 2019, 57, 4608–4622. [Google Scholar] [CrossRef]
- Jones, A.R.; Cetiner, O.; Smith, M.J. Physics and modeling of large flow disturbances: Discrete gust encounters for modern air vehicles. Annu. Rev. Fluid Mech. 2022, 54, 469–493. [Google Scholar] [CrossRef]
- Jones, A.R.; Cetiner, O. Overview of unsteady aerodynamic response of rigid wings in gust encounters. AIAA J. 2021, 59, 731–736. [Google Scholar] [CrossRef]
- Eldredge, J.D.; Jones, A.R. Leading-edge vortices: Mechanics and modeling. Annu. Rev. Fluid Mech. 2019, 75–104. [Google Scholar] [CrossRef]
- Watkins, S.; Thompson, M.; Loxton, B.; Abdulrahim, M. On Low Altitude Flight through The Atmospheric Boundary Layer. Int. J. Micro Air Veh. 2010, 2, 55–67. [Google Scholar] [CrossRef]
- Mohamed, A.; Watkins, S.; Clothier, R.; Abdulrahim, M. Influence of Turbulence on MAV Roll Perturbations. Int. J. Micro Air Veh. 2014, 6, 175–190. [Google Scholar] [CrossRef]
- Chen, T.; Clothier, R.; Mohamed, A.; Badawy, R. An Experimental Study of Human Performance in Controlling Micro Air Vehicles in Turbulent Environment. In Proceedings of the Fourth Australasian Unmanned Systems Conference, Melbourne, Australia, 15–16 December 2014; pp. 1–8. [Google Scholar]
- Holmes, J.D. Wind Loading of Structures; CRC Press: Boca Raton, FL, USA, 2001. [Google Scholar]
- Peterka, J.; Meroney, R.; Kothari, K. Wind flow patterns about buildings. J. Wind Eng. Ind. Aerodyn. 1985, 21, 21–38. [Google Scholar] [CrossRef]
- Leuzzi, G.; Monti, P. Particle trajectory simulation of dispersion around a building. Atmos. Environ. 1998, 32, 203–214. [Google Scholar] [CrossRef]
- Zhang, Y.; Arya, S.; Snyder, W. A comparison of numerical and physical modeling of stable atmospheric flow and dispersion around a cubical building. Atmos. Environ. 1996, 30, 1327–1345. [Google Scholar] [CrossRef]
- Ferreira, A.D.; Sousa, A.C.M.; Viegas, D.X. Prediction of building interference effects on pedestrian level comfort. J. Wind Eng. Ind. Aerodyn. 2002, 90, 305–319. [Google Scholar] [CrossRef]
- Mochida, A.; Lun, I.Y.F. Prediction of wind environment and thermal comfort at pedestrian level in urban area. J. Wind Eng. Ind. Aerodyn. 2008, 96, 1498–1527. [Google Scholar] [CrossRef]
- Lim, K.E.; Watkins, S.; Clothier, R.; Ladani, R.; Mohamed, A.; Palmer, J.L. Full-scale flow measurement on a tall building with a continuous-wave Doppler Lidar anemometer. J. Wind Eng. Ind. Aerodyn. 2016, 154, 69–75. [Google Scholar] [CrossRef]
- Tsinober, A. An Informal Conceptual Introduction to Turbulence; Springer: Berlin/Heidelberg, Germany, 2009; Volume 483. [Google Scholar]
- Baklanov, A.A.; Grisogono, B.; Bornstein, R.; Mahrt, L.; Zilitinkevich, S.S.; Taylor, P.; Larsen, S.E.; Rotach, M.W.; Fernando, H.J.S. The Nature, Theory, and Modeling of Atmospheric Planetary Boundary Layers. Bull. Am. Meteorol. Soc. 2011, 92, 123–128. [Google Scholar] [CrossRef]
- Garratt, J.R. The Atmospheric Boundary Layer; Cambridge University Press: Cambridge, UK, 1994. [Google Scholar]
- Thompson, M. The Small Scales of Turbulence in Atmospheric Winds at Heights Relevant to Mavs. Doctoral Dissertation, RMIT University, Melbourne, Australia, 2013. [Google Scholar]
- Mohamed, A.; Carrese, R.; Fletcher, D.; Watkins, S. Scale-resolving simulation to predict the updraught regions over buildings for MAV orographic lift soaring. J. Wind Eng. Ind. Aerodyn. 2015, 140, 34–48. [Google Scholar] [CrossRef]
- Liepmann, H. On the application of statistical concepts to the buffeting problem. J. Aeronaut. Sci. 1952, 19, 793–800. [Google Scholar] [CrossRef]
- Dowell, E.H.; Crawley, E.F.; Curtiss, H.C., Jr.; Peters, D.A.; Scanlan, R.H.; Sisto, F. A Modern Course in Aeroelasticity, 3rd revised and enlarged Ed ed.; Kluwer Academic Publishers: Boston, MA, USA, 1995; pp. 327–337. [Google Scholar]
- Von Karman, T. Progress in the statistical theory of turbulence. Proc. Natl. Acad. Sci. USA 1948, 34, 530–539. [Google Scholar] [CrossRef] [PubMed]
- Diederich, F.W.; Drischler, J.A. Effect of Spanwise Variations in Gust Intensity on the Lift Due to Atmospheric Turbulence; NACA TN 3920; 1957. [Google Scholar]
- Dryden, H.L. Turbulence investigations at the National Bureau of Standards. In Proceedings of the Fifth International Congress of Applied Mechanics, Cambridge, MA, USA, 12–16 September 1938. [Google Scholar]
- Heisenberg, W. Zur statistischen theorie der turbulenz. Z. Phys. 1948, 124, 628–657. [Google Scholar] [CrossRef]
- Kolmogorov, A.N. The Local Structure of Turbulence in Incompressible Viscous Fluid for Very Large Reynolds’ Numbers. Proc. R. Soc. London. Ser. A-Math. Phys. Sci. 1991, 434, 9–13. [Google Scholar]
- Liepmann, H.; Laufer, J.; Liepmann, K. On the Spectrum of Isotropic Turbulence; NACA TN 2473; National Advisory Committee for Aeronautics: Washington, DC, USA, 1951. [Google Scholar]
- Standard, M. Flying Qualities of Piloted Aircraft; US Dept. of Defense MIL-STD-1797A; 1990. [Google Scholar]
- Zbrozek, J. The Relationship between the Discrete Gust and Power Spectra Presentations of Atmospheric Turbulence, with a Suggested Model of Low-Altitude Turbulence; Royal Aeronautical Establishment, Aeronautical Research Council, Reports and Memoranda; 1961. [Google Scholar]
- Etkin, B. Theory of the Flight of Airplanes in Isotropic Turbulence-Review and Extension; Advisory Group for Aeronautical Research and Development Paris (France): Neuilly-sur-Seine, France, 1961. [Google Scholar]
- Skelton, G.B. Investigation of the Effects of Gusts on V/STOL Craft in Transition and Hover; Air Force Flight Dynamics Laboratory Technical Report; 1968. [Google Scholar]
- ESDU. Characteristics of Atmospheric Turbulence near the Ground. Part II: Single Point Data for Strong Winds (Neutral Atmosphere); 1985. [Google Scholar]
- Watkins, S.; Cooper, K.R. The Unsteady Wind Environment of Road Vehicles, Part Two: Effects on Vehicle Development and Simulation of Turbulence; SAE Technical Paper; 2007. [Google Scholar]
- Lissaman, P. Effects of Turbulence on Bank Upsets of Small Flight Vehicles. In Proceedings of the 47th AIAA Aerospace Sciences Meeting including the New Horizons Forum and Aerospace Exposition, Orlando, FL, USA, 5–8 January 2009. [Google Scholar]
- Thompson, M.; Watkins, S.; White, C.; Holmes, J. Span-wise wind fluctuations in open terrain as applicable to small flying craft. Aeronaut. J. 2011, 115, 693–701. [Google Scholar] [CrossRef]
- Wang, L.; Dai, Y.; Yang, C. Gust response analysis for helicopter rotors in the hover and forward flights. Shock Vib. 2017, 2017, 8986217. [Google Scholar] [CrossRef]
- Diederich, F.W. The dynamic response of a large airplane to continuous random atmospheric disturbances. J. Aeronaut. Sci. 1956, 23, 917–930. [Google Scholar] [CrossRef]
- Fadl, M.S.; Karadelis, J. CFD simulation for wind comfort and safety in urban area: A case study of Coventry University central campus. Int. J. Archit. Eng. Constr. 2013, 2, 131–143. [Google Scholar] [CrossRef]
- Watkins, S.; Mohamed, A.; Fisher, A.; Clothier, R.; Carrese, R.; Fletcher, D. Towards Autonomous MAV Soaring in Cities: CFD Simulation, EFD Measurement and Flight Trials. Int. J. Micro Air Veh. 2015, 7, 441–448. [Google Scholar] [CrossRef]
- Blocken, B.; Stathopoulos, T.; Carmeliet, J. CFD simulation of the atmospheric boundary layer: Wall function problems. Atmos. Environ. 2007, 41, 238–252. [Google Scholar] [CrossRef]
- Mohamed, A.; Abdulrahim, M.; Watkins, S.; Clothier, R. Development and Flight Testing of a Turbulence Mitigation System for MAVs. J. Field Robot. 2016, 35, 639–660. [Google Scholar] [CrossRef]
- Mohamed, A.; Watkins, S.; Clothier, R.; Abdulrahim, M.; Massey, K.; Sabatini, R. Fixed-Wing MAV Attitude Stability in Atmospheric Turbulence PART 2: Investigating Biologically-Inspired Sensors. Prog. Aerosp. Sci. 2014, 71, 1–13. [Google Scholar] [CrossRef]
- Panta, A.; Petersen, P.; Marino, M.; Watkins, S.; Fisher, A.; Mohamed, A. Qualitative investigation of the dynamics of a leading edge control surfaces for MAV applications. In Proceedings of the International Micro Air Vehicle Conference and Flight Competition (IMAV 2017), Toulouse, France, 18–21 September 2017; pp. 1–8. [Google Scholar]
- Medina, a.; Ol, m.V.; mancini, p.; Jones, a. Revisiting Conventional Flaps at High Deflection Rate. AIAA J. 2016, 55, 2676–2685. [Google Scholar] [CrossRef]
- Lei, Y.; Huang, Y.; Wang, H. Effects of wind disturbance on the aerodynamic performance of a quadrotor MAV during hovering. J. Sens. 2021, 2021, 6681716. [Google Scholar] [CrossRef]
- Nguyen, D.H.; Liu, Y.; Mori, K. Experimental study for aerodynamic performance of quadrotor helicopter. Trans. Jpn. Soc. Aeronaut. Space Sci. 2018, 61, 29–39. [Google Scholar] [CrossRef]
- Zhou, Q.; Chen, G.; Da Ronch, A.; Li, Y. Reduced order unsteady aerodynamic model of a rigid aerofoil in gust encounters. Aerosp. Sci. Technol. 2017, 63, 203–213. [Google Scholar] [CrossRef]
- Guo, S.; Jing, Z.; Li, H.; Lei, W.; He, Y. Gust response and body freedom flutter of a flying-wing aircraft with a passive gust alleviation device. Aerosp. Sci. Technol. 2017, 70, 277–285. [Google Scholar] [CrossRef]
- Rajpal, D.; Gillebaart, E.; De Breuker, R. Preliminary aeroelastic design of composite wings subjected to critical gust loads. Aerosp. Sci. Technol. 2019, 85, 96–112. [Google Scholar] [CrossRef]
- Bekemeyer, P.; Timme, S. Flexible aircraft gust encounter simulation using subspace projection model reduction. Aerosp. Sci. Technol. 2019, 86, 805–817. [Google Scholar] [CrossRef]
- De Souza Siqueira Versiani, T.; Silvestre, F.J.; Neto, A.B.G.; Rade, D.A.; da Silva, R.G.A.; Donadon, M.V.; Bertolin, R.M.; Silva, G.C. Gust load alleviation in a flexible smart idealized wing. Aerosp. Sci. Technol. 2019, 86, 762–774. [Google Scholar] [CrossRef]
- Bronz, M.; Gavrilovic, N.; Drouin, A.; Hattenberger, G.; Moschetta, J.-M. Flight Testing of Dynamic Soaring Part-1: Leeward Inclined Circle Trajectory. In Proceedings of the AIAA Scitech 2021 Forum, Virtual Event, 11–15 & 19–21 January 2021. [Google Scholar]
- Gavrilovic, N.; Benard, E.; Pastor, P.; Moschetta, J.-M. Performance improvement of small unmanned aerial vehicles through gust energy harvesting. J. Aircr. 2018, 55, 741–754. [Google Scholar] [CrossRef]
- Mohamed, A.; Taylor, G.; Watkins, S.; Windsor, S. Opportunistic soaring by birds suggests new opportunities for atmospheric energy harvesting by flying robots. J. R. Soc. Interface 2022, 19, 20220671. [Google Scholar] [CrossRef] [PubMed]
- Poksawat, P. Control System for Fixed-Wing Unmanned Aerial Vehicles: Automatic Tuning, Gain Scheduling, and Turbulence Mitigation. Ph.D. Thesis, RMIT University, Melbourne, Australia, 2018. Available online: https://researchrepository.rmit.edu.au/esploro/outputs/doctoral/Control-system-for-fixed-wing-unmanned-aerial-vehicles-automatic-tuning-gain-scheduling-and-turbulence-mitigation/9921864086901341 (accessed on 22 December 2022).
- Poksawat, P.; Wang, L.; Mohamed, A. Gain scheduled attitude control of fixed-wing UAV with automatic controller tuning. IEEE Trans. Control. Syst. Technol. 2017, 26, 1192–1203. [Google Scholar]
- Poksawat, P.; Wang, L.; Mohamed, A. Automatic tuning of attitude control system for fixed-wing unmanned aerial vehicles. IET Control. Theory Appl. 2016, 10, 2233–2242. [Google Scholar]
- Panta, A. Dynamics of leading-edge and trailing-edge control surfaces at low Reynolds number. Nat. Sci. Rep. 2022; in press. [Google Scholar]
- Sattar, A.; Wang, L.; Mohamed, A.; Panta, A.; Fisher, A. System Identification of Fixed-wing UAV with Multi-segment Control Surfaces. In Proceedings of the 2019 Australian & New Zealand Control Conference (ANZCC), Auckland, New Zealand, 27–29 November 2019. [Google Scholar]
- Panta, A.; Mohamed, A.; Marino, M.; Watkins, S.; Fisher, A. Unconventional control solutions for small fixed wing unmanned aircraft. Prog. Aerosp. Sci. 2018, 102, 122–135. [Google Scholar] [CrossRef]
- Gigacz, R.; Mohamed, A.; Poksawat, P.; Watkins, S.; Panta, A. Developing a Stable UAS for Operation in Turbulent Urban Environments. In Proceedings of the International Micro Air Vehicles Conference and Flight Competition 2017, Toulouse, France, 18–21 September 2017. [Google Scholar]
- Mohamed, A.; Clothier, R.; Watkins, S.; Sabatini, R.; Abdulrahim, M. Fixed-Wing MAV Attitude Stability in Atmospheric Turbulence PART 1: Suitability of Conventional Sensors. Prog. Aerosp. Sci. 2014, 70, 69–82. [Google Scholar]
- Mentzoni, F.; Ertesvåg, I.S. On turbulence criteria and model requirements for numerical simulation of turbulent flows above offshore helidecks. J. Wind. Eng. Ind. Aerodyn. 2015, 142, 164–172. [Google Scholar]
- Rowe, S.J.; Howson, D.; Turner, G. A turbulence criterion for safe helicopter operations to offshore installations. Aeronaut. J. 2006, 110, 749–758. [Google Scholar]
- Garcia-Magariño, A.; Bardera, R.; Sor, S.; Matias-Garcia, J.C. Flow Control Devices in Cities for Urban Air Mobility. In Proceedings of the AIAA AVIATION 2020 FORUM, Virtual, 15–19 June 2020. [Google Scholar]
- Heliport Design, in Advisory Circular. Federal Aviation Administration: Washington, DC, USA, 2023. Available online: https://www.faa.gov/documentLibrary/media/Advisory_Circular/AC_150_5390_2D_Heliports.pdf (accessed on 22 December 2022).
- Bassey, R. Vertiport Design. In Engineering Brief; Federal Aviation Administration: Washington, DC, USA, 2022. Available online: https://www.faa.gov/airports/engineering/engineering_briefs/engineering_brief_105_vertiport_design (accessed on 22 December 2022).
- City of London Corporation. In Wind Microclimate Guidlines for Developments in the City of London; City of London Corporation: London, UK; 2019. Available online: https://www.cityoflondon.gov.uk/services/planning/microclimate-guidelines (accessed on 22 December 2022).
- Prudden, S.; Fisher, A.; Mohamed, A.; Watkins, S. An anemometer for UAS-based atmospheric wind measurements. In Proceedings of the 17th Australian International Aerospace Congress (AIAC 2017), Melbourne, Australia, 26–28 February 2017. [Google Scholar]
Figure 1.
Notional flow field about a building generated by atmospheric winds.
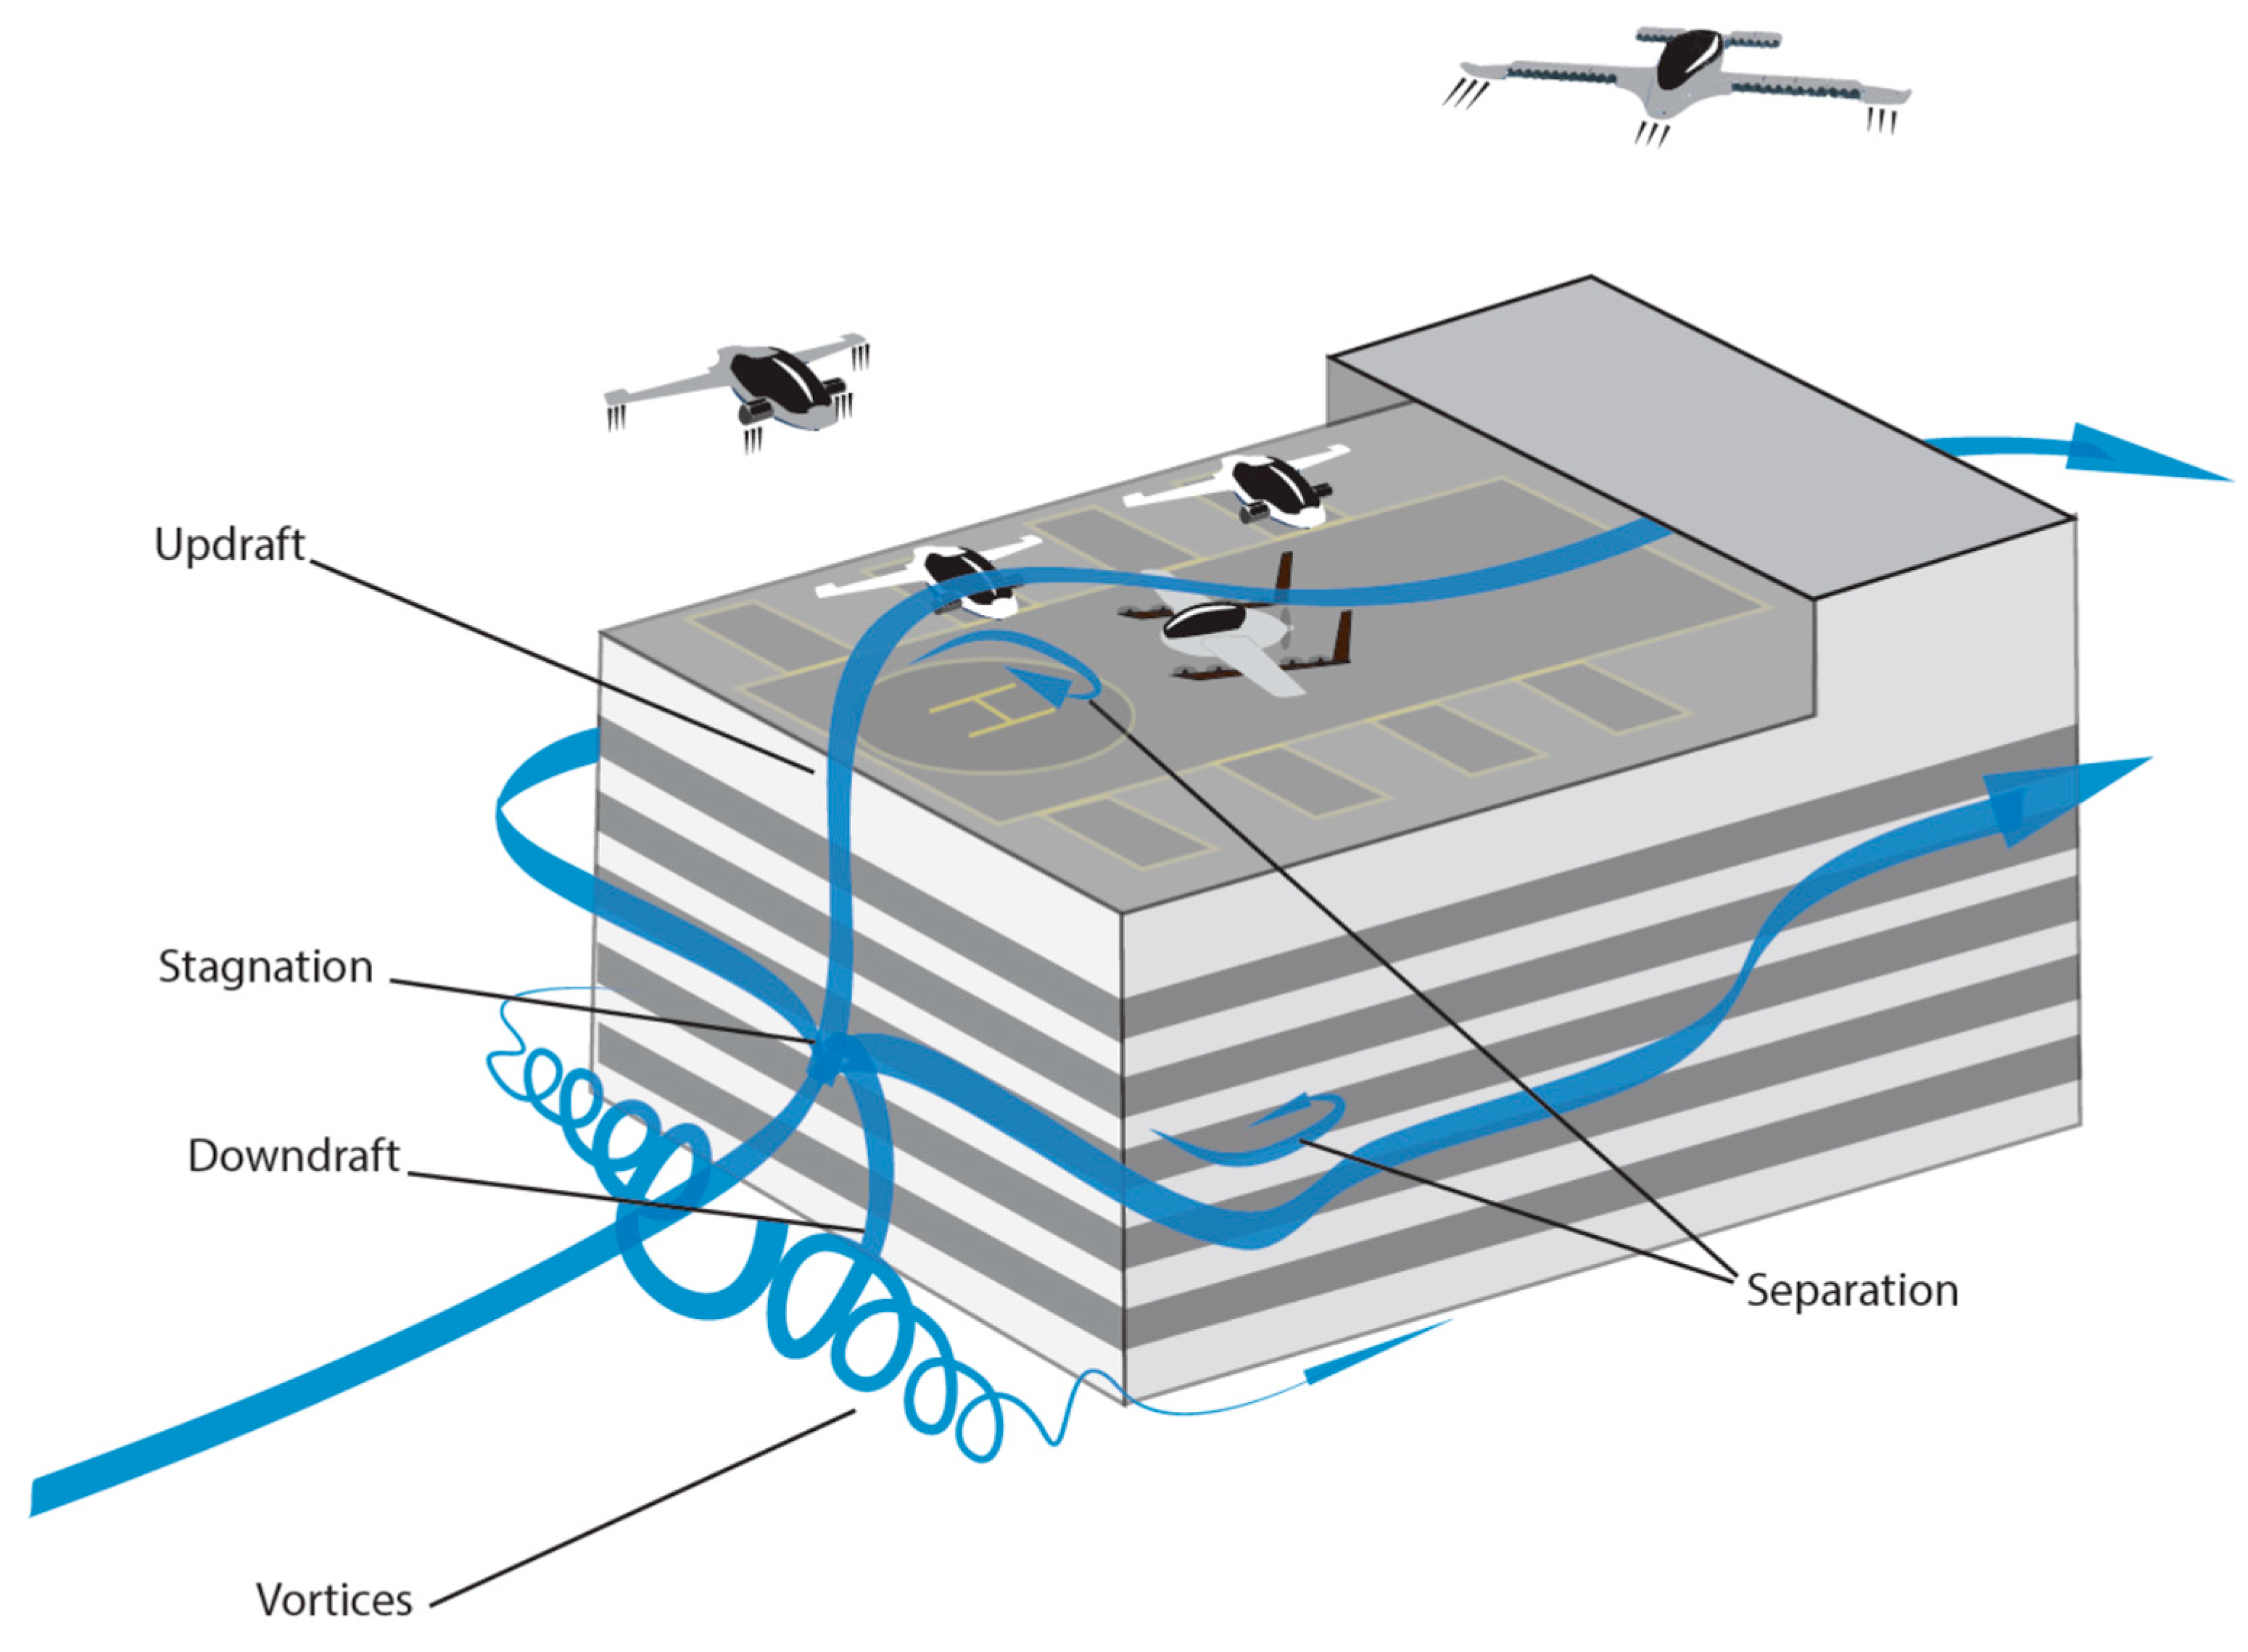
Figure 2.
Instantaneous velocities in the atmosphere in an urban environment. Flow travels from left to right. With the reference height and velocity as U∞ = 3 m/s and y∞ = 10 m, this results in a domain (average) Re of approximately 2.05 × 10⁶ [44].
Figure 2.
Instantaneous velocities in the atmosphere in an urban environment. Flow travels from left to right. With the reference height and velocity as U∞ = 3 m/s and y∞ = 10 m, this results in a domain (average) Re of approximately 2.05 × 10⁶ [44].
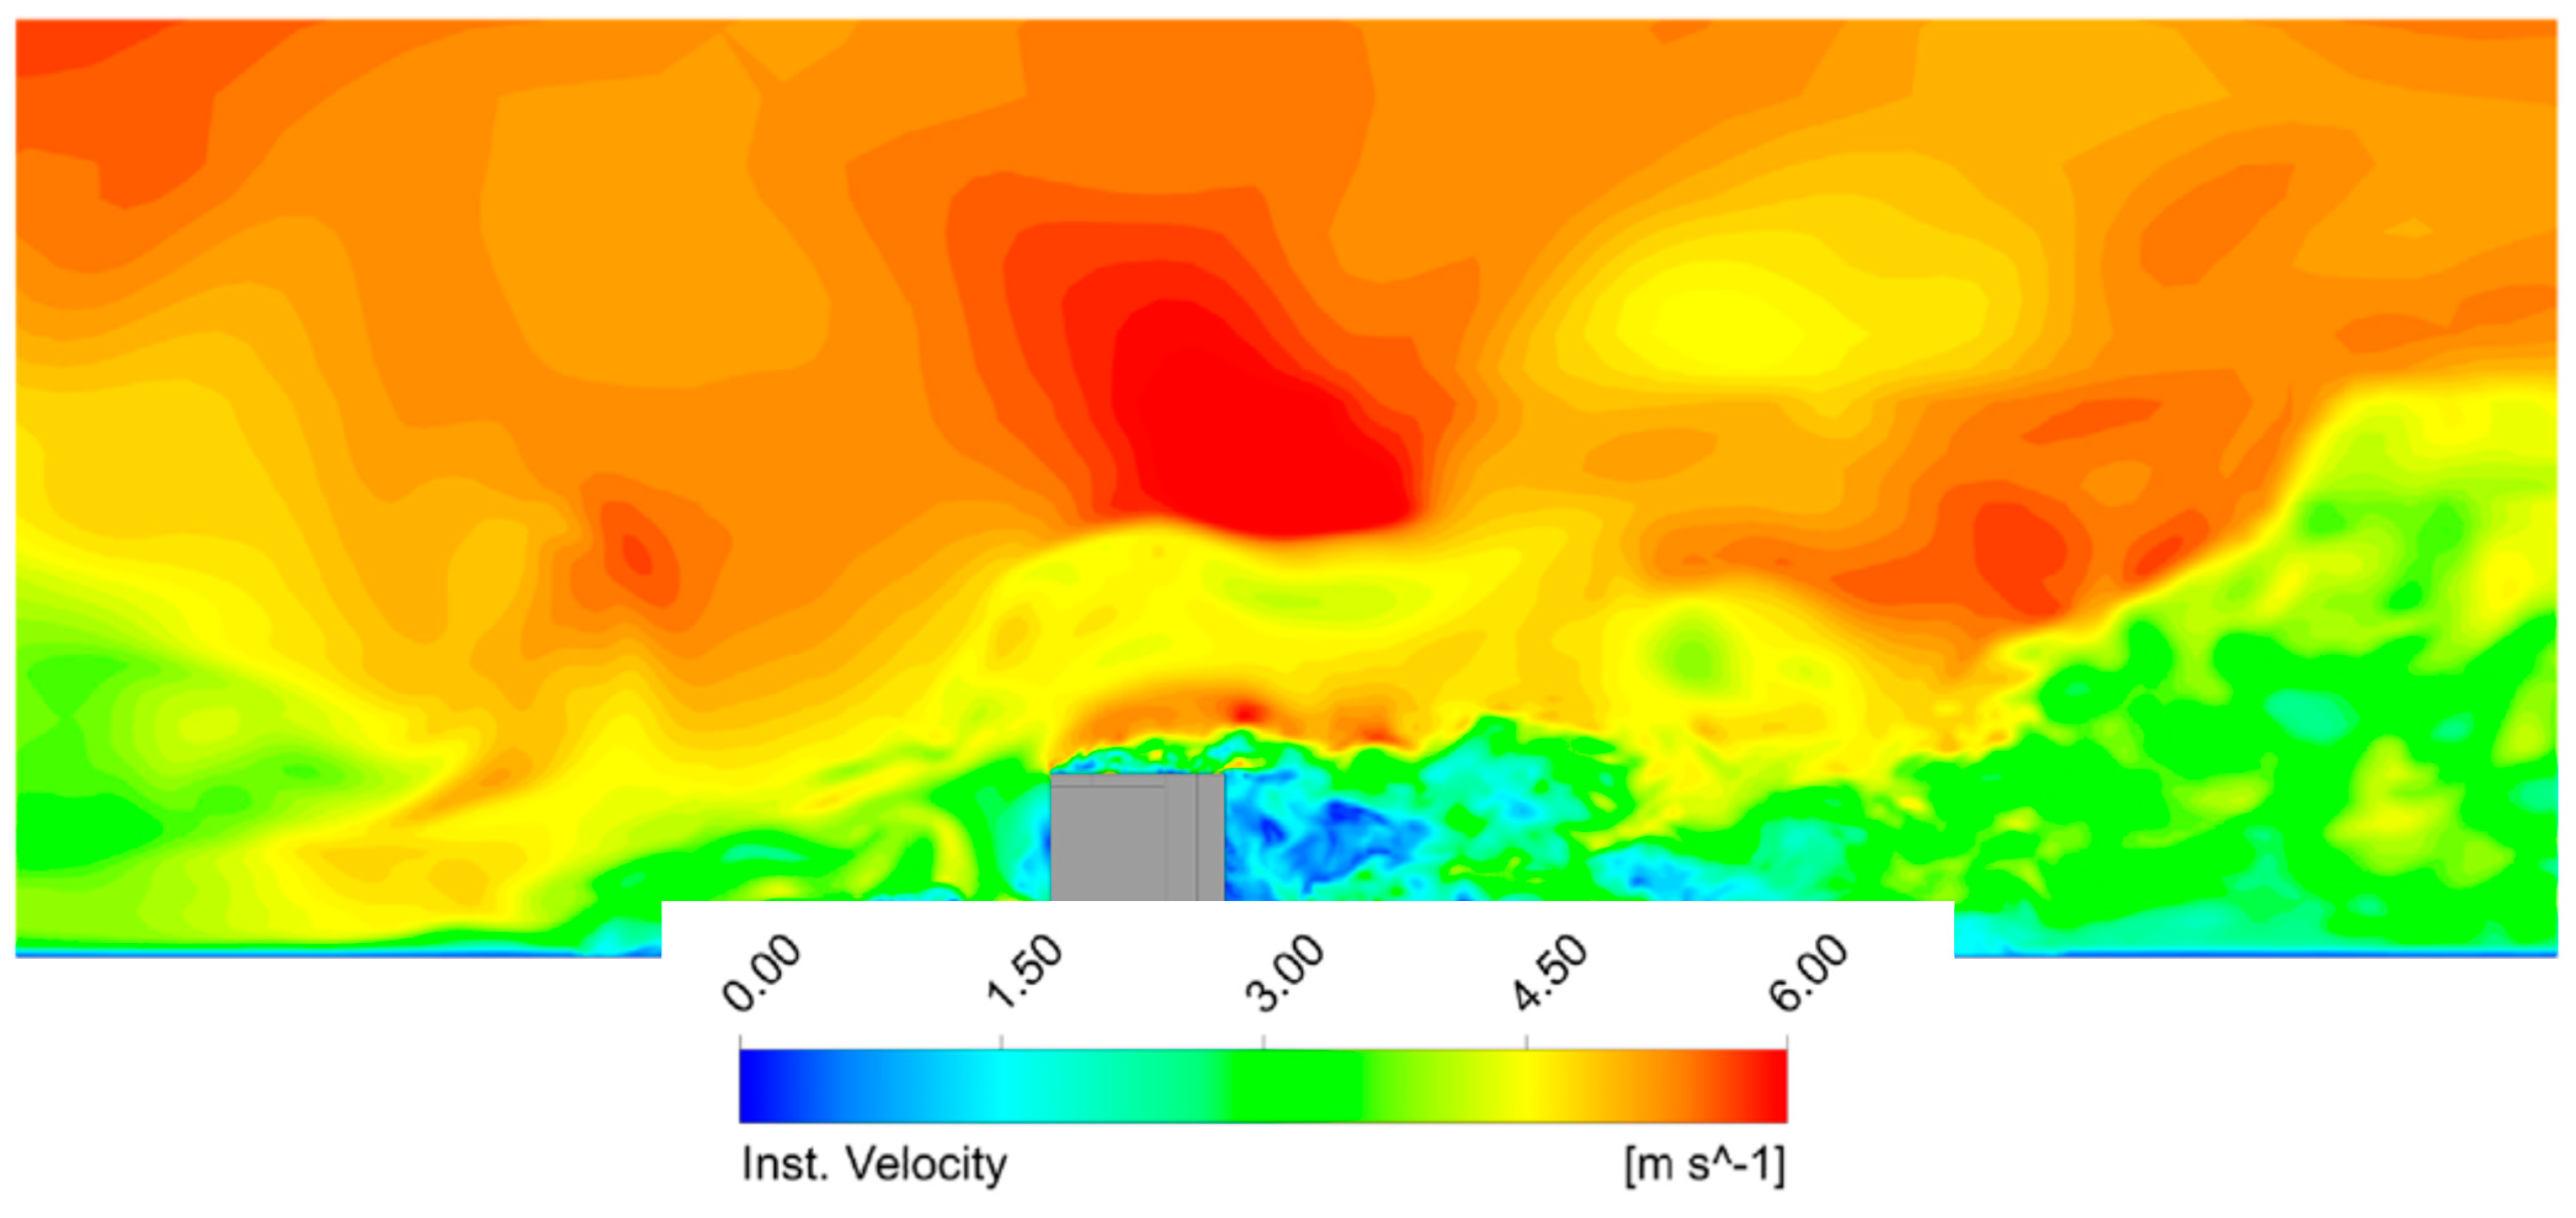
Figure 3.
The atmospheric environment in an urban location.
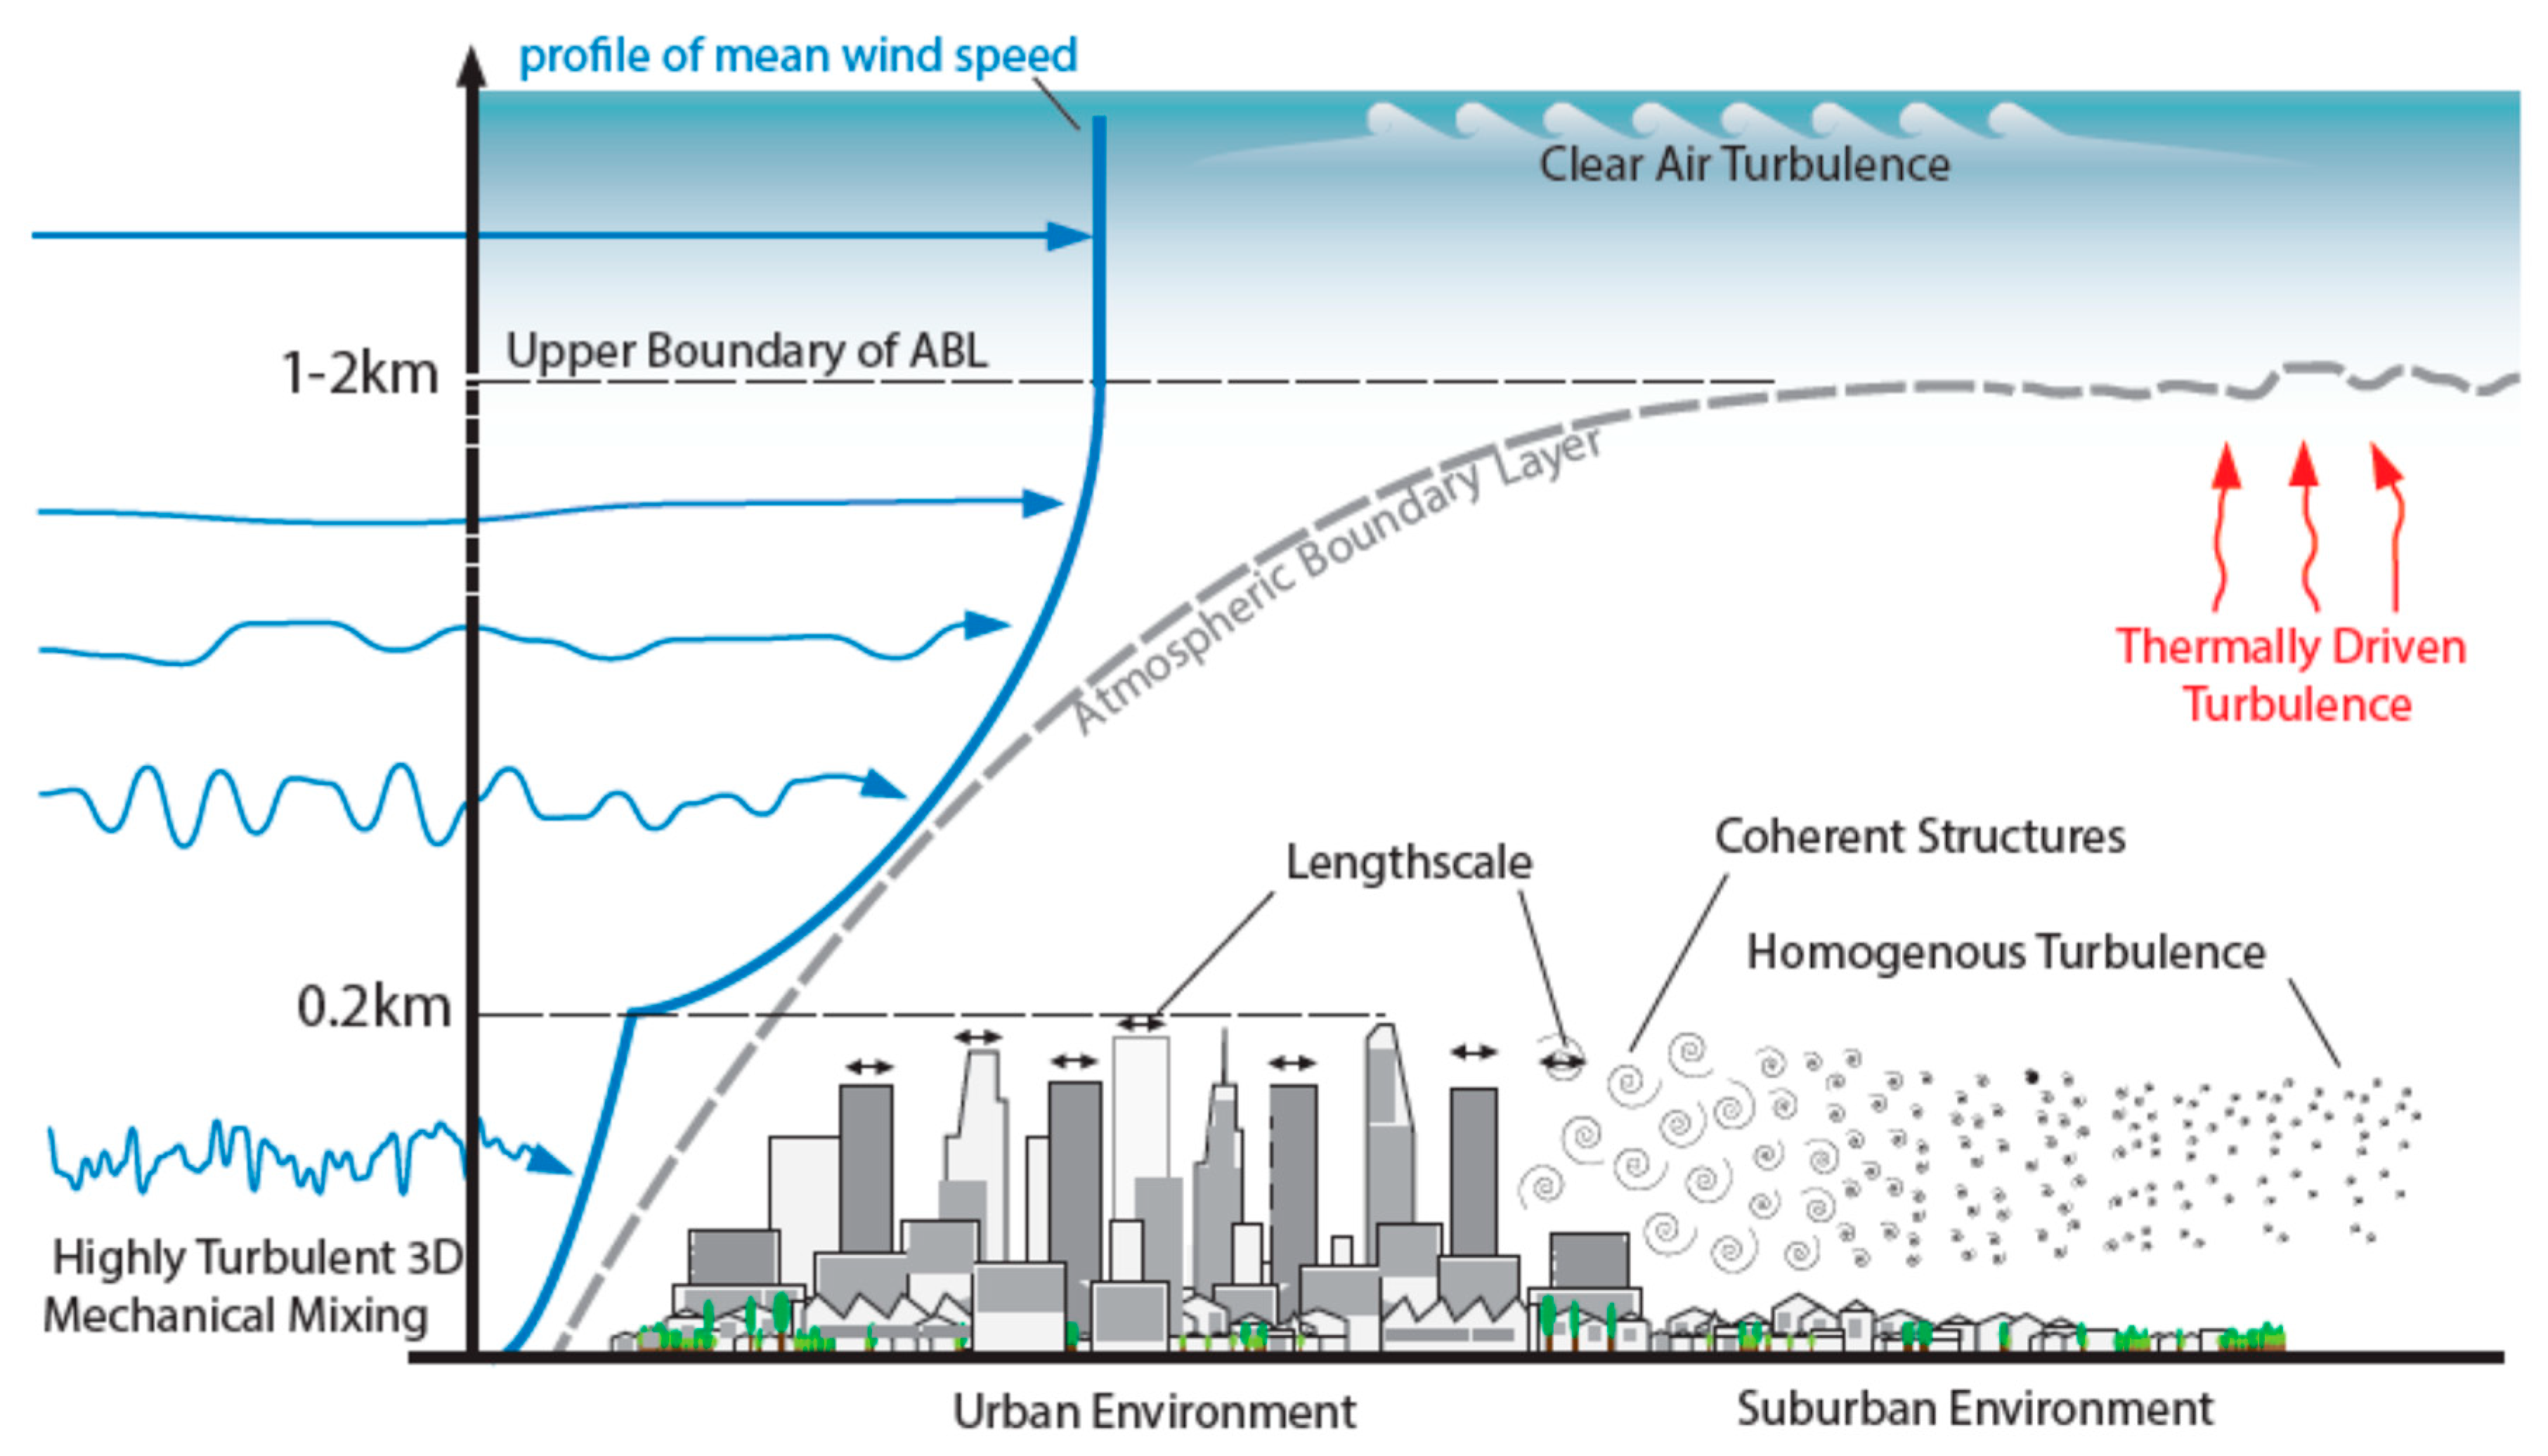

Figure 5.
Aircraft and wind velocity vectors.
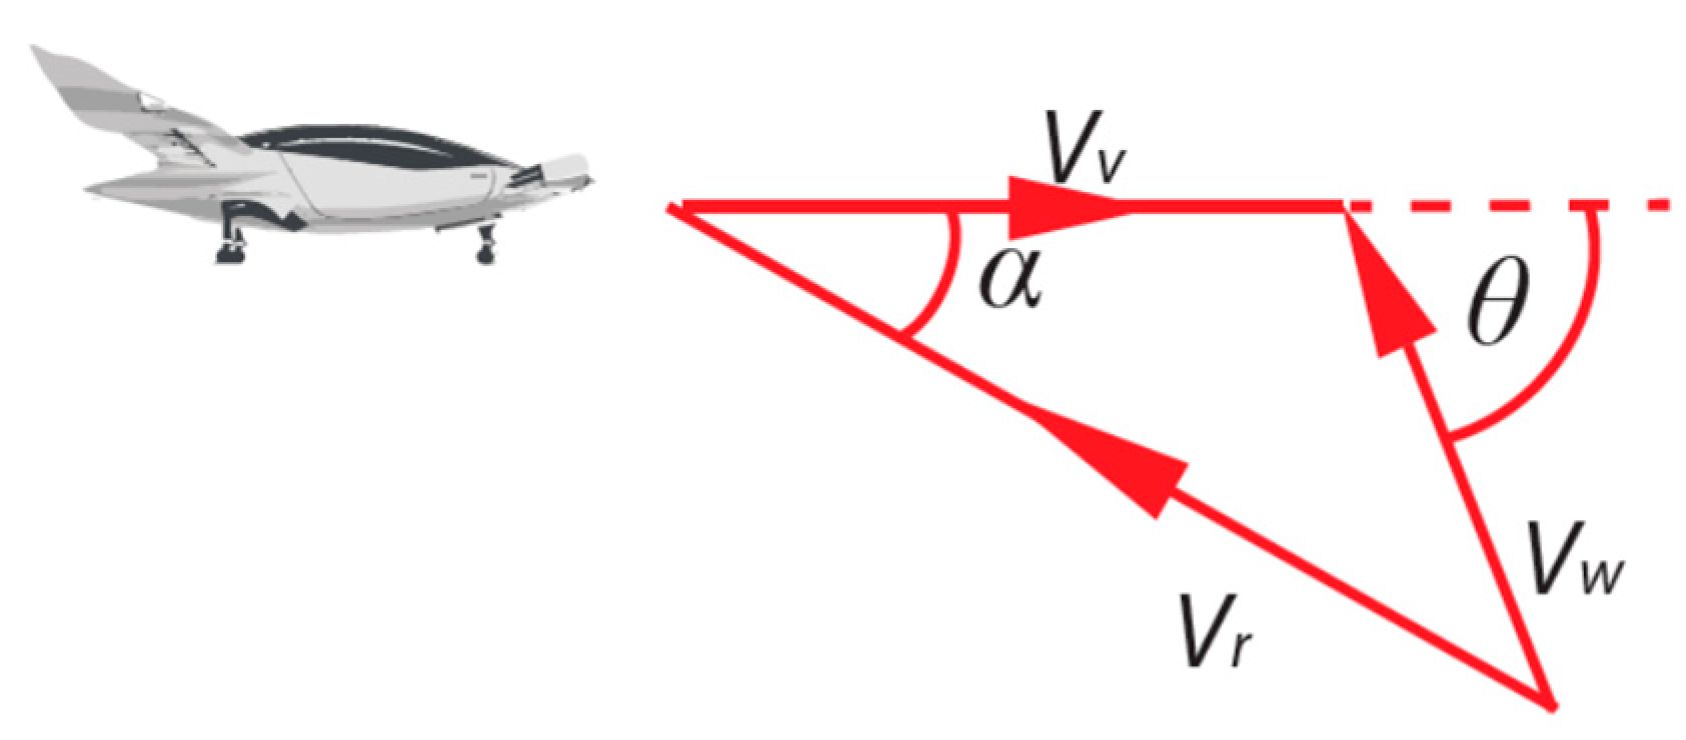
Figure 6.
Effect of gust length scale on wing loading. Adapted from Lissaman [59].
Figure 6.
Effect of gust length scale on wing loading. Adapted from Lissaman [59].
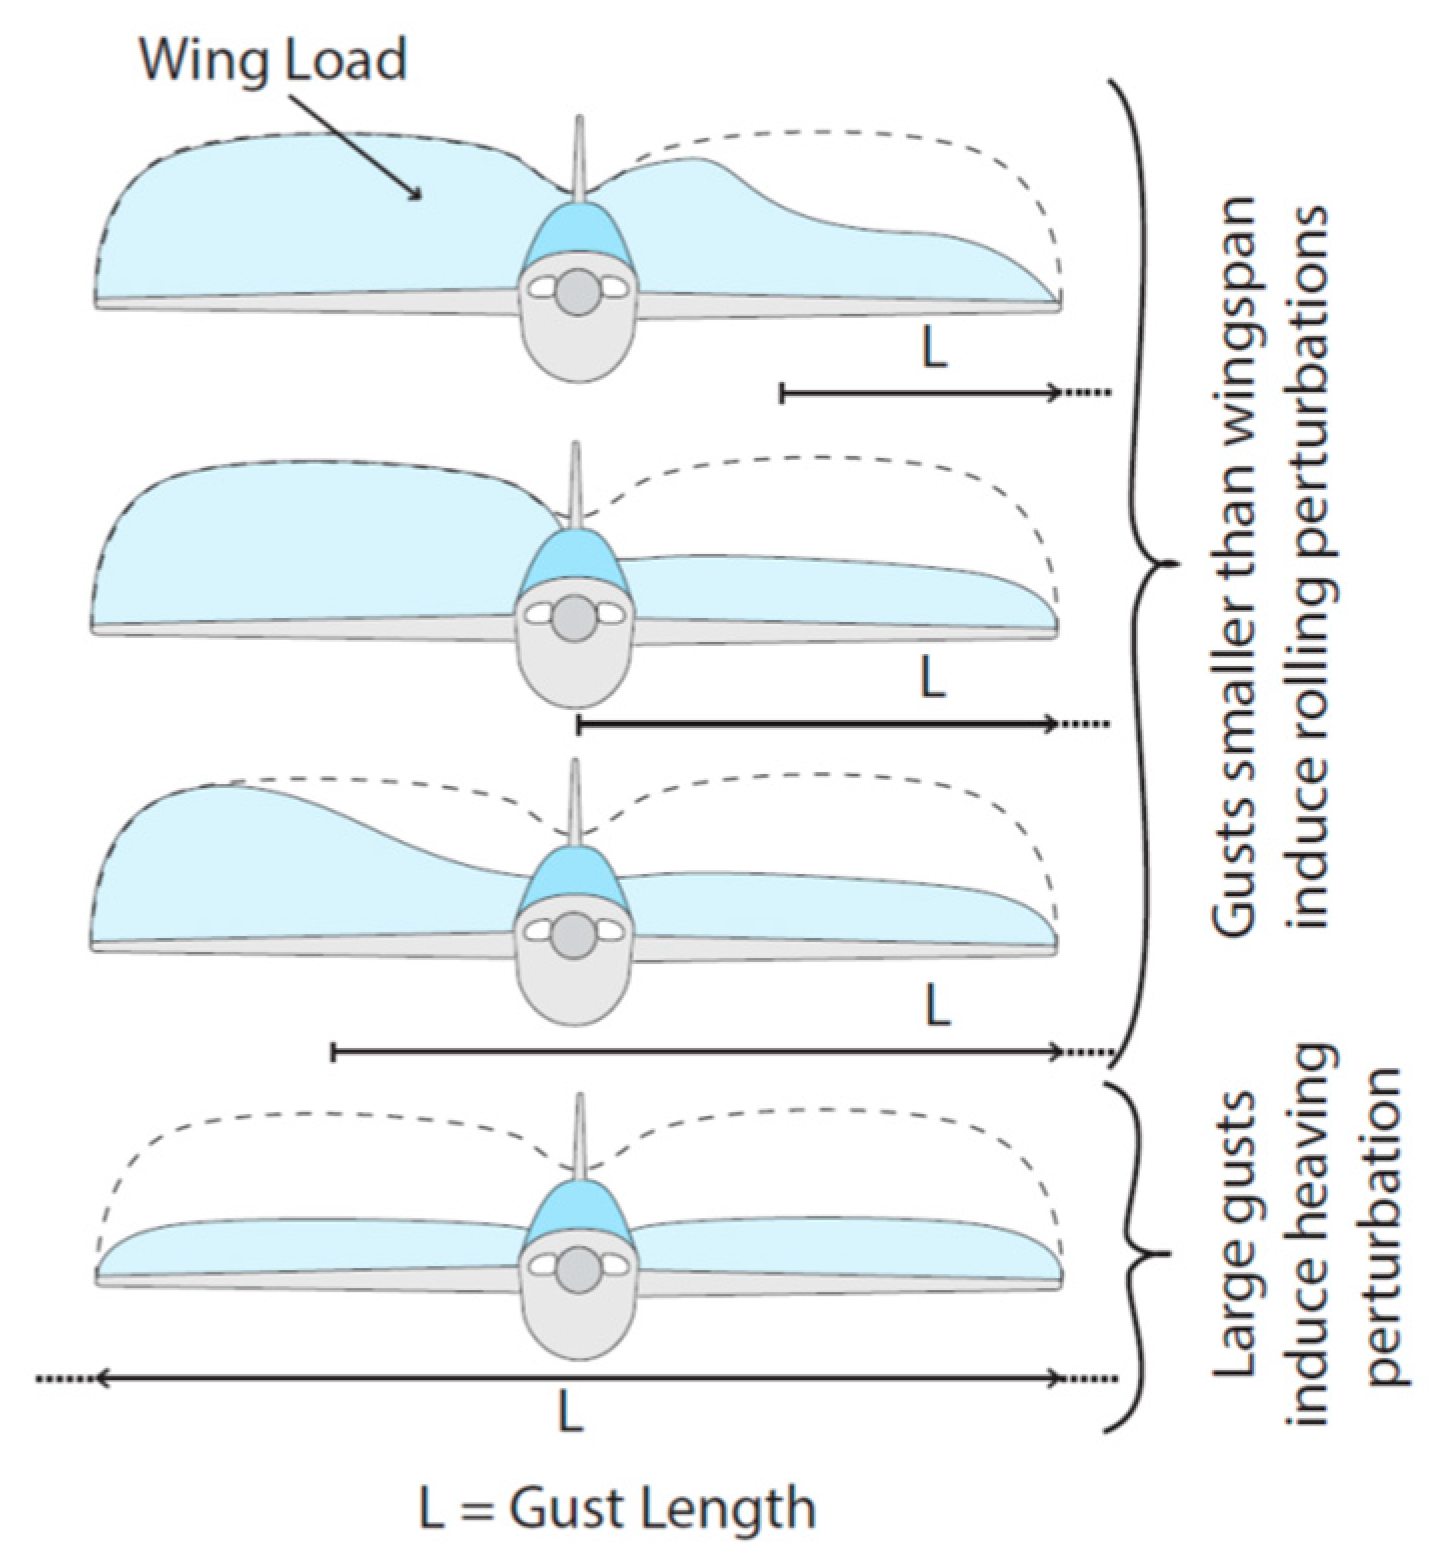
Figure 7.
Pitch angle variation: (a) 2-s sample (b) 0.2-s sample [6].
Figure 7.
Pitch angle variation: (a) 2-s sample (b) 0.2-s sample [6].
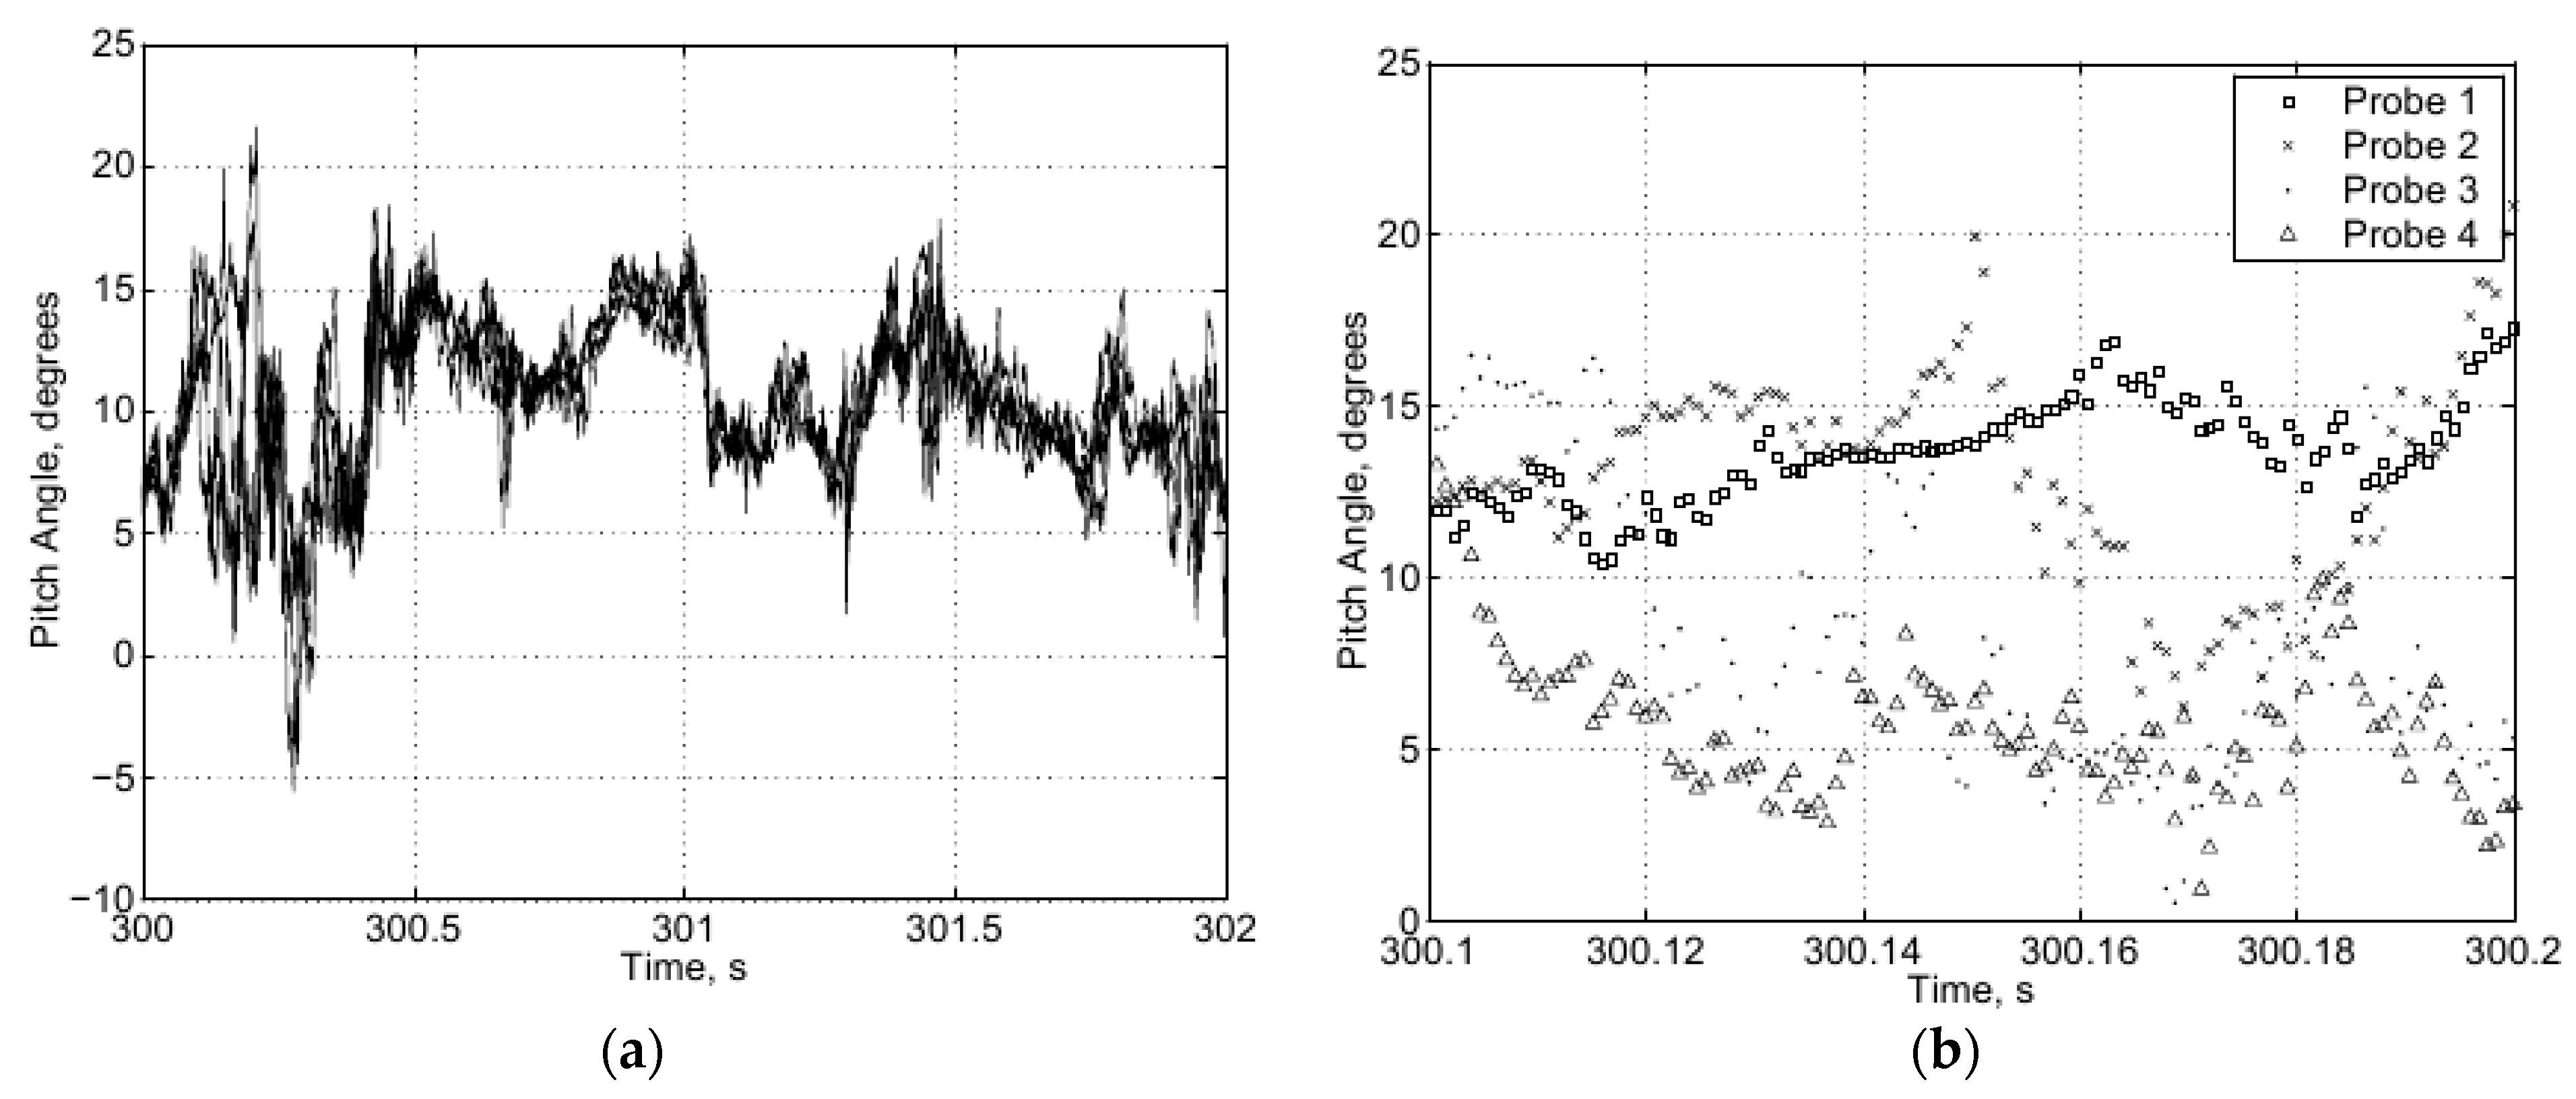
Figure 8.
Dimensionality of gusts (modified from Diederich [62]).
Figure 8.
Dimensionality of gusts (modified from Diederich [62]).
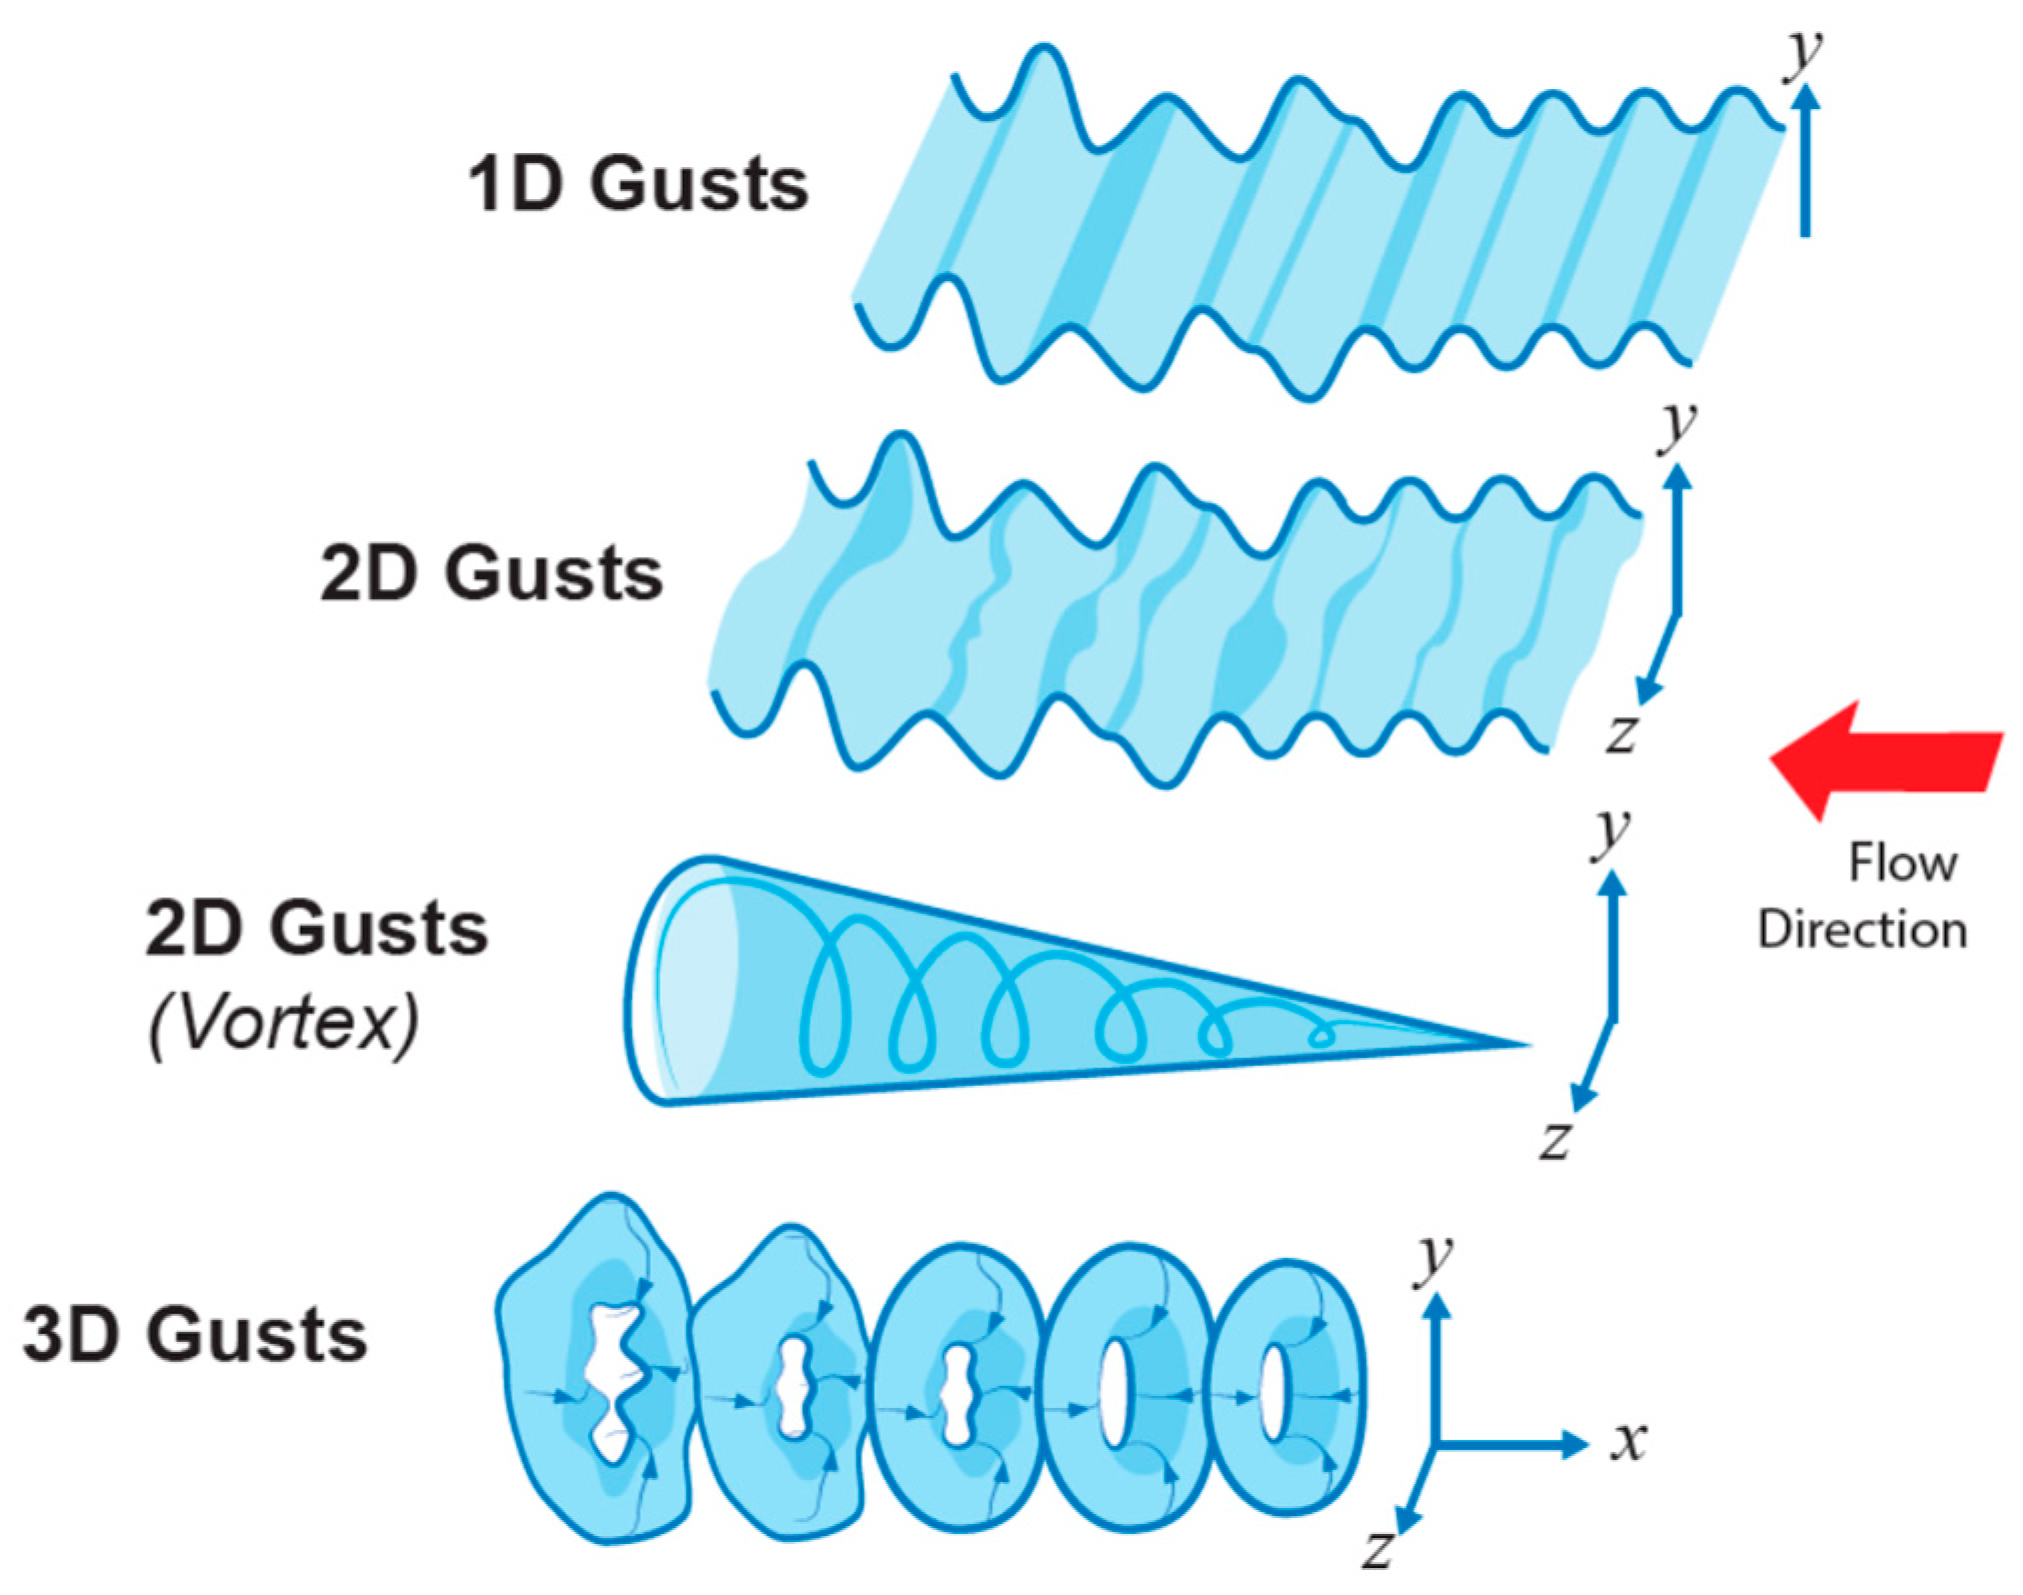
Figure 9.
Schematics of possible gust encounters by a fixed wing UAV flying in the vicinity of buildings. Note drawn to scale for illustration purposes.
Figure 9.
Schematics of possible gust encounters by a fixed wing UAV flying in the vicinity of buildings. Note drawn to scale for illustration purposes.
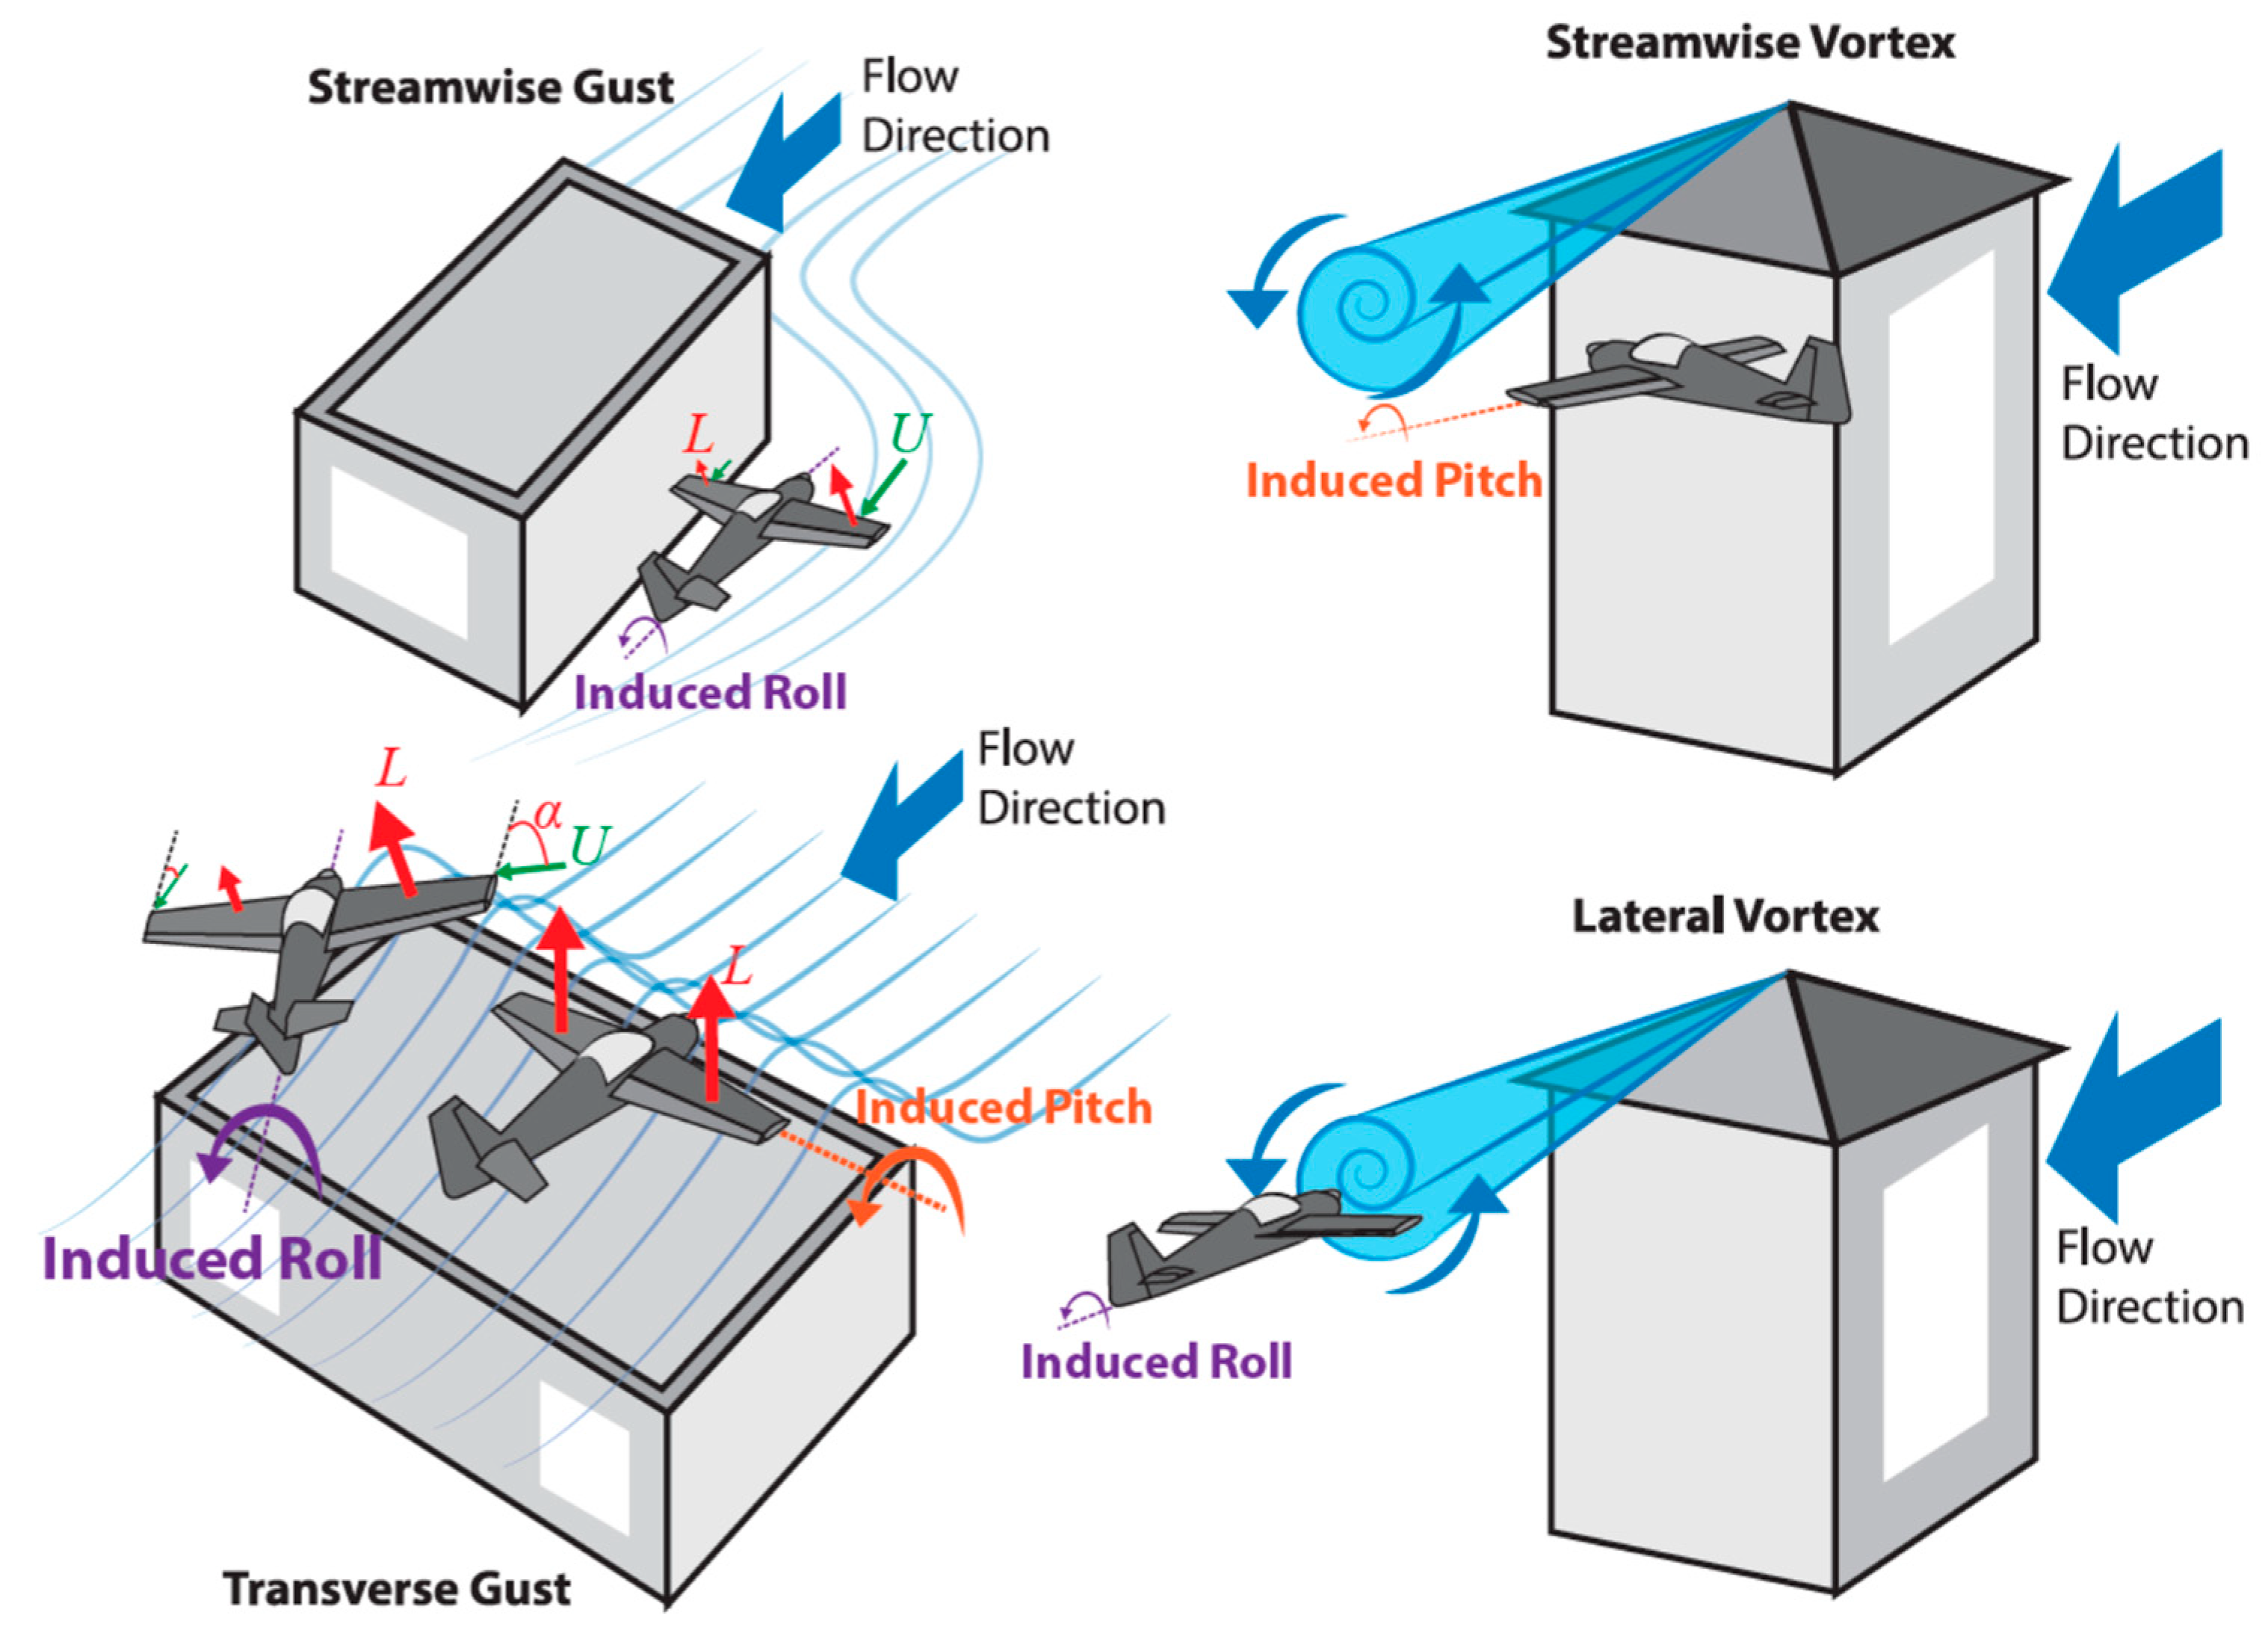
Figure 10.
Planform view of flight paths considered in this paper.
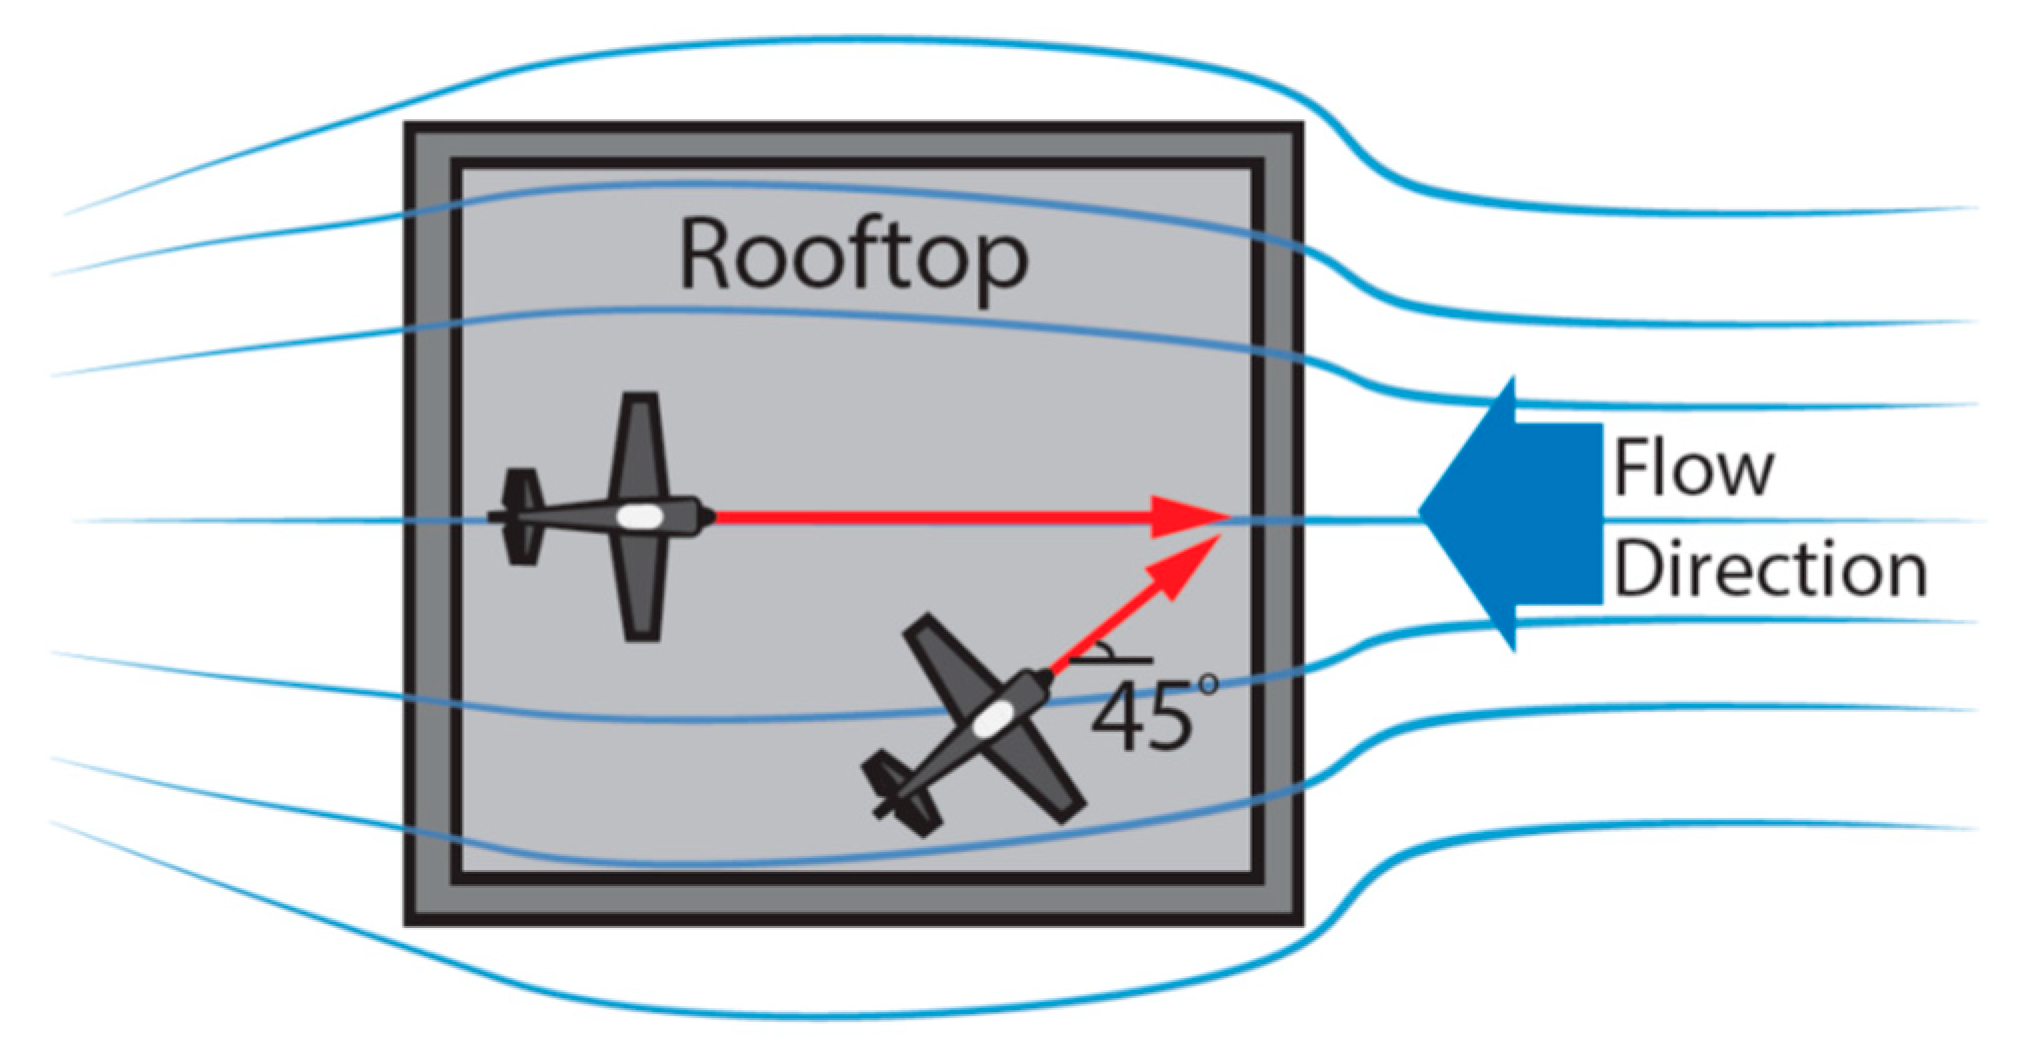
Figure 11.
CFD domain, whereby air flows in the positive x-direction. The transient velocity magnitudes are shown in contour plots of the flow around the building located at the same plane of the flight paths (travelling in the x-direction) in the vicinity of the rooftop.
Figure 11.
CFD domain, whereby air flows in the positive x-direction. The transient velocity magnitudes are shown in contour plots of the flow around the building located at the same plane of the flight paths (travelling in the x-direction) in the vicinity of the rooftop.
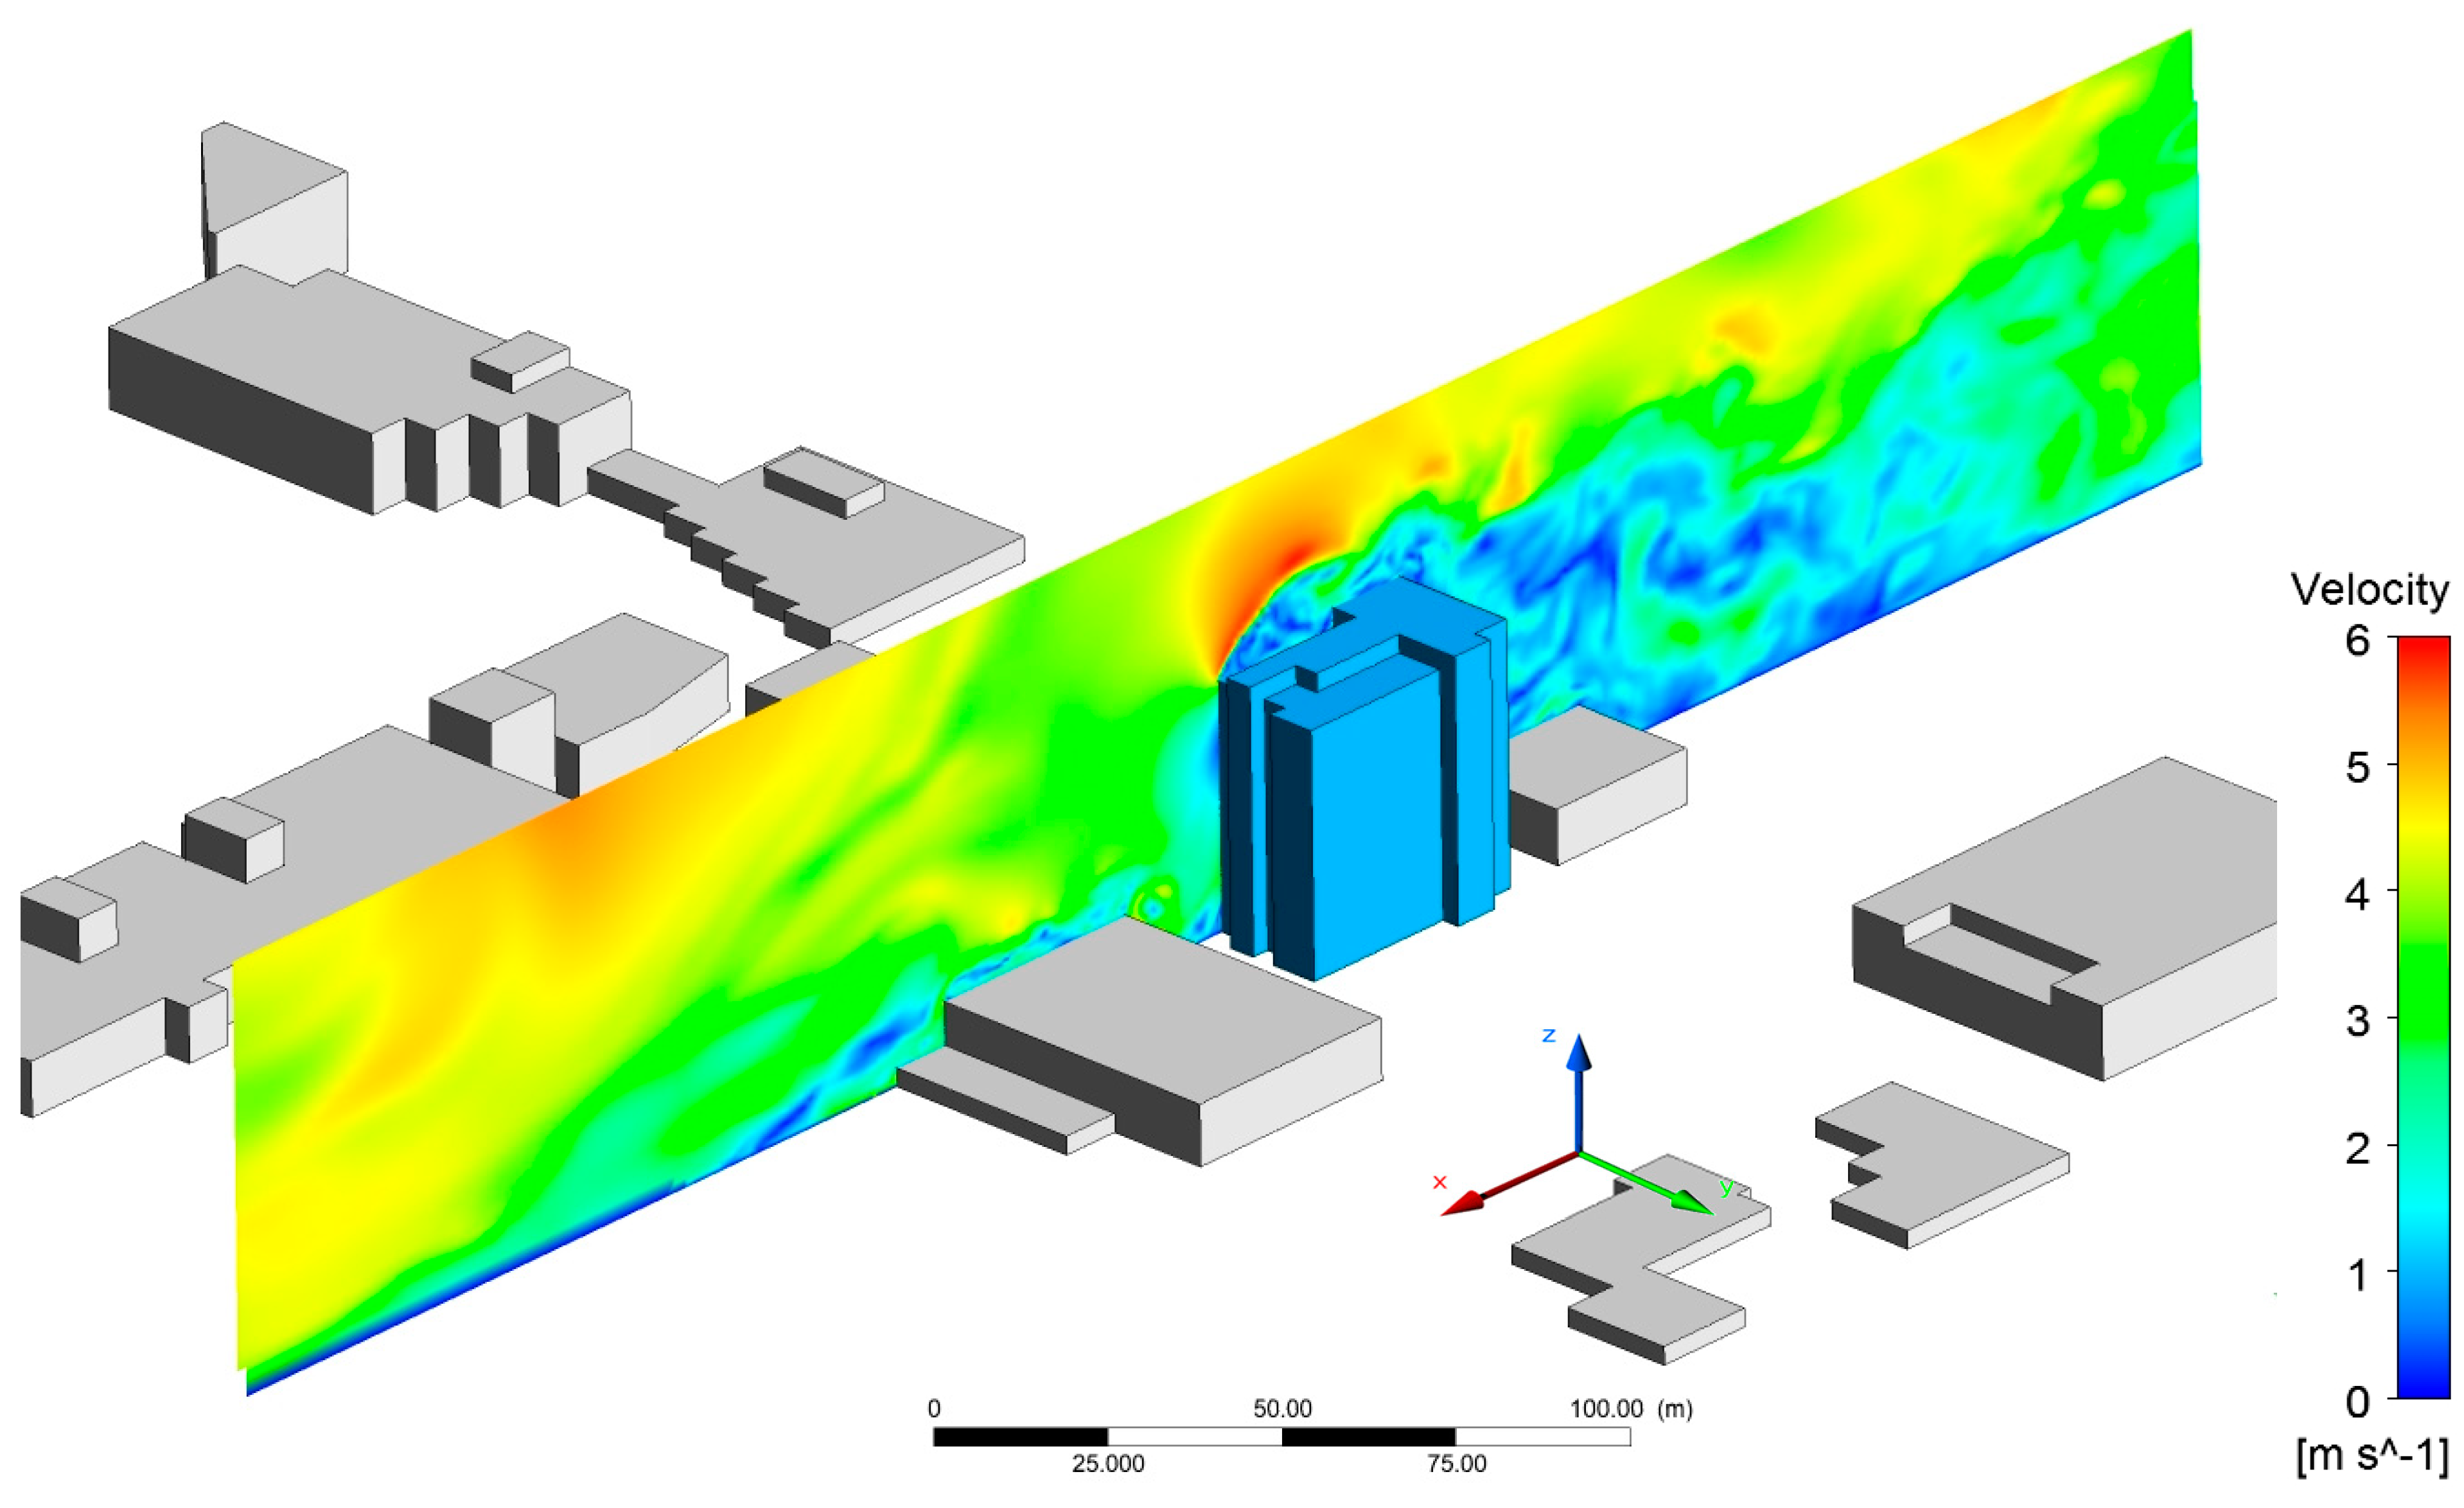
Figure 12.
Encountered velocity vectors during proximity flight in the rooftop region of the building.
Figure 12.
Encountered velocity vectors during proximity flight in the rooftop region of the building.

Figure 13.
Flow velocity angles and magnitudes at different heights in the vicinity of the building’s rooftop. Note that normalized positions −1 and 0 denote the edges of the building.
Figure 13.
Flow velocity angles and magnitudes at different heights in the vicinity of the building’s rooftop. Note that normalized positions −1 and 0 denote the edges of the building.
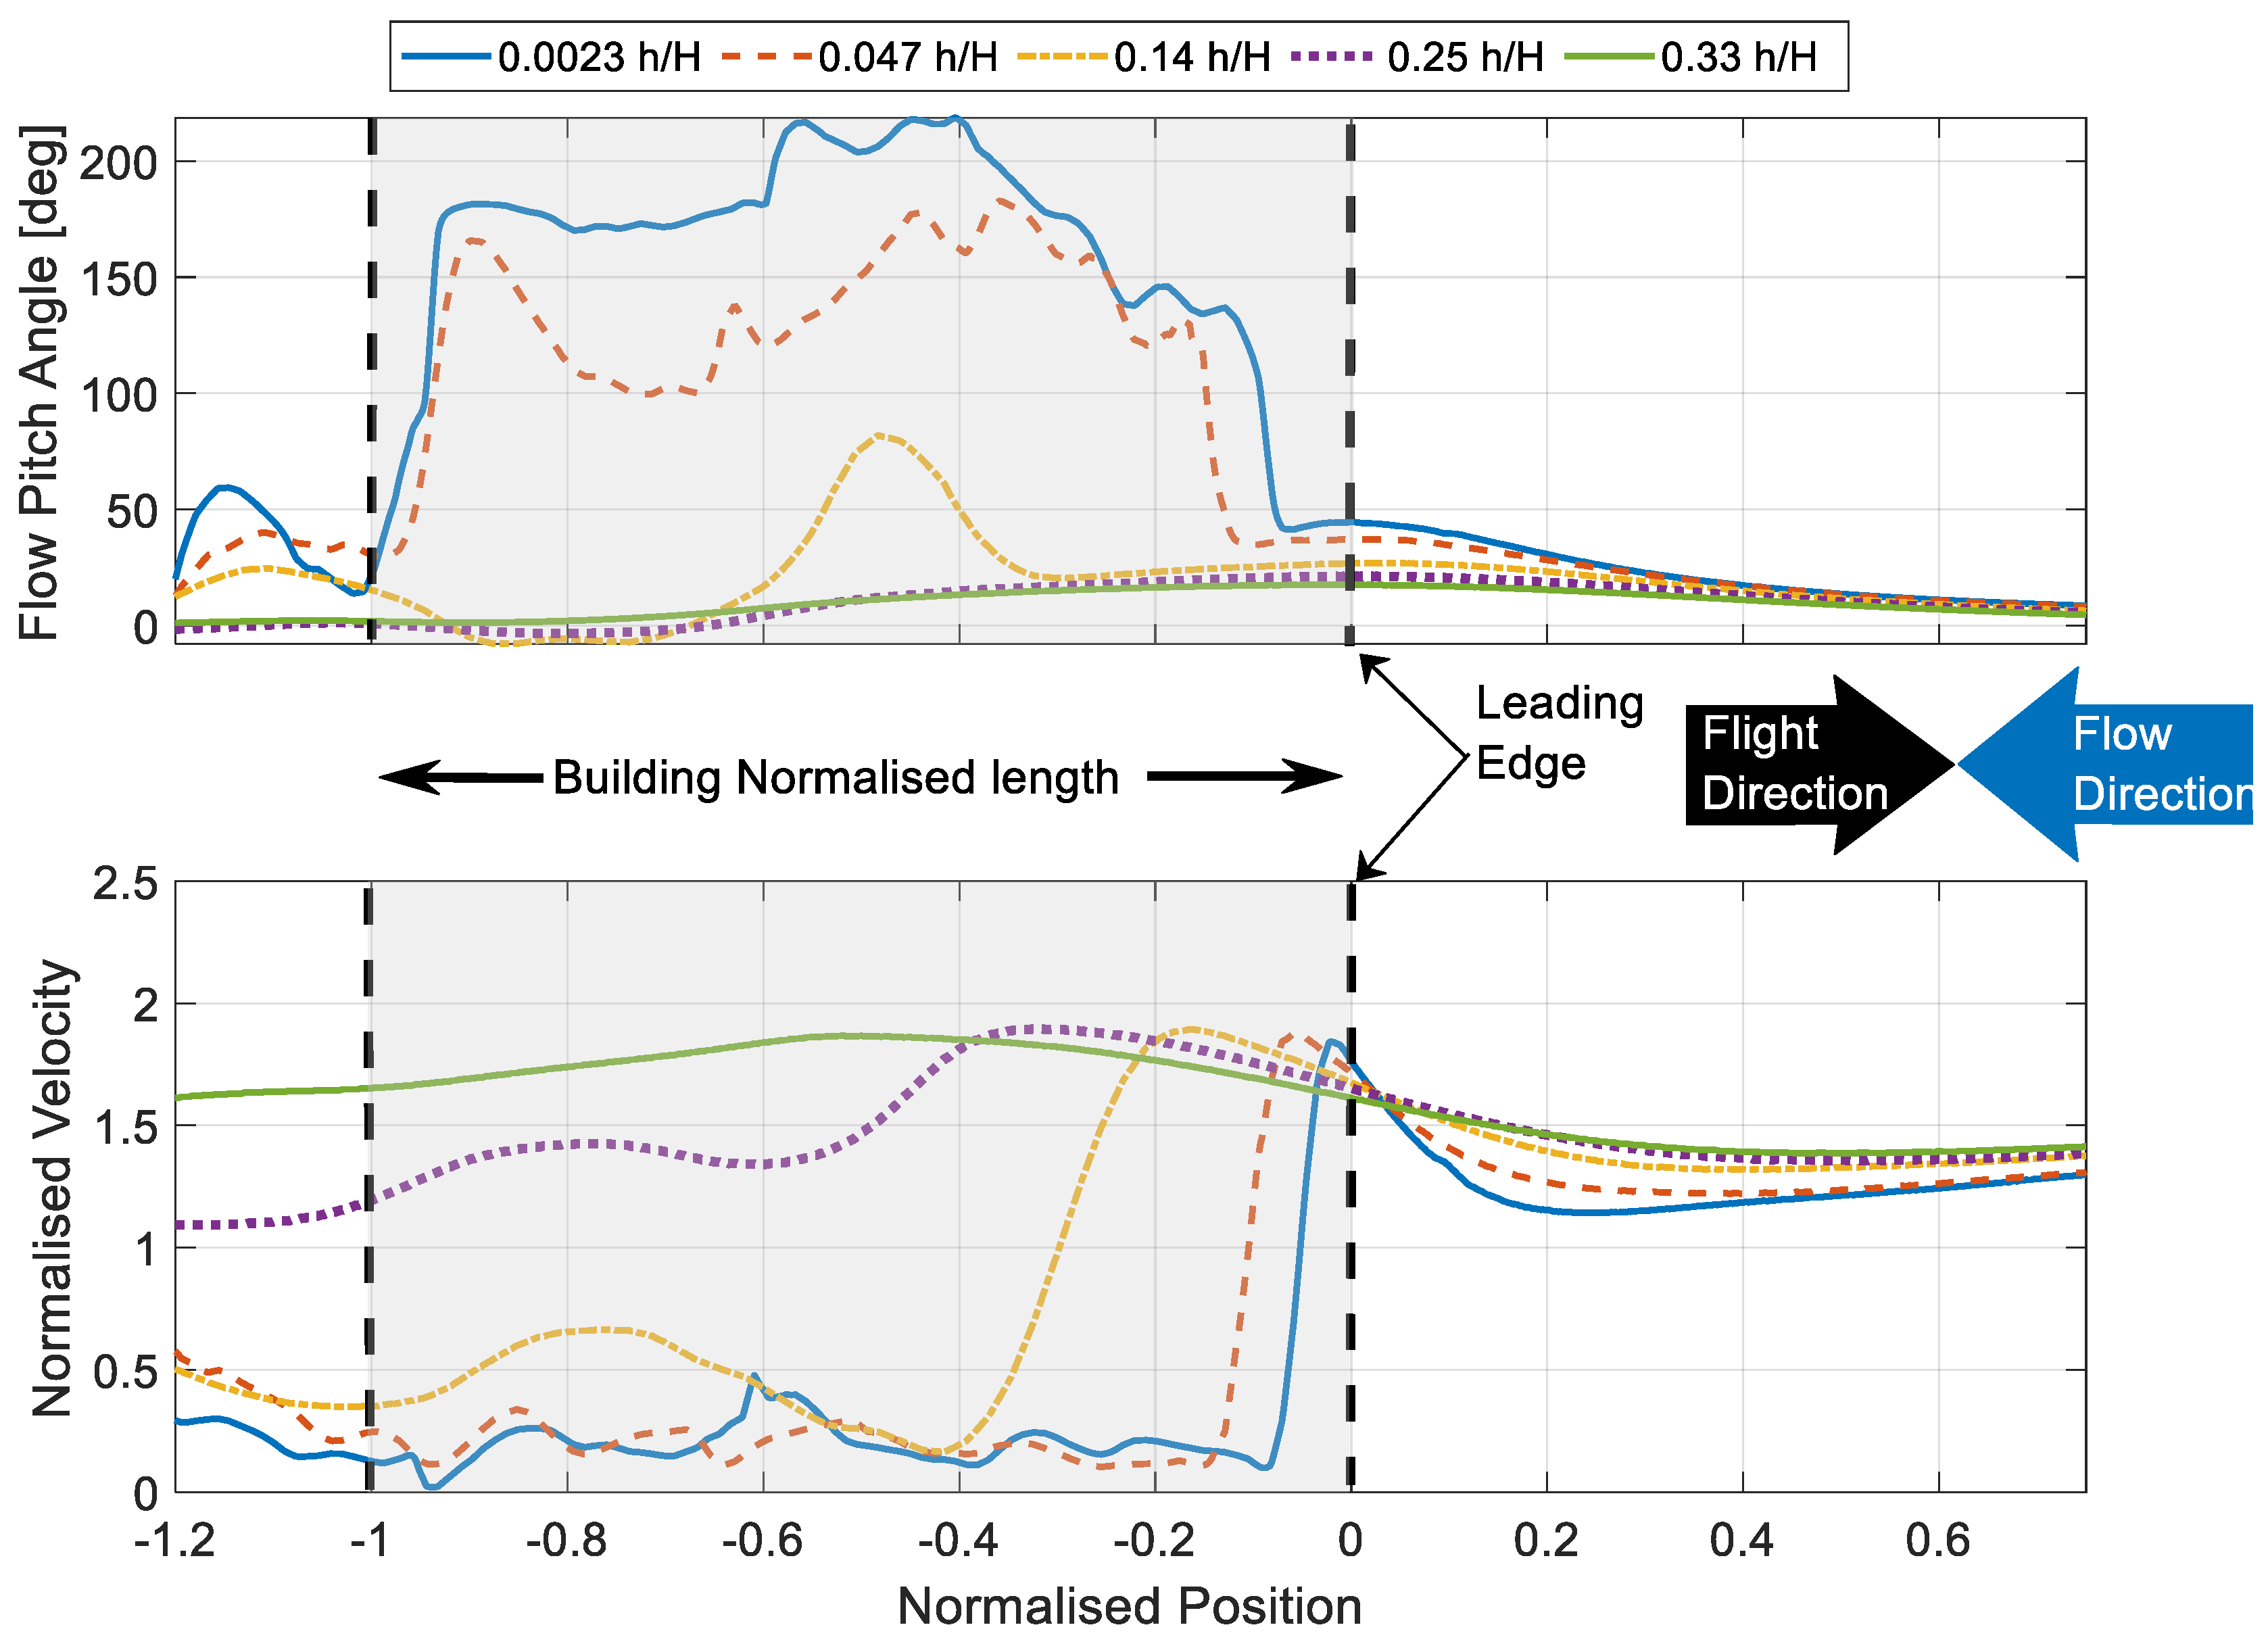
Figure 14.
Velocity vectors along a representative flight path (h/H = 0.0023) in the rooftop region of the building as extracted from CFD simulation.
Figure 14.
Velocity vectors along a representative flight path (h/H = 0.0023) in the rooftop region of the building as extracted from CFD simulation.
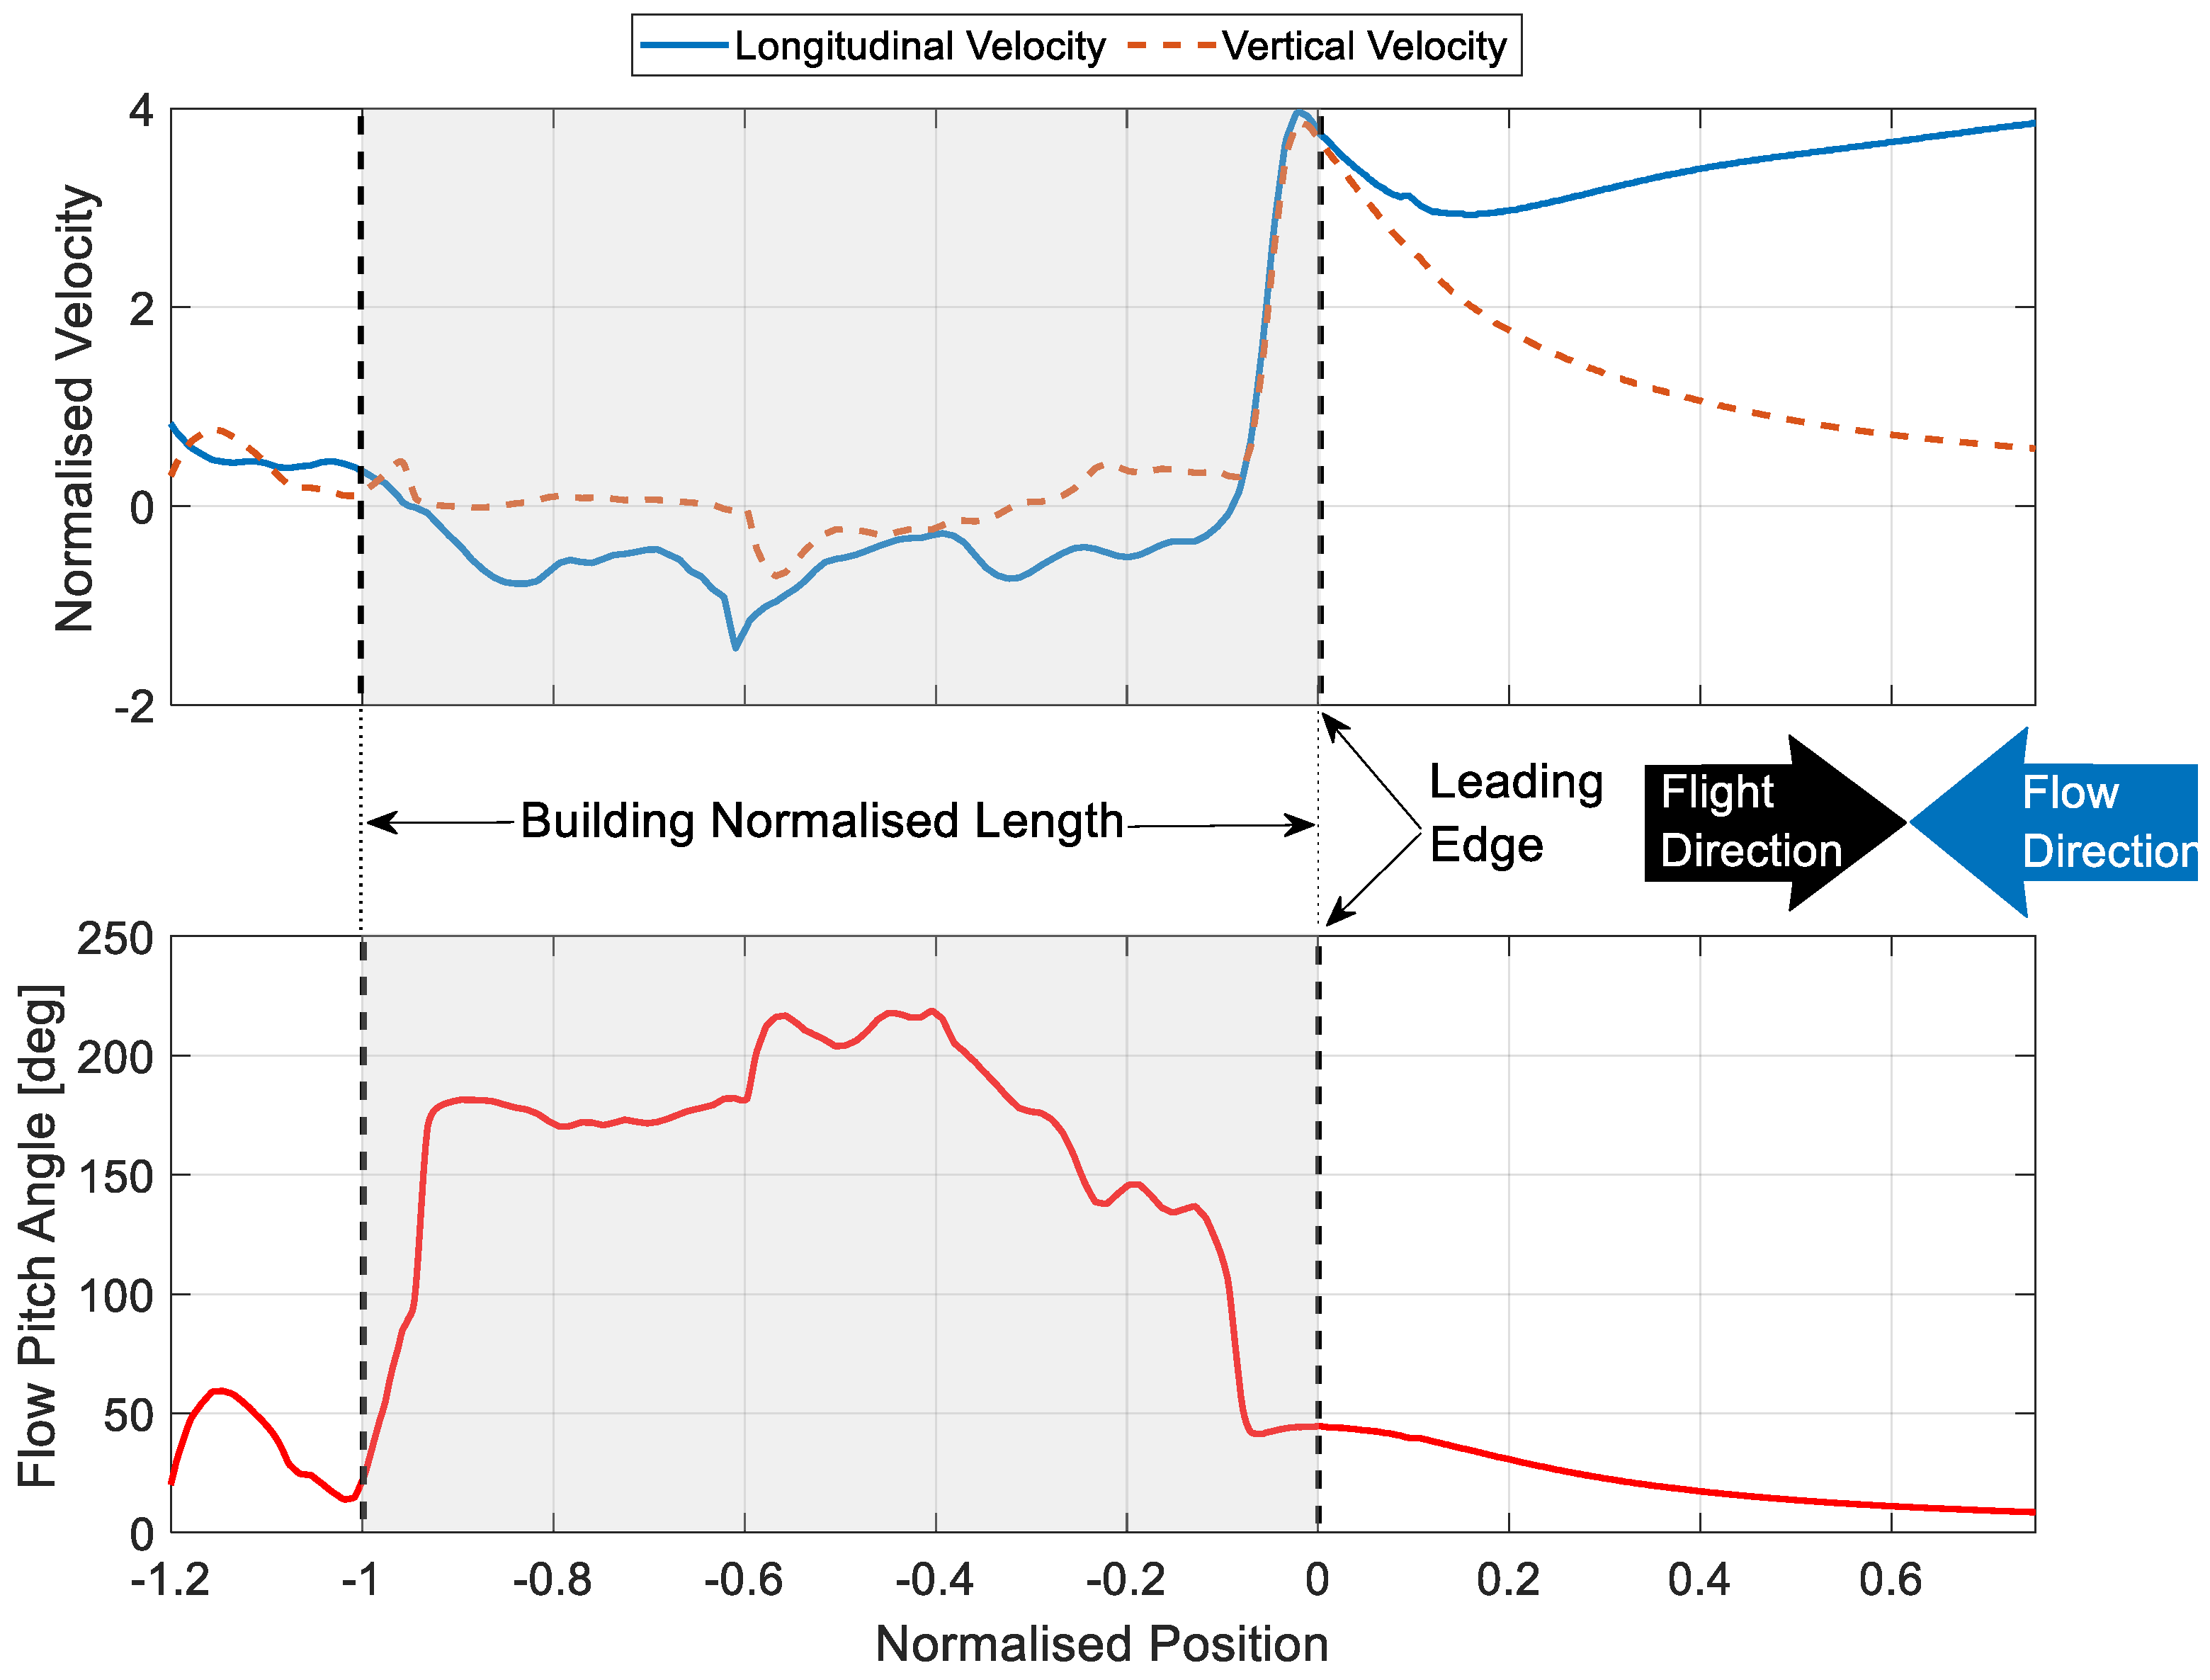
Figure 15.
Gust shape as perceived by a moving aircraft. And the resultant CL in the vicinity of the rooftop (from a simple strip theory model, utilizing transient flow data). Note that position 0 denotes the physical edge of the building.
Figure 15.
Gust shape as perceived by a moving aircraft. And the resultant CL in the vicinity of the rooftop (from a simple strip theory model, utilizing transient flow data). Note that position 0 denotes the physical edge of the building.
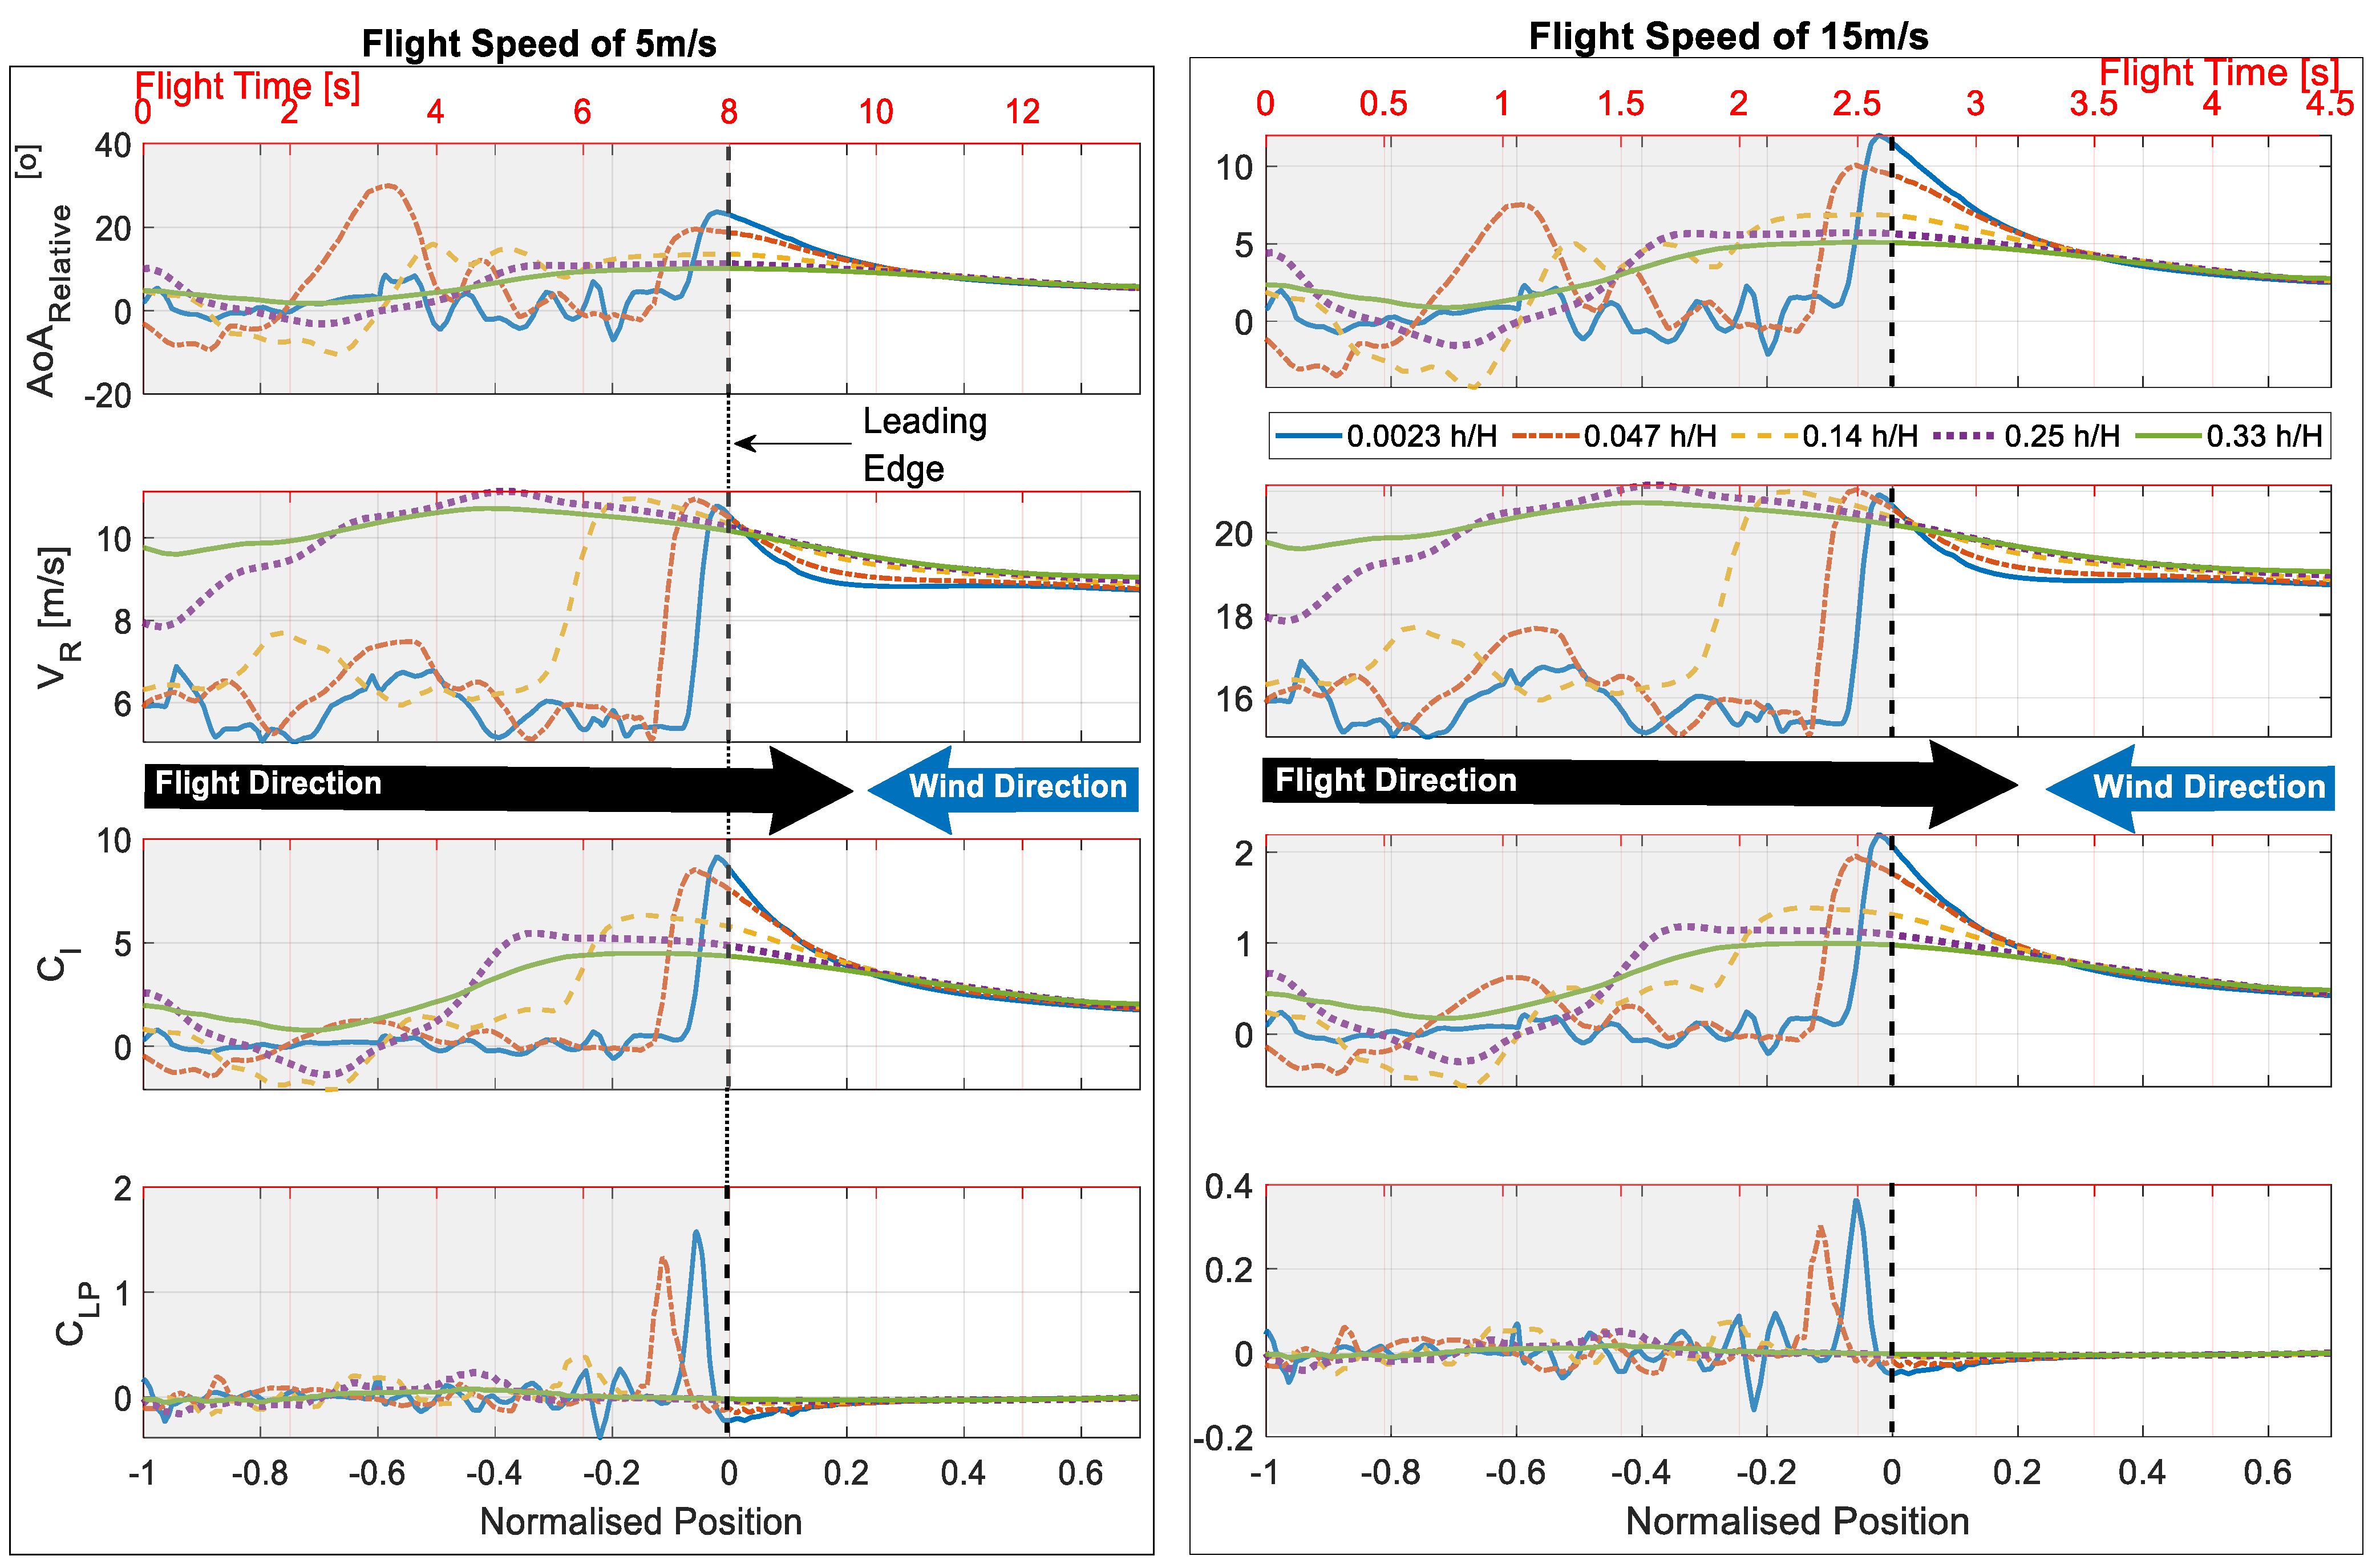
Figure 16.
Wind disturbance model for a single disk.
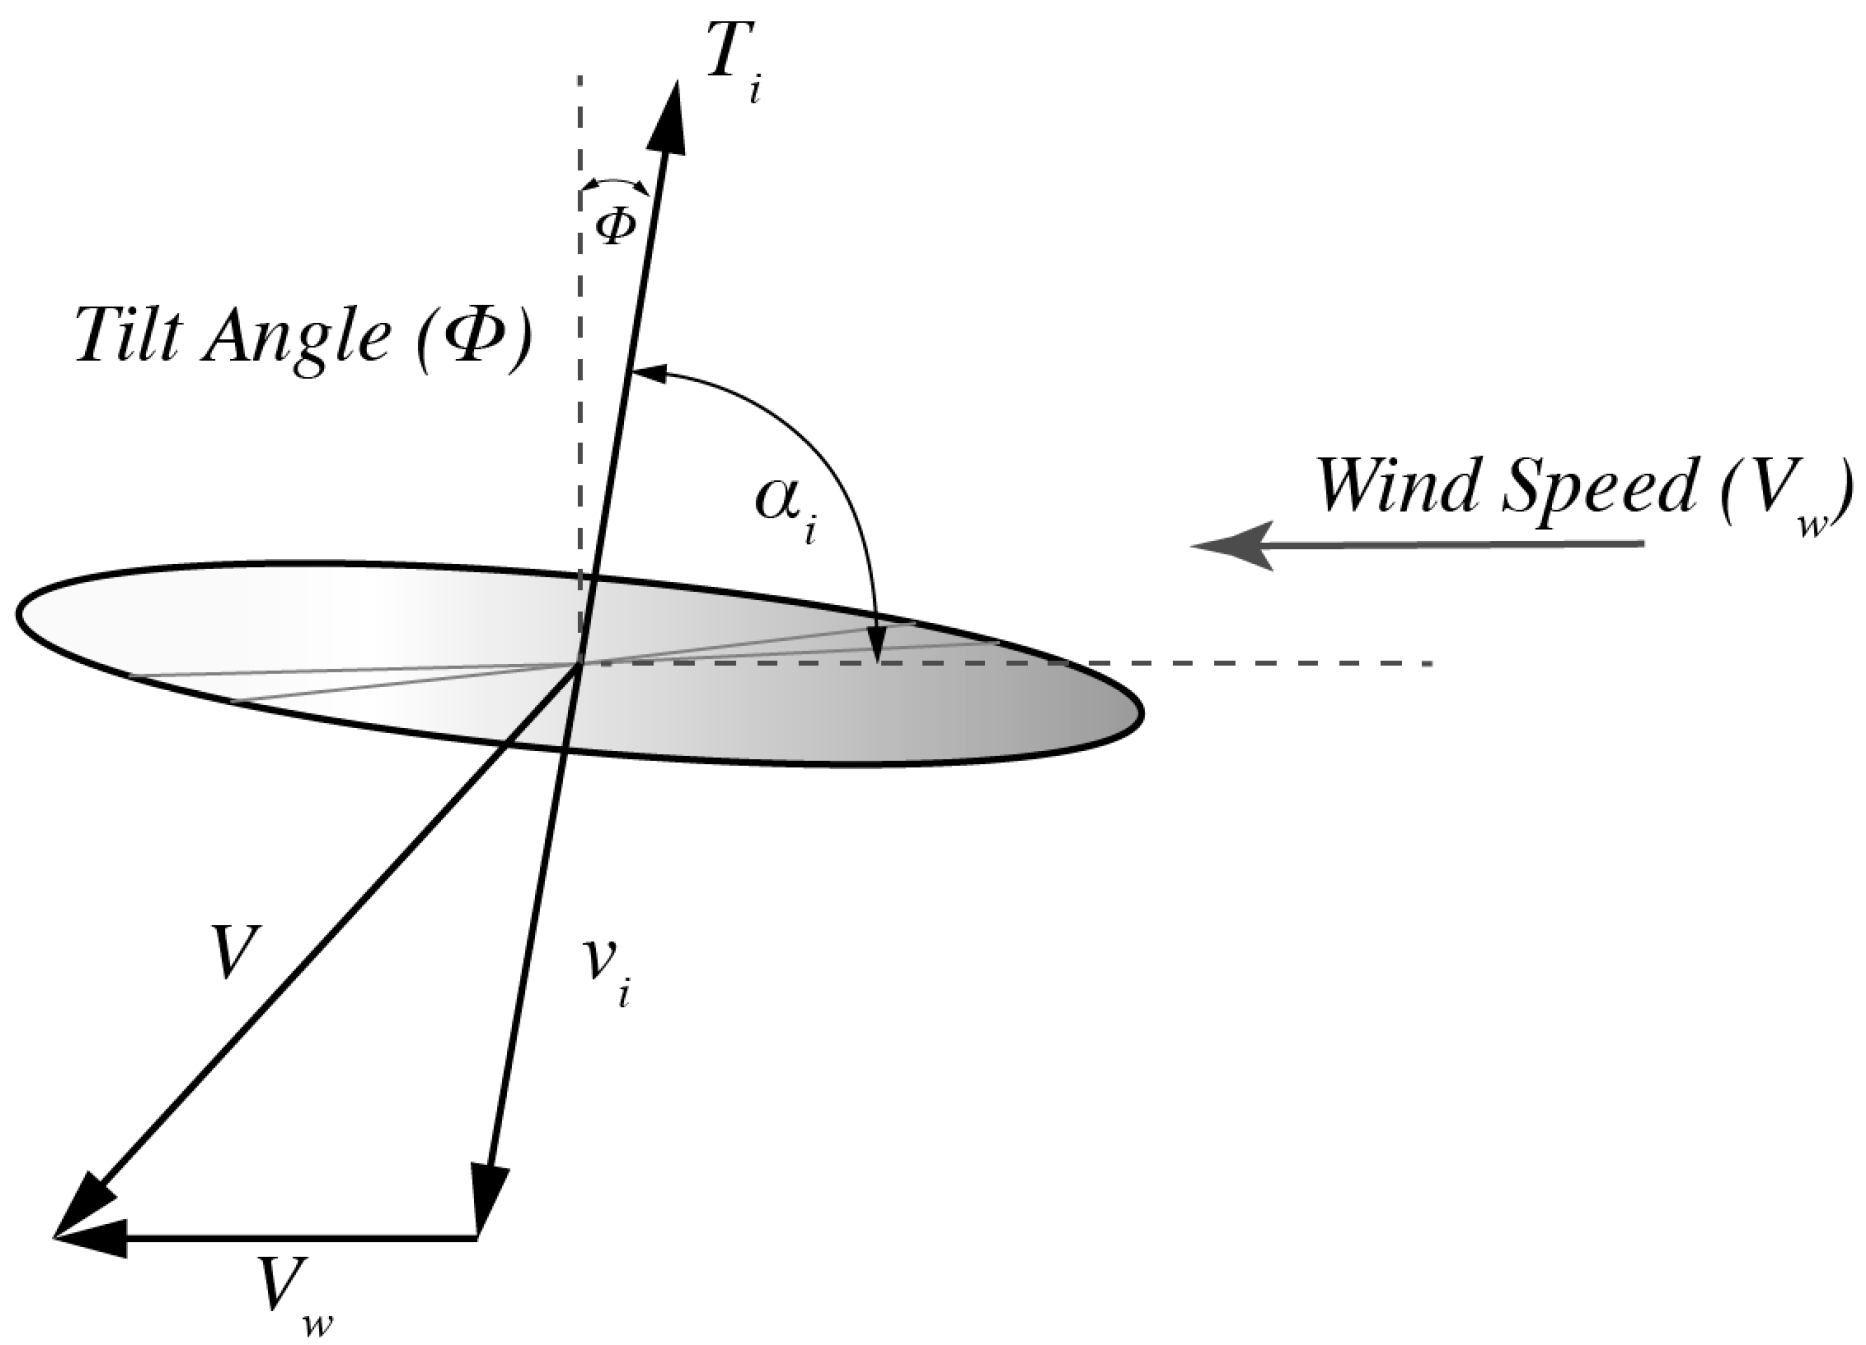
Figure 17.
Gust shape as perceived by a moving thrusting disk of a delivery drone and the resultant effects on induced velocity, thrust, and normalized thrust in the vicinity of the rooftop. Note that position 0 denotes the physical leading edge of the building. T/Th is the thrust required over thrust to hover fraction.
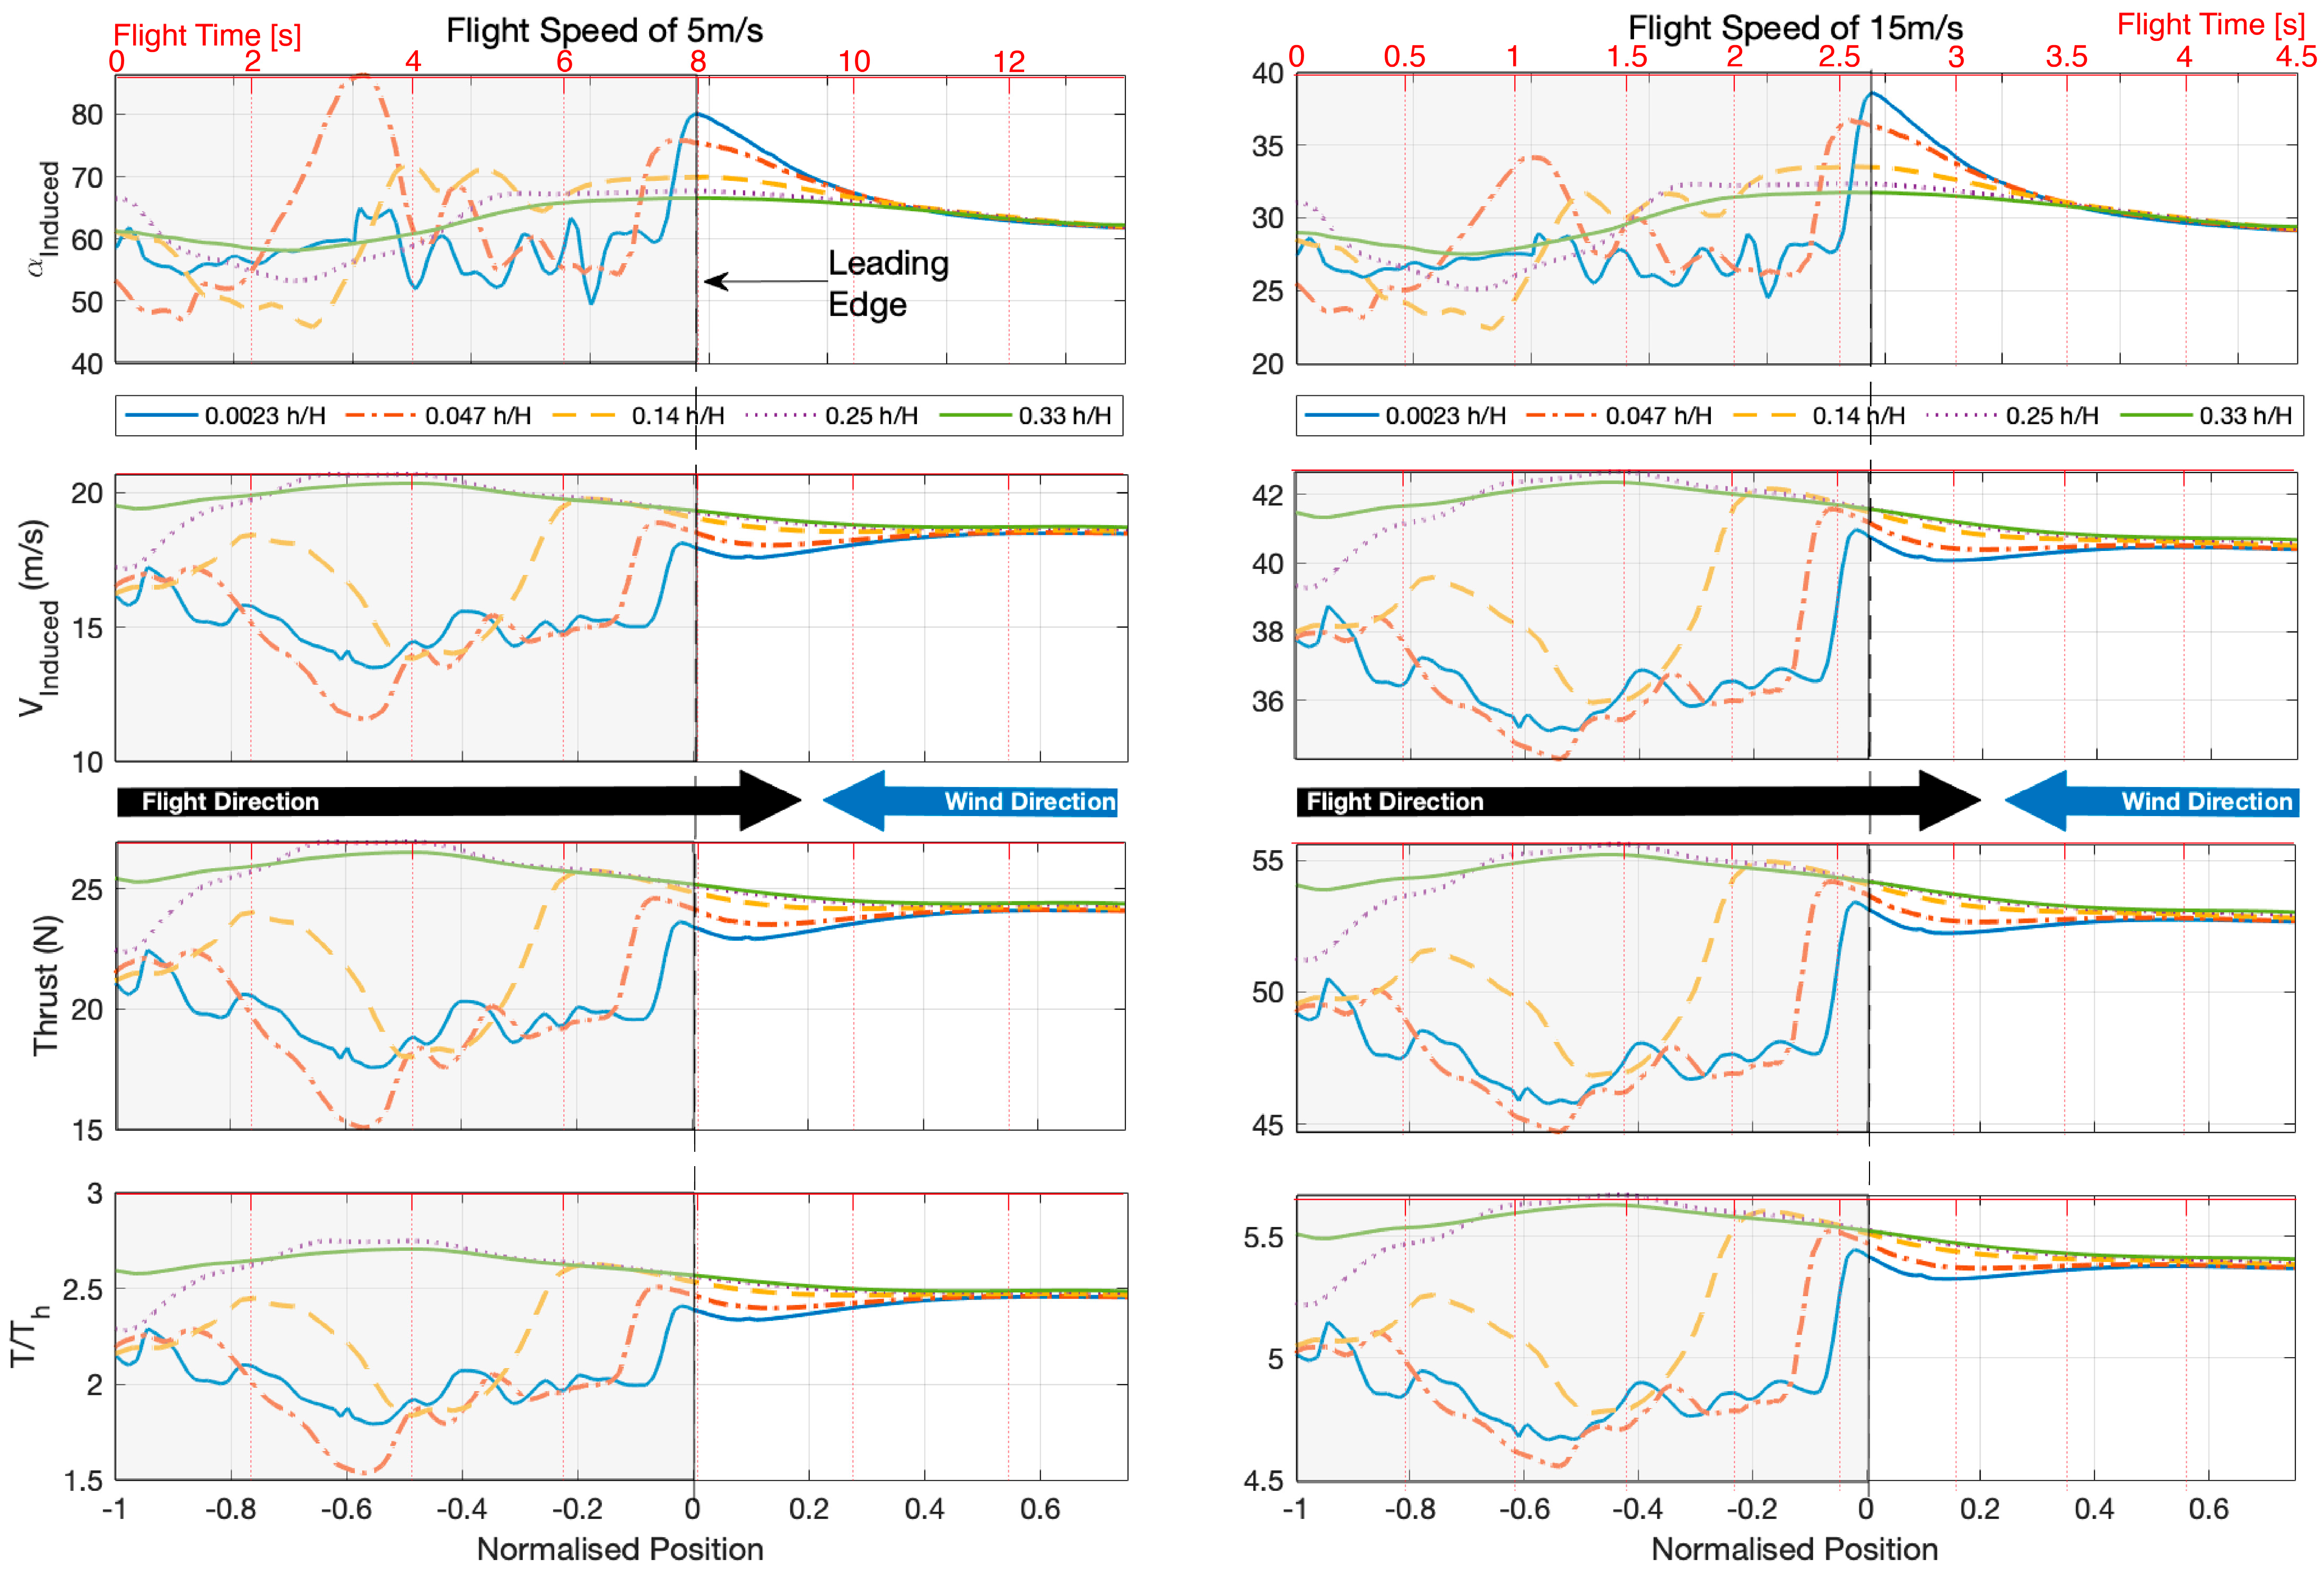
Figure 18.
Gust shape as perceived by a moving thrusting disk of an advanced air mobility vehicle, and the resultant effects on induced velocity, thrust, and normalized thrust in the vicinity of the rooftop. Note that position 0 denotes the physical edge of the building. T/Th is the thrust required over thrust to hover fraction.


Table 1.
Specifications of aircraft used for this analysis.
| Parameter | Specification | |
|---|---|---|
| Delivery Drone | Advanced Air Mobility Vehicle | |
| MTOW | 4 kg | 1683 kg |
| Disk Loading | 14.14 kg/m2 | 35.68 kg/m2 |
| Configuration | Quadrotor | Octorotor |
| Rotor Size (diameter) | 0.3 m | 2.74 m |
| Flight Velocities | 5 ms−1, 15 ms−1 | 5 ms−1, 15 ms−1 |
Disclaimer/Publisher’s Note: The statements, opinions and data contained in all publications are solely those of the individual author(s) and contributor(s) and not of MDPI and/or the editor(s). MDPI and/or the editor(s) disclaim responsibility for any injury to people or property resulting from any ideas, methods, instructions or products referred to in the content. |
© 2022 by the authors. Licensee MDPI, Basel, Switzerland. This article is an open access article distributed under the terms and conditions of the Creative Commons Attribution (CC BY) license (https://creativecommons.org/licenses/by/4.0/).
Share and Cite
MDPI and ACS Style
Mohamed, A.; Marino, M.; Watkins, S.; Jaworski, J.; Jones, A. Gusts Encountered by Flying Vehicles in Proximity to Buildings. Drones 2023, 7, 22. https://doi.org/10.3390/drones7010022
AMA Style
Mohamed A, Marino M, Watkins S, Jaworski J, Jones A. Gusts Encountered by Flying Vehicles in Proximity to Buildings. Drones. 2023; 7(1):22. https://doi.org/10.3390/drones7010022
Chicago/Turabian StyleMohamed, Abdulghani, Matthew Marino, Simon Watkins, Justin Jaworski, and Anya Jones. 2023. "Gusts Encountered by Flying Vehicles in Proximity to Buildings" Drones 7, no. 1: 22. https://doi.org/10.3390/drones7010022