Article

Development of a Novel Implementation of a Remotely Piloted Aircraft System over 25 kg for Hyperspectral Payloads

1
Aerospace Research Center, National Research Council of Canada, Ottawa, ON K1A-0R6, Canada
2
Applied Remote Sensing Laboratory, McGill University, Montreal, QC H3A-0B9, Canada
3
Defence Research and Development Canada, Valcartier, QC G3J 1X5, Canada
*
Author to whom correspondence should be addressed.
Drones 2023, 7(11), 652; https://doi.org/10.3390/drones7110652
Submission received: 3 October 2023 / Revised: 18 October 2023 / Accepted: 24 October 2023 / Published: 27 October 2023

Abstract

:
A main aspect limiting the operation of low-altitude remotely piloted aircraft systems (RPAS) over 25 kg, integrating pushbroom hyperspectral sensors, comes from the challenges related to aircraft performance (e.g., flight time) and regulatory aspects deterring the users from pushing beyond this weight limit. In this study, we showcase a novel implementation using the DJI Agras T30 as an aerial system for integrating an advanced hyperspectral imager (HSI, Hyspex VS-620). We present the design and fabrication approach applied to integrate the HSI payload, the key considerations for powering the HSI and its gimbal, and the results from vibration and wind tunnel tests. We also evaluate the system’s flight capacity and the HSI’s geometric and radiometric data qualities. The final weight of the T30 after the integration of the HSI payload and ancillary hardware was 43 kg. Our vibration test showed that the vibration isolator and the gimbal reduced the vibration transmission to above 15 Hz but also introduced a resonant peak at 9.6 Hz that led to vibration amplification in the low-frequency range near 9.6 Hz (on the order of an RMS of ~0.08 g). The wind tunnel test revealed that the system is stable up to nearly twice the wind speed rating of the manufacturer’s specifications (i.e., 8 m/s). Based on the requirements of the Canadian Special Flight Operations Certificate (RPAS > 25 kg) to land at a minimal battery level of ≥30%, the system was able to cover an area of ~2.25 ha at a speed of 3.7 m/s and an altitude of 100 m above ground level (AGL) in 7 min. The results with the HSI payload at different speeds and altitudes from 50 m to 100 m AGL show hyperspectral imagery with minimal roll–pitch–yaw artefacts prior to geocorrection and consistent spectra when compared to nominal reflectance targets. Finally, we discuss the steps followed to deal with the continuously evolving regulatory framework developed by Transport Canada for systems > 25 kg. Our work advances low-altitude HSI applications and encourages remote sensing scientists to take advantage of national regulatory frameworks, which ultimately improve the overall quality of HSI data and safety of operations with RPAS > 25 kg.

1. Introduction

Over the past decade, RPAS hyperspectral remote sensing technologies for low-altitude (~<120 m, 400 ft AGL) applications have improved significantly. Pioneering work by [1] determined the spatial variability in carotenoids in vineyards at the leaf level, using ultra-high spatial resolution imagery (cm scale) covering the visible and near-infrared wavelengths (VNIR, 400–885 nm). In more recent studies, similar hyperspectral pushbroom sensors with very high spectral resolution (200+ spectral bands) have expanded the range of applications to other fields, e.g., ecology [2,3], forest mapping [4,5], reef monitoring [6] and agriculture [7,8]. Manufacturers of hyperspectral imaging (HSI) systems (e.g., HySpex, Headwall, Specim, etc.), expanded the spectral range to capture imagery in the short-wave infrared (SWIR) region, resulting in imagery with up to 400+ contiguous narrow spectral bands between 400 and 2500 nm (co-aligned and separate systems) (e.g., [9]).
The complexity of safe operations with RPAS–HSI systems from flight planning to data acquisition and processing has been captured in recent reviews and applied research in [2,10,11,12,13]. The advances in RPAS HSI have resulted in an ideal platform that bridges field spectroscopy measurements (limited in spatial representativeness) and airborne or satellite observations, which are essential for the validation and calibration of novel hyperspectral satellite systems such as EnMAP [14], HISUI [15] and PRISMA [16] (Figure 1). Nevertheless, most medium-cost RPAS (USD 20–30 K) capable of carrying HSI payloads still have limitations such as flight time due to battery endurance (~8–10 min) [2] and often lack the airborne stability required by the HSI pushbroom systems for accurate geocorrection (i.e., fixed vs. gimbal-mounted systems) [2,12]. Moreover, evolving regulatory frameworks aiming to increase the safety and efficiency of RPAS operations generate user-perceived challenges that hinder the broad use of heavy-lift drones and payloads. Anecdotally, RPAS operational weight limits can affect the decision on which HSI sensor to acquire for scientific applications in order to operate with minimal navigation of complex regulations.
Despite differences in details and nuances of terminology in Canada, the United States and the European Union (EU), there are many similarities between the corresponding regulations for operating heavy RPAS (Table 1). RPAS regulations are constantly evolving; therefore, the summary shown in Table 1 is accurate at the time of publication but is expected to change over time.
Accurate radiometrically and geometrically corrected data are the desired output of a well-integrated RPAS HSI system. Several aspects are key for integrating an HSI payload in an RPAS, and trade-offs between the total system weight, HSI form factor, airtime, flight stability (e.g., acceleration) and sensor characteristics (e.g., field of view, signal-to-noise ratio) play a role from one system integration to another. For instance, an HSI pushbroom system is highly sensitive to the motion and vibration of the RPAS. Data quality and spatial accuracy are especially affected by attitude fluctuations (pitch, roll and yaw), as well as those related to the RPAS trajectory [13]. The total system weight or HSI form factor, for example, can both limit the use of a gimbal, which, if properly integrated (e.g., [2,23]), generates raw HSI imagery with fewer attitude artefacts than hard-mounted systems as explained in [23]. And, although the corrections using the GPS/inertial measurement unit (IMU) solution can generate a geocorrected image, the spectral and geometric quality of the end product could be greatly affected by pixel loss or duplication when the hyperspectral raster is generated [24]. Furthermore, rotorcraft are often preferred over fixed-wing RPAS because fixed-wing systems cannot attain the low altitude and slow flight speeds required for high-spatial-resolution HSI with near-circular point spread function (PSF) footprints. Ideally, some of the aforementioned trade-offs can be addressed at the RPAS level, especially by moving beyond the current 25 kg (or 55 lb) total weight limit barrier.
Heavy-lift electric rotorcraft RPAS (e.g., DJI Matrice 600 Pro, Freefly Alta X, Watts Innovations MFD 5000, etc.) are not new as platforms for HSI pushbroom sensors; however, in our experience, their generic flight controllers can generate rapid accelerations, decelerations and rotations that can affect the safety of the operation and data quality. Furthermore, the reliability of the RPAS construction and quality control varies between manufacturers, and incidents are not rare (e.g., power loss, propeller failure, loss of stability, etc.). Current technological advances in consumer off-the-shelf agricultural spraying drones [25] provide a novel solution as heavy-lift electric rotorcraft for HSI. The size of the agriculture industry and the need for more sustainable practices have triggered the development, implementation and rapid growth of these spraying systems in East Asian countries (e.g., Japan, China, South Korea) [26], Southeast Asia (e.g., Vietnam, Thailand), as well as in the Americas (e.g., Canada, Brazil, USA). By design, spraying RPAS are developed to carry a heavy payload, which is in many cases liquid [27]. Here, we take advantage of a commercial off-the-shelf agricultural spraying RPAS, the DJI Agras T-30, designed to carry a 30 L container of liquid. We describe a modification of the payload to accommodate either the HySpex VS-620 full-range hyperspectral sensor (400–2500 nm) or the HySpex S-620 sensor (900–2500 nm). Despite the payload modification, no changes were made to the airframe in order to remain compatible with the manufacturer’s performance declaration. These changes in the payload also did not affect the reliability of the RPAS (e.g., no structural changes), its capability, software or autopilot.
Figure 1. Illustration of the relationship between the spatial scale of HSI measurements and the altitude above ground from which the data are acquired when considering a bottom-up scaling approach for the validation of satellite land products. The range (1–5 m) for the field spectroscopy includes both in situ measurements via tripod as shown in the inset photograph (1–2 m) and tower measurements (e.g., Hypernets [28]). The dark blue band within the airborne cylinder is the altitude range most often used for airborne HSI acquisition in non-pressurized aircraft.
Drones 07 00652 g001
The main objective of this paper is to present the technical aspects related to an aerospace design and fabrication approach of a vibration-stabilization platform for mounting the HSI and ancillary components, instrumentation and tests carried out to assess the robustness of the resulting system, i.e., vibration and wind tunnel tests. The second objective is to show the RPAS HSI system performance in terms of the T-30′s flight characteristics, flight-planning considerations, HSI data collection and a radiometric and geometric data quality assessment. Furthermore, we present the main considerations to comply with the current regulatory framework in Canada, as determined by Transport Canada. Our work provides a novel implementation aiming to generate verifiable and repeatable RPAS HSI data key for many applications, especially for complementing airborne and satellite hyperspectral products.

2. Materials and Methods

2.1. RPAS and HSI Sensor Description

In this section, we provide a description of the RPAS and hyperspectral payload; further details about the DJI T-30 can be found on the manufacturer’s webpage (https://www.dji.com/ca/t30 accessed on 5 September 2023), while the Hyspex Mjolnir VS-620 has been described extensively in [9,29].

2.1.1. DJI Agras T30

New agricultural spraying RPAS have a series of characteristics that are suitable for heavy payloads such as vertical lift capacity, smooth flight performance and intelligent features (e.g., battery power management). After consultation with the manufacturer, we hypothesized that the T30 liquid tank and spraying system (e.g., pumps, nozzles, tubing, etc.) could be replaced by a stabilized hyperspectral payload. The main consideration for this replacement was for the system to remain compatible with the manufacturer’s performance declaration to Transport Canada and to ensure that payload changes do not modify the system’s reliability, capabilities, software, autopilot, etc. The system’s performance should also stay within the original design specification (e.g., no significant change to the center of gravity). Table 2 summarizes the main characteristics of the Agras T30 used in the integration of the HSI sensor (Section 2.2.2).
Table 2. Key characteristics of the DJI Agras T30 RPAS used for the implementation of the VS-620/S-620 hyperspectral payload. The omnidirectional radar unit standard on the T30 was removed to allow for a greater range of flight altitudes.
CharacteristicValue
General
TypeHexacopter
Weight without payload * (MTOW)22.6 kg (78 kg)
Dimensions with arms and blades unfolded2858 mm × 2685 mm × 790 mm
Control System
Flight control softwareDJI Agras Pilot
Hovering precision with D-RTK enabled±10 cm horizontal and vertical
GNSS frequency bandsGPS L1, GLONASS F1 and Galileo E1
RTK frequency bandsGPS L1/L2, GLONASS F1/F2, BeiDou
B1/B2 and Galileo E1/E5
RTK base stationDJI DRTK-2
Operation Limitations
Maximum manufacturer-stated sustained wind speed8 m/s
Recommended operating ambient temperature0–45 °C
Firmware limited flight altitude100 m AGL (328 ft)
Power System
Max power consumption11,000 W
Propeller size (diameter × pitch)38 × 20 inch
Battery weight, capacity, voltage10.1 kg, 29,000 mAh, 51.8 V
Charging time **~15 min
Maximum speed (auto mode)7 m/s
Maximum speed (manual mode)10 m/s
Additional safety mechanisms
Forward and backward FPV cameras129 ° horizontal × 82 ° vertical field of view
IP rating (RPAS)IP67
IP rating (battery)IP54 with board-level potting protection
* Includes the nonremovable parts described in Table 3. ** Depends on incoming power.
Table 3. Components required for implementation of the T30 RPAS-HSI system and weights.
ComponentDescriptionWeight (kg)
T30 without battery *Includes:
  • Airframe with propellers;
  • Tallysman TW3972 triple frequency positioning antenna (GPS L1/L2/L5, GLONASS G1/G2/G3, BeiDou B1/B2, Galileo E1/E5 a + b), grounding plate and mount;
  • External IMU (Applanix AIMU-M5 Type 69);
  • Radio transmitter with mounting bracket (Doodle Labs Smart transmitter to provide real-time control and visualization for the HSI; max throughput: 100 Mbps; range: 100+ km);
  • Power distribution board;
  • Power switch;
  • Damperzen type A underslung vibration isolator;
  • Flight Flix VibeX gel vibration isolator;
  • Custom aluminum mounting platform.
22.60
T30 batteryBAX501-29,000 mAh-51.8 V9.94
CablesIncludes communication and power cables0.24
Payload batteryLiPo 8000 6S2P 22.2v1.14 or 1.12 **
Gimbal with mounting plateGremsy AEVO, includes mounting plate and payload adaptor plate2.68
VS-620Full-range Mjolnir HSI6.66
S-620SWIR Mjolnir HSI4.78
Mjolnir S-620 replicaWooden replica of the S-6204.70
* The components listed with the airframe are nonremovable components. ** Graphene LiPO.

2.1.2. HySpex Mjolnir VS-620/S-620

The hyperspectral payload integration with the T30 was planned for either the Hyspex Mjolnir VS-620 or the Mjolnir S-620. The VS-620 encompasses two co-aligned pushbroom HSI sensors, spanning the visible near-infrared (400–900 nm) and short-wave infrared (900–2500) spectral ranges. The S-620 is limited to the short-wave infrared wavelengths. The enclosures for both systems include a data acquisition unit (DAU), a data link to a ground station for real-time data acquisition and visualization (hyperspectral and RGB camera) and a custom printed circuit board to control the components (e.g., mechanical shutters, triggering, events, etc.). Both systems also feature an internal Inertial Navigation System (INS) (APX-15, Applanix, Richmond Hill, ON, Canada). A second external IMU (Applanix AIMU-M5 Type 69) was integrated with the T30 (Section 2.2). This second IMU connects directly to the VS-620/S-620 to record the attitude of the GNSS antenna during flight for dynamic lever arm corrections in postprocessing. In terms of its form factor, the dimensions of the VS-620 are 397.5 mm (includes cooling fan and connections plate) × 178 mm (includes cooling fan) × 172 mm with a total weight of 6.66 kg. The dimensions of the S-620 are 254 mm × 175 mm × 170 mm with a total weight of 4.78 kg.

2.2. Components, Design and Fabrication Approach and Electronics

2.2.1. Components

In this section, we present the components, design and fabrication approach and payload power solution for the integration of the HSI sensor with the T30. To address issues related to sensor stabilization, aircraft vibration and ground management of the HSI camera, the following components were selected. For the sensor stabilization, the Gremsy AEVO gimbal was chosen because of the maximum payload capacity of 9 kg and a relatively low weight (2.68 kg). The camera cage is one of few RPAS model gimbals with a camera cage large enough to accommodate the VS-620 or S-620. To reduce vibration on the gimbal and payload, a wire rope Type A vibration isolator (natural frequency of 15–20 Hz) developed by Damperzen Engineering, Budapest, Hungary, was chosen specifically for its low weight and stated improved isolation over the widely used rubber vibration reduction systems. For the external IMU, a Vibex gel vibration isolator (Flight Flix, Denver, CO, USA) was chosen because of the form factor, low weight and superior removal of vibrations (Figure 2). For optimal performance of the external IMU, vibrations must be less than 0.3 g. Finally, a Doodle Labs smart radio transmitter with an external Mesh Rider radio receiver (ground station) and a TW3972 GNSS antenna are standard accessories with the VS-620/S-620. Table 3 shows the main components required for integrating the HSI system with the T30 and their weight.

2.2.2. Design and Fabrication Approach

Aerospace aircraft construction techniques were used for the design and fabrication of a plate to host various parts and other components (Figure 2A). Velcro and zip ties have their use in aviation, but they were avoided as a way to secure components in our implementation. A medium-strength aircraft grade aluminum with good formability was used for the aluminum components (6061-T6 Aluminum), which has less strength than 2000 or 7000 series aluminum but better formability and corrosion properties. Aluminum parts were cut by hand tools or CNC router and bent on a press brake. Some components such as the plate utilize riveted construction. The rivets are AD rivets made from 2117 aluminum alloy. All other components use locking fasteners or are witness-painted for security. Aeronautical-standard cadmium-plated hardware was used where possible, otherwise good-quality stainless steel hardware was used. All aluminum components were painted with an HVLP (high-volume low-pressure) gun with a high-quality primer and flat black polyurethane paint. For the landing gear braces, carbon fiber and 6061-T6 tube were used 3D-printed with Onyx (Markforged, Waltham, MA, USA), a chopped micro carbon fiber filled nylon. Other parts such as the brackets to attach the radio receiver and power distribution board were made of 3D-printed black nylon.

2.2.3. Power

A separate 6-cell 22.2 V 8000 mAh LiPo payload battery onboard the T30 was used to power the Gremsy AEVO gimbal, the HSI and its 5.8 GHz embedded Doodle Labs radio modem. Ground tests using a clamp meter indicated a combined current draw of 2.0–2.2 A once the HSI was online, recording and locked in position. The in-rush current on start-up peaked at 3.5–3.7 A. A battery discharge curve of the payload battery generated by using a 1500 W programmable DC electronic load with a constant current draw of 2.0 A was provided as a guideline to ensure that the length of time before the battery should be changed or charged is ~145 min. A 15 A double-pole single-throw (DPST) toggle switch with a locking lever was placed in line between the payload battery and a commercial off-the-shelf DJI power distribution board. The gimbal, camera and radio modem remained plugged into the aforementioned board, limiting battery sparking on power-up while also minimizing the number of mating cycles for the XT30/XT60 connectors used.

2.3. Vibration Test

A vibration test was performed to evaluate the effectiveness of the vibration dampener and gimbal to reduce vibration transmission from the RPAS to the payload. For this test, we utilized a replica of the S-620. Given the similarities between the VS-620 and S-620 (dimensions and weight), we were confident that our evaluation applies to both sensors. A total of four locations (i.e., top platform, gimbal arm below the vibration plate and two corners of the sensor replica) were selected to characterize the vibration transmission path from the RPAS platform to the payload. A PCB356A01 ICP-type tri-axial accelerometer was used for each location. The weight of the sensor was 1 g, and had a nominal sensitivity of 5 mV/g in each direction. The four sensors were glued to the surfaces using LOCTITE adhesive. A battery-powered light-weight Siemens SCADAS XS data acquisition device was attached to the T30 platform to record the data from the sensors. The data sampling rate was 12.8 kHz. The setup is shown in Figure 3. The test involved the rotors spinning on the ground, taking off to 1 m AGL, hovering in place for 3 min and then descending to land. The time domain and spectral analysis were performed using the Siemens Testlab R18 version software, an ISO certified software for signal analysis. The power spectral density plots were generated with a frequency resolution of 0.5 Hz, energy-averaged, amplitude rms-scaled, using MATLAB.

2.4. Wind Tunnel Test

A wind tunnel test was carried out at the National Research Council of Canada’s 3 m × 6 m wind tunnel in Ottawa, Canada. The open loop facility includes an outdoor testing area where the 6 m × 6 m exit flow is utilized for testing RPASs under free-flying conditions. The purpose of the wind tunnel test was to assess potential changes in the aerodynamic performance of the T30 (i.e., smaller surface for wind resistance) due to the replacement of the liquid tank with the gimbal and HSI. In order to determine whether the sustained wind tolerance (SWT), which is the maximum atmospheric wind speed at which the RPAS is safe to fly, of 8 m/s stated by the manufacturer (Table 1) remained applicable, a hover test was carried out.
A raised platform (Figure 4) was installed at the test area to provide support for the preliminary flow survey testing and the RPAS testing. A survey probe rig measured flow at the y–z test plane, using eight fast-response pressure probes (Cobra Probes, Turbulent Flow Instrumentation Pty Ltd.) which provided time series of the three components of velocity (velocity accuracy of ±0.5 m/s and flow angle accuracy of ±1°) and static pressure from which the mean values and turbulence quantities characterizing the flow field were calculated. Two sonic anemometers were also used to monitor wind characteristics at the exit and from atmospheric wind entering the test area at the platform perimeter. The sonic anemometers remained in place for the flow survey and the RPAS testing to ensure that the flow measured during the survey was consistent for the RPAS flight tests. After the flow survey was completed, the rig was removed to allow the RPAS testing in the flow that had been characterized [30]. During the RPAS testing, two cameras were installed as a visual positioning system and for video-recorded data collection.
The T30 was operated in GNSS mode without RTK due to the large metallic structure of the wind tunnel obscuring a clear view of the sky (Figure 4), i.e., with a hovering horizontal accuracy of ±0.6 m vertical accuracy of ±0.3 m). The replica Mjolnir S-620 on the gimbal was included in the T30 test configuration. The RPAS was manually flown up to the test platform and placed into a forward-facing hover in the center of the marked grids. Once at the test location, the pilot allowed the autopilot to maintain its position. The wind tunnel was turned on, and the hovering performance of the T30 was recorded by video over a course of 16 increments of wind speed from 5 m/s to 14 m/s with each increment of the autopilot hover lasting 30 s (Table 4). The test was terminated at 14 m/s (50 km/h) because such conditions are not considered to produce high-quality HSI data, especially over vegetated targets, and data would not be collected in those conditions. The wind speed data were first processed by converting it from the wind tunnel native format into MATLAB time-series data from each 30 s test, which was then processed to determine mean wind speed and turbulence intensity.

2.5. Special Flight Operations Certificate (SFOC) Considerations for Flight Testing

Two areas were selected to test the RPAS HSI implementation. First, a field located in Rigaud, Quebec, was used for a first flight test once the system was completed. The second site, the Mer Bleue Peatland Observatory Cal/Val Supersite [31] was used to collect hyperspectral data over areas to test the use of the system in the validation of satellite reflectance products (e.g., [32]). For Mer Bleue, controlled airspace starts at 1500 ft (457 m) AGL, and for Rigaud, it is within an airport/heliport environment. For the purpose of a Specific Operational Risk Assessment (SORA), an airport/heliport environment is defined as “within 5 nautical miles (9.3 km) from the center of an airport, heliport, or aerodrome published in the Canada Flight Supplement or Water Aerodrome Supplement” [18].
For flight planning with the T30 and the HSI system we had to consider the SFOC aspects as well as HSI data quality requirements, i.e., weather minima, battery sufficient for planned flight, site survey and operational volume (Table A1). RPAS HSI requires both low wind speed and clear or overcast skies, depending on the data collection objectives. Wind speed over 5 m/s reduces the quality of HSI over vegetation due to excessive motion of the canopy. Clouds are also important because while HSI can be acquired under direct illumination (i.e., sunny skies) or diffuse illumination (i.e., overcast), partially overcast or moving cumulus clouds are generally not ideal because of the cloud shadows [9]. The fuel/energy sufficient for the planned flight section of the SFOC requires that VLOS operations > 25 kg complete the flight with a reserve of 30% of total flight time or 30 min, whichever is lesser; this reduces the total area covered per flight.
While a thorough site survey is critical for any safe RPAS operation, under STS-002 (Table 1 and Table A1), an extended ground risk buffer is required where the controlled ground area extends 100 ft plus the highest flight altitude beyond the operational area. This requirement has a profound impact on flight planning. For example, a flight altitude of 100 m (328 ft) AGL requires a controlled ground risk buffer of 130.5 m (428 ft) (Figure 5). Also, as shown in Figure 5, the ground access must be controlled within full 152.5 m (500 ft) in case of a hard landing. Finally, the flight geography component of the operational volume calculations is fundamentally important for the traceability of the uncertainties within an HSI acquisition for applications such as satellite cal/val activities (Figure 1). It considers the expected total system error of the RPAS in the horizontal and vertical directions. Horizontally, the navigation solution, flight technical and the path definition errors are estimated. Vertically, the path definition, flight technical and altimetry errors are estimated. For the T30 operating with RTK (Table 2), the operational volume is very close to the planned position and desired altitude.

2.6. Data Collection, Processing and Analysis

Two data collections were carried out to test the integration of the HSI with the T30 (Figure 2B), one at Rigaud (Figure 5) and one at Mer Bleue (Figure 6). At Rigaud, we collected HSI over known nominal reflectance targets (1%, 5% and 50%) (Figure 5), following cal/val best practices (e.g., [9]) (Figure 7). These data were collected at two different altitudes and speeds, which were predefined using the manufacturer’s planning tool and simulation tool developed in [33], aiming to generate raw pixels with the aspect ratios across a range of point spread function and over/under sampling factors. To assess spectral variability, we collected two separate flight lines at 50 m AGL and 3 m/s (frame time 5 ms, integration time 4.8 ms (VNIR) and 10 ms and 9.6 ms, respectively, for the SWIR). To compare the effect of speed on pixel aspect ratio and the resulting reflectance, we collected one flight line at 100 m AGL at 1 m/s. For each flight line, the reflectance targets were measured with an SVC spectrometer prior to the HSI data acquisition, using the panel substitution method described in [34]. The results from these flights informed the operational acquisition parameters for Mer Bleue (i.e., 100 m AGL at 3.7 m/s). At Mer Bleue, we carried out a performance test of the integrated system with the goal of supporting satellite validation by defining a 2-ha area, representing 5 × 5 pixels for EnMAP and 15 × 15 pixels for Sentinel-2. A local base station was set up on site (i.e., Emlid Reach RS2) with an incoming NTRIP correction from Smartnet North America (11.3 km baseline for the NTRIP correction).
Processing of the HSI data followed standard methodology shown in [9], to generate non-geocorrected and/or geocorrected radiance data [34] and atmospherically compensated data, which removes the atmospheric absorption and scattering in the HSI [35]. Our analysis of the HSI from Rigaud assessed the spectral variability (i.e., average and standard deviation) of the panel measurements, based on estimated absolute reflectance values [36]. For comparing the reflectance data from different flight lines, we extracted a region of interest of 3 (at 100 m) to 21 (at 50 m) pixels from the geocorrected reflectance imagery and calculated the average and standard deviation of the panel spectra. At the Mer Bleue site, the spatial accuracy of the geocorrected reflectance imagery was assessed in comparison to a pre-existing orthomosaic of the site.

3. Results

Here, we present the results from the various tests that were carried out in order to assess the RPAS–HSI integration.

3.1. T30 Payload Integration

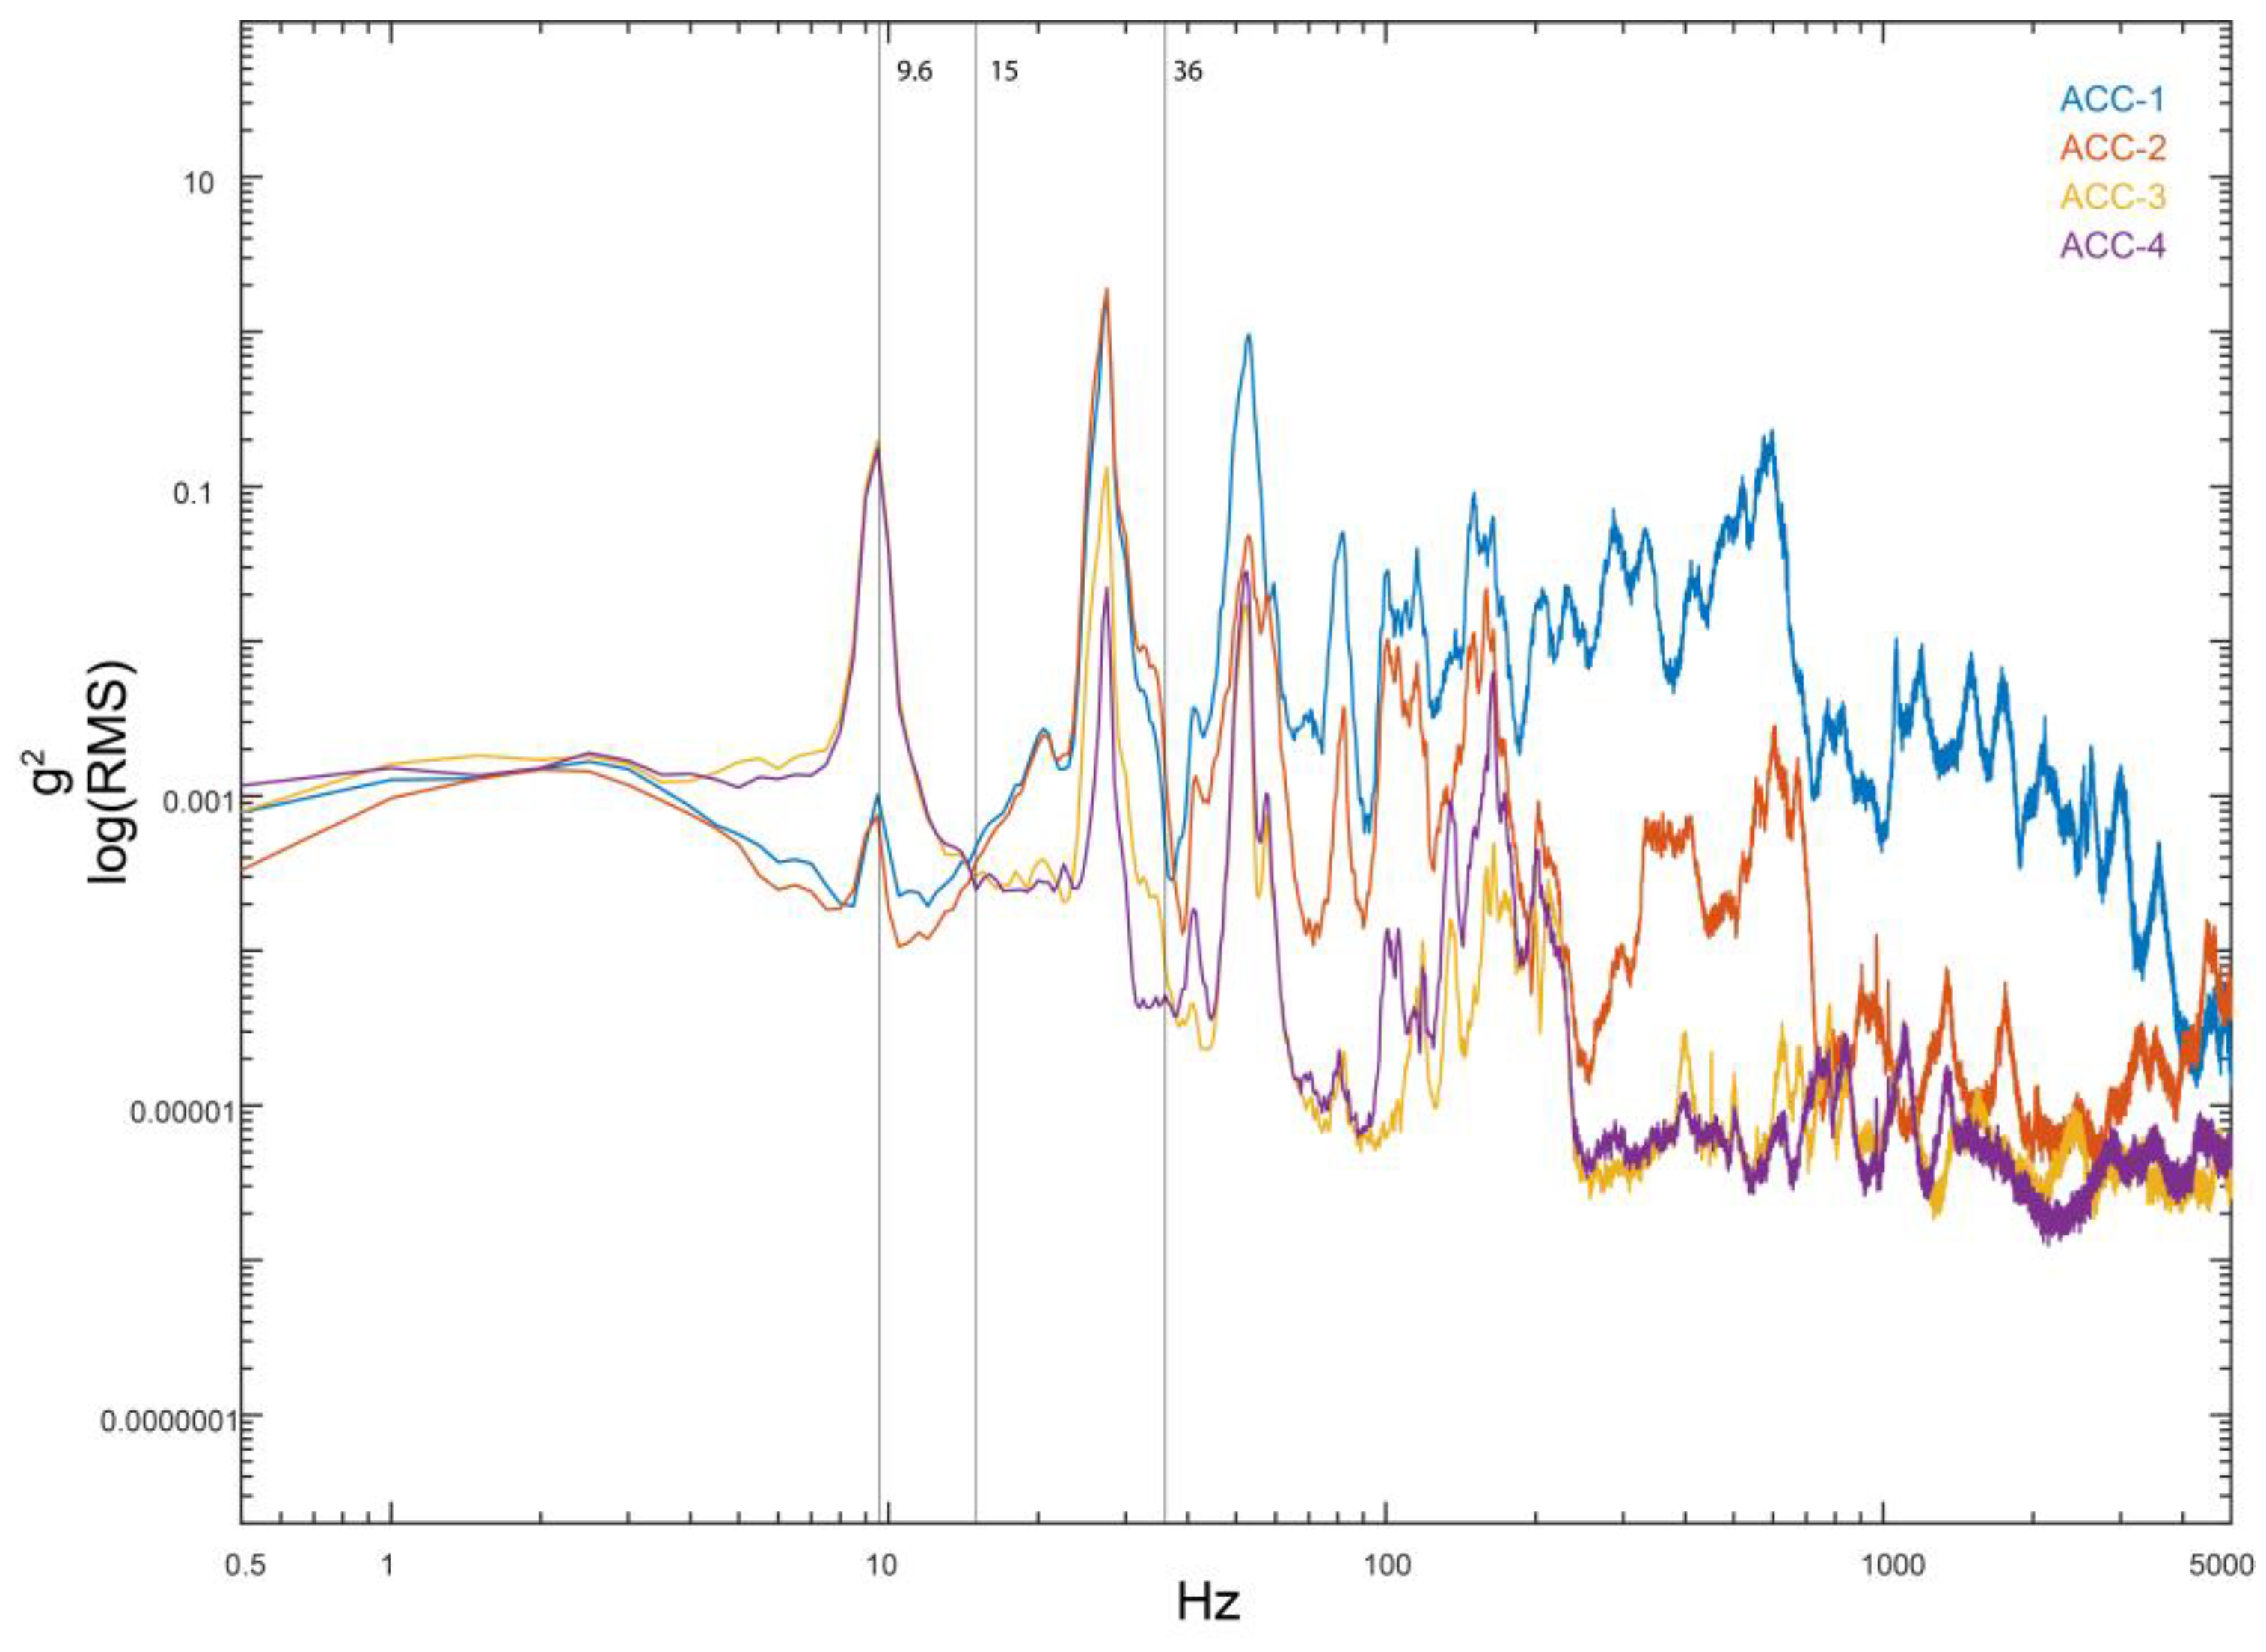
3.1.1. Vibration Test

As shown in Figure 8, the overall root mean square (RMS) of the vibration level in the vertical (z) axis was 0.699 g (6.86 m/s2) on the RPAS platform (ACC-1) (Figure 8). On the gimbal arm (ACC-2), the vibration level was 0.245 g (2.4 m/s2), a reduction of 64.9%. The two measurement locations on the S-620 replica further showed a reduction in vibration level to 0.082 g (0.8 m/s2) (ACC-3) and 0.071 g (0.7 m/s2) (ACC-4). Similar results were found in the x- and y- directions as well (Figure not shown).
The results of a spectral analysis comparing the vibrations at ACC-1 and ACC-2 (Figure 9) show that the vibration spectra of the RPAS and payload consisted of multiple tonal peaks related to the motor blade rotating speed (kV = 77 RPM per V). Comparing the spectra of ACC-1 and ACC-2, it is clearly seen that the vibration plate effectively reduced the vibration components above 36 Hz, while the components below 36 Hz were virtually unchanged. The comparison of the vibration spectra at ACC-3 and ACC-4 shows that they were consistent. Comparing the vibration levels at the gimbal arm (ACC-2) with the levels experienced by the replica (ACC-3 and ACC-4), it was interesting to note that the vibration reduction occurred above 15 Hz. A resonant peak related to the vibration mode of the bow-shaped supporting structure of the gimbal is seen at 9.6 Hz, which led to vibration amplification in the low-frequency range on the order of an RMS of ~0.08 g (0.8 m/s2) on the z-axis.

3.1.2. Wind Tunnel Test

The results of the flow survey of the y–z test plane showed a turbulence intensity of 10% due to the internal flow control structures near the wind tunnel exit. This level of turbulence intensity is not uncommon for atmospheric conditions and more realistic for the RPAS application than a smooth flow, which is typical of indoor wind tunnel testing.
The T30 maintained a stable hover within the test grid area with slight drifting in the x- and/or y-direction to within ±0.5 m for all 16 increments of wind speeds tested (Table 4), including the maximum test speed of 14 m/s (Figure 10). The maximum test speed result is significantly higher than the manufacturer-specified SWT (8 m/s) for the test configuration and turbulence intensity level.

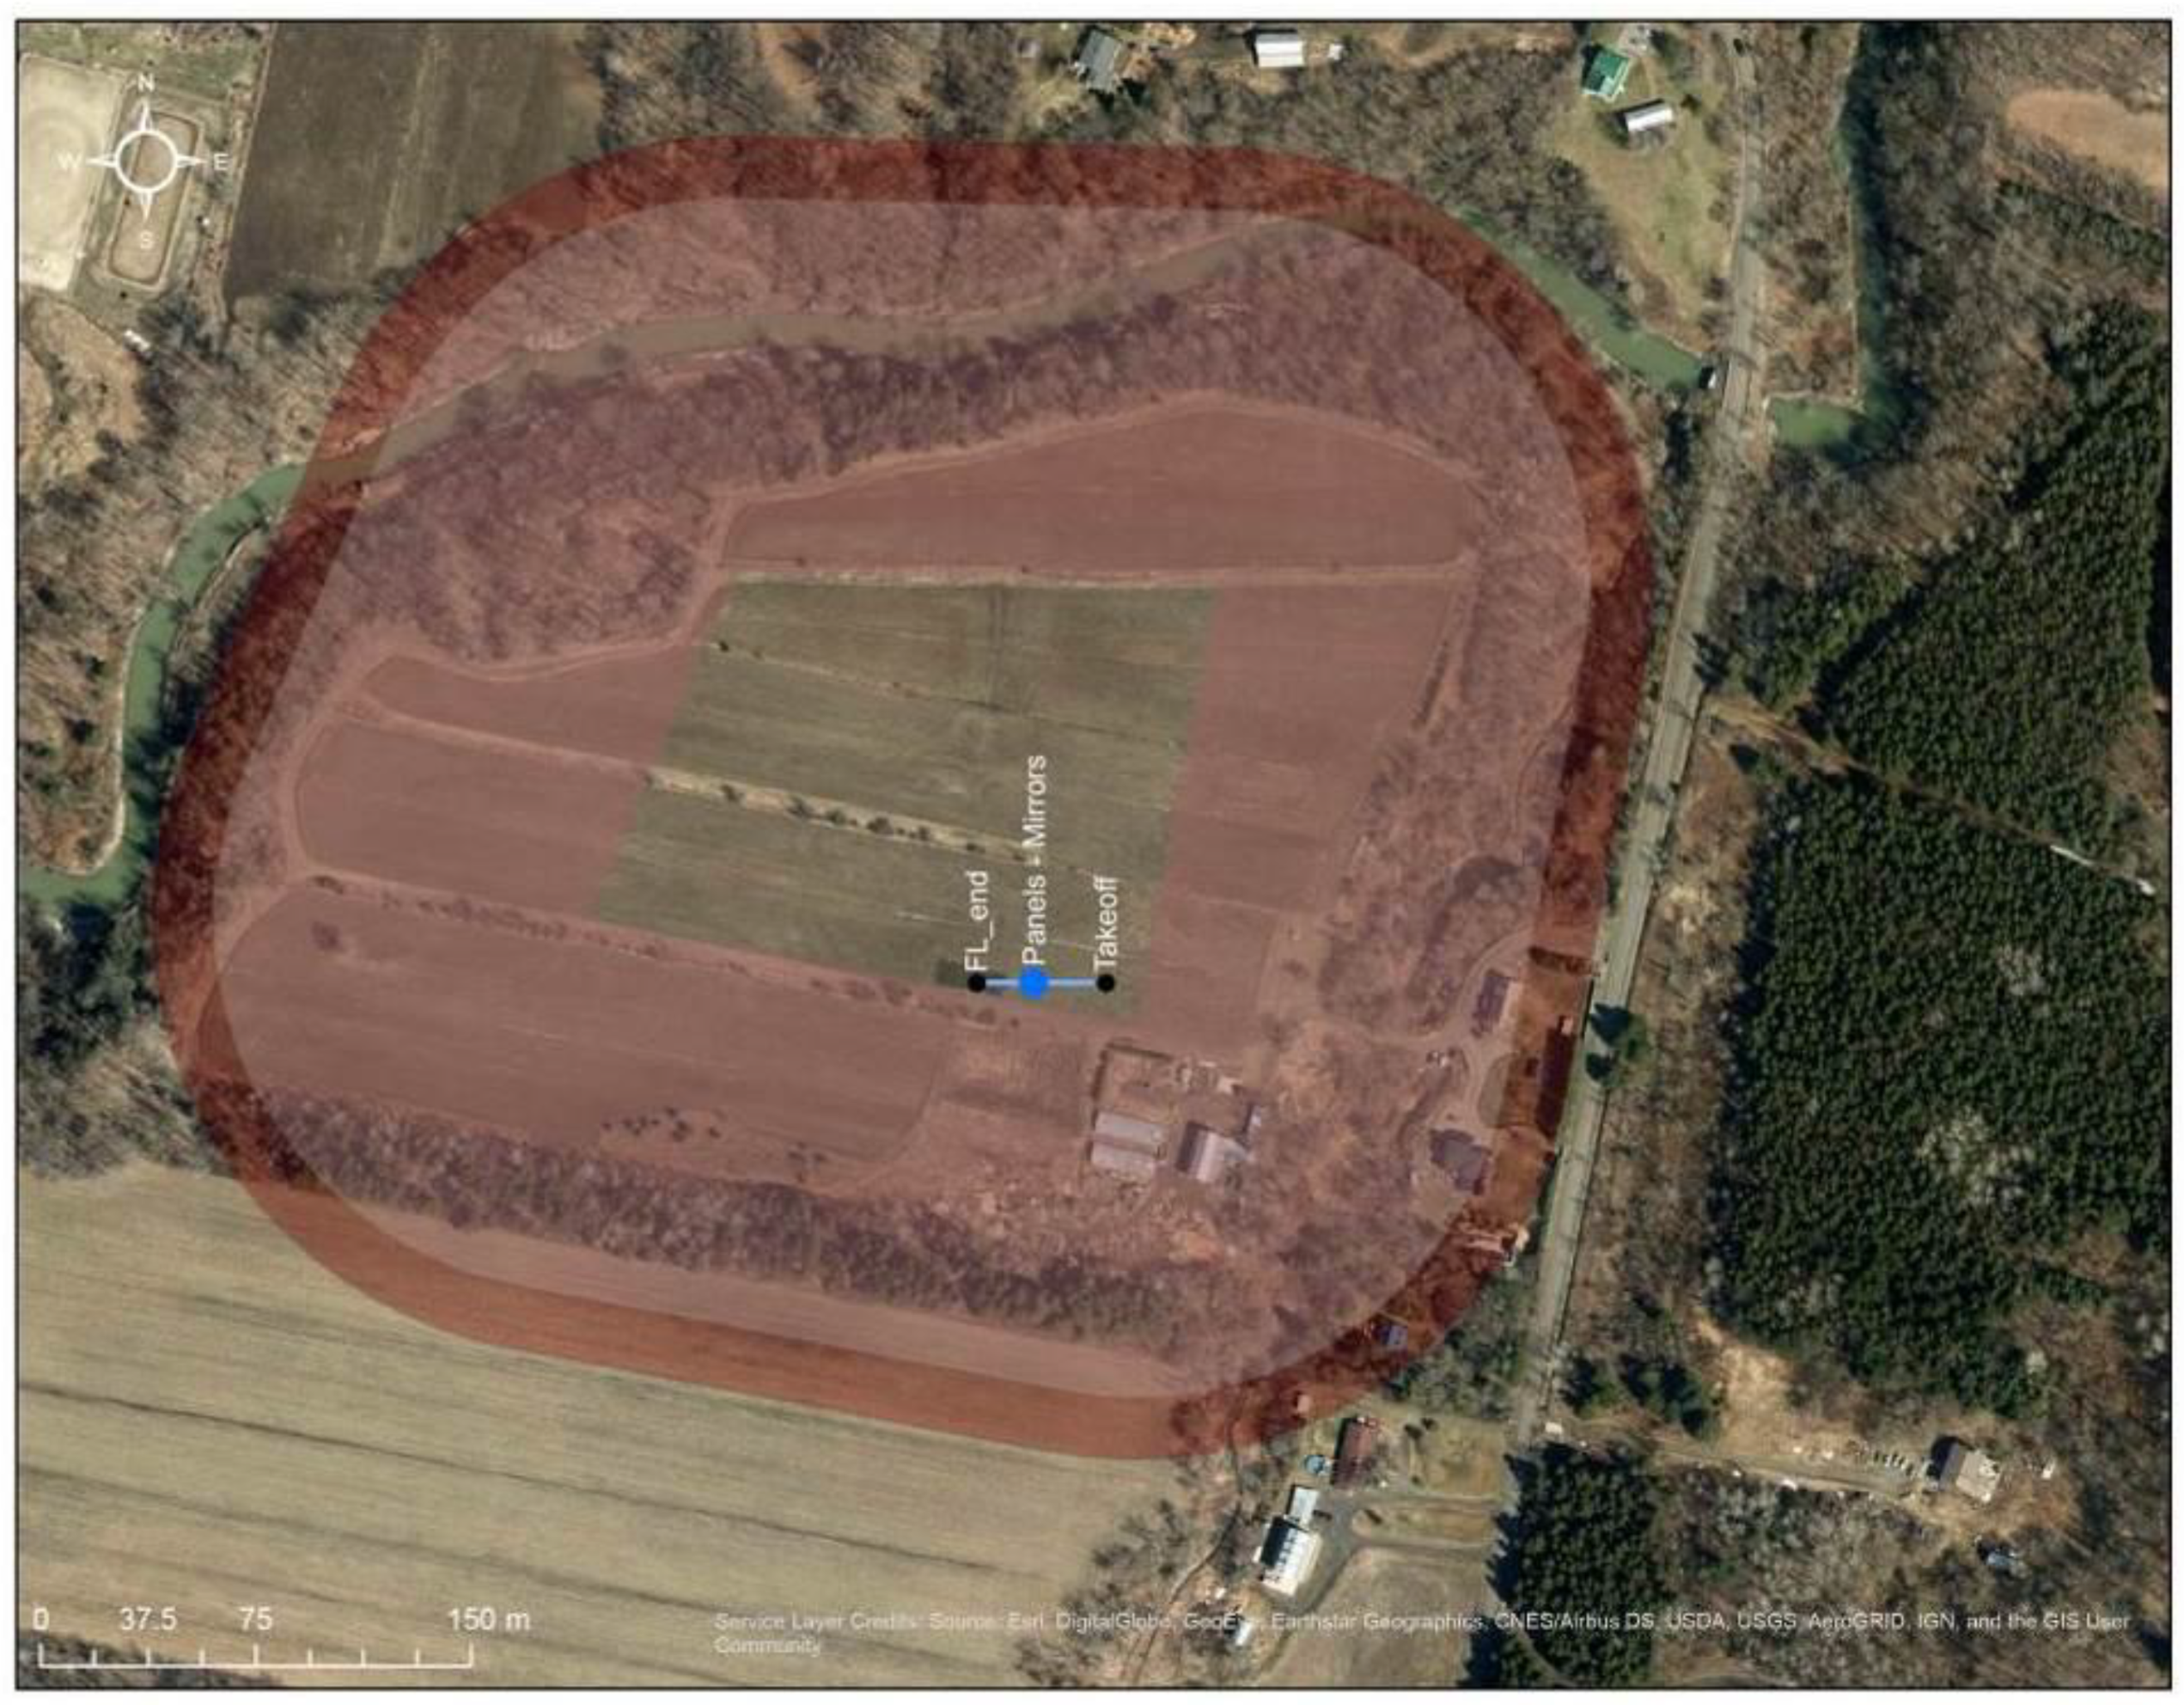
3.2. Flight Performance at MB

3.2.1. Operational Flight Conditions

Our results demonstrating the utility of the RPAS HSI integration for satellite cal/val activities show that the system was able to collect an effective imaging area of 150 m × 150 m (2.25 ha) at the Mer Bleue Peatland Observatory site (Figure 11). The HSI data were acquired as a set of five parallel flight lines on a single battery charge. The entire flight duration lasted between 10 min 14 s and 11 min 5 s including the transit to and from the takeoff and landing site and the required high-speed forward and reverse manual IMU calibration trajectories at both the start and end of each flight. The difference in time was the result of different transit distances to the imaging areas. The flights were carried out with 32–41% battery remaining at landing. Two additional 2.25 ha were also collected during the same field campaign producing a total area of 7.25 ha. The final hyperspectral product was generated at a resampled pixel size of 10 cm, with 390 spectral bands.

3.2.2. Gimbal Performance

Attitude data from the IMU within the VS-620 for the five flight lines revealed a pitch range of 0.30° for flight line 3 and 0.45° for flight line 1 (Figure 12A). Interestingly, these two flight lines in the northerly direction remained near 0° pitch, whereas the three southerly lines had a consistent pitch of approximately −3° (Figure 12A). In addition, the RPAS HSI system showed very low roll (<1°), with a range (i.e., difference between minimum and maximum value) between 0.46° for flight line 2 and 0.89° for flight line 5 (overall mean 0.68° ± 0.06°). Finally, heading results were quite consistent with a maximum heading deviation of 0.89° along the lines (Figure 12C).

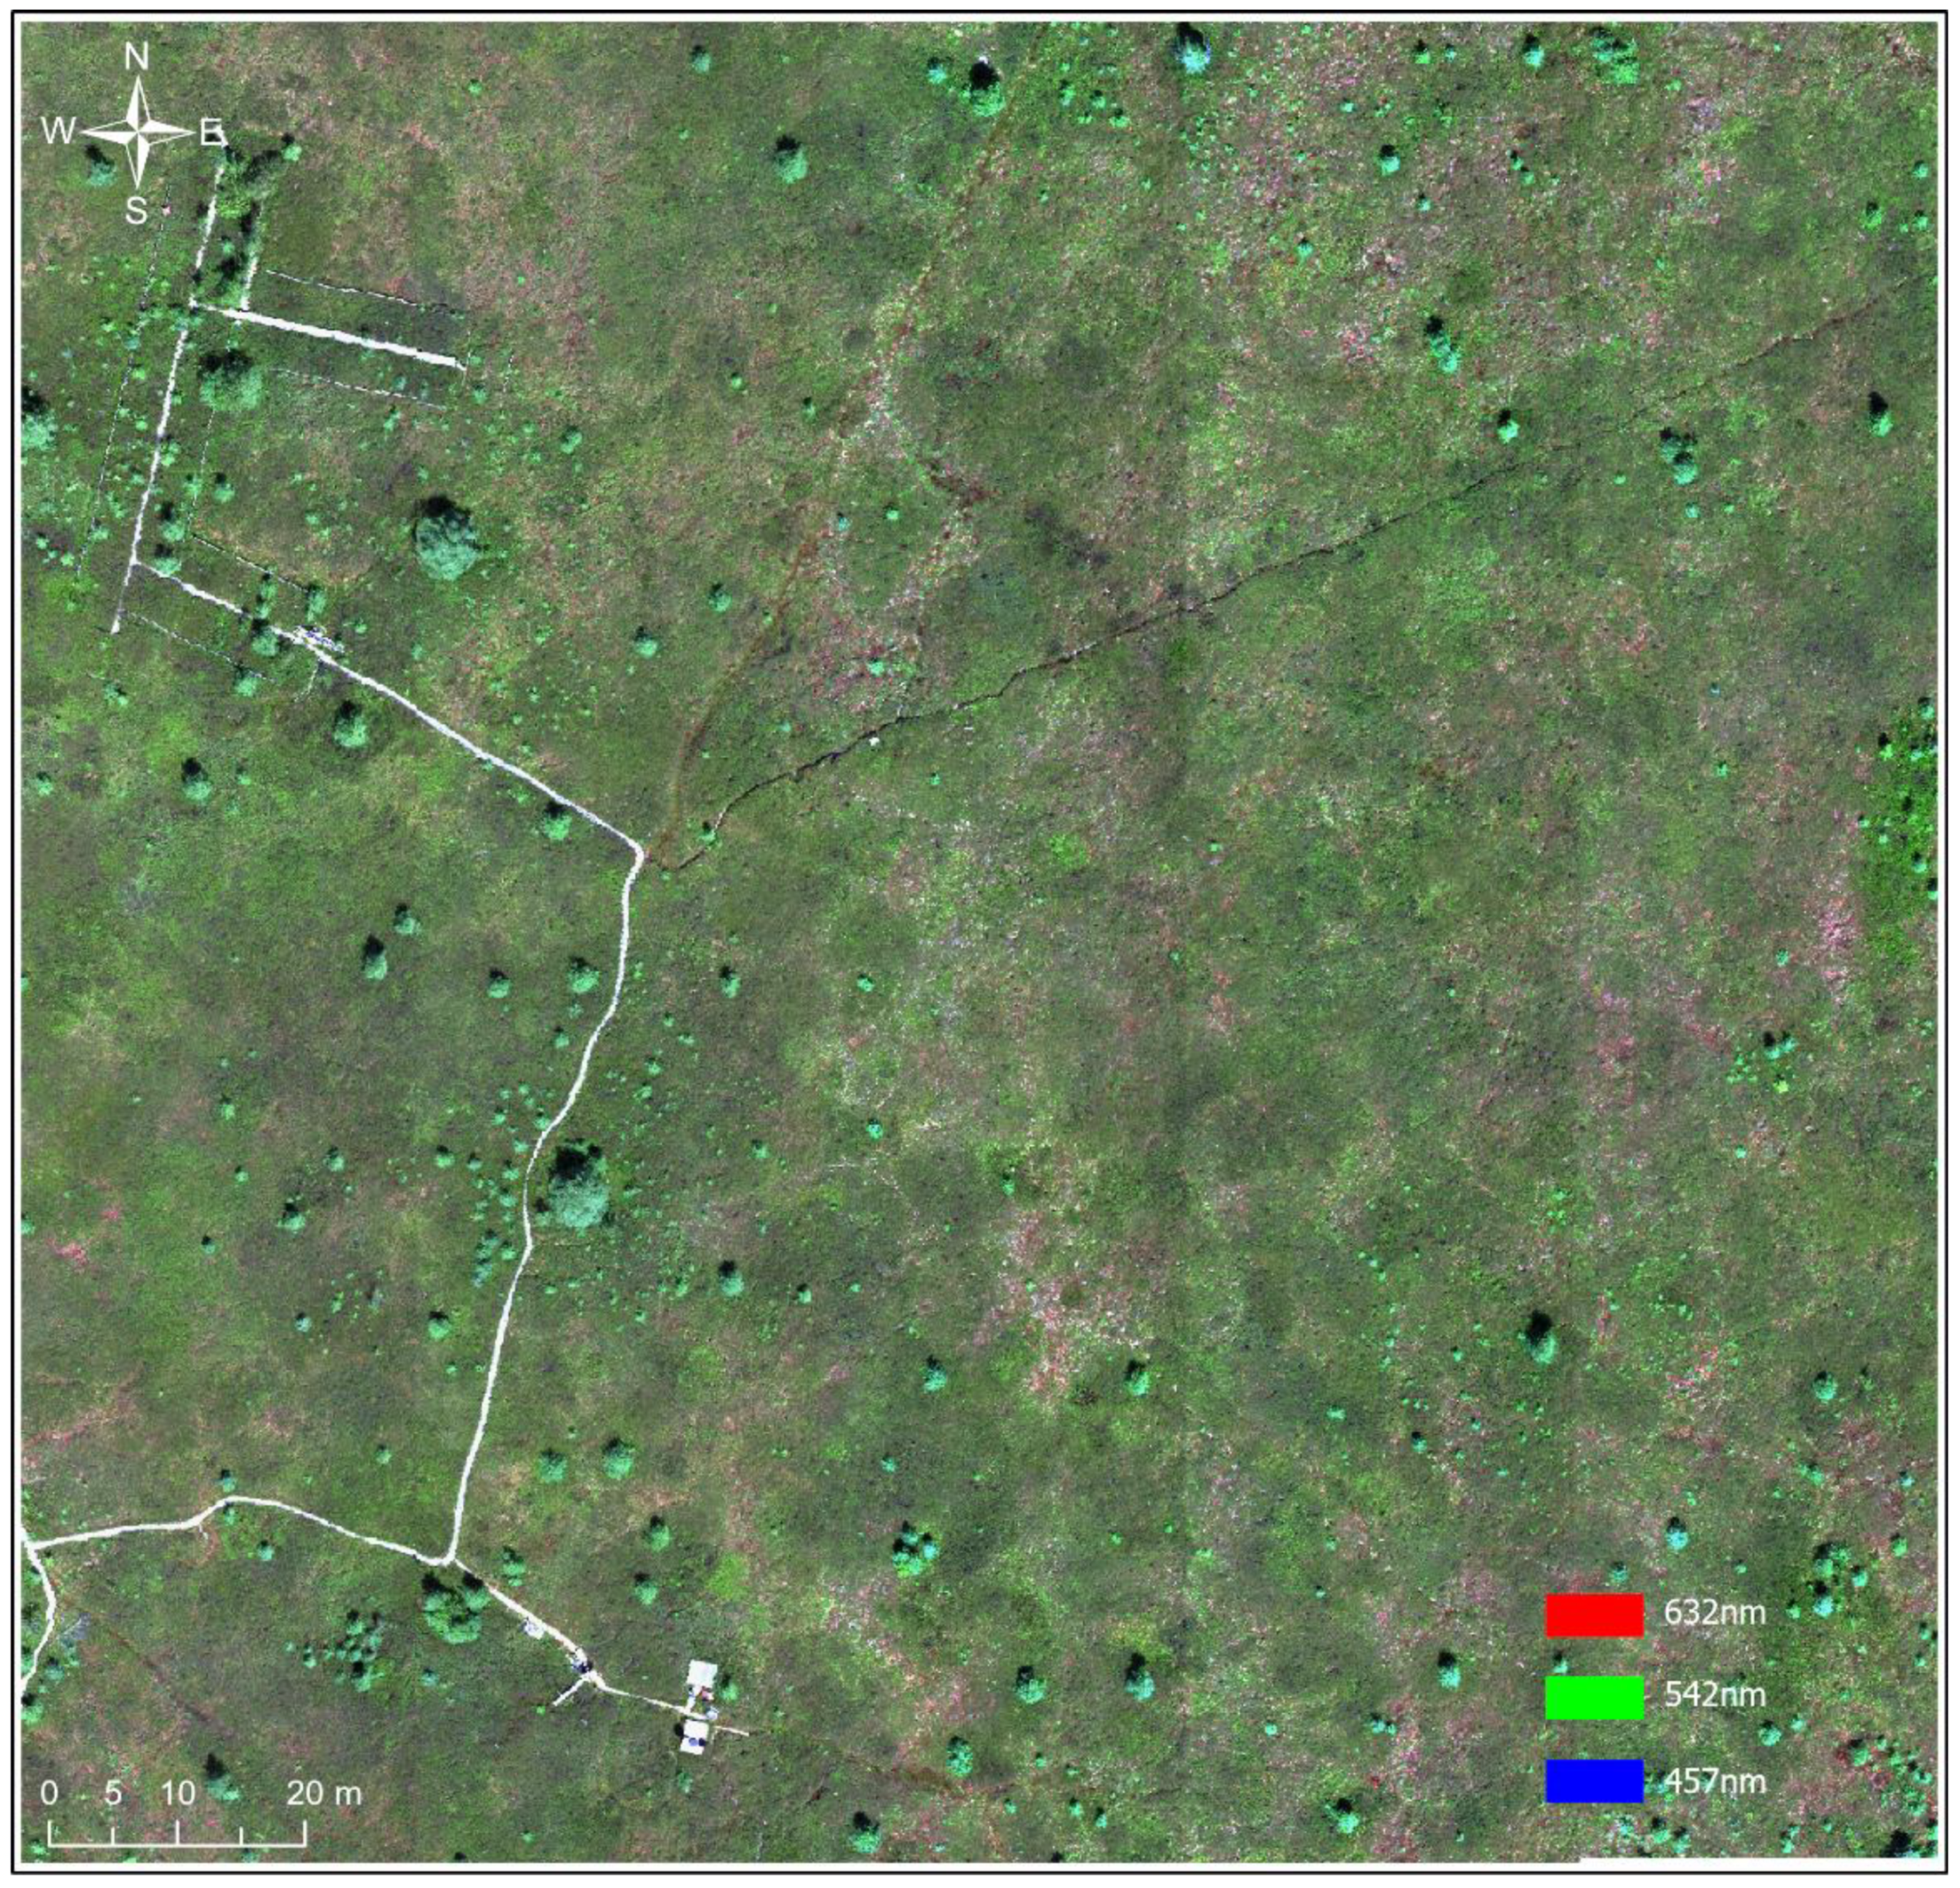
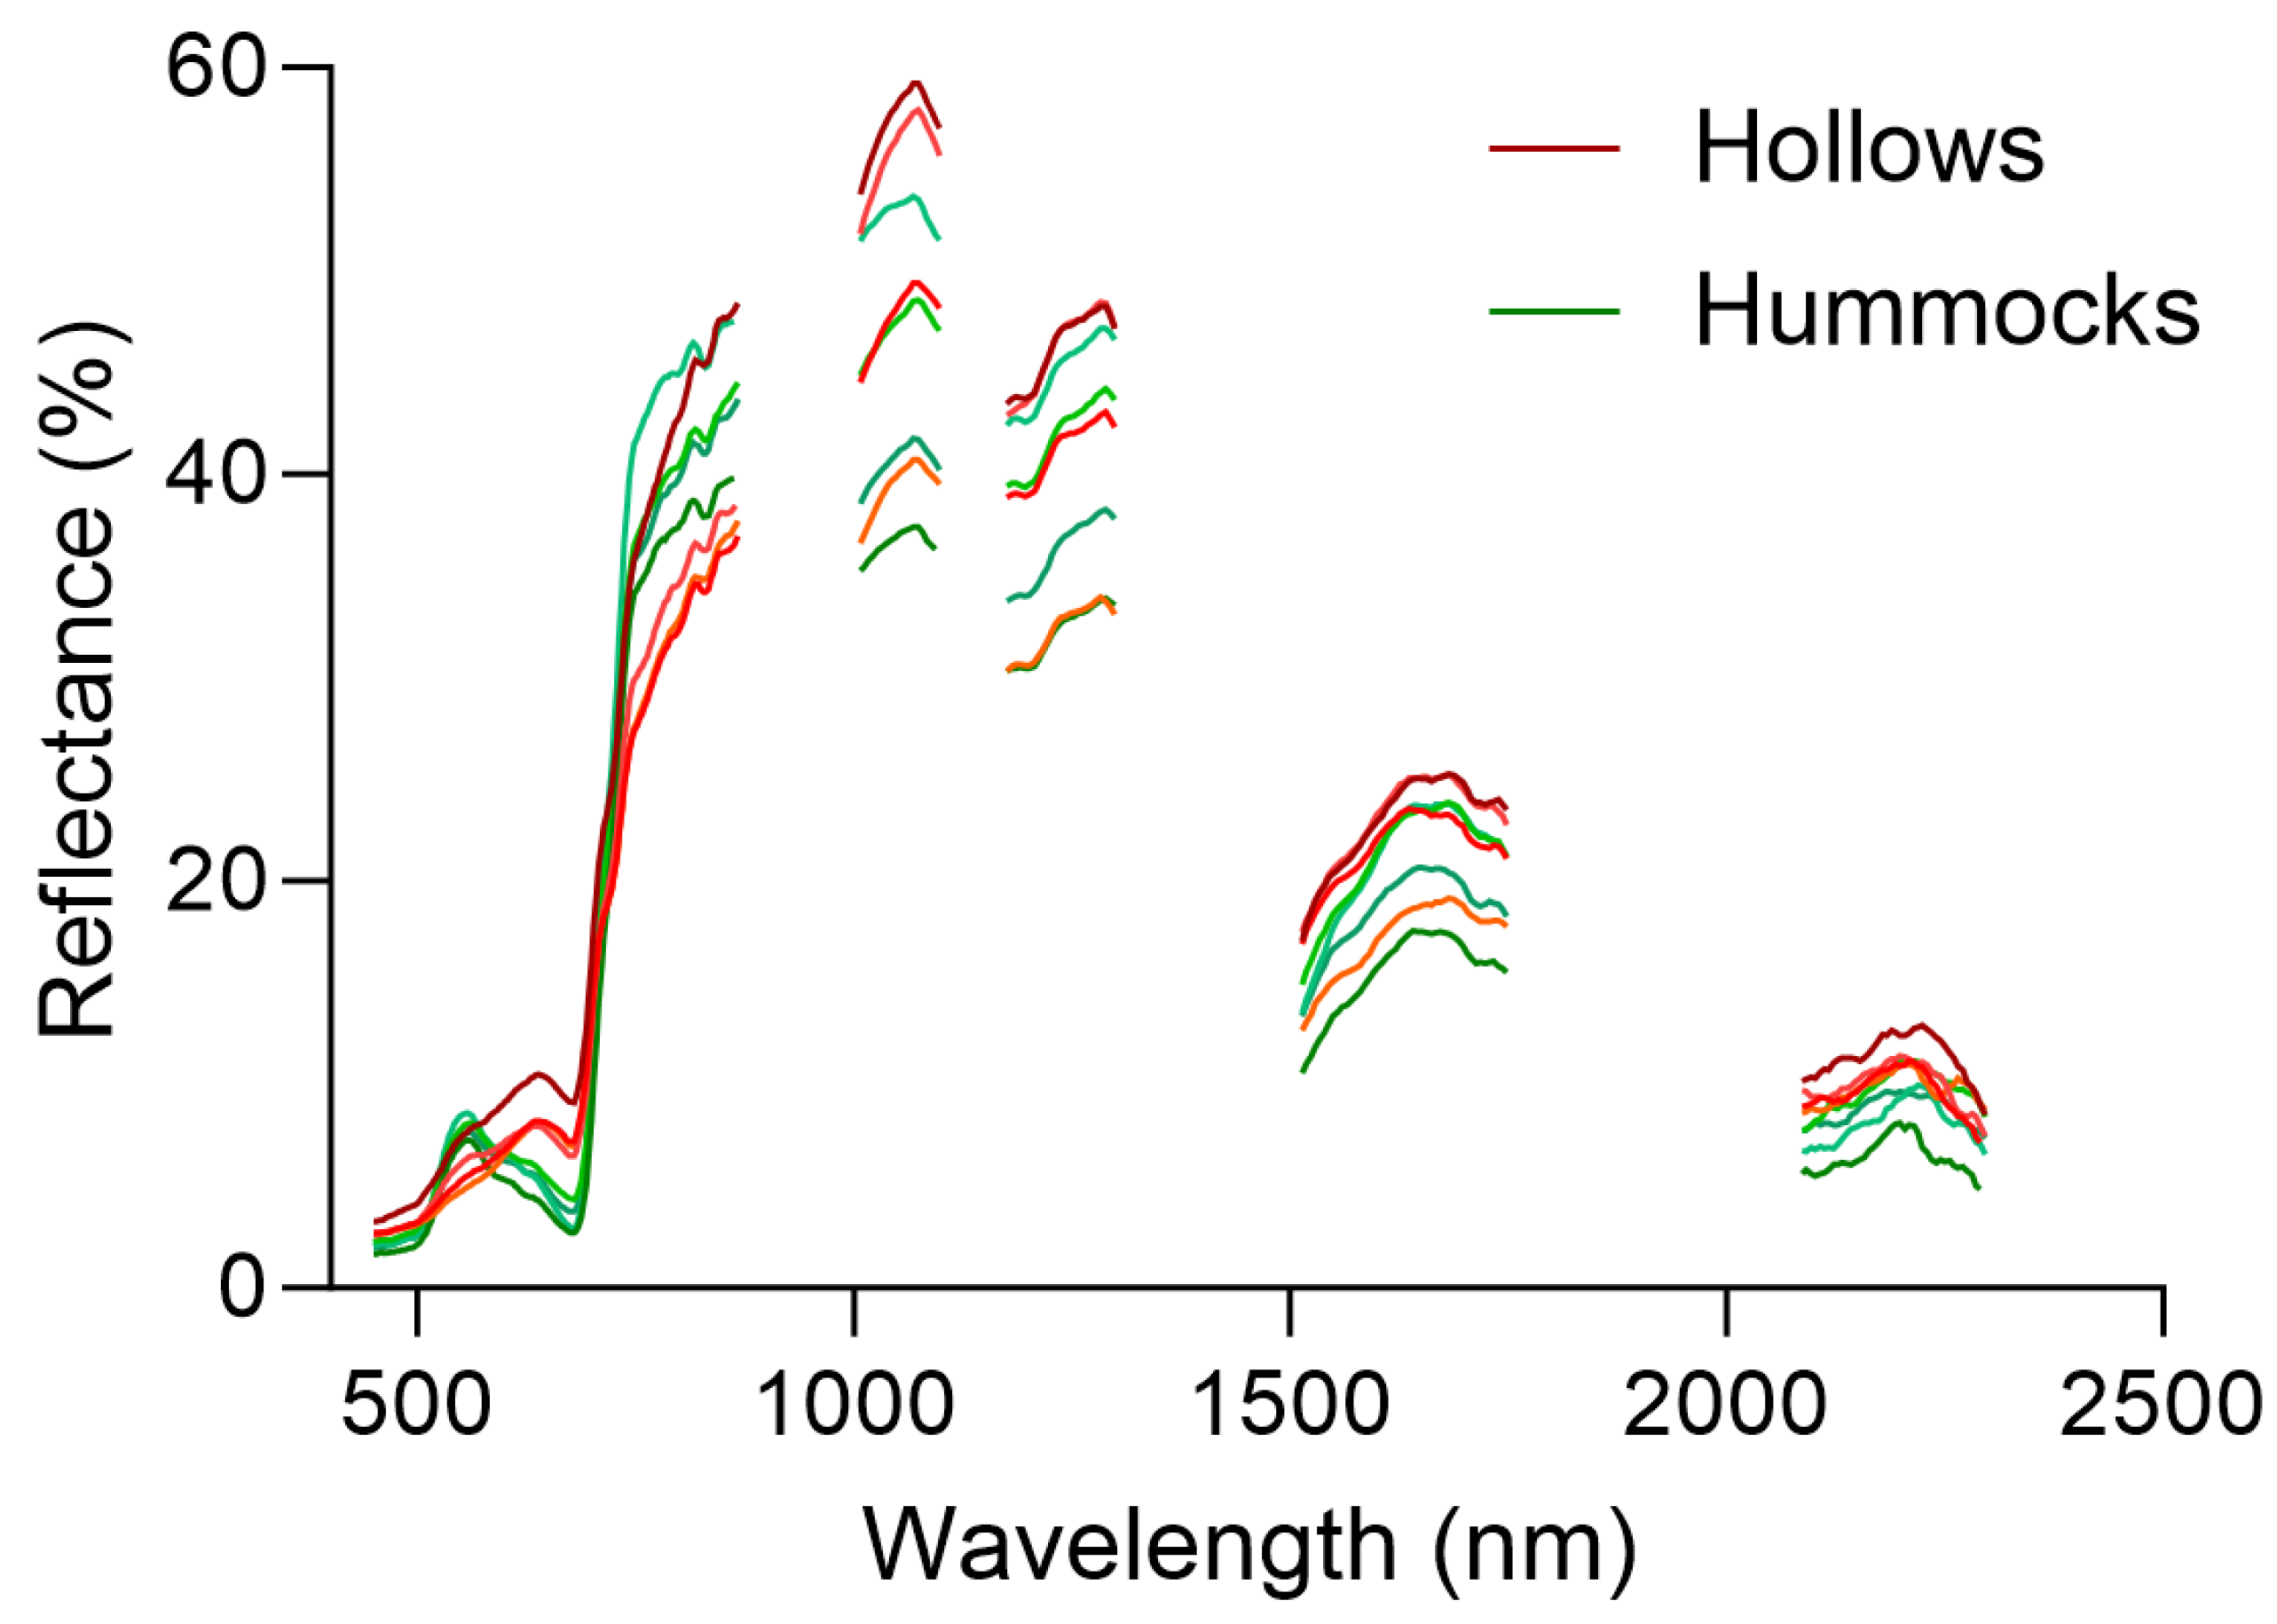
3.3. Hyperspectral Results

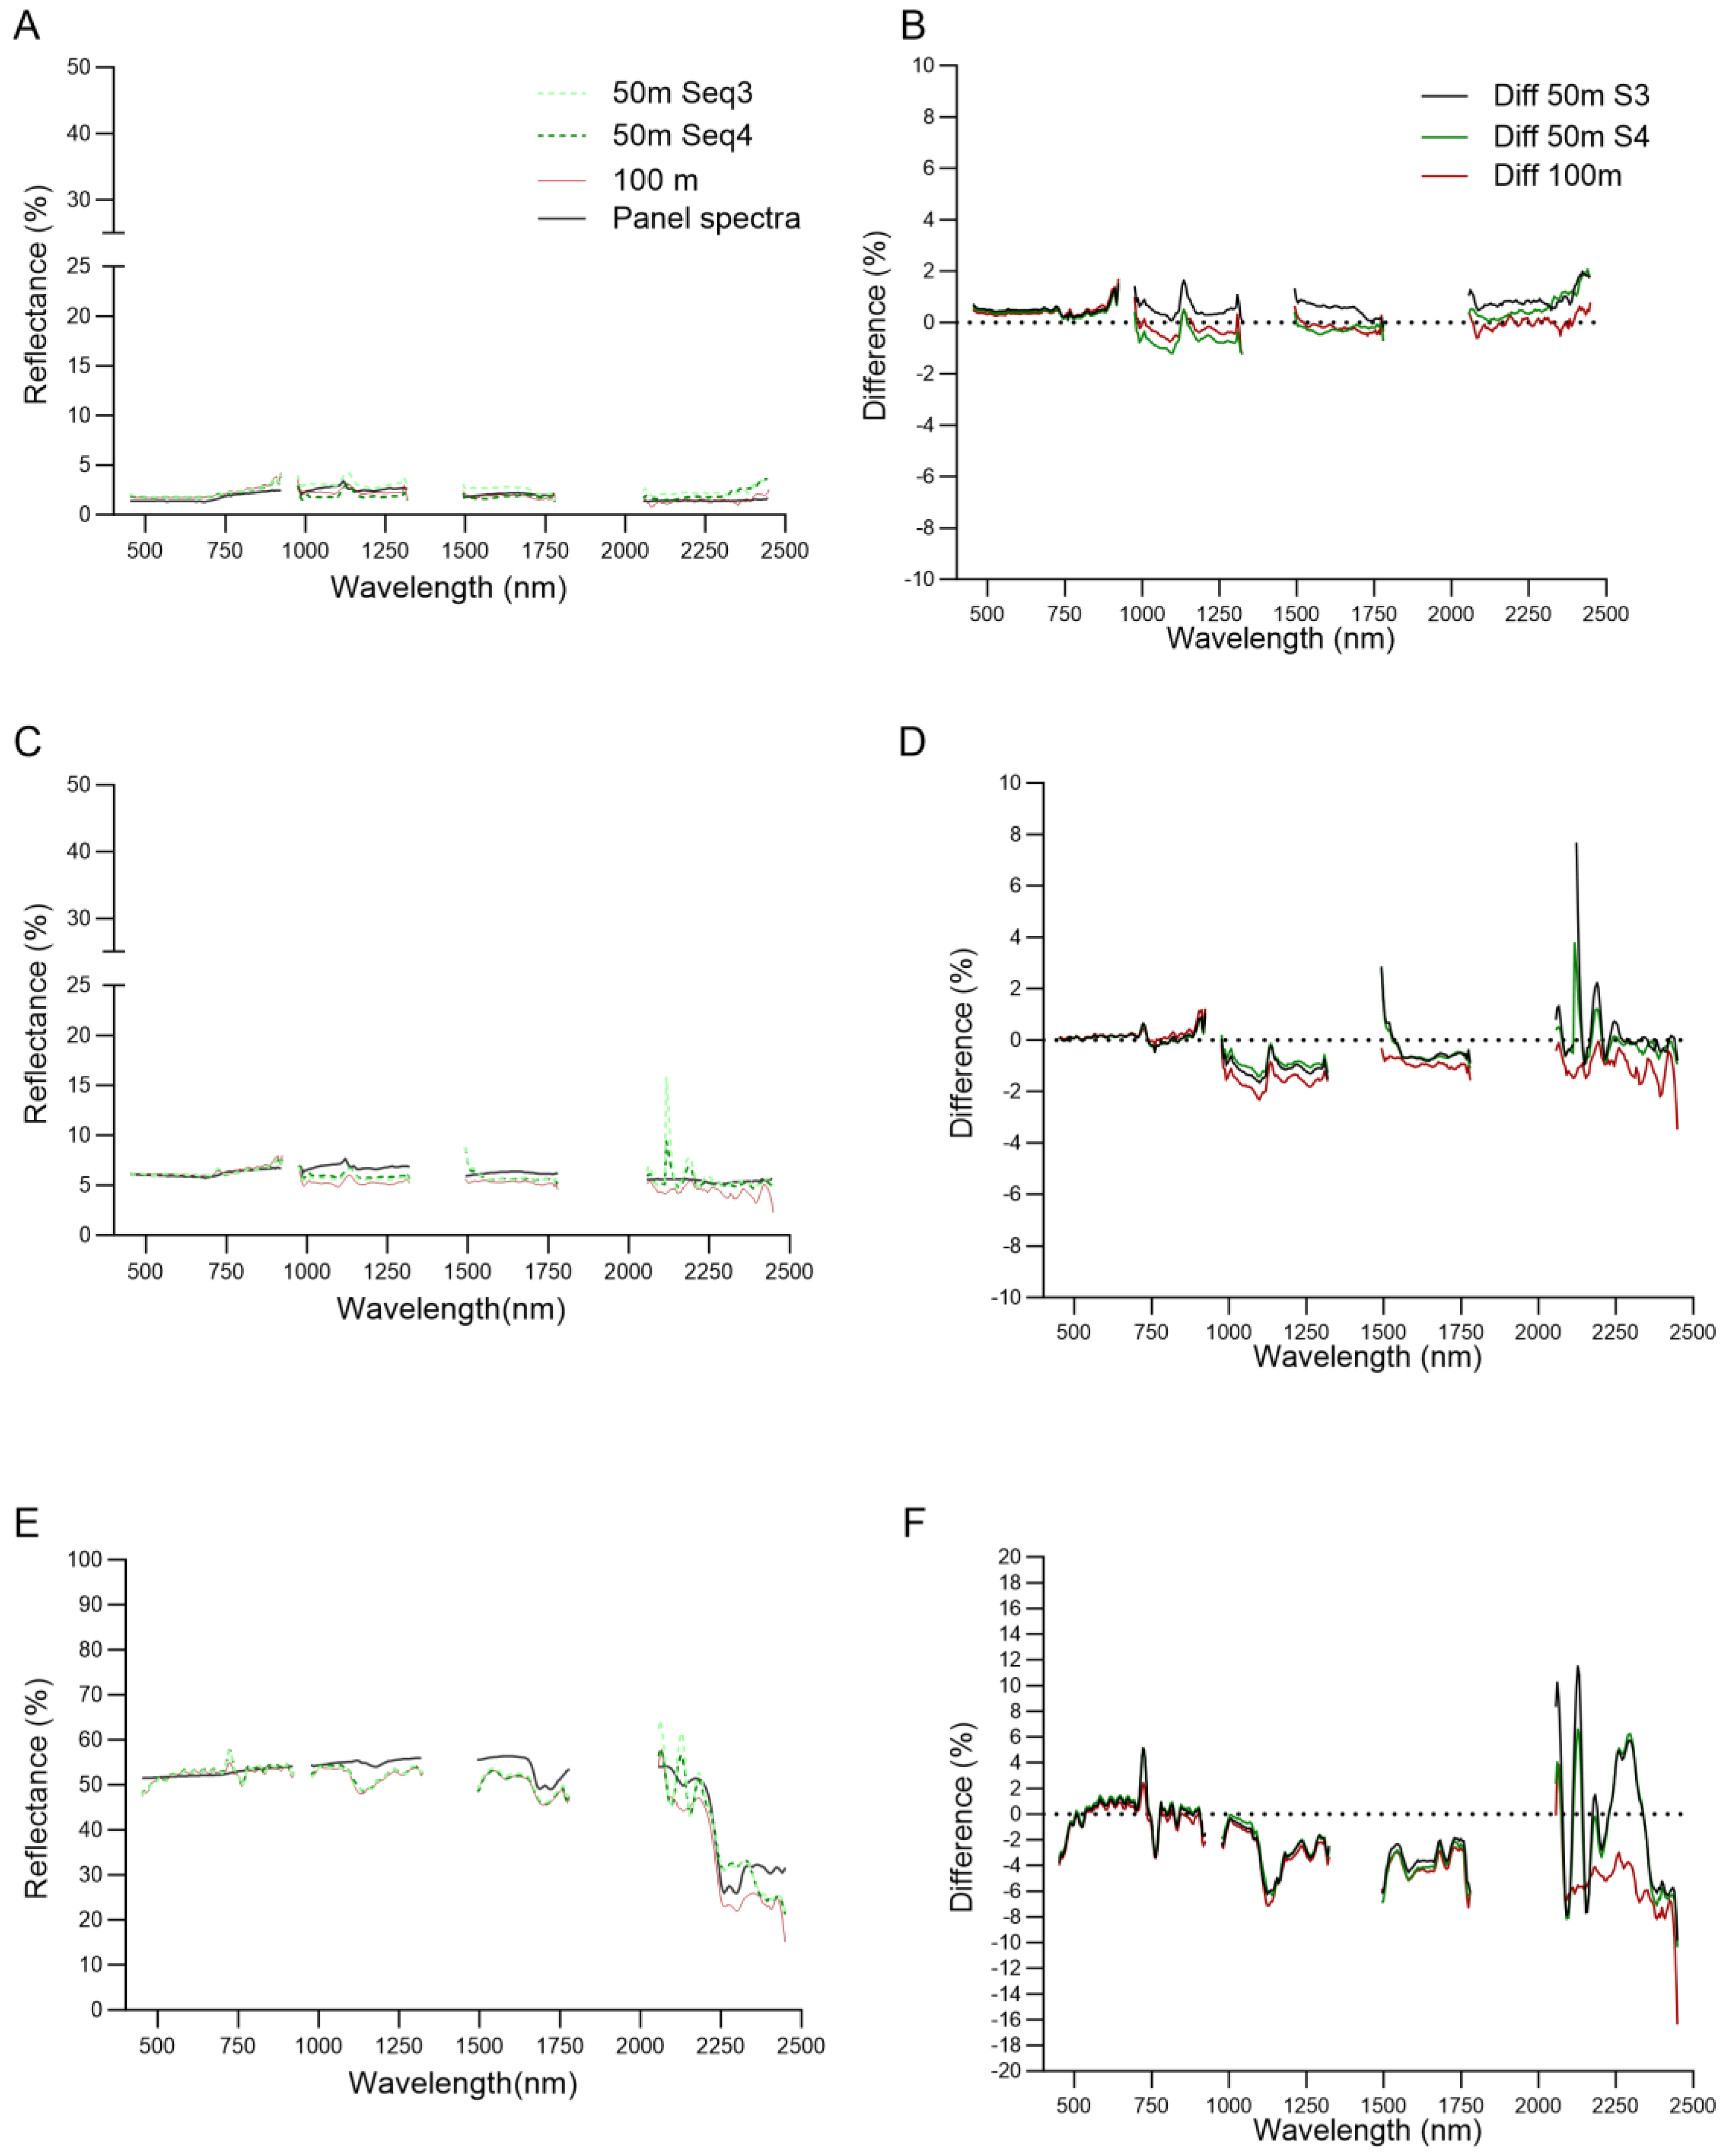
3.3.1. Radiometric Assessment

Reflectance spectra acquired at 50 m and 100 m AGL of the panels in Rigaud (Figure 13) indicate both a consistency in the reflectance at the same altitude and between the altitudes for all three panels ranging from 1% to 50% reflectance. The differences between the extracted pixel spectra and the in-situ panel spectra (Figure 13) show that with the exception of the shoulder of the CO2 feature at ~2 µm for the 1% and 5% panels, the image spectra are within ±2%. For the 50% panel at wavelengths over 1000 nm, the difference increased to ~5% (Figure 13F), and for the 100 m AGL specifically at wavelengths over 2000 nm, the difference increased to 6–8% indicating the need for longer integration and frame times in the SWIR. Figure 14 shows a clear differentiation between the spectral profiles of the two predominant vegetation classes (hollows and hummocks) at Mer Bleue. Of particular interest is the shift in the position of the peak reflectance in the visible wavelengths between hummocks and hollows.

3.3.2. Geometric Assessment

Key results illustrating the raw imagery of our RPAS HSI implementation prior to geocorrection are shown in Figure 15. The example from one of the 50 m AGL flight lines from Rigaud shows the table with the nominal reflectance targets (shown in Figure 7). The table and square panel edges and corners are well defined with minimal attitude artefacts present (Figure 15A). In Figure 15B, a section of one of the 100 m AGL flight lines from Mer Bleue shows a similar clear definition of the edges of the square platforms (lower right-hand corner) and the boardwalk where the trajectory of the boardwalk and the position of the trees in this non-geocorrected image resembles closely the geocorrected version (shown in Figure 11).
The comparison of the relative and absolute positional accuracies of the VS-620 imagery at Mer Bleue indicated that between flight lines the spatial alignment varies between 1 and 3 pixels with the misalignment closer to 1 pixel at the beginning of the line and increasing to ~3 towards the end due to the length of the lines and the deterioration of the heading alignment of the APX-15 IMU. The comparison of the geocorrected imagery (Figure 11) with a previously generated ultra-high spatial resolution orthomosaic indicated an RMS of 2.47 pixels.

4. Discussion

A large number of newly in orbit and planned spaceborne hyperspectral imagers (e.g., EnMAP [14], HISUI [15], PRISMA [16], Planet Tanager Constellation [37], SBG [38], PACE OCI [39], CHIME [40], HYPSO [41], etc.) have driven the need for improvement in the spatial representativeness of upscaling cal/val data. With the overarching goal of building public trust in Earth Observation (EO), new methodologies are required to maximize the quality of the EO data and quantify and scale the uncertainties. The RPAS HSI systems have the potential, when properly implemented, to expand by orders of magnitude the spatial representativeness of ultra-high spatial resolution HSI over conventional field spectroscopy at a fractional cost of manned aerial campaigns. Until recently however, the RPAS community had reached a ceiling in capability with little progress in terms of aircraft performance of “heavier lift” systems with a MTOW near 25 kg over the last 5–10 years. With the agricultural market now driving innovation, there is a renewed need for systems that can carry heavier payloads, follow accurate and precise flight plans and pass rigorous safety and performance testing.
We selected the DJI Agras T30 to test its potential as a heavy-lift RPAS for advanced hyperspectral applications, such as validation of spaceborne reflectance products [42,43], for several reasons. First, the T30 is a smart agricultural spraying drone designed to carry a liquid payload of 30 L (equivalent to 30 kg). By necessity, its design characteristics consider slosh dynamics, which refers to the complex motion of a liquid within a container (e.g., [44]). More specifically, inertial waves caused by the motion of the liquid within the tank could have an adverse effect on flight performance and safety. If not taken into consideration by the flight controller, liquid oscillations caused by rapid acceleration/deceleration or changes in direction (e.g., spinning in place to change course) can lead to instability in the air. Importantly, the straight, parallel, evenly spaced flight lines used for agricultural spraying are inherently similar to the collection of HSI data (see Figure 6).
Our design and fabrication of a solid plate to mount the HSI sensor in place of the liquid tank maintained the T30s center of gravity and thus the flight stability. In addition, we also incorporated a gimbal underneath a wire rope vibration isolator (Figure 8). The utility of gimbals with the associated vibration isolators have been shown in [2,45,46] in different hyperspectral systems. In contrast, hard mounting HSI systems to the airframe has shown to result in excessive noise in the imagery, affecting the geolocation and overall quality of the hyperspectral data cube [13]. The high-frequency angular effects found in multi-rotor UAVs, can generate image blurring in full frame sensors [11], and, in general, vibration in excess of 2.9 m/s2 results in a decrease in performance of the IMU (N. C. Moen, HySpex NEO, pers. comm.). Similarly, excessive and rapid changes in roll and/or pitch (due to an underperforming gimbal or no gimbal) have a profound impact on the quality of the georeferenced product. Therefore, similar to manned airborne systems, vibration isolators are required to reduce the aircraft-induced vibrations [47] and a gimbal to reduce the changes in attitude (as well as further reduce vibrations). In contrast to conventional passive isolators, the wire rope design provides isolation in all planes and orientations [48]. Not surprisingly, our results show a significant decrease in vibration with a reduction of 64.9% from the plate to the gimbal, and 88.6% from the plate to the sensor (total system isolation efficiency of 0.886), due to the bow-shaped supporting structure of the gimbal arm (see Figure 3 and Figure 8). The resultant transmissibility (~11.4%) of the vibration induced by the propellers from the plate to the sensor is within the acceptable range for non-critical applications [48].
Another reason the T30 is a suitable airframe for HSI sensors is that the shape and angle of incidence of the propellers were designed to achieve a specific downwash flow that minimizes spray drift, ultimately improving flight stability. These design and flight trajectory considerations result in smoother, more stable flight with slower heading changes and no rapid speed changes—essential for HSI pushbroom sensors to acquire raw imagery with less motion-induced noise. This flight stability aspect is supported by our results from the wind tunnel test. With RTK turned off during the test due to inference from the wind tunnel structure itself, the T30 hovered with less error (±0.5 m) compared to the stated hovering precision of 0.6 m relying on GNSS positioning only in the x- and y-directions for all wind speeds tested. The test ultimately revealed a higher SWT than specified by the RPAS manufacturer. We speculate that the 8 m/s SWT stated by the manufacturer is closely tied to the safety of agricultural spraying activities (i.e., to limit the drift of the droplets) rather than the technical limitations of the system. However, for safety and data quality, we recommend 7 m/s (25 km/hr, 13.6 kn) as the maximum wind speed for HSI data collection, with 0–5 m/s (18 km/hr, 9.7 kn) preferable, especially for targets easily swayed by the wind (e.g., vegetation) as per our experience with other RPAS HSI pushbroom systems [2].
Furthermore, because minimizing environmental contamination through precision spraying operations is one of the primary objectives of agricultural spraying drones, the T30 integrates RTK-assisted navigation, reducing the positional error of the drone to +/− 10 cm. However, despite the RTK-assisted navigation, one of the main challenges of operating the T30 for HSI is the lack of flexibility in the mission planning with the flight controller compared to others commonly used for RPAS (e.g., DJI Pilot 2). A thorough knowledge of Geographical Information Systems (GIS) software is needed to generate the input files for mission planning on the T30 controller. As has been our experience with other DJI flight controllers, over time, additional features are made available through firmware upgrades, and potentially, this will also be improved for the T30.
A key aspect of power management relates to the use of a DJI smart battery by the T30, which has safety features such as built-in monitoring of each battery cell by the flight controller (with information relayed to the pilot in real time) and a proprietary algorithm to calculate estimated battery percentage updated during flight (taking into consideration wind, payload, speed, altitude). When connected to a 9000 W (or greater) power source, the smart charger can fully charge a battery in under 15 min, which we theorize has the potential to increase the efficiency of HSI data collection significantly up to 15–20 hectares per day with only a 3-battery set. The example of the 2.25 ha (150 × 150 m) area shown in Figure 11 was acquired with a single battery. With a takeoff weight of 43.2 kg (55% of the MTOW) at a flight speed of 3.7 m/s, 1% battery charge was consumed over a distance of 18.5–22.6 m. At a speed of 6 m/s, 1% battery charge was consumed over a distance of ~40.8 m. However, these values are broad generalizations and would vary depending on several factors including the wind conditions, temperature, humidity, pressure, elevation, condition of the battery, condition of the RPAS, etc.
While the roll and pitch results are partially explained by the T30′s flight stability, they are predominantly due to the integration of the gimbal with a motor strength capable of steadying a heavy payload (Figure 12A,B). Our mean pitch and roll results are similar to those found in [2]; however, there is less variance throughout the data collection flight line compared to [13]. Experienced users of pushbroom sensors will notice, for example, in Figure 14A from our Rigaud test at 50 m AGL minimal attitude effects in the non-geocorrected image, resulting in distinct panel features with negligible distortions. However, despite the major benefits of the Aevo gimbal, the manufacturer is continuing to work on minimizing the drift (i.e., yaw) once the position of the gimbal is locked. For instance, under the operational data collection scenario at Mer Bleue, our results indicate a maximum heading deviation of 0.89° for a 160 m line according to the VS-620′s internal IMU (APX-15).
The direct geocorrection process implemented with the VS-620 considers the positional and attitude errors, generating geocorrected imagery. In comparison to a previously generated orthomosaic of the study area, validation showed an RMS error of 2.47 pixels and an inter-flight line misalignment of 1 to 3 pixels. Future improvement in the geocorrection process includes using the external IMU unit (Figure 3) during data collection, which will improve the positional error and the inter-flight line alignment.
Finally, regarding practical considerations related to HSI data collection operational aspects, the T30 has dual (i.e., front and back) First-Person View (FPV) cameras providing situational awareness (a feature missing from the Matrice 600 Pro and several other heavy-lift RPAS). Also, because the HSI sensor is operated separately from the RPAS, the pilot can focus on the RPAS mission, e.g., checking speed, altitude, heading, and on communication with the sensor operator.
The preliminary results specifically addressing the spectral quality based on the data acquired with our RPAS integration show minimal differences between the nominal reflectance targets captured with the VS-620 imagery (Figure 13), which is similar to previous findings with this sensor in [49] in a different region and under various illumination conditions. Furthermore, the spectral signatures shown in Figure 14 are capable of capturing fine spectral differences necessary to differentiate Sphagnum spp. mosses from vascular plants, which is a key aspect for monitoring peatlands and understanding how peatlands are responding to climate change and other anthropogenic effects [50].
While often seen as a hurdle, the regulatory requirements can also be seen as an opportunity for assessing the flight geography and robustness of the flight plan resulting in repeatable flights, assessment of the uncertainties and improvement of crew training requirements. To complete the integration flight tests (e.g., wind tunnel) and the operational HSI acquisition in this study, two different SFOCs were required. During the eight-month period between the two, new Standard Scenarios were released for the operation of RPAS > 25 kg (Table 1), facilitating the province-wide permission for operations in any air space class. Within a couple of years, new regulations are expected in Canada which would implement a weight class of ”medium” RPAS (>25 kg up to and including 150 kg) and facilitate VLOS operations, following among other requirements additional pilot and crew training and specific RPAS safety assurances [51]. Regulations are also constantly evolving elsewhere, and compliance with the training, RPAS capability and operational safety requirements offers an opportunity to develop larger scale HSI campaigns and promote innovation in a sector that has been stagnant for years. Over time, it is foreseeable that RPAS regulations similar to manned aviation may become more harmonized across countries with further facilitation of collaboration while reducing regulatory complexities.

5. Conclusions

The integration of an RPAS HSI system is a complex task and requires coordinated efforts from various expertise (e.g., design and fabrication, instrumentation, airworthiness) and scientists, who are often the final users of this technological implementation. Additionally, given the current size and weight of advanced hyperspectral sensors (4–7 kg) and complementary payloads such as the gimbal and HSI power source, regulations play a key role and should not be ignored. In our case, the SFOC from Transport Canada provides a framework that reinforces the safety of the operations not only for the operation participants but also taking into account potential incidents within or outside the operation. Within the operation, these may be related to RPAS power loss, environmental conditions such as temperature or human error, among others. A potential impact external to the operation such as a fly-away due to a command-and-control link failure requires a clear rapid action plan. A plan is also required for the automatic protection of the flight envelope due to human error. We encourage users of this or similar types of RPAS technologies to see the regulatory framework as an advantage, carefully addressing operational safety objectives to improve the safety and efficiency of their operations, rather than as an obstacle.
Beyond the fundamental aspect related to the regulations and safety, we show that a rigorous approach for the development of the RPAS HSI system integration allows us to collect hyperspectral data with low geometric and spectral errors and generate spectral data that show clear differences between the hollow and hummock vegetation at Mer Bleue. Our future work will focus on comparing field spectroscopy data to those acquired by our RPAS HSI system. Nonetheless, our preliminary assessment suggests that the spectral output from the RPAS system is more practical and informative than field spectroscopy, which is greatly limited in spatial coverage. For example, our study shows a hyperspectral data cube collected in only 7 min, covering an area of 2.25 ha, at 10 cm resampled pixel size with 390 spectral bands. From this relatively small area, more than 500,000 spectral points can be generated to assess hollow, hummock and other vegetation physiognomies. The same number of field spectra would require ~4.7 years to acquire.
Finally, because one of our research foci is the validation of spaceborne multiple and hyperspectral-derived EO products, our approach to HSI data collection aims to showcase best practices for planning and data collection. We recommend a way to characterize sky conditions (e.g., clear sky vs. overcast), at minimum, through the use of hemispherical sky photos, but recognize that this may be difficult to implement for some HSI operations. In addition, the use of well-calibrated near-Lambertian bright and dark targets is essential for the evaluation of the spectral output and provides a way to evaluate measurement uncertainties in more demanding applications. In our experience, developing a RPAS HSI flight plan with GIS software provides a more precise implementation in the field and takes advantages of high-precision systems, in our case the T30.

Author Contributions

Conceptualization, M.K., J.P.A.-M. and O.L.; methodology, J.P.A.-M., M.K., O.L., R.L., Y.C., J.G., A.M., L.C., H.B., I.B. and R.J.S.; data collection, J.P.A.-M., M.K., O.L., Y.C., J.G., H.B., R.J.S., L.G., M.B. and D.L.; formal analysis, J.P.A.-M., M.K., Y.C., H.B. and I.B.; resources, M.K., Y.C., H.B., G.L. and D.L.; data curation, J.P.A.-M., M.K. and Y.C.; writing—original draft preparation, J.P.A.-M. and M.K.; writing—review and editing, J.P.A.-M., M.K. and O.L.; project administration, J.P.A.-M. and M.K.; funding acquisition, J.P.A.-M. and M.K. All authors have read and agreed to the published version of the manuscript.

Funding

The purchase of the T30 was funded by the Natural Sciences and Engineering Research Council Canada (NSERC), grant number NSERC-RTI-2022-00281. Data collection at Mer Bleue were funded by SERCO/ESA project WP2150—Land Cal/Val: High latitude surrogate site.

Data Availability Statement

Data are not available yet but contact lead author if there is interest.

Acknowledgments

We thank Ronnie Liu, Evan Li, Endre Pletscher, Joanna Wang, Grant Hosticka, Ryan J. Mohr, Cindy Haughton, Trond Løke, Niels Christian Moen and Eirik Strømsheim for their assistance and information provided across various aspects of the implementation. We further thank Brendan Cottrell and Patrick Osei Darko for their field assistance at Mer Bleue. We extend our gratitude to four reviewers who provided comments to our manuscript.

Conflicts of Interest

The authors declare no conflict of interest.

Appendix A

Table A1. Main components of the SFOC application for an RPAS with a MTOW > 25 kg. Components with an * are of special interest to the acquisition of high-quality HSI including the calculation of uncertainties in the data and upscaling to airborne or spaceborne systems.
SectionMain ComponentsMain Subcomponents
RPAS Operation/Risk AssessmentConcept of Operations (CONOPS)Contact information
Purpose of operation
Operational requirements
Procedures and safety risks
Locations
Description of RPAS
How operation carried out
SORARPAS information
Operational volume *
Contingency volume
Application of GRC
Application of ARC
SAIL Determination
Adjacent airspace considerations
Detect And Avoid (DAA)
OSO Substantiation
Company Operations Manual (COM)
Safety planAviation safety
Public safety
Emergency contingency planAircraft loss airborne (fly-away)
Aircraft loss on ground
Minor personal injury
Battery failsafe
Operation in the interest of public goods
Risk mitigation of loss of control of RPAS trajectory
RPAS equipment and capabilityManufacturer performance declarationRPAS description
Description of modification from manufacturer’s declaration
Description if new RPAS in development
Color scheme and illumination
Command and Control System description
RPAS handoff methodology
Description of payloads
Fuel/energy sufficient for planned flight *
MaintenanceMaintenance manual
Maintenance schedule
Primary parts requirements maintenance/replacement
Maintenance logs
Person responsible for maintenance
Training
Applicant/Operator/PilotHow operation will be carried outOperation characteristics
Specific operation steps
Site survey *
RPAS manual
Crew certification and compliance
Pilot qualifications
Crew member fitness
Weather minima *
Separation and collision avoidance
Normal and emergency procedures
Air traffic control services coordination
Radio communication technology
Proof of liability insurance
Accident and incident reporting procedures

References

  1. Zarco-Tejada, P.J.; Guillén-Climent, M.L.; Hernández-Clemente, R.; Catalina, A.; González, M.R.; Martín, P. Estimating leaf carotenoid content in vineyards using high resolution hyperspectral imagery acquired from an unmanned aerial vehicle (UAV). Agric. For. Meteorol. 2013, 171–172, 281–294. [Google Scholar] [CrossRef]
  2. Arroyo-Mora, J.P.; Kalacska, M.; Inamdar, D.; Soffer, R.; Lucanus, O.; Gorman, J.; Naprstek, T.; Schaaf, E.S.; Ifimov, G.; Elmer, K.; et al. Implementation of a UAV–Hyperspectral Pushbroom Imager for Ecological Monitoring. Drones 2019, 3, 12. [Google Scholar] [CrossRef]
  3. Diruit, W.; Le Bris, A.; Bajjouk, T.; Richier, S.; Helias, M.; Burel, T.; Lennon, M.; Guyot, A.; Ar Gall, E. Seaweed Habitats on the Shore: Characterization through Hyperspectral UAV Imagery and Field Sampling. Remote Sens. 2022, 14, 3124. [Google Scholar] [CrossRef]
  4. Cao, J.; Liu, K.; Zhuo, L.; Liu, L.; Zhu, Y.; Peng, L. Combining UAV-based hyperspectral and LiDAR data for mangrove species classification using the rotation forest algorithm. Int. J. Appl. Earth Obs. Geoinf. 2021, 102, 102414. [Google Scholar] [CrossRef]
  5. Shi, Y.; Wang, T.; Skidmore, A.K.; Holzwarth, S.; Heiden, U.; Heurich, M. Mapping individual silver fir trees using hyperspectral and LiDAR data in a Central European mixed forest. Int. J. Appl. Earth Obs. Geoinf. 2021, 98, 102311. [Google Scholar] [CrossRef]
  6. Parsons, M.; Bratanov, D.; Gaston, K.J.; Gonzalez, F. UAVs, Hyperspectral Remote Sensing, and Machine Learning Revolutionizing Reef Monitoring. Sensors 2018, 18, 2026. [Google Scholar] [CrossRef] [PubMed]
  7. Chancia, R.; Bates, T.; Vanden Heuvel, J.; van Aardt, J. Assessing Grapevine Nutrient Status from Unmanned Aerial System (UAS) Hyperspectral Imagery. Remote Sens. 2021, 13, 4489. [Google Scholar] [CrossRef]
  8. Lu, B.; Dao, P.D.; Liu, J.; He, Y.; Shang, J. Recent Advances of Hyperspectral Imaging Technology and Applications in Agriculture. Remote Sens. 2020, 12, 2659. [Google Scholar] [CrossRef]
  9. Arroyo-Mora, J.P.; Kalacska, M.; Løke, T.; Schläpfer, D.; Coops, N.C.; Lucanus, O.; Leblanc, G. Assessing the impact of illumination on UAV pushbroom hyperspectral imagery collected under various cloud cover conditions. Remote Sens. Environ. 2021, 258, 112396. [Google Scholar] [CrossRef]
  10. Aasen, H.; Honkavaara, E.; Lucieer, A.; Zarco-Tejada, P. Quantitative Remote Sensing at Ultra-High Resolution with UAV Spectroscopy: A Review of Sensor Technology, Measurement Procedures, and Data Correction Workflows. Remote Sens. 2018, 10, 1091. [Google Scholar] [CrossRef]
  11. Nex, F.; Armenakis, C.; Cramer, M.; Cucci, D.A.; Gerke, M.; Honkavaara, E.; Kukko, A.; Persello, C.; Skaloud, J. UAV in the advent of the twenties: Where we stand and what is next. ISPRS J. Photogramm. Remote Sens. 2022, 184, 215–242. [Google Scholar] [CrossRef]
  12. Wallace, L.; Lucieer, A.; Malenovský, Z.; Turner, D.; Vopěnka, P. Assessment of Forest Structure Using Two UAV Techniques: A Comparison of Airborne Laser Scanning and Structure from Motion (SfM) Point Clouds. Forests 2016, 7, 62. [Google Scholar] [CrossRef]
  13. Lucieer, A.; Malenovský, Z.; Veness, T.; Wallace, L. HyperUAS—Imaging Spectroscopy from a Multirotor Unmanned Aircraft System. J. Field Robot. 2014, 31, 571–590. [Google Scholar] [CrossRef]
  14. Storch, T.; Honold, H.-P.; Chabrillat, S.; Habermeyer, M.; Tucker, P.; Brell, M.; Ohndorf, A.; Wirth, K.; Betz, M.; Kuchler, M.; et al. The EnMAP imaging spectroscopy mission towards operations. Remote Sens. Environ. 2023, 294, 113632. [Google Scholar] [CrossRef]
  15. Tanii, J.; Inada, H.; Tachikawa, T.; Kashimura, O.; Iwasaki, A.; Ito, Y.; Imatani, R.; Ikehara, K. On-Orbit Performance of Hyperspectral Imager Suite (HISUI); SPIE: Bellingham, WA, USA, 2022; Volume 12264. [Google Scholar]
  16. Shaik, R.U.; Periasamy, S.; Zeng, W. Potential Assessment of PRISMA Hyperspectral Imagery for Remote Sensing Applications. Remote Sens. 2023, 15, 1378. [Google Scholar] [CrossRef]
  17. Government of Canada. Canadian Aviation Regulations (SOR/96-433). Canadian Aviation Regulations (CARs) and Standards. Part IX—Remotely Piloted Aircraft Systems. Available online: https://tc.canada.ca/en/corporate-services/acts-regulations/list-regulations/canadian-aviation-regulations-sor-96-433 (accessed on 1 September 2023).
  18. Government of Canada. Civil Aviation Remotely Piloted Aircraft Systems Task Force. Application Guidelines for a Special Flight Operations Certificate for a Remotely Piloted Aircraft System (SFOC-RPAS). Available online: https://tc.canada.ca/en/aviation/reference-centre/advisory-circulars/advisory-circular-ac-no-903-001 (accessed on 1 October 2023).
  19. Federal Aviation Administration. United States Code 2023. PART 107—Small Unmanned Aircraft System. Available online: https://www.ecfr.gov/current/title-14/chapter-I/subchapter-F/part-107 (accessed on 1 October 2023).
  20. Federal Aviation Administration. Section 44807: Special Authority for Certain Unmanned Aircraft Systems. Available online: https://www.faa.gov/uas/advanced_operations/certification/section_44807 (accessed on 1 October 2023).
  21. European Union Aviation Safety Agency. Open Category-Civil Drones. Available online: https://www.easa.europa.eu/en/domains/civil-drones/drones-regulatory-framework-background/open-category-civil-drones (accessed on 1 October 2023).
  22. European Union Aviation Safety Agency. Standard Scenario (STS). Available online: https://www.easa.europa.eu/en/domains/civil-drones-rpas/specific-category-civil-drones/standard-scenario-sts (accessed on 1 October 2023).
  23. Turner, D.; Lucieer, A.; McCabe, M.; Parkes, S.; Clarke, I. Pushbroom hyperspectral imaging from an unmanned aircraft system (UAS)–geometric processing workflow and accuracy assessment. ISPRS Int. Arch. Photogramm. Remote Sens. Spat. Inf. Sci. 2017, XLII-2/W6, 379–384. [Google Scholar] [CrossRef]
  24. Inamdar, D.; Kalacska, M.; Arroyo-Mora, J.P.; Leblanc, G. The Directly-Georeferenced Hyperspectral Point Cloud: Preserving the Integrity of Hyperspectral Imaging Data. Front. Remote Sens. 2021, 2, 675323. [Google Scholar] [CrossRef]
  25. Mogili, U.M.R.; Deepak, B.B.V.L. Review on Application of Drone Systems in Precision Agriculture. Procedia Comput. Sci. 2018, 133, 502–509. [Google Scholar] [CrossRef]
  26. Wang, J.; Ma, C.; Chen, P.; Yao, W.; Yan, Y.; Zeng, T.; Chen, S.; Lan, Y. Evaluation of aerial spraying application of multi-rotor unmanned aerial vehicle for Areca catechu protection. Front. Plant Sci. 2023, 14, 1093912. [Google Scholar] [CrossRef]
  27. del Cerro, J.; Cruz Ulloa, C.; Barrientos, A.; de León Rivas, J. Unmanned Aerial Vehicles in Agriculture: A Survey. Agronomy 2021, 11, 203. [Google Scholar] [CrossRef]
  28. Goyens, C.; Vis, P.D.; Hunt, S.E. Automated Generation of Hyperspectral Fiducial Reference Measurements of Water and Land Surface Reflectance for the Hypernets Networks. In Proceedings of the 2021 IEEE International Geoscience and Remote Sensing Symposium IGARSS, Brussels, Belgium, 11–16 July 2021; pp. 7920–7923. [Google Scholar]
  29. Koirala, P.; Løke, T.; Baarstad, I.; Fridman, A.; Hernandez, J. Real-Time Hyperspectral Image Processing for UAV Applications, Using HySpex Mjolnir-1024; SPIE: Bellingham, WA, USA, 2017; Volume 10198. [Google Scholar]
  30. Barber, H.; Wall, A.; Kumar, S.; McKercher, R. RPAS Operator Guidance and Safety Assurance Tools for the Urban Environment–Phase III; National Research Council of Canada: Ottawa, ON, Canada, 2023. [Google Scholar]
  31. CEOS Working Group on Calibration and Validation Land Product Validation Subgroup. CEOS Land Validation Sites. Available online: https://lpvs.gsfc.nasa.gov/LPV_Supersites/LPVsites.html (accessed on 1 October 2023).
  32. Arroyo-Mora, J.P.; Kalacska, M.; Soffer, R.; Ifimov, G.; Leblanc, G.; Schaaf, E.S.; Lucanus, O. Evaluation of phenospectral dynamics with Sentinel-2A using a bottom-up approach in a northern ombrotrophic peatland. Remote Sens. Environ. 2018, 216, 544–560. [Google Scholar] [CrossRef]
  33. Inamdar, D.; Kalacska, M.; Darko, P.O.; Arroyo-Mora, J.P.; Leblanc, G. Spatial response resampling (SR2): Accounting for the spatial point spread function in hyperspectral image resampling. MethodsX 2023, 10, 101998. [Google Scholar] [CrossRef]
  34. Soffer, R.J.; Ifimov, G.; Arroyo-Mora, J.P.; Kalacska, M. Validation of Airborne Hyperspectral Imagery from Laboratory Panel Characterization to Image Quality Assessment: Implications for an Arctic Peatland Surrogate Simulation Site. Can. J. Remote Sens. 2019, 45, 476–508. [Google Scholar] [CrossRef]
  35. Richter, R.; Schlapfer, D.; Atmopsheric/Topographic Correction for Airborne Imagery. ATCOR-4 User Guide, Version 7.0.3. DLR/ReSe, Wessling, DLR-IB 565-02. 2019. Available online: https://www.rese-apps.com/pdf/atcor4_manual.pdf (accessed on 1 September 2023).
  36. Elmer, K.; Soffer, R.J.; Arroyo-Mora, J.P.; Kalacska, M. ASDToolkit: A Novel MATLAB Processing Toolbox for ASD Field Spectroscopy Data. Data 2020, 5, 96. [Google Scholar] [CrossRef]
  37. Jagatia, B.; Nallapu, R.T.; Linden, P. Validation for On-Orbit Demonstration of Glint Imagery Tasking. In AIAA SCITECH 2023 Forum; American Institute of Aeronautics and Astronautics: Reston, VA, USA, 2023. [Google Scholar] [CrossRef]
  38. Cawse-Nicholson, K.; Townsend, P.A.; Schimel, D.; Assiri, A.M.; Blake, P.L.; Buongiorno, M.F.; Campbell, P.; Carmon, N.; Casey, K.A.; Correa-Pabón, R.E.; et al. NASA’s surface biology and geology designated observable: A perspective on surface imaging algorithms. Remote Sens. Environ. 2021, 257, 112349. [Google Scholar] [CrossRef]
  39. Meister, G.; Knuble, J.J.; Chemerys, L.H.; Choi, H.; Collins, N.R.; Eplee, R.E.; Gliese, U.; Gorman, E.T.; Jepsen, K.; Kitchen-McKinley, S.; et al. Test Results From the Prelaunch Characterization Campaign of the Engineering Test Unit of the Ocean Color Instrument of NASA’s Plankton, Aerosol, Cloud and Ocean Ecosystem (PACE) Mission. Front. Remote Sens. 2022, 3, 875863. [Google Scholar] [CrossRef]
  40. Buschkamp, P.; Sang, B.; Peacocke, P.; Pieraccini, S.; Geiss, M.J.; Roth, C.; Moreau, V.; Borguet, B.; Maresi, L.; Rast, M.; et al. CHIME’s Hyperspectral Imaging Spectrometer Design Result from Phase A/B1; SPIE: Bellingham, WA, USA, 2021; Volume 11852. [Google Scholar]
  41. Bakken, S.; Henriksen, M.B.; Birkeland, R.; Langer, D.D.; Oudijk, A.E.; Berg, S.; Pursley, Y.; Garrett, J.L.; Gran-Jansen, F.; Honoré-Livermore, E.; et al. HYPSO-1 CubeSat: First Images and In-Orbit Characterization. Remote Sens. 2023, 15, 755. [Google Scholar] [CrossRef]
  42. Pellegrino, A.; Fabbretto, A.; Bresciani, M.; de Lima, T.M.A.; Braga, F.; Pahlevan, N.; Brando, V.E.; Kratzer, S.; Gianinetto, M.; Giardino, C. Assessing the Accuracy of PRISMA Standard Reflectance Products in Globally Distributed Aquatic Sites. Remote Sens. 2023, 15, 2163. [Google Scholar] [CrossRef]
  43. Naethe, P.; Asgari, M.; Kneer, C.; Knieps, M.; Jenal, A.; Weber, I.; Moelter, T.; Dzunic, F.; Deffert, P.; Rommel, E.; et al. Calibration and Validation from Ground to Airborne and Satellite Level: Joint Application of Time-Synchronous Field Spectroscopy, Drone, Aircraft and Sentinel-2 Imaging. PFG J. Photogramm. Remote Sens. Geoinf. Sci. 2023, 91, 43–58. [Google Scholar] [CrossRef]
  44. Pal, P.; Bhattacharyya, S.K. Slosh dynamics of liquid-filled composite containers—A two dimensional meshless local Petrov–Galerkin approach. J. Fluids Struct. 2013, 39, 60–75. [Google Scholar] [CrossRef]
  45. Gautam, D.; Lucieer, A.; Watson, C.; McCoull, C. Lever-arm and boresight correction, and field of view determination of a spectroradiometer mounted on an unmanned aircraft system. ISPRS J. Photogramm. Remote Sens. 2019, 155, 25–36. [Google Scholar] [CrossRef]
  46. Sankararao, A.U.G.; Kumar, N.T.S.; Rajalakshmi, P. Workflow and Calibration of Airborne Hyperspectral Imaging System. In Proceedings of the 2020 IEEE International Conference on Computing, Power and Communication Technologies (GUCON), Greater Noida, India, 2–4 October 2020; pp. 757–762. [Google Scholar]
  47. Skauli, T.; Haavardsholm, T.; Kåsen, I.; Arisholm, G.; Kavara, A.; Opsahl, T.O.; Skaugen, A. An Airborne Real-Time Hyperspectral Target Detection System; SPIE: Bellingham, WA, USA, 2010; Volume 7695. [Google Scholar]
  48. Balaji, P.S.; Rahman, M.E.; Moussa, L.; Lau, H.H. Wire rope isolators for vibration isolation of equipment and structures–A review. IOP Conf. Ser. Mater. Sci. Eng. 2015, 78, 012001. [Google Scholar] [CrossRef]
  49. Arroyo-Mora, J.P.; Kalacska, M.; Soffer, R.J.; Lucanus, O. Comparison of Calibration Panels from Field Spectroscopy and UAV Hyperspectral Imagery Acquired Under Diffuse Illumination. In Proceedings of the 2021 IEEE International Geoscience and Remote Sensing Symposium IGARSS, Brussels, Belgium, 11–16 July 2021; pp. 60–63. [Google Scholar]
  50. Salko, S.-S.; Juola, J.; Burdun, I.; Vasander, H.; Rautiainen, M. Intra- and interspecific variation in spectral properties of dominant Sphagnum moss species in boreal peatlands. Ecol. Evol. 2023, 13, e10197. [Google Scholar] [CrossRef] [PubMed]
  51. Government of Canada. Regulations Amending the Canadian Aviation Regulations (RPAS–Beyond Visual Line-of-Sight and Other Operations). Available online: https://gazette.gc.ca/rp-pr/p1/2023/2023-06-24/html/reg6-eng.html (accessed on 1 October 2023).
Figure 2. (A) CAD drawing illustrating the integration of the various components with the T30 as described in Table 3. The inset shows the underside of the plate with the gimbal connected to the vibration isolator. RPAS arms and propellers are not shown for clarity. (B) Final RPAS HSI integration during data collection at Mer Bleue.
Drones 07 00652 g002
Figure 3. Photographs of the vibration test setup: (A) data recorder unit, (B) sensor placed on top of payload plate, (C) one of the sensors placed on the S-620 replica, (D) T30 and S-620 replica with the sensors attached during the vibration test.
Drones 07 00652 g003
Figure 4. (A) Overview of the wind tunnel exit with the raised platform. (B) Closeup of the T30 hovering over the marked grids. The wind tunnel flow moves right to left exhausting the exit plane (x-direction). The streamwise component of the flow is oriented in the x-direction, with the cross-plane v- and w-components oriented in the y- (perpendicular to the flow) and z-direction (vertical component perpendicular to the flow), respectively.
Drones 07 00652 g004
Figure 5. Flight line and the 500 ft and 428 ft (100 ft + maximum altitude buffer) controlled ground buffers at the Rigaud test site, Quebec.
Drones 07 00652 g005
Figure 6. Map of the flight lines at Mer Bleue used to acquire HSI over the 2 ha polygon in support of satellite cal/val activities. Blue square in the inset shows the study area.
Drones 07 00652 g006
Figure 7. Nominal reflectance targets used for assessing radiometric quality of HSI data (VS-620). Inset shows SPN1 pyranometer and camera for hemispherical sky photos.
Drones 07 00652 g007
Figure 8. Vertical vibration (z-axis) shown in units of gravitational constant (g) and m/s2 across the four measurement locations: T30 platform affixed to the frame (ACC-1), gimbal arm (ACC-2), S-620 replica (ACC-3 and ACC-4). Vertical lines are shown at 12, 100 and 160 s. Inset table shows vibration in g at 100 and 160 sec across the four measurement locations as well the RMS.
Drones 07 00652 g008
Figure 9. Vertical (z-axis) vibration spectra across the four measurement locations: T30 platform affixed to the frame (ACC-1), gimbal arm (ACC-2), S-620 replica (ACC-3 and ACC-4). Vertical lines are shown at 9.6, 15 and 36 Hz.
Drones 07 00652 g009
Figure 10. Side-view photograph of the T30 in a stationary hover at the wind tunnel exit at a wind speed of 13.42 m/s.
Drones 07 00652 g010
Figure 11. Example mosaic of one of the 2.25 ha (150 × 150 m) effective imaging areas acquired at the Mer Bleue site. Pixels in the mosaic have been resampled to 10 cm during the geocorrection process.
Drones 07 00652 g011
Figure 12. Example attitude data from the IMU within the VS-620 for (A) pitch, (B) roll and (C) heading for the five flight lines acquired at Mer Bleue and used to generate the mosaic in Figure 11.
Drones 07 00652 g012
Figure 13. Spectra from the geometrically corrected and atmospherically compensated imagery acquired over the Spectralon panels at the Rigaud site at 50 m and 100 m AGL in comparison to in situ field spectra of the same panels (Figure 7). (A) 1% panel, (B) difference between image pixels and in situ spectra of the 1% panel, (C) 5% panel, (D) difference between image pixels and in situ spectra of the 5% panel, (E) 50% panel, (F) difference between image pixels and in situ spectra of the 50% panel. The A and B designations for the 50 m datasets indicate the two separate flights at that altitude.
Drones 07 00652 g013
Figure 14. Example of peatland hollow and hummock vegetation spectral response from the VS-620.
Drones 07 00652 g014
Figure 15. Example of non-geocorrected imagery from (A) 50 m AGL at Rigaud and (B) 100 m AGL at Mer Bleue.
Drones 07 00652 g015
Table 1. Summary of regulations in Canada, the United States and the European Union for overweight RPAS. We use the term ”overweight” for brevity to refer to RPAS with a weight greater than the maximum stipulated in the relevant regulatory frameworks for conventional RPAS operations. MTOW: maximum takeoff weight; MOTM: maximum takeoff mass; VLOS: visual line of sight.
LocationRegulatory Framework for Conventional RPAS OperationsConventional RPAS Operation Weight LimitRegulatory Framework for Overweight RPAS OperationsRequirements for Overweight RPAS Operations
CanadaPart IX (Remotely Piloted Aircraft Systems) of the Canadian Aviation Regulations (CARs) [17]MTOW of 25 kgSpecial Flight Operations Certificate (SFOC) (AC 903-002) [18]Specific Operational Risk Assessment (SORA) (AC 903-001) [18]
  • STS 001: VLOS in low-risk airspace for MTOW > 25–600 kg *
  • STS 002: VLOS in any airspace for MTOW > 25–150 kg *
United StatesTitle 14 of the Code of Federal Regulations Part 107 (14 CFR 107) ** [19]MTOW less than 55 lb14 CFR Part 11 and Title 49 United States Code (U.S.C.) § 44,807 *** [20]Special Airworthiness Certificate or Petition for Exemption on the public docket and Certificate of Waiver Authorization
European UnionA1, A2 and A3 subcategories of the Open Category [21]MTOM of 25 kgSpecific category or certified category
  • Light UAS operator certificate (LUC) or Authorization from National Aviation Authority (NAA) in which operator is registered or Through a Predefined Risk Assessment (PDRA) or SORA.
  • Declaration to NAA for operation under one of the European Standard Scenarios # (Appendix A to Regulation EU 2019/947) [22]
* As part of the Canadianized version of the JARUS SORA process, these standard scenarios are for specific common use cases. For these scenarios, a generic Operational Risk Assessment is carried out and results in a simplified application process. ** Part 107 license is distinct from the recreational TRUST certificate, 49 U.S.C. § 44,809 (Exception for limited recreational operations of unmanned aircraft). *** Does not include RPAS used for chemical spraying such as agricultural drones used for spraying fertilizer/pesticides/herbicides, etc., when weighing 55 lb or more they are operated under 14 CFR Part 91 and require exemption from several regulations in 14 CFR Parts 61, 91 and 137 and require an Agricultural Aircraft Operator Certificate (and Part 107 license). # Comes into effect on 1 January 2024 and will result in a more streamlined process compared to NAA authorization requests.
Table 4. Manufacturer-stated sustained wind tolerance (SWT) and the 16 increments of wind speed tested at the wind tunnel.
SWT (m/s)Tunnel Wind Speed (m/s)
85.0, 6.0, 7.0, 8.0, 9.0, 9.5, 10.0, 10.5, 11.0, 11.5, 12.0, 12.5, 13.0, 13.5, 14.0
Disclaimer/Publisher’s Note: The statements, opinions and data contained in all publications are solely those of the individual author(s) and contributor(s) and not of MDPI and/or the editor(s). MDPI and/or the editor(s) disclaim responsibility for any injury to people or property resulting from any ideas, methods, instructions or products referred to in the content.

