Article

Stability of Medicines Transported by Cargo Drones: Investigating the Effects of Vibration from Multi-Stage Flight

1
Faculty of Engineering and Physical Sciences, University of Southampton, Southampton SO17 1BJ, UK
2
Institute of Pharmaceutical Science, King’s College London, London SE1 9NH, UK
*
Author to whom correspondence should be addressed.
Drones 2023, 7(11), 658; https://doi.org/10.3390/drones7110658
Submission received: 2 October 2023 / Revised: 26 October 2023 / Accepted: 30 October 2023 / Published: 3 November 2023

Abstract

:
The timely distribution of medicines to patients is an essential part of the patient care plan, and maximising efficiency in the logistics systems behind these movements is vital to minimise cost. Before drones can be used for moving medical cargo, medical regulatory authorities require assurance that the transported products will not be adversely affected by in-flight conditions unique to each drone. This study set out to (i) quantify the vibration profile by phases of flight, (ii) determine to what extent there were significant differences in the observed vibration between the phases, and (iii) assess the quality of flown monoclonal antibody (mAb) infusions used in the treatment of cancer. Vibrations emanating from the drone and transmitted through standard medical packaging were monitored with the storage specifications for mean kinematic temperature (2–8 °C) being met. Vibration levels were recorded between 1.5 and 3 g, with the dominant octave band being 250 Hz. After 60 flights, the quality attributes of flown infusions regarding size integrity were found to be no different from those of the control infusions. For example, the particle size had a variation of less than 1 nm; one peak for Trastuzumab was 14.6 ± 0.07 nm, and Rituximab was 13.3 ± 0.90 nm. The aggregation (%) and fragmentation (%) remained at 0.18 ± 0.01% and 0.11 ± 0.02% for Trastuzumab, 0.11 ± 0.01% and 2.82 ± 0.15% for Rituximab. The results indicated that in the case of mAbs, the quality assurance specifications were met and that drone vibration did not adversely affect the quality of drone-flown medicines.

1. Introduction

Drones or uncrewed aerial vehicles (UAVs) have seen increasing use in medical logistics over recent years, with many operations being established in countries where the existing road infrastructure hampers the timely delivery of blood units and pathology samples between clinics, consolidation hubs, and analysis laboratories [1,2]. The majority of these services have centred around low-volume/weight cargoes that have to be transported according to strict time windows (e.g., pathology samples for analysis, aseptic medicines, medicines, and blood for transfusion [1]). Zipline has one of the most extensive commercial operations where they manage the blood logistics across Rwanda and Ghana, in the case of the former, reportedly servicing 350 health facilities from two distribution centres, with each delivery arriving within 45 min of the order being placed [3]. Despite the reported journey-time benefits, the Ghanaian government estimated that each delivery cost USD 17 [3] but has significantly reduced blood wastage over the previous land-based service [4].
Commercial medical logistics services involving UAVs in countries with advanced economies are still largely in their infancy, primarily due to the lack of airspace management protocols that allow crewed and uncrewed aircraft to be effectively managed together in shared airspace [5,6]. More recently, in north-east England (UK), Apian, in association with Skyports, have trialled a drone service linking Wansbeck General Hospital to Alnwick Infirmary/Berwick Infirmary with the intention of flying aseptic medicines and pathology [7]. Windracers have undertaken trial flights of their ULTRA fixed-wing drone between Lee-on-Solent and Binstead (Isle of Wight), 2020 [8], and the Isles of Scilly (2020) [8,9]. Skyports have trialled a VTOL drone (the Kookaburra by Swoop Aero) for transporting COVID-19-related medical supplies between National Health Service (NHS) facilities in the Argyll and Bute region of Scotland, reportedly reducing delivery times from 36 h to 15 min [10].
Developing drone medical logistics services beyond proof-of-concept trials has been slow in the UK, primarily due to the strict airspace legislation that dictates that beyond-visual-line-of-sight (BVLOS) flying can only take place under temporarily restricted flight corridors termed ‘Temporary Danger Areas’ (TDAs) [6]. Furthermore, data relating to the stability of any drone-transported medicine are required, showing that throughout the flight, good distribution practice has been maintained. Medicines regulators, for example, the UK Medicines & Healthcare Regulatory Agency, MHRA, require evidence that the quality of medicines and medical products are not adversely affected by transport and distribution [11,12].
In medical logistics, drones have a potential advantage over ground-based modes in terms of reducing transit times, particularly where the topography is challenging and road networks are sparse [13]. Patient diagnostic sample collections, blood stocks for transfusion and aseptic medicine delivery have all been identified as key activities where small load sizes and time-dependent delivery windows lend themselves to drone transportation [14]. In the case of the latter, the NHS within the UK spends approximately USD 3.8 billion per annum [1] manufacturing bespoke medicines for patients based on their height and weight [2], which typically have a shelf-life measured in hours and, therefore, require timely delivery [15]. Of particular interest in this study are Monoclonal Antibodies (mAbs), used in the treatment of haematology and non-haematology diseases and bespoke made for each patient [16].
Cancer remains a significant global health concern, with certain types of monoclonal antibodies having revolutionised the treatment by targeting specific proteins associated with these malignancies. For example, Trastuzumab targets cancers with overexpressed human epidermal growth factor 2 (HER2), including breast, stomach, and gastroesophageal junction cancers [17], whereas Rituximab targets the CD20 antigen associated with B-cell non-Hodgkin’s Lymphoma (NHL) [18]. These cancers are more prevalent in older populations [19,20], who often face challenges accessing cancer care due to limited healthcare facilities and reduced mobility. UAVs potentially offer more rapid and efficient transportation, minimising delays in treatment initiation and improving patient adherence to therapy. Inefficiencies caused by unreliability in the logistics system have also been reported where aseptic medicine manufacturing units are situated far from administration points, leading to wastage [21,22]. In the case of island communities, where several different modes (e.g., van-ferry-van) are required to complete the delivery between consignor and consignee, 7% of delivered treatments per month have been reported wasted at a typical value of GBP 1860 per treatment [23,24,25]. This can be further exacerbated by last-minute changes to the patient’s treatment plan, which means that medications have to be altered [26].
The Medicines and Healthcare Products Regulatory Agency set out the requirements for how aseptic medicines must be transported in the UK to ensure health and safety and product quality [11]. These state that the product must be contained within multi-layer packaging with strict adherence to set temperature criteria during transit [27,28]. Less well-understood are the implications of vibration on medical cargo arising from the transport modes themselves [9,29], whereas in rotary-wing drones, significant vibration above 100 Hz has been observed during flight [30]. It is important to understand any negative implications on the quality of flown treatments arising from such conditions and whether the levels of vibration would degrade medicines, inducing conformational changes that would reduce their effectiveness [31].
Certain types of vibration can affect protein and cause aggregates to form in mAbs, resulting from exposing the protein to hydrophobic surfaces [4]. ‘Shake-and-stir’-induced aggregation has been widely studied, and Cetuximab cancer treatment has been observed to aggregate under such specific conditions [32,33]. Stirring and shaking studies have also demonstrated that mAbs can be chemically modified as a result (e.g., oxidation), leading to medicine degradation [34]. Being protein-based therapeutics, mAbs can be structurally unstable when exposed to thermal, chemical, or physical stressors and, therefore, have the greatest potential to be adversely affected by vibration [33]. These studies provide insight into the mechanisms for the modification of mAbs; however, the nature of the stirring and shaking deployed does not accurately reflect the vibration environment during drone flight. To the authors’ knowledge, no such trials carrying mAbs or other biopharmaceuticals have been undertaken to date. Some trials have taken place which have attempted to quantify these conditions with insulin samples remaining stable when flown in vertical take-off and landing (VTOL) and fixed-wing drones [9]. Specifically related to mAbs, Zhu et al. [25] used expired treatments (Bevacizumab, Trastuzumab, and Rituximab) flown by a Mugin V50 VTOL drone inside instrumented Versapaks to quantify the impacts of flight on the quality of the medicines. The results suggested that vibration occurred above 44 Hz, consistent with rotor speeds and varied significantly in amplitude depending on the phase of flight, where transition (from either vertical to horizontal flight or vice versa) resulted in greater vibration compared to horizontal flight. Despite this, no significant differences were observed in the aggregation and fragmentation of all the flown mAbs, implying that their structural integrity was maintained. These flights were very short in duration, and involved no complex manoeuvres, of the type that may be required for routine deliveries.
Of the few trials that have been undertaken where mAbs have been flown by drone, none appear to have quantified the impacts of flight for a sustained period of time, or identified the vibration conditions resulting from the different stages of flight that might negatively impact medicine quality. Of particular interest in this research and its overarching aim was to quantify the vibration resulting from the seven phases of flight (take-off, ascent, cornering, straight flights, cornering, decent, and landing) from a VTOL drone and over many replicates, and subsequently determine whether the quality of a series of different mAbs was compromised as a result.
The core objectives and related work packages for the investigation reported in this paper were:
  • Undertake sufficient repetitions of the flight to obtain a statistically significant vibration data set.
  • Develop a methodology to statistically identify significant variations in vibration data, including within segments of the flight.
  • Quantify the impact on the safety and quality of oncology treatments due to vibrations emanating from drone transportation using a flight trial involving redundant oncology treatments.

2. Materials and Methods

The methodology used in this study builds on previous trials undertaken by the authors [9,25]. Monoclonal antibody samples were flown in a multi-copter drone while vibration profiles were recorded for the full duration in three translational directions using accelerometers located both within the payload and on the airframe. Full details of the instrumentation are provided in Section 2.2 (below).
The medicines that were selected for flight testing were chosen due to the availability of redundant (i.e., expired, waste) stocks from St. Mary’s Hospital, Isle of Wight, with a similar concentration and expiry date. To evaluate quality, pharmacopeial methods were applied to the drone-transported mAb infusions following NHS-recommended protocols for biopharmaceuticals [35], as detailed in Section 2.2.
The trial comprised 60 flights grouped into six routines, where the payload was varied to expose the samples to a range of flight durations between 2 min 10 s and 3 min 4 s. The medicines that made up each sample set are listed in Table 1. The flight routines that sample sets were subjected to are listed in Table 2, and each routine comprised either 12 or 6 flights, as also specified in Table 2. Altering the payload in this way varied the exposure duration of each sample set.

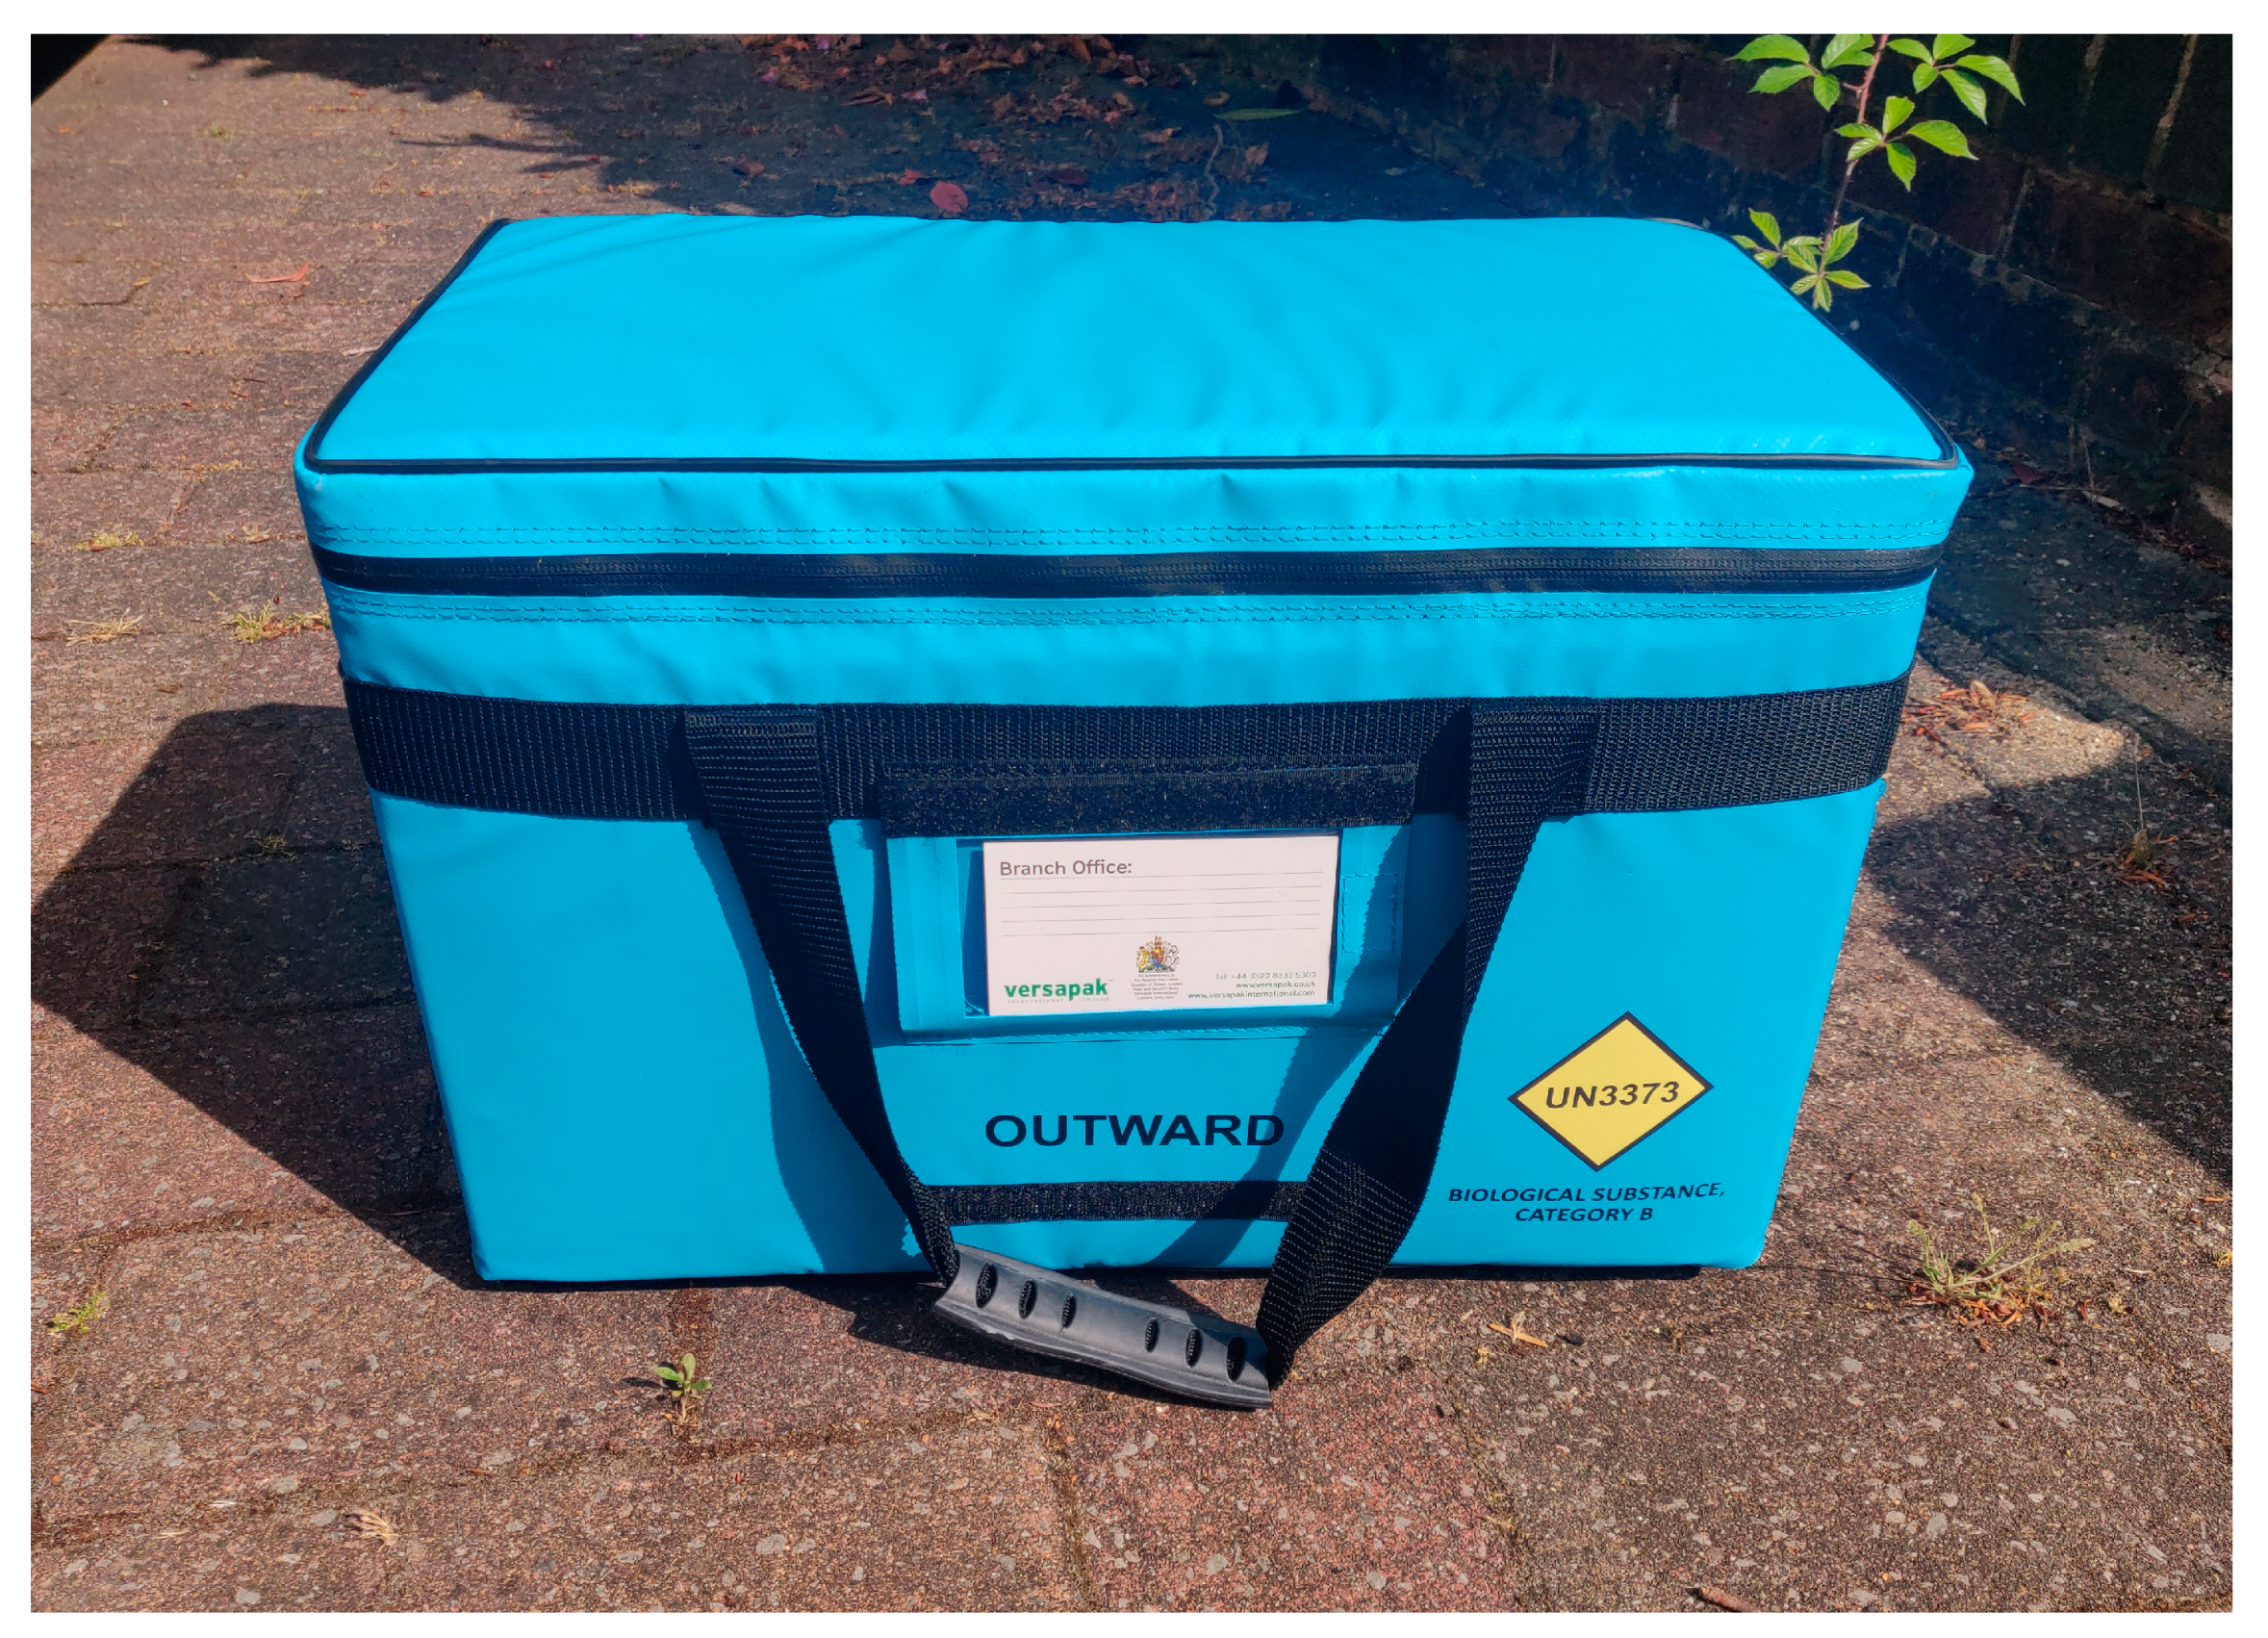
2.1. Containment Packaging

All sample sets for each flight were packed inside a medium Versapak, shown in Figure 1. The approximate dimensions of the carrier are 46 cm × 26 cm × 31 cm, and its mass when unloaded was 2.5 kg. Such packaging is commonly used by the NHS to transport cytotoxic cancer treatments, pathology samples, and other products that require temperature control. Two cool packs were used to maintain a chilled temperature (2–8 °C). Cool packs were preconditioned in a freezer for a minimum of 24 h prior to trial. They were wrapped in bubble wrap and sealed to avoid direct contact with the samples in line with current clinical practice [36].

2.2. Instrumentation

Vibration and temperature levels were recorded for the duration of the trial. Temperatures within the flight bag were recorded with a NIST Certified TRACEABLE Sentry Thermometer with a bullet probe. Temperatures within the non-flown control box were recorded with a NIST Certified Traceable® Excursion Trac temperature logger with two glycol bottle probes. The thermometer records the minimum and maximum temperature at one-minute intervals. During the two days, the minimum recorded temperature was 1.24 °C, and the maximum was 6.21 °C. Whilst a minor excursion from the industry-required 2–8 °C range was recorded, the mean kinematic temperatures (MKT) remained within the acceptable threshold (Table 3), meaning it was unlikely that the variations in temperature caused damage to the samples.
Vibration signals were recorded using triaxial MEMS data logging accelerometers (Axivity AX6, axivity.com). All sensors were set to sample at 1.6 kHz with a range of ±16 g. Sensors were mounted in central and off-centre positions on the cargo hold floor and directly on the airframe. A sensor was also mounted inside the Versapak, underneath the sample, to provide a reference for the input vibration to the sample. The sensor positions are shown in the images in Figure 2.

2.3. Current Regulations

2.3.1. MHRA mAbs Regulation

In accordance with the European Union Good Distribution Practice (GDP) Guidelines from 2013 [37] and the UK Medicines and Healthcare Regulatory Agency (MHRA) Green Guide of 2022 [11], the management of medicine transportation focuses on the packaging and temperature control of all refrigerated deliveries. Since the shipping of mAb products is not explicitly addressed in good distribution practice (GDP), it must be managed on a case-by-case basis following the safety data sheet.
In contrast to certain traditional cytotoxic medications, mAbs either do not meet hazardous drug criteria or lack sufficient agent-specific information to determine an appropriate hazard classification [38]. Medications which are recognized as dangerous goods (DG) or controlled drugs (CD) are subject to specific transportation regulations [28] like the United Nations Recommendations on the Transport of Dangerous Goods (UNRTDG), International Air Transport Association Dangerous Goods Regulations (IATA-DGR), or International Maritime Dangerous Goods Code (IMDG-Code) [39]. As there is limited evidence available concerning health and safety risks associated with mAb exposure, conventional cold chain transit practices are typically adhered to. It is essential to note that mAbs linked to cytotoxic agents or radioisotopes should be considered hazardous, and their preparation and administration should adhere to established cytotoxic safe handling precautions or regulations for radiopharmaceuticals.
The National Patient Safety Age”cy (’PSA) 20 approach should be applied to assess the remaining mAbs, and the product should be re-evaluated in terms of low, medium, or high preparation process risk [38]. It is important to recognize that the risk may vary depending on the application or concentration, for instance, the preparation of a Trastuzumab intravenous infusion versus use for subcutaneous administration. Langford et al. [40] conducted a health and safety risk assessment of each mAb in current use with the NPSA risk assessment tool.
The distribution chain for medicinal products can be complex, often involving various storage facilities, wholesalers, and modes of transport before reaching the patient. For instance, St. Mary’s Hospital on the Isle of Wight receives shipments from the Portsmouth Manufacturing Unit (PMU) via taxi–hovercraft–taxi or refrigerated van–ferry–refrigerated van from more distant aseptic units.
Validated temperature probes and ice blocks (e.g., MediCool MC15) are commonly used in conjunction with sealed polyolefin/polyamide infusion bags that incorporate two additional layers for light and leak protection. Pharmacists perform document verification, including product specification sheets and medication lists, while simultaneously conducting visual inspections. The primary packaging method often employs cardboard boxes with a usable volume of approximately 28 L. Our research involved the use of a Versapak, which not only generated temperature stability data meeting MHRA standards but also offered extended usability and enhanced protection against accidental drops.

2.3.2. Drone Operational Guidance

Civil Aviation Authority (CAA) guidance CAP 722 [41] provides full details of the policy and guidance in relation to the operation of UAS to assist in compliance with the applicable regulatory requirements in the UK. The nature of medical deliveries means that it may be necessary to carry goods classified as dangerous. CAA guidance CAP 2248 [42] explains the requirements for UAS to carry dangerous goods. Most notably, operations to carry dangerous goods may be carried in a specific category, provided it is established that operations do not pose a high risk for third parties in the case of an accident. If a high risk is posed, they must be carried in line with the certified category.
In addition to the CAA guidance, dangerous goods must also be packaged and carried in accordance with the relevant packing instructions, e.g., pathology samples, which are classified as Category B biological substances, must be packed in accordance with UN3773 and PI 650 [43,44].
Finally, it may be necessary for dangerous goods to be carried in a crash-proof container approved in accordance with Vehicle Certification Agency (VCA) procedure, e.g., crash-protected containers for dangerous goods carried by remotely piloted aircraft systems [45].

2.4. Medicine Analyses

On return to the laboratory, the stressed samples were analysed for subvisible particulate matter by dynamic light scattering (DLS) and size homogeneity by size exclusion high-performance liquid chromatography (SE-HPLC). The concentration (1.5–2.5 mg/mL) of all Trastuzumab samples was adjusted to 1.5 mg/mL before analysis, with the exception of the ‘Medicine Sample Set 1’ (~1.3 mg/mL) analysis to reduce the number of samples that required additional dilution. All methods used were considered as reference methods in the stability assessment of biopharmaceutical products (ICH Q5C and Q5E, NHS Standard Protocol for Deriving and Assessment of Stability). They were also validated for detectability by temperature/pH/vibration forced denatured analysis. The operational conditions of both are provided below (Table 4 and Table 5).
DLS running on Malvern ZetaSizer NanoZS90, Malvern Panalytical Ltd., Malvern, UK, was used to track the hydrodynamic diameter of protein and aggregates between 0.3 nm and 10,000 nm and the polydispersity index (PDI). A deviation greater than 1 nm from the hydrodynamic diameter of the representative population of the mAbs was considered to be out of specification (OOS). Similarly, the occurrence of another population with an intensity percentage greater than 10% was also considered OSS. The population was considered monodisperse when the PDI was ≤0.1.
Aggregation (also known as high molecular weight species, HMWS) or fragmentation (also known as low molecular weight species, LMWS) of monoclonal antibodies was determined by SE-HPLC. An Agilent 1260 series HPLC system with a UV-Vis detector was used for this analysis. Agilent AdvanceBio SEC 300 Å, 4.6 × 150 mm, 2.7 µm filled with sub–3 µm particles (PL1580-3301) attached with a guard column: Agilent AdvanceBio SEC 300 Å, 4.6 × 50 mm, 2.7 µm (PL1580-1301), operated within the HPLC equipment. Samples were filtered through a 0.2 µm PES filter before testing. According to the NHS standard protocol for biopharmaceutical stability [12], the maximum acceptance criteria should be a 5% loss in active protein (ideally much lower than this) and a maximum of 2% relative to the main peak increase in any degradant peaks.
All data were presented as mean ± Standard Deviation (SD). The statistical significance of differences between groups was determined by one-way analysis of variance (one-way ANOVA) tests and Student’s t-tests (two-tailed). The results were considered to be significant when the value of p was <0.05. Figures were produced by GraphPad Prism™ version 9.5.1 (GraphPad software, San Diego, CA, USA).

2.5. Vibration Analyses

Detailed analysis of the recordings from the triaxial accelerometers was undertaken. Overall vibration levels detailed in the results were root mean square (RMS) values, calculated as the standard deviation of the magnitude of the resultant acceleration vector (i.e., the square root of the sum of the variances of the signals in the three orthogonal directions, r = ( σ x 2 + σ y 2 + σ z 2 ) .
Octave band spectra were synthesised by first computing the narrowband spectra and summing them in each octave band. Flight data, including the power data from this analysis, were taken from the drone and synchronised to the triaxial acceleration sensors to enable the various stages of flight to be accurately identified (take-off, ascent, corner, straight flights, corner, decent, and landing) and the associated implications on vibration were assessed.
To quantify the variation in vibration during each phase of flight, all recordings associated with flights on day two were divided into seven segments as defined below in Figure 3 and Figure 4. Day 2 flights were selected to ensure the route was as similar as possible in every flight, as the route was consistent all day, and the wind direction did not change significantly. The segments to be compared were defined by the waypoints programmed via the autopilot. The raw vibration data were divided into these segments using the timestamp of the waypoints to identify the required segment of data from the full vibration recordings. For every segment of all 36 flights selected, the resultant overall RMS vibration was calculated. To determine if there was a significant difference in the mean value for vibration on each segment, an analysis of variance (ANOVA) test was performed. A standard one-way ANOVA was undertaken to test the null hypothesis that there are no significant differences between the means of each segment of the flight. However, when this test was undertaken, the residual values were not normally distributed, invalidating the analysis. To overcome this, a non-parametric test was required, and a Kruskal–Wallis analysis of variance was selected.

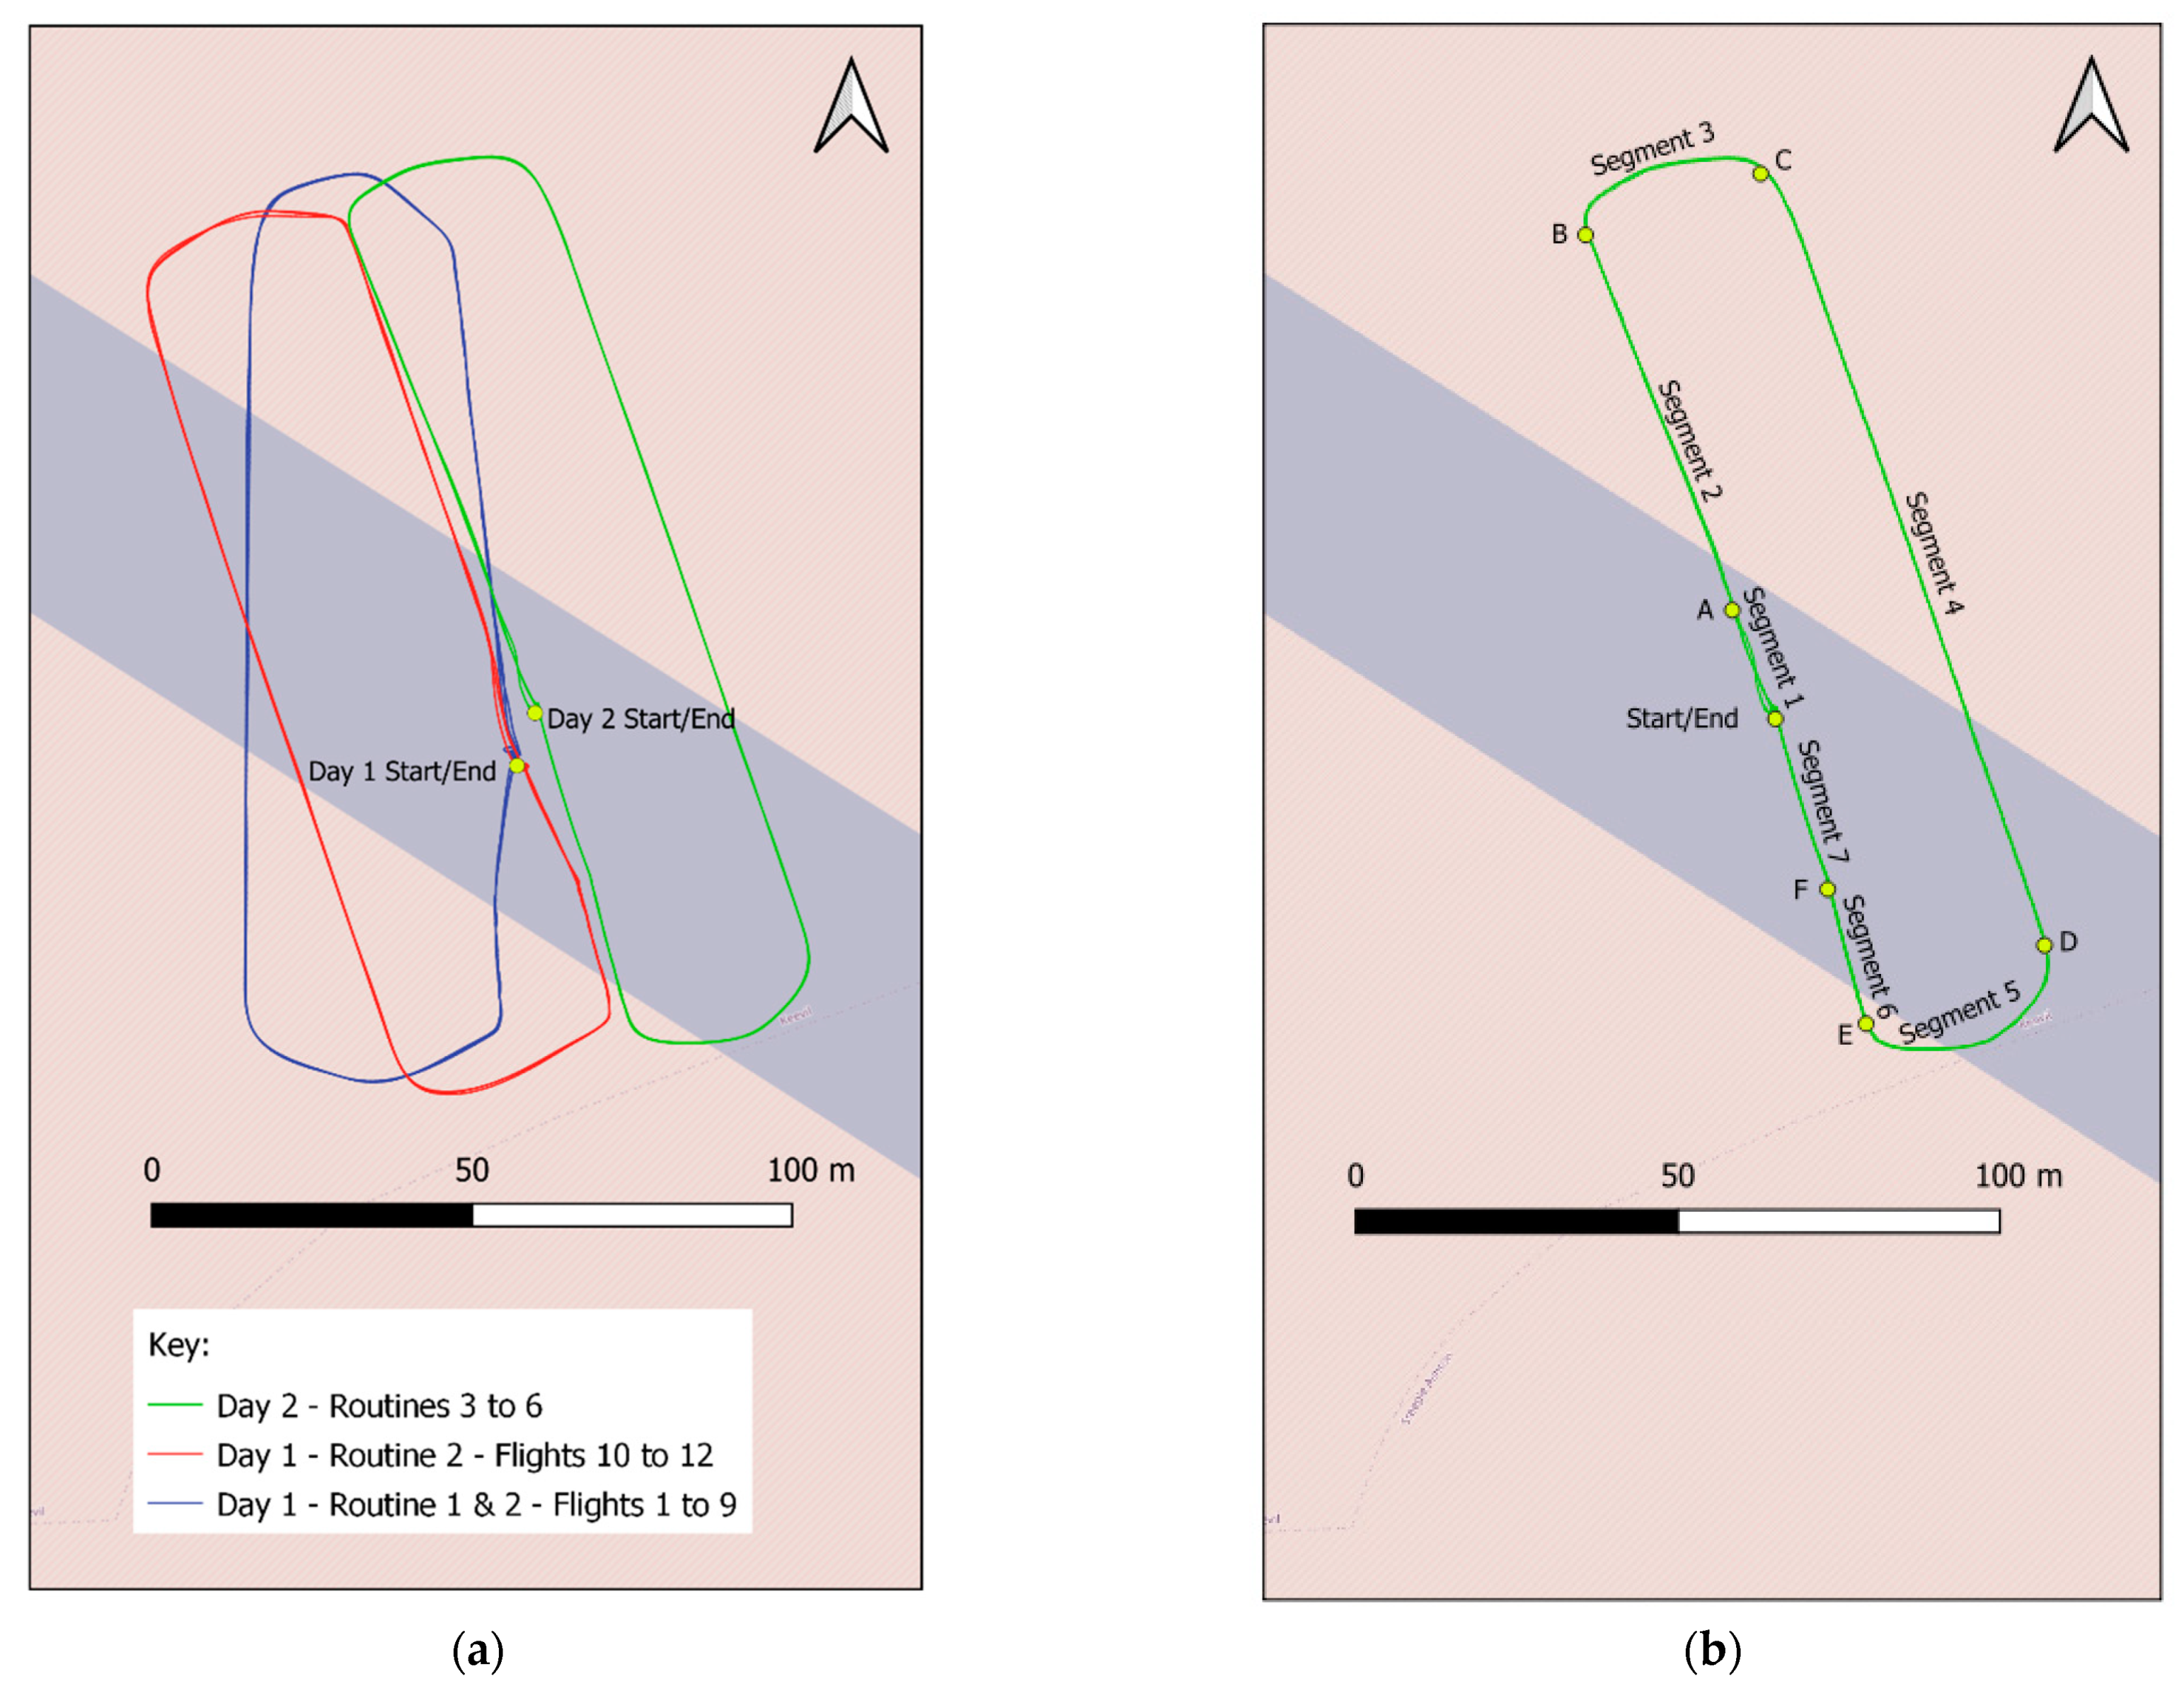
2.6. Test Platform Specifics

The drone used in this test was a modified Plymouth Rock X1 (https://www.plyrotech.com/products/x1/ (accessed on 12 June 2023) multi-copter platform (Figure 5) with a maximum payload capacity of 7 kg.
Based on previous work, vibration during landing and take-off may have the greatest potential impact on cargo stability [25]. To facilitate the investigation of variability over these stages of flight, a relatively large number of short flights were explored. A 330 m circuit was chosen, which was adjusted slightly twice over the two days of testing to suit weather and ground conditions. The three circuits, shown in Figure 3a, aligned with the prevailing wind direction (Day 1—North moving to North East, Day 2—North East) such that cross winds were minimised. Sixty flights were made in total. The corresponding vertical profile is shown in Figure 4.
This proposed methodology was designed to reflect the clinical scenario in which a drone is used for a range of short flights between a hospital campus and local clinics in close proximity and potentially to patients’ homes in the future.

3. Results and Discussion

3.1. Vibration Analysis

Frequency analysis was performed on vibration data taken from all sensors onboard the drone for all 60 flights. The airframe vibration profile during one representative flight is characterised by the spectrogram shown in Figure 6. The spectrogram shows the acceleration in the × (forward), Y (lateral), and Z (vertical) directions as a function of time for the duration of the flight. The colour shows the corresponding magnitude of vibration on a dB scale with an arbitrary reference. The yellow striations indicate the predominant frequency components of vibration, which occur at multiples of approximately 130 Hz. Small variations in these striations across the duration of the flight signify changes in motor speed and, consequently, frequencies of vibration.

3.1.1. Time Domain Analysis

The data from several sample flights were segmented as described in Section 2.4 to facilitate comparison. Previous flight analysis undertaken as part of earlier studies indicated that vibration from aircraft vertical take-off and landing (VTOL) was found to be generally greater during periods of transition from vertical take-off to horizontal flight mode; this correlated with periods of greatest combined motor thrust [25]. The behaviour in this trial is not so clear. Due to the nature of the multi-copter drone, there is no stationary transition as with a VTOL drone, so this transition occurs during an ascent and descent, as defined in Figure 4. It can be seen that in some flights within this trial, the maximum resultant RMS vibration occurred during this ascent and descent, Day 1-Routine 2-Flight 12. This behaviour can be seen in Figure 7, however, this trend was not consistent across all flights in this trial. For example, during the flight corresponding to the median overall RMS value, Day 2-Routine 4-Flight 10 (Figure 7), the highest levels of RMS vibration occurred during a straight flight in contradiction to previous findings and other flights as explained above.
This variation in RMS vibration profiles for different flights was suspected to be due to changes in weather conditions. Wind speed, wind direction, and orientation of the test circuit varied between day 1 and day 2; however, due to an absence of localised weather data, it was not possible to determine a correlation between weather and RMS vibration level.
It was proposed that power usage could be used as an indicator of weather and that the faster the wind, the more power was required to maintain the speed and stability of the drone, increasing vibration levels as a result. For example, a stronger tailwind will decrease power usage, whereas a stronger headwind will increase power usage. Thus, power usage may be a direct measure of the impact of wind speed and direction. However, an initial assessment of the power data recorded by the drone compared with vibration data showed there was not a significant correlation. Further investigation is being considered for future work into this relationship.

3.1.2. Frequency Domain Analysis

Figure 8 shows power spectral densities (PSDs) of airframe acceleration in the X, Y, and Z directions, as well as the resultant for an example flight. It can be seen from the PSDs that below approximately 50 Hz, vibration is negligible. The fundamental excitation frequency varies between 65 and 85 Hz, with a strong harmonic at approximately 130–170 Hz.
The minimum, average, and maximum RMS acceleration values on the airframe and within the Versapak over all 60 flights are shown in Table 6.
The transmission of vibration from the drone airframe to the medical packaging was quantified by subtracting the PSD of vibration within the Versapak from the PSD of the airframe, where both are expressed in dB. This difference in dB is equivalent to expressing their ratio. The transmission ratios from the cargo hold floor of the Plymouth Rock X1 drone to the Versapak are shown in Figure 9.
For all frequencies above 20 Hz, the vibration was found to be lower than the airframe. Below this level, vibration is slightly amplified within the Versapak. This behaviour is consistent with previous trials undertaken with a Versapak [9,25], although the frequency at which isolation occurs is lower. This improved performance at lower frequencies is thought to be due to the greater mass of the packaged product and the nature of the cargo hold/payload mounting of the drone in this study. The limit of acceptable vibration and the ability of existing packaging to isolate vibration will be dependent on the susceptibility of the medical product. No such limits or supporting data have yet been published in the literature to the authors’ knowledge.
Figure 10 shows the average resultant vibration level for all 60 flights in the form of octave spectra for both the airframe and within the Versapak. It was found that the dominant frequency of the airframe was the 250 Hz band; this is presumed to be due to contributions from the individual motors with varying speeds and the motors operating between 50% and 80% throttle. The results also demonstrated the effectiveness of the Versapak in isolating vibration across all investigated frequency bands.

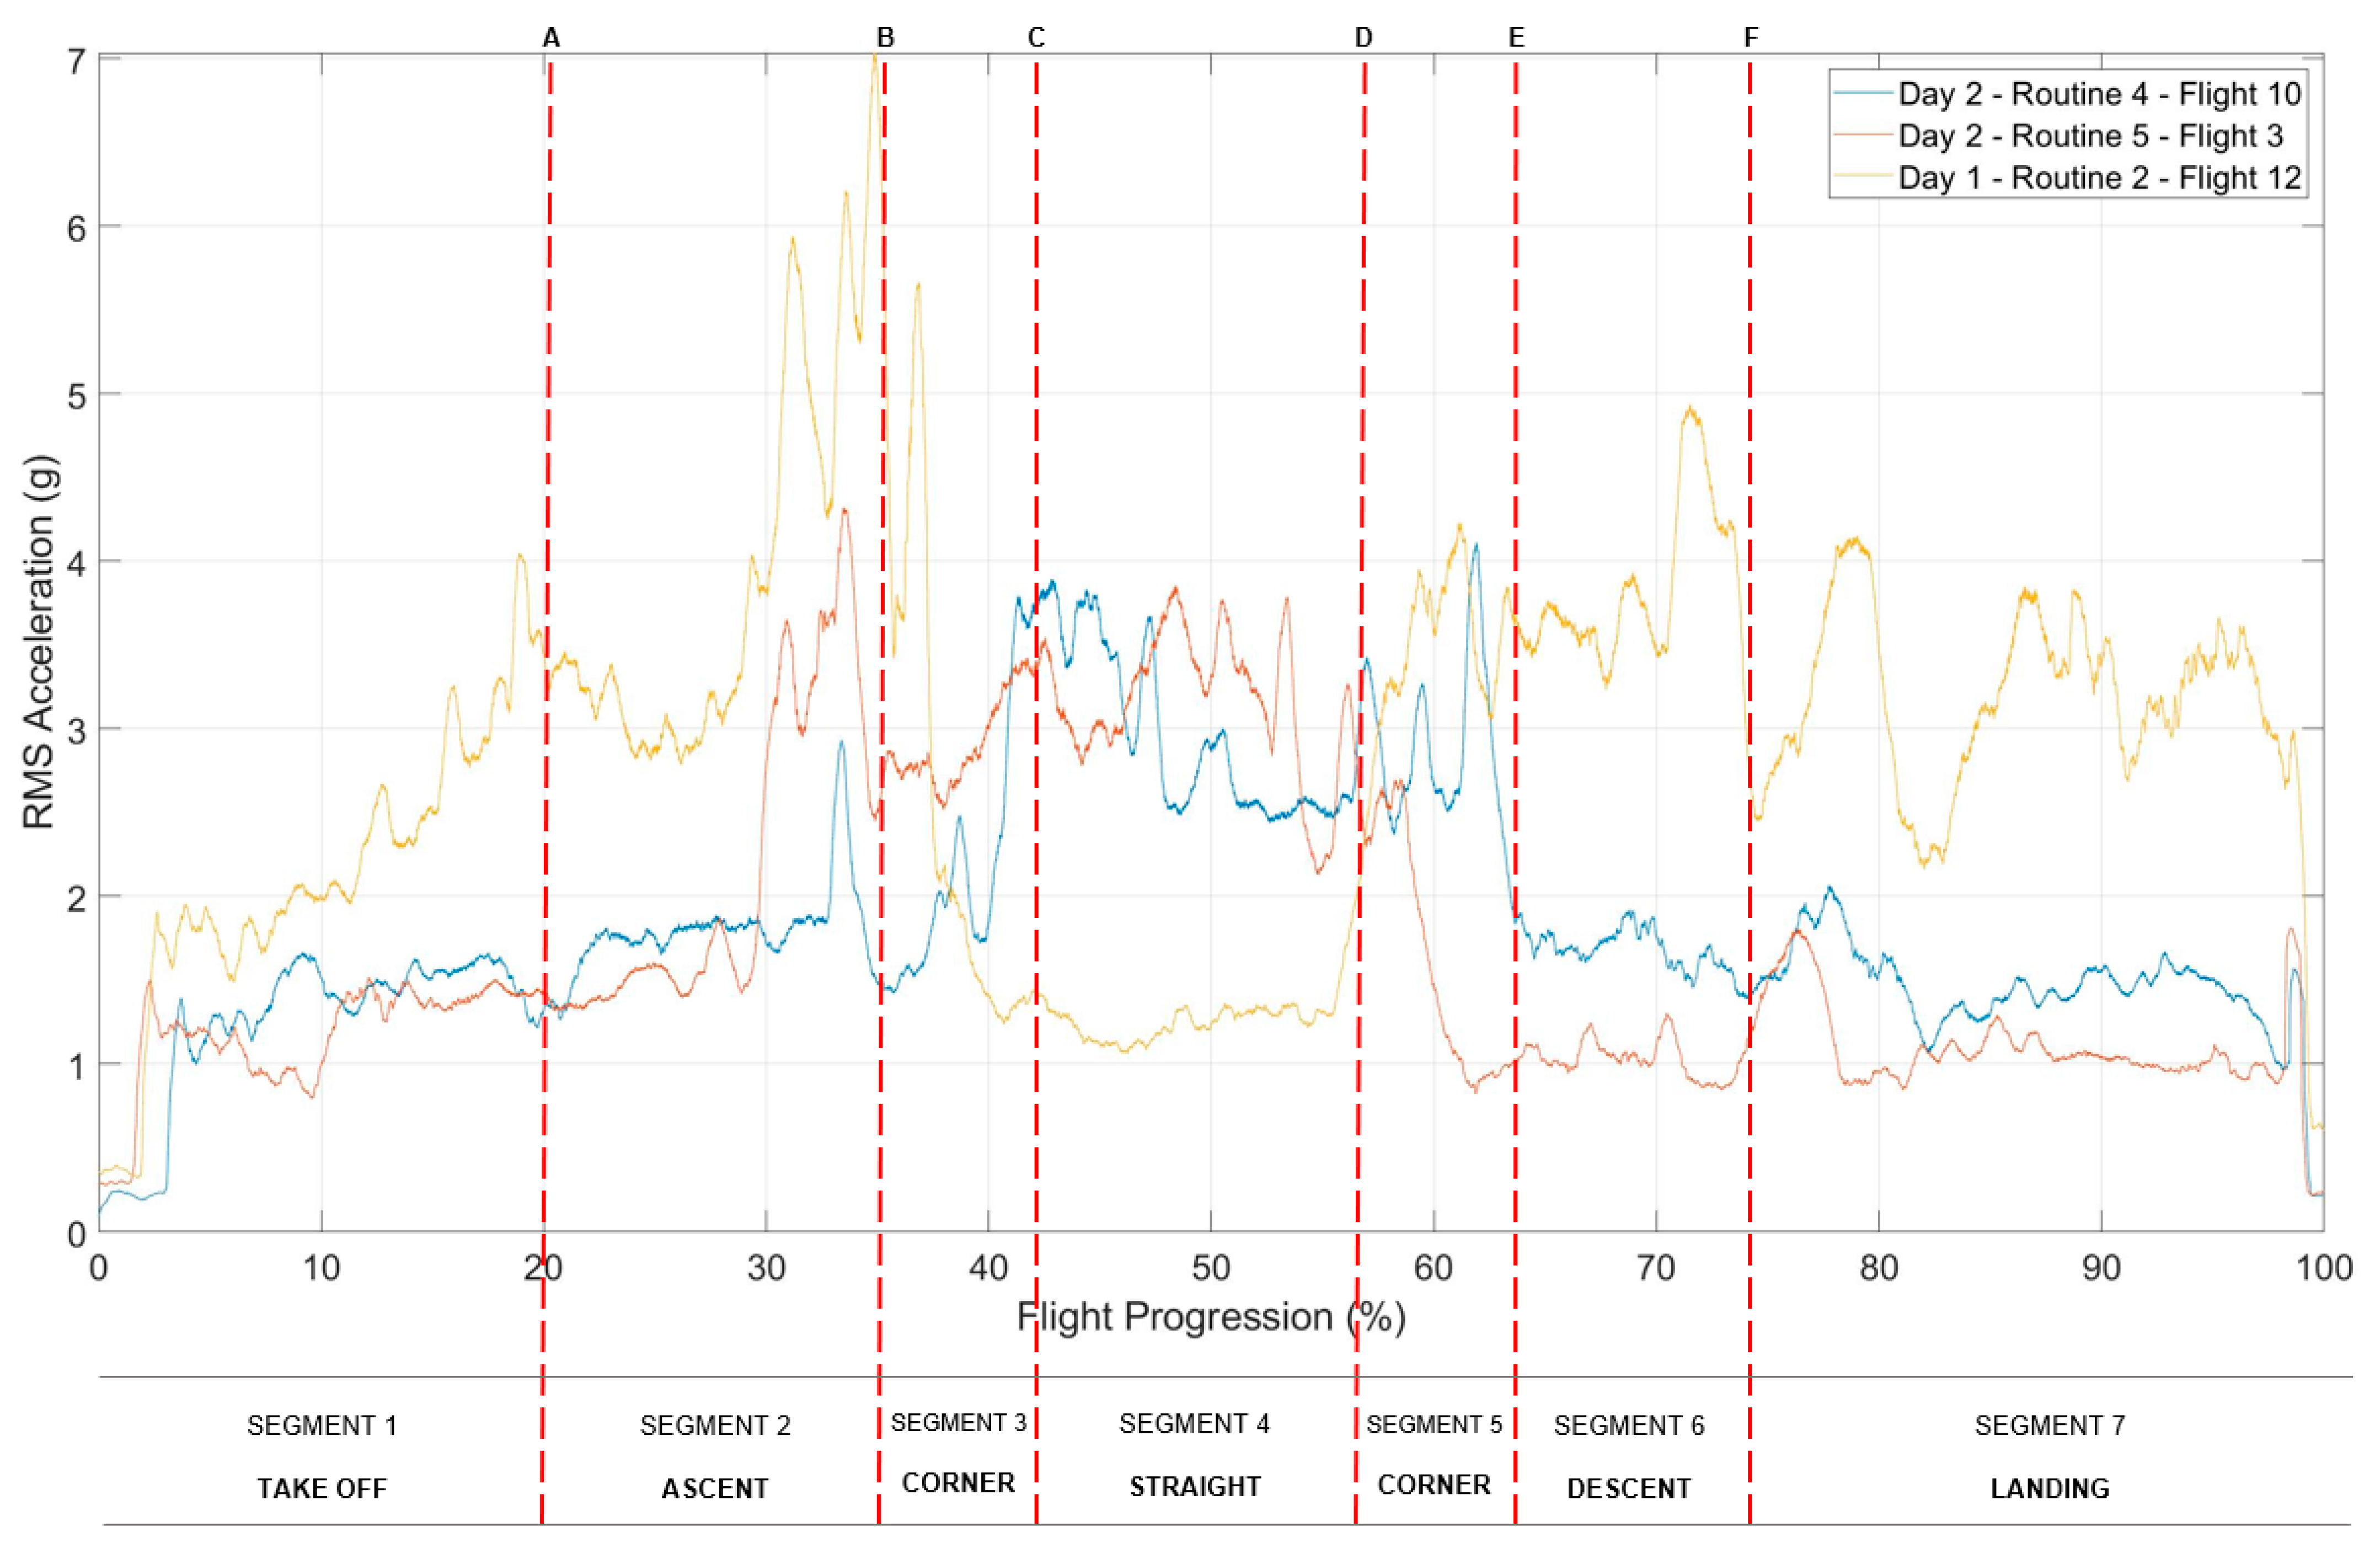
3.1.3. Analysis by Flight Manoeuvre

The results of the analysis of flight manoeuvres can be seen in Table 7. These results show there is a significant difference in the means for each segment of flight. The critical chi-squared value for 16 degrees of freedom is 12.592. In the case of this test, the chi-squared value is 160.51, as shown below, and exceeds this value; therefore, the null hypothesis is rejected, and consequently, there is a significant difference in the mean vibration levels during different segments of flight. This result suggests that there may be a relationship between a segment of flight and vibration. This analysis also showed that categorisation by segment of flight explains 64% of the variance (ratio of sum of squares (SS) error to SS total) in the mean resultant vibration levels.
To further explore this relationship and allow a pairwise comparison between specific segments of flight, a post hoc test was undertaken. The Tukey–Kramer multiple comparison test was completed (Figure 11), with results showing that not all segments varied significantly from one another, suggesting there are similarities between some segments of flight as well as differences. These comparisons can also be seen graphically in Table 8.
This comparison shows that vibration levels during take-off and landing had the lowest mean value and were significantly different from most other segments of flight (Table 8). The ascent and decent transitions had the next lowest mean value and were not significantly different from each other. Both findings vary from previous studies by Zhu et al. (2023), as discussed in Section 3.1.1, where the highest levels of vibration were found to be during take-off, landing, and transition. This discrepancy could be due to the different characteristics of the two drones, given the study by Zhu et al. used a hybrid fixed-wing VTOL drone whilst this study used a multi-copter VTOL drone. Vibration profiles also vary based on conditions, such as weather, route, and cargo, so some variation is to be expected.
All segments of flights that were at constant altitudes (Section 3, Section 4, and Section 5) had the highest mean values and the greatest range and were not significantly different from each other. This could suggest that altitude could be a contributing factor to the mean vibration level or could be related to wind direction.

3.2. Pharmaceutical Analysis

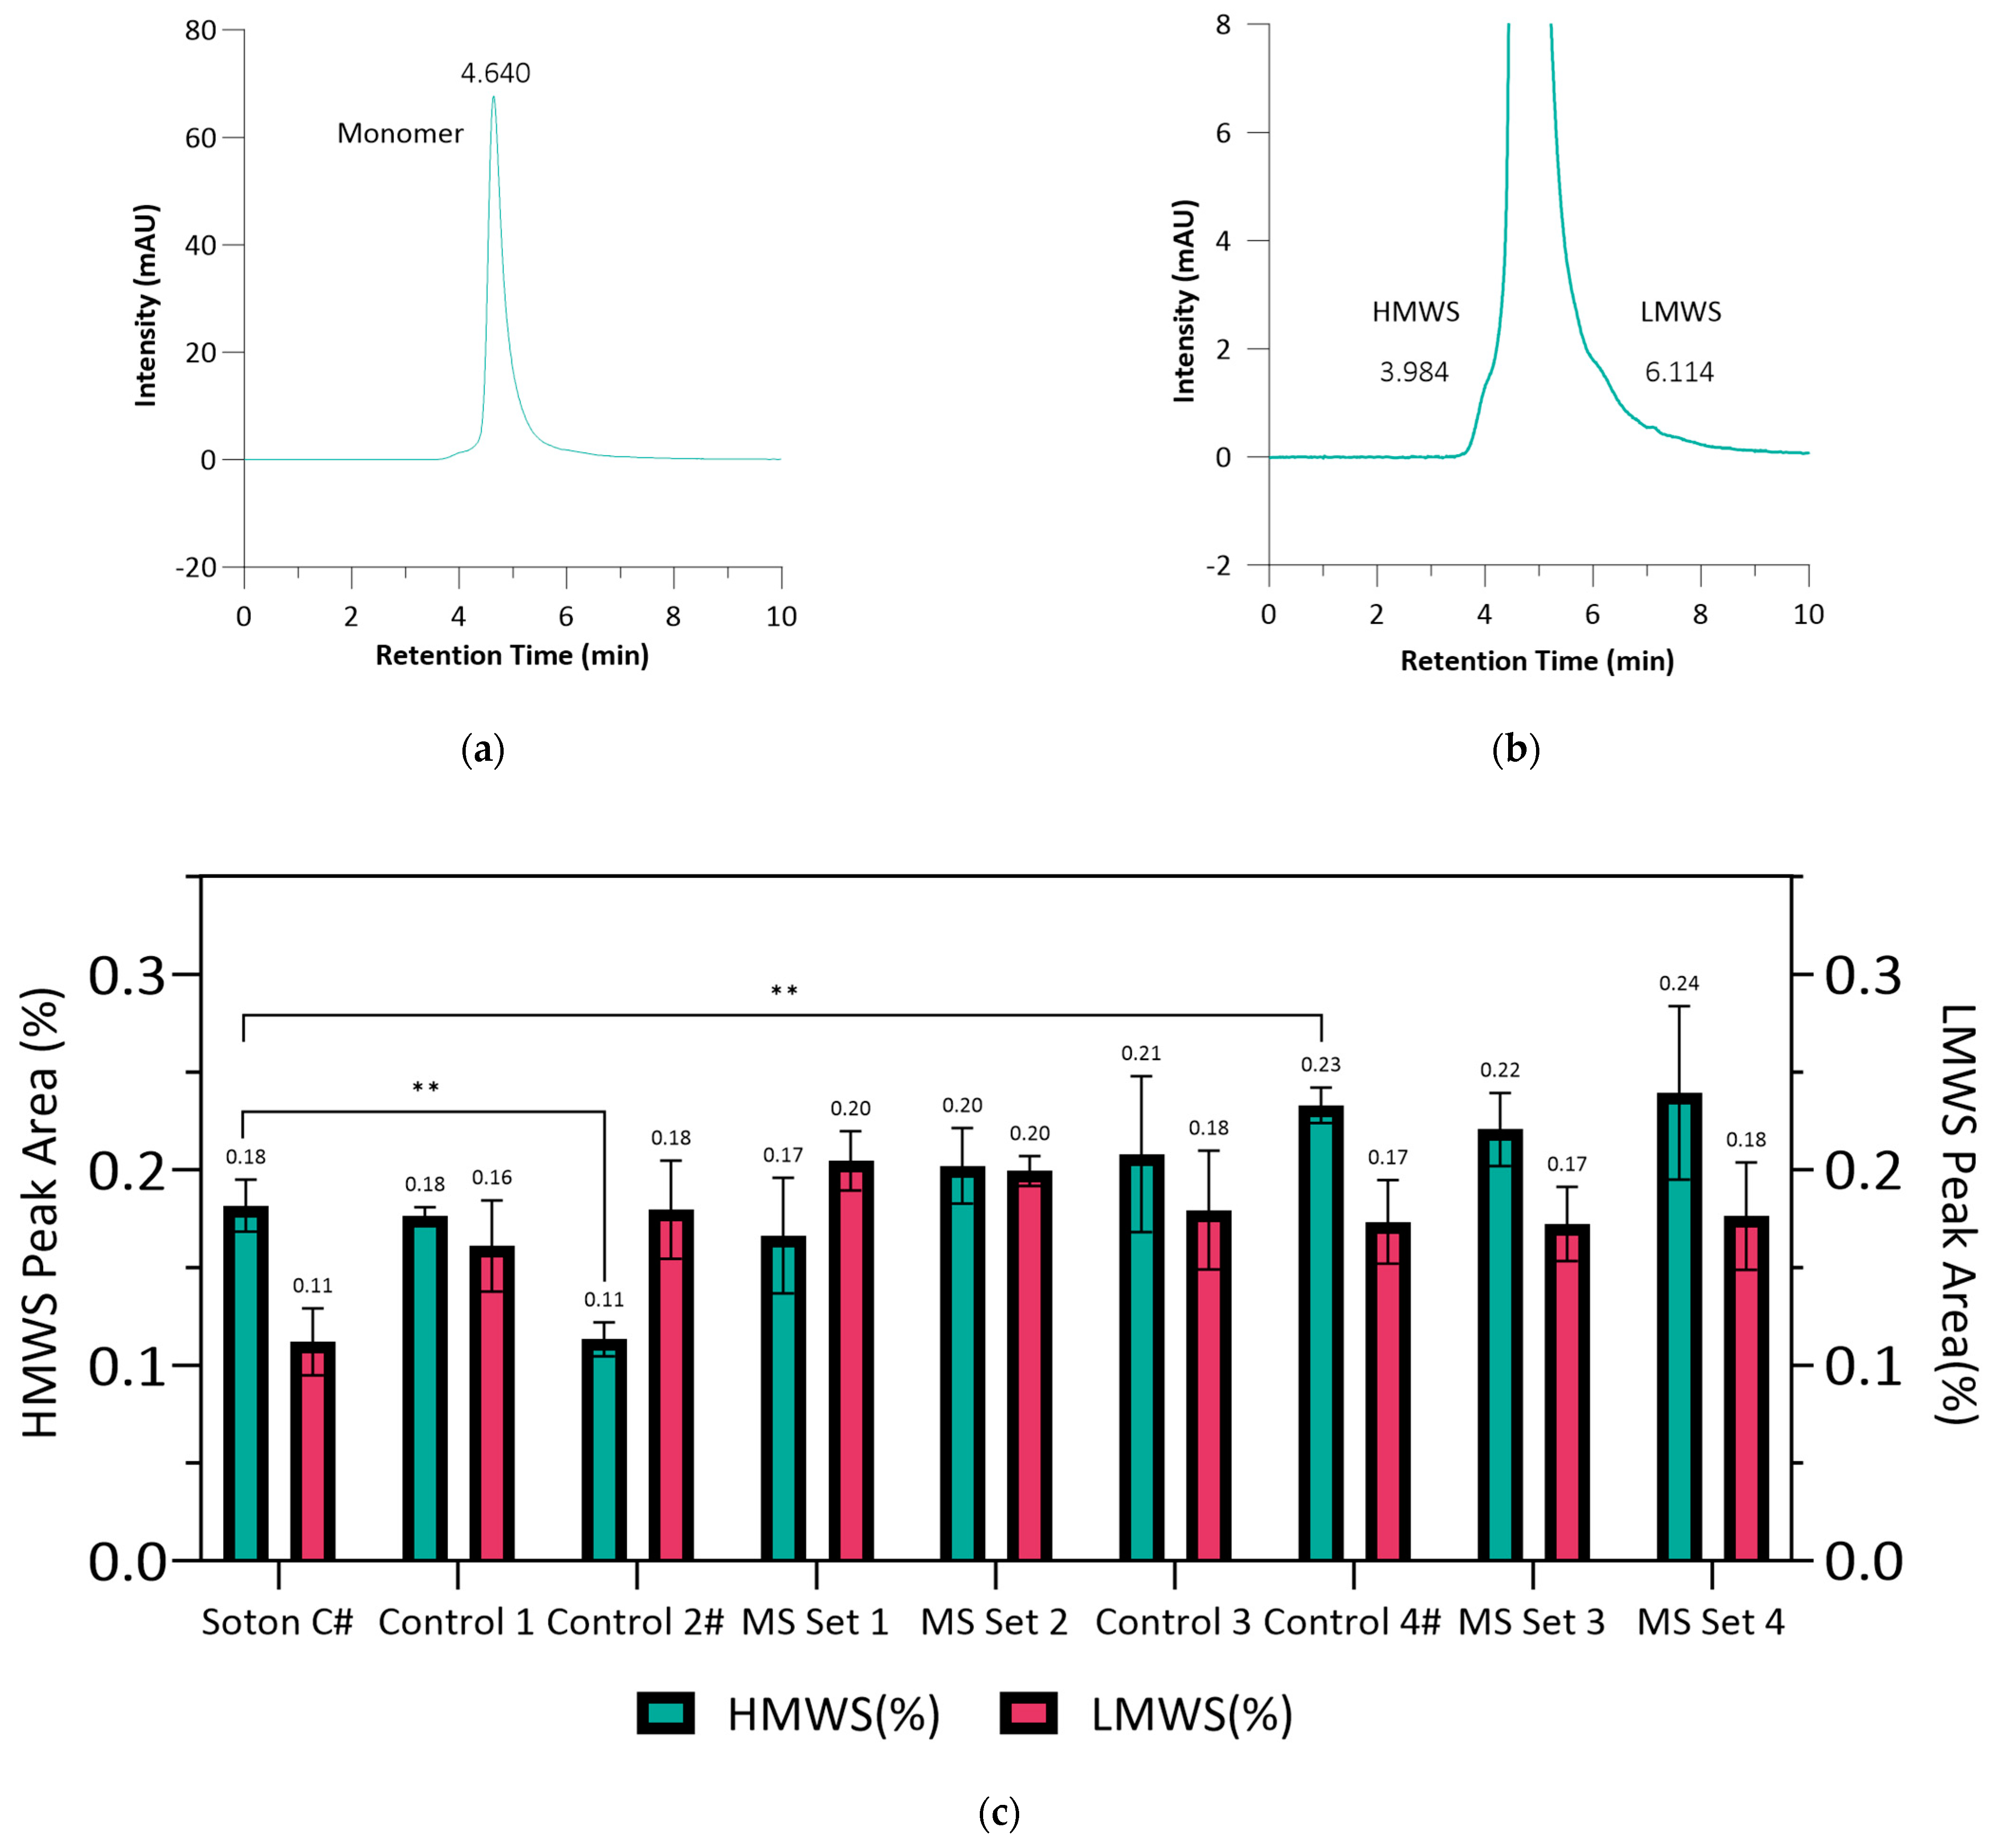
3.2.1. Quality Assessment of Trastuzumab

In this study, the vibrations exerted by the drone were not found to have any detrimental effect on the structural integrity of Trastuzumab medicine in the infusion bag, as determined by DLS and SE-HPLC (Table 9 and Figure 12). No significant difference was observed between the Trastuzumab solution of 1.5 mg/mL, which experienced drone flight (Medicine Sample Set 1–4), and the transported control samples (controls 1–4) of each day, with the particle size remaining as one peak at 14.2 ± 0.20 nm and 15.4 ± 0.59 nm with PDI < 0.1 and higher molecular weight species (HMWS) at 0.17 ± 0.03%, 0.20 ± 0.02%, 0.22 ± 0.02%, and 0.24 ± 0.04%, respectively, and lower molecular weight species (LMWS) at 0.20 ± 0.02%, 0.20 ± 0.01%, 0.17 ± 0.02%, and 0.18 ± 0.03%. A slight decrease (not statistically significant) in HMWS% was found as the number of flights increased from medicine set 1 to 4. The peak area of HMWS, monomer, and LMWS of each sample have also been calculated and met the criteria of NHS stated in the methodology section. These results suggest that Trastuzumab has a degree of tolerance towards drone flight and the associated vibrations.
Comparing transported control samples HMWS% to the Southampton control sample, specifically p = 0.0017 of control 2 and 0.0053 of control 4 (Table 1), indicated that there was a significant difference in transported and non-transported control samples. A rational explanation could be that these three samples all required dilution; thus, exposure to an increased air–water interface during this process undoubtedly led to a slight increase in aggregates [46]. Transported controls 1 and 3 were therefore subjected to statistics analysis to demonstrate the stability of flown medicine sample set 1 and 2 or 3 and 4, respectively.

3.2.2. Quality Assessment of Rituximab

In this study, drone vibration was not found to have any detrimental effect on the structural integrity of Rituximab as determined by DLS and SE-HPLC (Table 10 and Figure 13). No extra aggregation or degradation was observed on Rituximab solution of ~1.1 mg/mL (all in same concentration at first) after drone flight (medicine sample set 1 and 3), with the particle size remaining in one peak at 13.6 ± 0.23 nm or 13.7 ± 0.26 with PDI < 0.1 and HMWS 0.075 ± 0.011% or 0.080 ± 0.001%, LMWS 2.725 ± 0.160% or 2.665 ± 0.048%.
However, a reduction in HMWS% in transported control samples for each day (control 1 and 3) was found by SE-HPLC when compared to the non-transported control samples. Moreover, the PDI value measured by the DLS of transported control 3 sample was 0.259 ± 0.093 (>0.1), which indicates this control sample was not monodisperse, even though the particle size, on average, remained within an acceptable range. To this end, it was decided that the transported control 3 sample could not be used as a control. Further investigation should be conducted to determine if the environment (e.g., temperature) is suitable for cold chain transportation or if the control 3 sample itself already generated more aggregates before any of the experiments.
Therefore, by comparing the HMWS% to the transported control 1 sample, the medicine sample set 3 (Table 1) flown infusion bag sample had a p = 0.71 (>0.05), which indicates there was no significant difference after the 60 flights. The peak area of HMWS, monomer, and LMWS of each sample were also calculated and met the criteria of the NHS stated in the methodology section. These results suggest that Rituximab also has a degree of tolerance towards drone flight and the associated vibrations.

4. Conclusions

This research undertook 60 repeats of a short flight to subject mAb medicines to an extended duration of flight and associated vibration exposure. The aim of the trial was to determine the stability of medicines during drone flight and to investigate the variation in vibration levels across different segments of flight. The samples carried for each flight were varied to create a range of exposures. Both the payload and the airframe were instrumented using triaxial accelerometers to determine the vibration levels during all flights. All samples were tested to determine the quality of the product after transport.
This study revealed that the structural integrity of Trastuzumab and Rituximab at their treatment concentrations in infusion bags remained unaffected by drone vibration when temperature was strictly controlled, as demonstrated through DLS and SE-HPLC analysis. The careful control of the headspace has significantly minimised the likelihood of aggregation occurring despite the dilution of surfactant in the concentrated monoclonal antibodies (mAbs) formulation during aseptic preparation. The air–water interface was maintained at an insignificant level in the final product tested.
Vibration levels were found to vary significantly across the 60 flight recordings, and the stages of flight that created the most variation across flights were identified. It is believed this is due to variations in weather conditions such as wind speed and direction. Vibration was found to occur at frequencies above 50 Hz, with the dominant octave band being 250 Hz, which varied from previous studies on other drones, suggesting that vibration profiles are significantly drone-specific. The Versapak medical carrier was found to provide good vibration isolation at frequencies over 20 Hz. Take-off, landing, and transition were found to have the lowest mean vibration levels and were significantly different from all segments of flight at constant altitudes.

5. Limitations/Future Research

The trial used expired medicines that were redundant for human use to minimise trial costs and prevent additional demands on manufacturing units. However, further trials should be undertaken using in-date products to confirm that the conclusions of these findings are not affected by the expiry of the medicine. The edge of failure should also be identified for each specific product through controlled bench tests in a shaker facility. Based on these tests, formal limits on vibration and shock exposure can, therefore, be defined for each product, including medicines, blood products, and pathology samples and inform future regulation for the carriage of medical goods by drone. The development of a laboratory trial will also limit the need to carry live samples during future flight trials, as in-flight vibration measurements can be referenced against these limits to determine acceptability, and flights can be replicated in the laboratory. Such limits will also inform future quality control procedures for monitoring the supply chain.
Additionally, further research must be undertaken to investigate the factors affecting vibration levels during different flight segments, such as wind conditions and direction, flight manoeuvres, and altitude. This could be achieved through additional monitoring of live drone flights as well as testing under controlled environmental conditions, such as in a wind tunnel. These findings, along with the findings of this paper, will help inform design parameters and monitoring for new drone platforms as well as inform the route planning for drone deliveries. This will be particularly important for platforms intended to carry sensitive cargo.
During live trials, additional power and vibration recordings should be taken to investigate a possible relationship between vibration profiles and power usage, as this may be useful for future monitoring of payload conditions. Finally, additional investigations should be carried out into vibration and shock levels occurring during transport by other emerging modes of transport, such as cargo bikes, for comparison to points of failure.

Supplementary Materials

The following supporting information can be downloaded at: https://www.mdpi.com/article/10.3390/drones7110658/s1. The vibration data presented in this paper is available as supporting information and can be downloaded at: https://doi.org/10.5258/SOTON/D2770.

Author Contributions

Conceptualisation: K.T., W.Z., T.C., T.W., A.O. and P.G.R. Ideas: K.T., W.Z., P.G.R., T.C., T.W. and A.O. Data Curation: K.T., W.Z. and T.W. Formal Analysis: K.T., W.Z., T.W. and P.G.R. Funding Acquisition: T.C., P.G.R. and W.Z. Investigation: K.T., W.Z., P.G.R., T.C. and T.W. Methodology: K.T., W.Z., P.G.R., T.W. and T.C. Project Administration: K.T., W.Z., P.G.R., T.W. and T.C. Resources: K.T., W.Z. and T.W. Software Programming: T.W. and K.T. Supervision: T.W., P.G.R. and T.C. Validation/Verification: W.Z., K.T. and T.W. Visualization: K.T., W.Z. and T.W. Writing original draft: K.T., W.Z., T.C., T.W., P.G.R. and A.O. Writing reviewing and editing: P.G.R., T.W., A.O., K.T., W.Z. and T.C. All authors have read and agreed to the published version of the manuscript.

Funding

This research was funded as part of the UK EPSRC-funded e-Drone project, EP/V002619/1 (www.e-drone.org accessed on 31 October 2023) and the UK Department for Transport Funded Future Transport Zones Solent project (www.solent-transport.com/solent-future-transport-zone/ accessed on 31 October 2023). This work was also financially supported by the King’s-China Scholarship Council (K-CSC) PhD Scholarship Programme for Zhu, W.

Data Availability Statement

The data presented in this study are openly available, as detailed in the Supplementary Materials.

Acknowledgments

The authors would like to thank Ans-Mari Bester and the Isle of Wight NHS Trust team and Portsmouth Pharmacy Manufacturing unit for their support in this investigation and for supplying expired medicines which would otherwise have been disposed of. They would also like to thank Paul White and Ben Waterson of the University of Southampton for their assistance and advice for the statistical analysis of the vibration data. Finally, the authors thank Modini for facilitating the flights featured in this paper.

Conflicts of Interest

The authors declare no conflict of interest.

References

  1. Lord Carter of Coles. Transforming NHS Pharmacy Aseptic Services in England; Department of Health and Social Care: London, UK, 2020. [Google Scholar]
  2. Chatelut, E.; White-Koning, M.L.; Mathijssen, R.H.; Puisset, F.; Baker, S.D.; Sparreboom, A. Dose banding as an alternative to body surface area-based dosing of chemotherapeutic agents. Br. J. Cancer 2012, 107, 1100–1106. [Google Scholar] [CrossRef] [PubMed]
  3. Ackerman, E.; Koziol, M. In the Air with Zipline’s Medical Delivery Drones; IEEE: New York, NY, USA; Spectrum: New York, NY, USA, 2019. [Google Scholar]
  4. Fleischman, M.L.; Chung, J.; Paul, E.P.; Lewus, R.A. Shipping-Induced Aggregation in Therapeutic Antibodies: Utilization of a Scale-Down Model to Assess Degradation in Monoclonal Antibodies. J. Pharm. Sci. 2017, 106, 994–1000. [Google Scholar] [CrossRef] [PubMed]
  5. Grote, M.; Pilko, A.; Scanlan, J.; Cherrett, T.; Dickinson, J.; Smith, A.; Oakey, A.; Marsden, G. Pathways to Unsegregated Sharing of Airspace: Views of the Uncrewed Aerial Vehicle (UAV) Industry. Drones 2021, 5, 150. [Google Scholar] [CrossRef]
  6. Grote, M.; Pilko, A.; Scanlan, J.; Cherrett, T.; Dickinson, J.; Smith, A.; Oakey, A.; Marsden, G. Sharing airspace with Uncrewed Aerial Vehicles (UAVs): Views of the General Aviation (GA) community. J. Air Transp. Manag. 2022, 102, 102218. [Google Scholar] [CrossRef]
  7. Apian Ltd., Northumbria Trial 2023. Available online: https://apian.aero/northumbria.html (accessed on 16 May 2023).
  8. Oakey, A.; Cherrett, T. A drone service to support the Isle of Wight NHS in the UK, in ITS. In Proceedings of the 14th ITS European Congress, Toulouse, France, 30 May–1 June 2022. [Google Scholar]
  9. Oakey, A.; Waters, T.; Zhu, W.Q.; Royall, P.G.; Cherrett, T.; Courtney, P.; Majoe, D.; Jelev, N. Quantifying the Effects of Vibration on Medicines in Transit Caused by Fixed-Wing and Multi-Copter Drones. Drones 2021, 5, 22. [Google Scholar] [CrossRef]
  10. Skyports. NHS Launches UK’s First COVID Test Drone Delivery Service in Scotland. 2021. Available online: https://skyportsdroneservices.com/nhs-launches-uks-first-covid-test-drone-delivery-service-in-scotland/ (accessed on 17 July 2023).
  11. Medicines and Healthcare products Regulatory Agency. Rules and Guidance for Pharmaceutical Distributors 2022 (The Green Guide); Pharmaceutical Press: London, UK, 2022; ISBN 9780857114396. [Google Scholar]
  12. Medicines and Healthcare products Regulatory Agency. Orange Guide: Rules and Guidance for Pharmaceutical Manufacturers and Distributors 2017; Pharmaceutical Press: London, UK, 2017. [Google Scholar]
  13. PharmaAero. Using UAVS (Unmanned Aerial Vehicles) in the Pharma & Humanitarian Air Cargo Sectors; Bedrijvenzone Machelen Cargo 706B, 1830 Machelen, Belgium. 2021. Available online: https://pharma.aero/wp-content/uploads/2021/12/1071601-Whitepaper-UAV-Project_v4_WEB.pdf (accessed on 17 July 2023).
  14. Rosser, J.C., Jr.; Vignesh, V.; Terwilliger, B.A.; Parker, B.C. Surgical and Medical Applications of Drones: A Comprehensive Review. Jsls 2018, 22, e2018.00018. [Google Scholar] [CrossRef]
  15. Shaughnessy, A.F. Monoclonal antibodies: Magic bullets with a hefty price tag. Br. Med. J. 2012, 345, e8346. [Google Scholar] [CrossRef]
  16. Regazzi, M.; Golay, J.; Molinaro, M. Monoclonal Antibody Monitoring: Clinically Relevant Aspects, A Systematic Critical Review. Ther. Drug Monit. 2020, 42, 45–56. [Google Scholar] [CrossRef]
  17. Iqbal, N.; Iqbal, N. Human Epidermal Growth Factor Receptor 2 (HER2) in Cancers: Overexpression and Therapeutic Implications. Mol. Biol. Int. 2014, 2014, 852748. [Google Scholar] [CrossRef]
  18. Pierpont, T.M.; Limper, C.B.; Richards, K.L. Past, Present, and Future of Rituximab-The World’s First Oncology Monoclonal Antibody Therapy. Front. Oncol. 2018, 8, 163. [Google Scholar] [CrossRef]
  19. Tsai, H.T.; Isaacs, C.; Lynce, F.C.; O’Neill, S.C.; Liu, C.; Schwartz, M.D.; Selvam, N.; Zhou, Y.; Potosky, A.L. Initiation of Trastuzumab by Women Younger Than 64 Years for Adjuvant Treatment of Stage I-III Breast Cancer. J. Natl. Compr. Cancer Netw. 2017, 15, 601–607. [Google Scholar] [CrossRef] [PubMed]
  20. Norris-Grey, C.; Cambridge, G.; Moore, S.; Reddy, V.; Leandro, M. Long-term persistence of rituximab in patients with rheumatoid arthritis: An evaluation of the UCL cohort from 1998 to 2020. Rheumatology 2022, 61, 591–596. [Google Scholar] [CrossRef] [PubMed]
  21. Gilbar, P.J.; Chambers, C.R.; Gilbar, E.C. Opportunities to significantly reduce expenditure associated with cancer drugs. Future Oncol. 2017, 13, 1311–1322. [Google Scholar] [CrossRef]
  22. Cortes, J.; Perez-García, J.M.; Llombart-Cussac, A.; Curigliano, G.; El Saghir, N.S.; Cardoso, F.; Barrios, C.H.; Wagle, S.; Roman, J.; Harbeck, N.; et al. Enhancing global access to cancer medicines. CA Cancer J. Clin. 2020, 70, 105–124. [Google Scholar] [CrossRef] [PubMed]
  23. National Institute for Helath and Care Excellence (NICE); British National Formulary (BNF). 2023. Available online: https://bnf.nice.org.uk/drug/ (accessed on 12 May 2023).
  24. Brandham, S.; Bester, A.M. Order and Wastage Records from St, Mary’s IOW Hospital; 2022. Available online: https://www.ncbi.nlm.nih.gov/pmc/articles/PMC9821719/ (accessed on 12 May 2023).
  25. Zhu, W.; Oakey, A.; Royall, P.G.; Waters, T.P.; Cherrett, T.; Theobald, K.; Bester, A.; Lucas, R. Investigating the influence of drone flight on the stability of cancer medicines. PLoS ONE 2023, 18, e0278873. [Google Scholar] [CrossRef] [PubMed]
  26. Heinhuis, K.M.; Barkman, H.J.; Beijnen, J.H.; Hendrikx, J.J.M.A. A cost analysis study of the implementation of fixed-dosing of monoclonal antibodies in the Netherlands Cancer Institute. Int. J. Clin. Pharm. 2021, 43, 181–190. [Google Scholar] [CrossRef]
  27. Oakey, A.; Grote, M.; Royall, P.G.; Cherrett, T. Enabling Safe and Sustainable Medical Deliveries by Connected Autonomous Freight Vehicles Operating within Dangerous Goods Regulations. Sustainability 2022, 14, 930. [Google Scholar] [CrossRef]
  28. Grote, M.; Cherrett, T.; Oakey, A.; Royall, P.; Whalley, S.; Dickinson, J. How Do Dangerous Goods Regulations Apply to Uncrewed Aerial Vehicles Transporting Medical Cargos? Drones 2021, 5, 38. [Google Scholar] [CrossRef]
  29. Hii, M.S.Y.; Courtney, P.; Royall, P.G. An Evaluation of the Delivery of Medicines Using Drones. Drones 2019, 3, 52. [Google Scholar] [CrossRef]
  30. Ranathunga, C.L.; Jayaweera, H.; Suraweera, S.K.K.; Wattage, S.C.; Ruvinda, K.; Ariyaratne, T.R. Vibration Effects in Vehicular Road Transportation. Vidyodaya Sci. J. 2010, 18, 13–25. [Google Scholar]
  31. Trumbore, C.N. Shear-Induced Amyloid Aggregation in the Brain: V. Are Alzheimer’s and Other Amyloid Diseases Initiated in the Lower Brain and Brainstem by Cerebrospinal Fluid Flow Stresses? J. Alzheimers Dis. 2021, 79, 979–1002. [Google Scholar] [CrossRef] [PubMed]
  32. Kaur, H. Chapter 2—Physicochemical characterization of monoclonal antibodies. In Monoclonal Antibodies; Kaur, H., Reusch, D., Eds.; Academic Press: Cambridge, MA, USA, 2021; pp. 31–63. [Google Scholar]
  33. Le Basle, Y.; Chennell, P.; Tokhadze, N.; Astier, A.; Sautou, V. Physicochemical Stability of Monoclonal Antibodies: A Review. J. Pharm. Sci. 2020, 109, 169–190. [Google Scholar] [CrossRef] [PubMed]
  34. Wang, W.; Singh, S.; Zeng, D.L.; King, K.; Nema, S. Antibody structure, instability, and formulation. J. Pharm. Sci. 2007, 96, 1–26. [Google Scholar] [CrossRef] [PubMed]
  35. Santillo, M.; Davies, L.; Autsin, P.; Campbell, C.; Castano, M.; Marks, C.; Merriman, A.; Millington, A.; Skidmore, R. Standard Protocol for Deriving and Assessment of Stability—Part 2: Aseptic Preparations (Biopharmaceuticals). 2021. Available online: https://www.sps.nhs.uk/wp-content/uploads/2017/03/Stability-Part-2-Biopharmaceuticals-v5.pdf (accessed on 12 May 2023).
  36. Medicines and Healthcare Products Regulatory Agency. Good Manufacturing Practice and Good Distribution Practice; Department of Health and Social Care, Ed.; Department of Health and Social Care: London, UK, 2020. [Google Scholar]
  37. Medicines and Healthcare products Regulatory Agency. European Commission Guidelines of 7 March 2013 on Good Distribution Practice of Medicinal Products for Human Use; Official Journal of the European Union: Brussels, Belgum, 2013; C343/1. [Google Scholar]
  38. Bateman, R.; Santillo, M.; Hardy, L.; Lennan, E.; NHS Pharmaceutical Quality Assurance Committee. Guidance on the Safe Handling of Monoclonal Antibody (mAb) Products. 2015. Available online: https://www.sps.nhs.uk/wp-content/uploads/2016/12/mAb-Products-5th-Edition-2015.pdf (accessed on 31 October 2023).
  39. Genentech. Safety Data Sheet RITUXAN® Vials (500 mg/50 mL). Version 1.4. 2021. Available online: https://www.gene.com/download/pdf/RITUXANVials500mgper50mlSAPSDS.pdf (accessed on 12 May 2023).
  40. Langford, S.F.S.; Evans, M.; Blanks, C. Assessing the risk of handling monoclonal antibodies. Hosp. Pharm. 2008, 15, 60–64. [Google Scholar]
  41. Civil Aviation Authority. Unmanned Aircraft System Operations in UK Airspace—Guidance (CAP 722); Civil Aviation Authority: Crawley, UK, 2020. [Google Scholar]
  42. Civil Aviation Authority. Carriage of Dangerous Goods by Remotely Piloted Aircraft Systems; Civil Aviation Authority: Crawley, UK, 2020. [Google Scholar]
  43. International Civil Aviation Organization. Annex 18 to the Convention on International Civil Aviation—The Safe Transport of Dangerous Goods by Air, 4th ed.; International Civil Aviation Organization: Montreal, QC, Canada, 2011. [Google Scholar]
  44. International Civil Aviation Organization. Technical Instructions for the Safe Transport of Dangerous Goods by Air (Doc 9284), 2019–2020 Edition; International Civil Aviation Organization: Montreal, QC, Canada, 2018. [Google Scholar]
  45. Agency, V.C. Crash Protected Containers for Dangerous Goods Carried by Remotely Piloted Aircraft System; VCA Dangerous Goods Office: Surrey, UK, 2022. [Google Scholar]
  46. Leiske, D.L.; Shieh, I.C.; Tse, M.L. A Method To Measure Protein Unfolding at an Air-Liquid Interface. Langmuir 2016, 32, 9930–9937. [Google Scholar] [CrossRef] [PubMed]
Figure 1. Medium-sized Versapak carrier.
Drones 07 00658 g001
Figure 2. (a) Versapak base sensor (held in position by black adhesive tape); (b) loaded Versapak with medicine samples; (c) cargo hold sensor positions (circled in red); (d) airframe sensor position.
Drones 07 00658 g002
Figure 3. Flight paths for flight testing at RAF Keevil. Each path is approximately 330 m. Base map and data from OpenStreetMap and OpenStreetMap Foundation. (a) Paths for all 3 days, and (b) segments of flight for detailed analysis.
Drones 07 00658 g003
Figure 4. Vertical profile of segments of an example flight for analysis. Blue line indicates the vertical profile of the drone during flight and vertical red dashed lines indicate the locations indicated in Figure 3b.
Drones 07 00658 g004
Figure 5. X1 Plymouth Rock quadcopter drone used in the trial.
Drones 07 00658 g005
Figure 6. Spectrogram of triaxial vibration measured on flight 12. The colour scale shown indicates the magnitude of vibration in dB with respect to an arbitrary reference.
Drones 07 00658 g006
Figure 7. RMS Acceleration plotted against flight progression. RMS acceleration has been calculated as the standard deviation with a 1 s sliding window, and the mean is subtracted from the data. This RMS is calculated from the resultant acceleration, i.e., the square root of the sum of the variances of the signals in the three orthogonal directions. Vertical red dashed lines indicate the locations indicated in Figure 3b.
Drones 07 00658 g007
Figure 8. Power spectral densities for X, Y, and Z and the resultant acceleration for the airframe sensor position. Here, 20 dB corresponds to a factor of 10 on acceleration.
Drones 07 00658 g008
Figure 9. Vibration transmission ratios from the cargo hold floor of the Plymouth Rock X1 drone to the Versapak. The blue line indicates the level difference between the PSDs of the packaged sensors and the sensor mounted on the airframe. The red dashed line at 0 dB indicates that the vibration amplitude is the same as that on the airframe. A positive dB value indicates a higher value than the airframe. Conversely, a negative dB value indicates a lower frequency than the airframe. Here, 20 dB corresponds to a factor of 10 on acceleration.
Drones 07 00658 g009
Figure 10. Average octave analysis for the resultant acceleration. Values shown are the mean value of linear acceleration for all 60 flights. Error bars indicate the minimum and maximum values for the given octave band.
Drones 07 00658 g010
Figure 11. Box plot of the Kruskal–Wallis ANOVA with Tukey–Kramer multiple comparisons of the segments of flight. The means differ with 95% confidence where notches in the boxes do not overlap. + indicate outliers.
Drones 07 00658 g011
Figure 12. (a,b) Elution profile of monomeric Trastuzumab, aggregates (HMWS) and fragments (LMWS) by Size Exclusion Chromatography. (c): Data are shown as mean ± SD (n = 3). #: Dilution process involved; concentration adjusted to 1.5 mg/mL. “**” indicates p < 0.01.
Drones 07 00658 g012
Figure 13. (a,b) Elution profile of monomeric Trastuzumab, aggregates (HMWS), and fragments (LMWS) by size exclusion chromatography. (c) Peak area (%) of aggregates (HMWS) and fragments (LMWS). Data are shown as mean ± SD (n = 3). “***” indicates p < 0.001 and “*” indicates p < 0.05.
Drones 07 00658 g013aDrones 07 00658 g013b
Table 1. Medicine samples.
Medicine Weight (mg)/Total Volume (mL)Infusion Bag Size (mL)
Medicine Sample Set 1Rituximab 600/560500
Trastuzumab 350/267250
Medicine Sample Set 2Trastuzumab 400/269250
Control 1Rituximab 600/560500
Trastuzumab 400/269250
Control 2Trastuzumab 450/271250
Medicine Sample Set 3Rituximab 600/560500
Trastuzumab 400/269250
Medicine Sample Set 4Trastuzumab 400/269250
Control 3Rituximab 600/560500
Trastuzumab 400/269250
Control 4Trastuzumab 700/283250
Southampton ControlRituximab 600/560500
Trastuzumab 600/279250
Table 2. Flight routines.
Medicine Sample Set 1Medicine Sample Set 2Medicine Sample Set 3Medicine Sample Set 4
Routine 1
(Flights 1–12)
Routine 2
(Flights 13–24)
Routine 3
(Flights 25–36)
Routine 4
(Flights 37–48)
Routine 5
(Flights 49–54)
Routine 6
(Flights 55–60)
Table 3. Mean kinematic temperatures for the samples during the trial.
Probe 1 (°C)Probe 2 (°C)
Day 16.354.97
Day 22.873.65
Table 4. DLS analysis parameters.
DLS Analysis ParameterValue
Material Refractive Index1.450
DispersantWater
Temperature25 °C (equilibrate 30 s)
Measurement Angle173° Backscatter
Sample Volume~0.5 mL (1.0–1.5 cm height)
CellDTS0012 disposable Cuvettes
Table 5. SE-HPLC analysis parameters.
DLS Analysis ParameterValue
Mobile Phase0.1 mM Potassium phosphate buffer + 0.2 mM Potassium Chloride (pH = 7.0)
Flow rate0.35 mL/min
Temperature25 °C
Injection Volume5 μL
Detection Wavelength280 nm (Ref 360 nm)
Acquisition Time15 min
Table 6. Minimum, maximum, and average RMS acceleration vibration. Values provided in g.
DirectionMinimumAverageMaximum
AirframeVersapakAirframeVersapakAirframeVersapak
X0.67150.05940.93030.07851.39720.0970
Y0.95390.07411.52860.10732.24550.1500
Z0.72190.09261.17450.21511.76830.3935
Resultant1.41020.16312.14390.25873.06980.4113
Table 7. The results of the Kruskal–Wallis analysis of variance tests on mean vibration level for each segment of flight as defined above. SS = sum of squares, df = degrees of freedom, and MS = mean squares.
SourceSSdfMSChi-SquaredProbability > Chi-Squared
Columns852,814.16142,135.7160.514.6074 × 10−32
Error480,748.9245
Total1,333,563251
Table 8. Results of the pairwise comparison of mean vibration levels where red indicates that the means of the segments indicated are significantly different, with 95% confidence, and green indicates no significant difference.
Segment 1
Take Off
Segment 2 AscentSegment 3 CornerSegment 4 StraightSegment 5 CornerSegment 6
Descent
Segment 7
Landing
Segment 1
Take off
Segment 2
Ascend
Segment 3
Corner
Segment 4
Straight
Segment 5
Corner
Segment 6
Descend
Segment 7
Landing
Table 9. Summary of DLS result of Trastuzumab at different storage conditions. All values were expressed as the mean of 30 tests ± SD deviation. *: Dilution process involved; concentration adjusted to 1.5 mg/mL. The stability is expressed as √ stable (quality maintained) and × not stable.
SampleSize (nm)PDIStability
Southampton Control *14.6 ± 0.070.059 ± 0.020Not Applicable
Control 114.3 ± 0.870.031 ± 0.011
Control 2 *14.4 ± 0.820.041 ± 0.017
Medicine Sample Set 114.5 ± 0.880.094 ± 0.012
Medicine Sample Set 215.0 ± 0.280.047 ± 0.003
Control 313.6 ± 0.700.077 ± 0.043
Control 4 *14.4 ± 0.770.071 ± 0.116
Medicine Sample Set 314.2 ± 0.200.041 ± 0.011
Medicine Sample Set 415.4 ± 0.590.084 ± 0.045
Table 10. Summary of DLS result of Rituximab at different storage conditions. All values were expressed as the mean of 30 tests ± SD deviation. Stability is expressed as √ stable (quality maintained) and × not stable.
SampleSize (nm)PDIStability
Southampton Control13.3 ± 0.900.063 ± 0.050Not Applicable
Control 113.8 ± 0.670.096 ± 0.031
Medicine Sample Set 113.6 ± 0.230.052 ± 0.028
Control 314.5 ± 2.760.259 ± 0.093×
Medicine Sample Set 313.7 ± 0.260.070 ± 0.023
Disclaimer/Publisher’s Note: The statements, opinions and data contained in all publications are solely those of the individual author(s) and contributor(s) and not of MDPI and/or the editor(s). MDPI and/or the editor(s) disclaim responsibility for any injury to people or property resulting from any ideas, methods, instructions or products referred to in the content.

