Article

Drone with Mounted Thermal Infrared Cameras for Monitoring Terrestrial Mammals

by
Hanne Lyngholm Larsen
1,*,
Katrine Møller-Lassesen
1,
Esther Magdalene Ellersgaard Enevoldsen
1,
Sarah Bøgh Madsen
1,
Maria Trier Obsen
1,
Peter Povlsen
1,
Dan Bruhn
1,
Cino Pertoldi
1,2 and
Sussie Pagh
1
1
Department of Chemistry and Bioscience, Aalborg University, 9220 Aalborg, Denmark
2
Aalborg Zoo, 9000 Aalborg, Denmark
*
Author to whom correspondence should be addressed.
Drones 2023, 7(11), 680; https://doi.org/10.3390/drones7110680
Submission received: 11 September 2023 / Revised: 12 November 2023 / Accepted: 16 November 2023 / Published: 18 November 2023

Abstract

:

Simple Summary

This study investigates the use of a drone equipped with a thermal camera for recognizing wild mammal species and to determine population sizes of red deer (Cervus elaphus) and roe deer (Capreolus capreoulus) in a 13 km2 moor in Denmark. The thermal images of wild animal species in the area could be distinguished by their body measures when the drone filmed with the camera perpendicular to the ground in an altitude range of 60–120 m. The thermal drone images of the mammal species’ body measures showed significant distinctiveness (F = 6.8, p < 0.001) with MANOVA and population studies of larger mammals, and at the same time was more time-efficient and less invasive for species recognition and population studies than traditional methods.

Abstract

This study investigates the use of a drone equipped with a thermal camera for recognizing wild mammal species in open areas and to determine the sex and age of red deer (Cervus elaphus) and roe deer (Capreolus capreoulus) in a 13 km2 moor in Denmark. Two separate surveys were conducted: (1) To achieve drone images for the identification of mammals, the drone was tested around a bait place with a live wildlife camera that was often visited by European badger (Meles meles), stone marten (Martes foina), European hare (Lepus europaeus), roe deer and cattle (Bos taurus). The thermal images of wild animal species could be distinguished by their body measures when the drone filmed with the camera pointed perpendicular to the ground in an altitude range of 50–120 m. A PCA ordination showed nonoverlapping body characteristics and MANOVA showed that the combined body measures used were significantly distinctive F = 6.8, p < 0.001. The reactions and behavioral responses of the different species to the altitude and noise of the drone were also tested in this place. (2) On a 13 km2 moor, a drone was used for a population study of deer. Red deer and roe deer were counted and separated by body measures. Red deer individuals could, at the right altitude, be separated into adults and calves, and males and females. Body length was the most conclusive body measure, and therefore a reference measurement in the field is recommended. The frame thermal images were effective in species recognition and for use in population studies of deer, and are thought to be more time-efficient and less invasive than traditional methods. In autumn, the number of stags and the life stage of red deer, as well as the distribution of deer in different types of vegetation, could be determined.

1. Introduction

Population and species monitoring are important elements in the management and conservation of species [1]. Hunters’ harvest statistics are often used as an indirect measurement of population size. However, this only concerns species that are not protected, and game bags may reflect hunters’ tradition rather than changes in population size [2,3,4]. Direct counting methods include ground-based transect surveys, fecal density counts, and images from camera traps [5,6,7,8]. Ground-based census is time consuming and may disturb and affect results, especially for game species, and visual monitoring in daylight limits the detection of nocturnal species and species with visual camouflage [9,10]. To monitor nocturnal game species, e.g., red deer (Cervus elaphus), roe deer (Capreolus capreoulus), red fox (Vulpes vulpes), and European hare (Lepus europaeus), nightly spotlight surveys are widely used [11,12,13,14]. Genetic approaches are also a beneficial but costly tool for investigating the population of species that are difficult to detect and manage [15,16]. Genotyping fecal samples provides information about sex ratios and individuals in populations that is more accurate than hunters’ harvest statistics [17].
Collier et al. [18] investigated detection probabilities by counting deer with the spotlight count method, along with counting from a thermal imager. This survey showed that counting with a thermal imager was more effective than spotlight count alone. The use of spotlight counting has been discussed as a reliable method of estimating population dynamics [12,18]. The population size for nocturnal and elusive species can be studied with camera traps [19]. Nakashima et al. [20] compared animal density using camera traps and transect surveys, and found that the number of non-detected animals was lower at camera trapping compared to direct sightings.
There is an increase in the use of aerial drones as a monitoring tool to achieve a more accurate estimate of population sizes and dynamics [21,22]. The use of thermal cameras during drone surveys is especially effective for monitoring nocturnal species, forest-dwelling species, and species that are generally difficult to detect [23,24]. The use of drones makes it possible to examine multiple parameters simultaneously, such as behavioral responses, population counts, and sex ratio [22,25,26]. In addition, drones possess better detection capacities and are more efficient in terms of survey time compared to other methods [27,28]. Several studies have compared the use of drones with ground-based counting methods for birds [29], where drones were found to be more efficient and accurate [28,29]. Monitoring with drones may, however, cause disturbances of the targeted animals [30]. A study on drones used to investigate shorebirds showed that the response to the approaching drone differed from species to species, but also within a species [31]. Chaco eagles (Buteogallus coronatus) hardly responded to the drones [26]. To ensure less impact on the target species, it is relevant to investigate whether species are disturbed by drones. It is expected that red deer and roe deer will be observed simultaneously due to the species’ overlap in feeding niche and daily activity [32,33,34]. Identifying the sex of deer may be possible with reference to the blood supply to the antlers [22,35].
This study is based on two surveys using a drone with a thermal infrared camera: (1) at a private landowner’s bait station, which was monitored by a live feed camera and was known to be frequently visited by both wild mammals and grazing cattle, and (2) during the autumn, a moor was scanned to detect deer to estimate species of deer and, if possible, their sex and offspring.
The aim of this study is to test the effectiveness of using a drone with a thermal camera:
  • To identify mammal species in the field, such as red deer, roe deer, foxes, badgers, stone martens, European hares, and domestic cows, and their sensitivity to drone noise;
  • To test the possibility of recognizing the sex of red deer and determining the sex ratio in a population;
  • To test the possibility of distinguishing red deer calves from adults to determine reproduction.

2. Materials and Methods

2.1. Image Collection and Study Areas

A bait location established by a private landowner in Brovst (57.14° N, 9.42° E), Denmark, was visited to gain thermal images of common mammals to be used for species recognition. The bait location has, since 2021, been continuously monitored by two wildlife cameras with night vision, which are live streaming to Youtube (Live Natur Kamera-Danmark 2022). The cameras are stationary, ground-based, and placed approximately 70 m apart. To ensure the presence of mammals in front of the cameras, the private landowner regularly puts out peanuts for the wild mammals and birds. The bait location has been visited every night by several wild mammals such as badger, stone marten, red fox, and roe deer. At this location, the mammals could be observed on the live cameras on a computer screen simultaneously with drone-monitored flights. The bait location was visited on 14 November 2022 from 17:00 to 00:00. The ambient temperature was 8.5° Celsius, with wind gust up to 11.6 m/s. When an animal was observed in front of the live camera, the drone was then flown to its location, and the thermal image could be matched with the direct sighting of the animal in front of the live camera. The behavior of the animals was also observed, and the lowest altitude at which their behavior was changed from undisturbed to disturbed by the drone’s noise was noted. On the moor (13 km2), Lyngby Hede, Denmark (56.85° N, 8.30° E), managed by The Danish Nature Agency, the age, sex, and the number of observed red deer and roe deer were counted [36].
The survey in the moor was performed on 19 October 2022 from 19:00 to 00:00. That night, the ambient temperature was 6° Celsius with a wind speed of 5–6 m/s.

2.2. Data Collection

Both surveys used a drone, DJI Matrice 300 RTK (M300 UAS), equipped with a Zenmuse H20N thermal camera providing a DFOV of 45.5° and thermal image resolution 640 × 512, enabling up to 32× zoom (chosen for the high resolution of the thermal camera). The drone was manually piloted in both surveys.
The M300 drone was equipped with a feature that enabled the placement of pinpoint markers on the map during its flight. In Lyngby Hede, the drone was piloted manually, maintaining an altitude of 120 m, thereby affording a comprehensive aerial perspective of the terrain (Figure 1). The preliminary survey was conducted at a single location to initially scout for animals. The spatial positions of the animals were recorded using the pinpoint markers integrated within Google Maps. The drone was returned to the take-off site to replace depleted batteries. Following the battery change, the drone was guided to the pinpointed positions of the animals for visual identification of their gender, age, and sex. Throughout this process, the altitude of the drone was never less than 60 m above the animals.
RStudio version 4.2.2 (RStudio, Boston, MA, USA) [37] was used for data analysis with the Packages “Tidyverse” [38], “ggplot2” [39], “FactoMineR” [40], and “factoextra” [41].

2.3. Species Identification and Drone Tolerance

In Brovst, Denmark, the species at the bait location was observed and verified via the live stream cameras. When an animal was seen on the live stream, the M300 UAS was deployed to examine the disturbance tolerance of the species and to document body measurements. This was achieved by performing an initial examination of the animal from a height of 120 m. Following the examination, the M300 UAS was flown away from the animal. Hereafter, the aircraft was lowered by 10 m before returning to the animal, and the animal was studied from the new height. These steps were repeated until a change in behavior indicating disturbance was noticed, defined as either attentive behavior (freezing, stopping search for food, turning ears in direction of the drone), or fleeing from the bait location. Prior to the study, the level of noise was measured by the Splend Android App in decibels (dB) in 20 m intervals to determine the approximate sound intensity. Disturbance tolerance was not tested on deer, as roe deer only traversed the field of view of the live camera during a drone flight, positioning themselves beyond the camera’s field of view. Thus, it was possible find the location of the roe deer for body measurements, but not to observe their reaction on the live stream. In the case of the red deer, they never came into the direct line of sight of the live camera.
The length and width of each adult animal were measured. To find body measurements of different mammal species, the M300 UAS was first flown at an altitude of 120 m directly above a car with a known length of 4.87 m, which provided a reference point for length. The length and width in meters of the car were filmed at all levels of digital zoom. The drone was then flown to the location of the animal(s). Still frames from the thermal video were then opened in ImageJ [42], and length measurements were made manually. The “set scale” feature of ImageJ was used to determine body measures of both the mammal species and of the car adjusted to length in px converted to meters [42]. This allowed for the accurate measuring of all objects in different still frames, providing identical resolutions, altitudes, and levels of zoom.
Due to a limited presence of both roe deer and red deer in Brovst, we conducted body measurements of these species recorded in Lyngby Hede as well. Measurements were exclusively taken of those individuals where the drone camera was pointed perpendicular to the ground. Measurements was undertaken in the same way as for the species from Brovst. A still frame from the thermal video of each mammal was measured, providing parameters of body length both with and without the tail, and the width of the animal was measured from the widest part of the shoulders, waist, and hips (Figure 2). All still frames were picked from the thermal videos where the animals were as straight and uncurled as possible. Differences in body measures were found for the different species based on each individual’s thermal pixel size. All measurements were log transformed.
A principal component analysis (PCA) ordination was used to visualize the differences in body measurements. A PCA ordination visualizes the distance between measures using multidimensional regression, in a two-dimensional graph [43]. A multivariate analysis of variance (MANOVA) was used to test differences in the species’ body measures. MANOVA is an extension of ANOVA and is used to compare the means of more than two dependent variables [44].

2.4. Red and Roe Deer Counts in Lyngby Hede

The numbers of deer and other species in the moor were counted. The sex and life stage (adult or calf) were recorded, if possible. Pinpoint markers were added to the built-in drone map of the M300 where deer were observed. These were then uploaded to ArcGis and layered on top of the most recent orthophoto [45]. Coordinates from SubRip Subtitle (SRT) files were used to map the exact locations where animals were seen. By examining the videos, the placement of the markers was verified, and additional markers were set as more herds of deer were discovered during the survey. The species was estimated and noted for each marker. The number of deer and other species was counted afterwards by reviewing and pausing the videos to count the deer.

3. Results

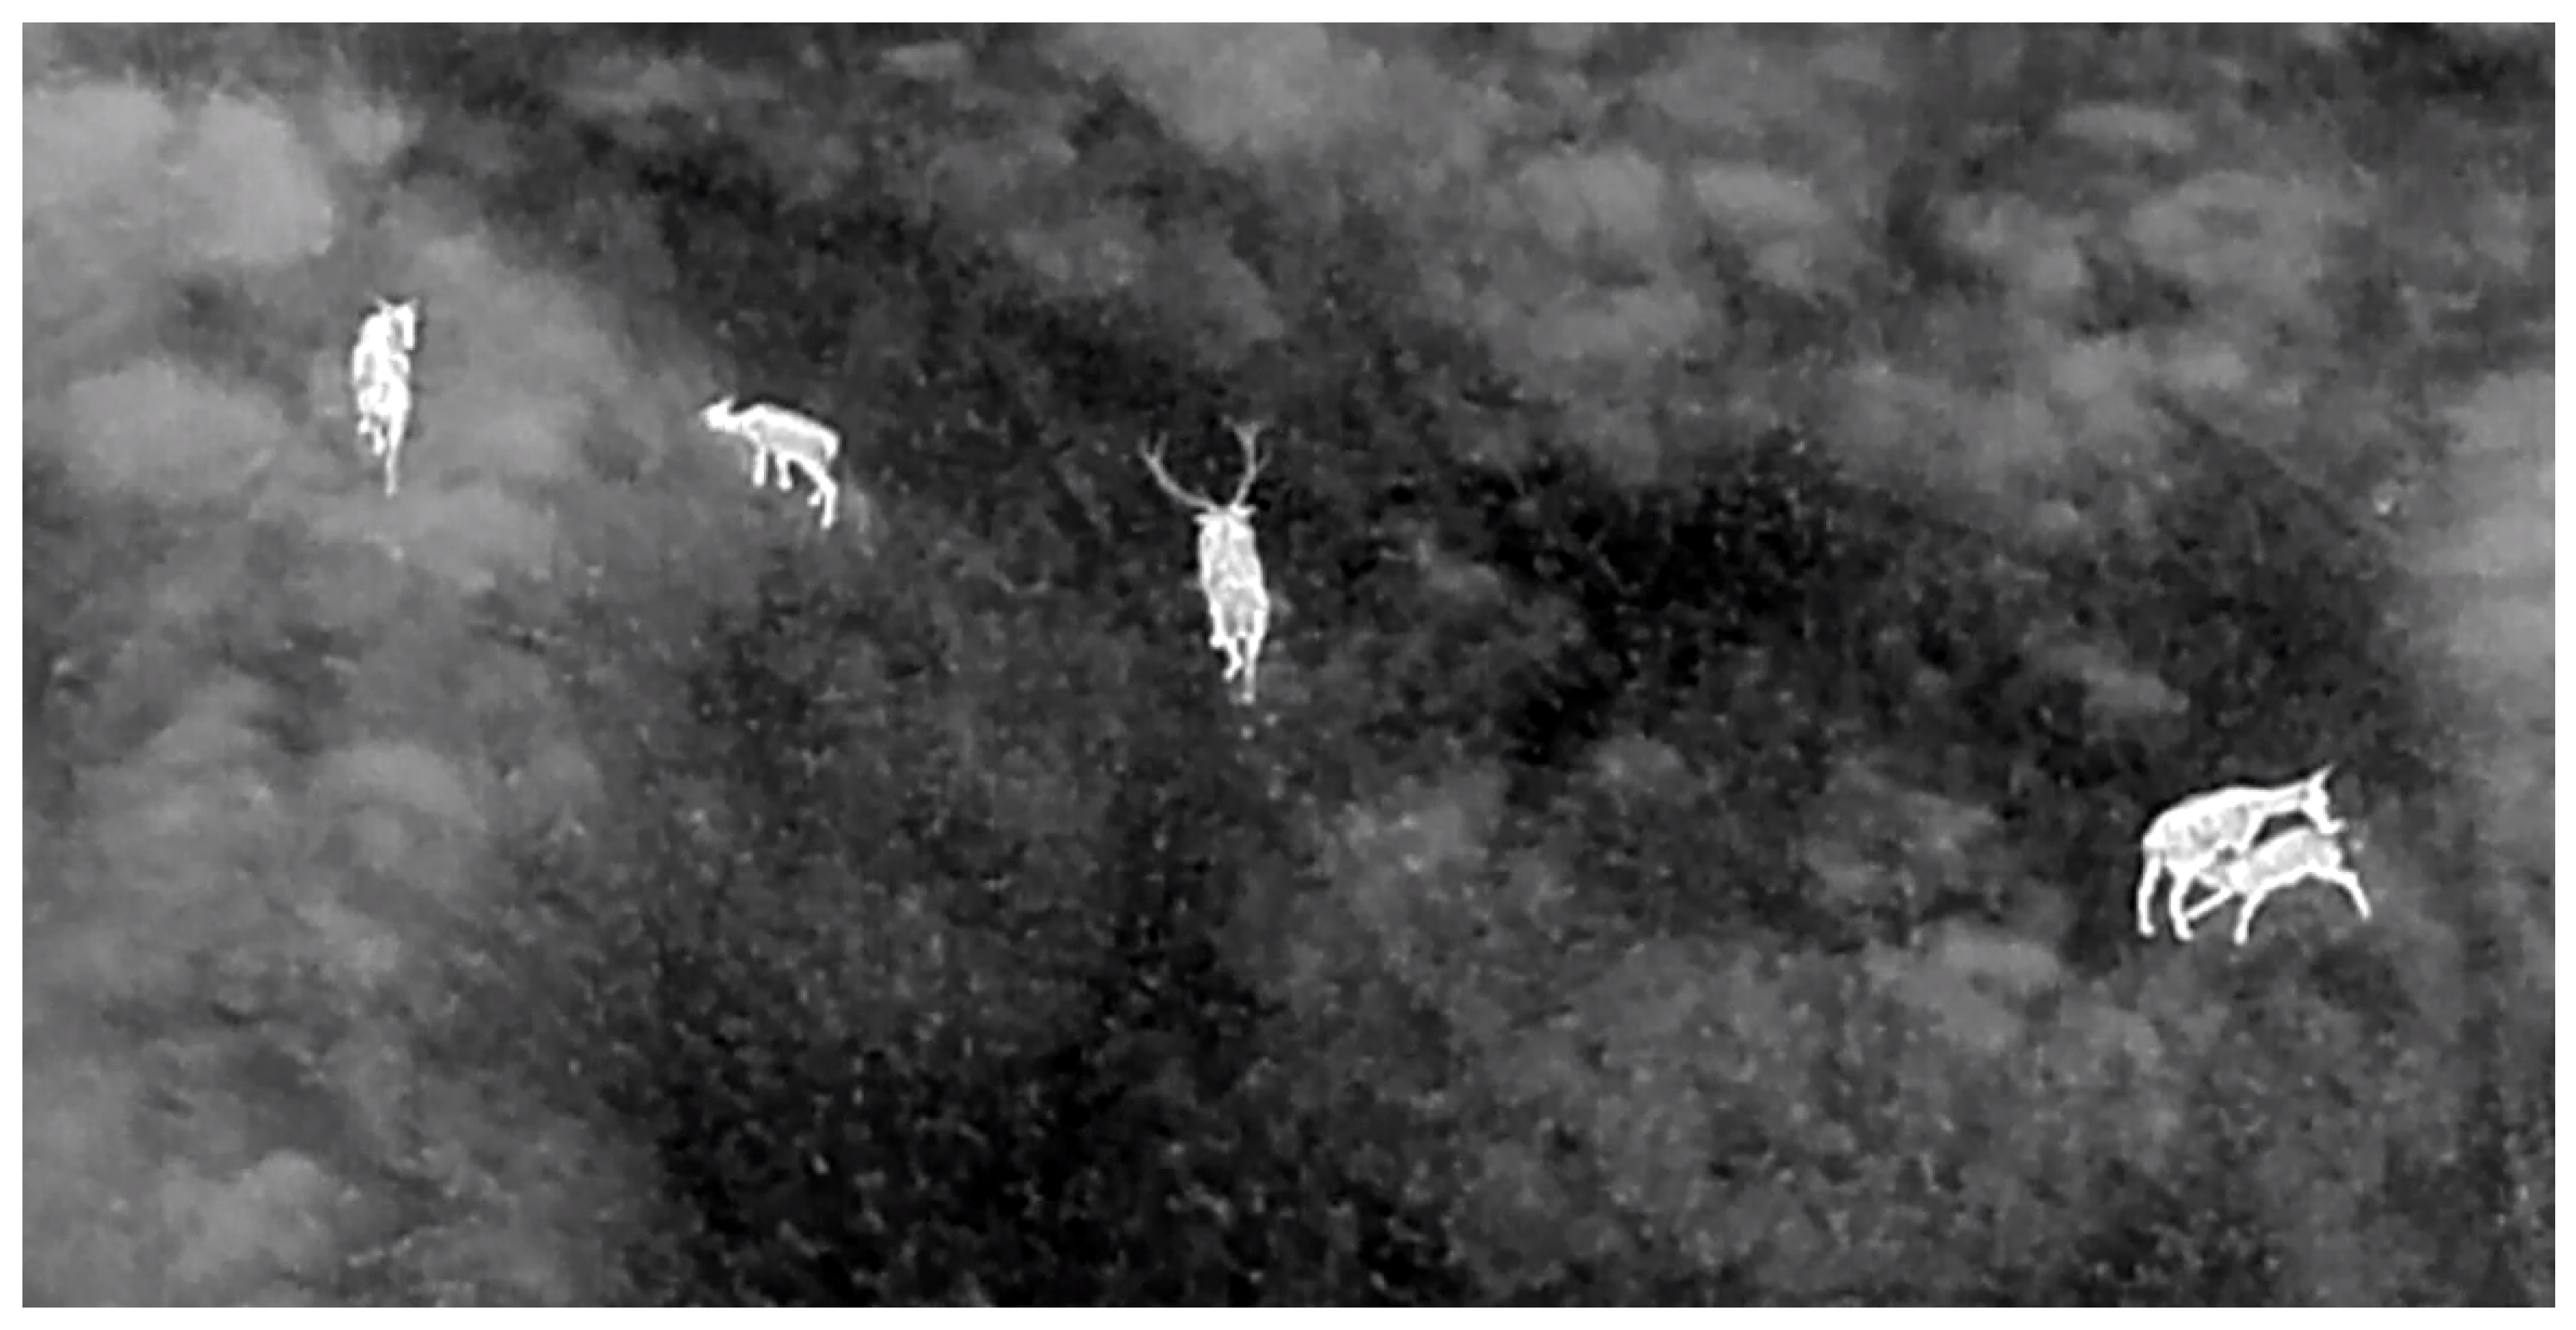
3.1. Thermal Body Measures for Species Recognition

A total of 36 animals (7 badgers, 19 cows, 1 hare, 6 stone martens, 6 red deer, and 6 roe deer) had their body sizes measured in meters from the still frames of a thermal video filmed with the camera perpendicular to the ground, with the M300 UAS positioned at a range of 55–120 m. A PCA ordination of the body measures showed distinctive measures, except for a few cattle and red deer individuals (Figure 3). Body measure of the species showed significant distinctiveness (F = 6.8, p < 0.001, MANOVA).

3.2. Characteristics Used for Recognising Species

Cattle and deer could be distinguished by their body shape. The width of the waist of cattle was more than twice their hip and shoulder width, whereas deer had an almost identical waist, shoulder, and hip width. Hence, deer looked more rectangular in shape than cattle on the thermal videos. The heads of red deer and roe deer were visually different. The snout of a red deer is relatively long compared that of a roe deer. The thermal image of a roe deer head looks triangular from a distance . Furthermore, the movements of red deer were perceptibly slower compared to those of roe deer. Hares could generally be distinguished from other medium-sized mammals by their long ears. Roe deer and badgers could be distinguished from each other by the plump shape of a badger compared to the slender body of the roe deer, and stone martens could be recognized by their long and slender bodies and their long tails. When the size of the animals could not be calculated from the still frames of the thermal videos with ortho-videographic observation, other features in the landscape, such as country roads and cars, were used as scale conditions to estimate the sizes of the animals.

3.3. Sex and Maturity Recognition of Red Deer

From early summer until January, the life stage of red deer can be recognized by their antlers [22]. Therefore, adult male red deer were recognizable by their antlers at the time when red deer were observed on the moor (Figure 4).
Calves traveled with their mothers, and therefore their size sin relation to the adult mother were measurably smaller.

3.4. Disturbance and Flight Altitude

Three species were tested: three martens, one hare and one badger. None of the animals were disturbed enough to flee from their location, and only martens and hares showed attentive behavior to the drone (Table 1). Three martens showed attentive behavior when the drone had flight altitudes of 109 m, 80 m, and 55 m, whereat the noise levels were 55 dB, 60 dB, and 61.5 dB, respectively. One hare showed attentive behavior at a flight altitude of 116 m with a dB of 55 (Table 1). The badger did not react to the drone when it was above 60 m. Disturbance was not tested on red deer and roe deer, as they were not in the field of view of the live camera used to observe the animals’ reactions to noise.

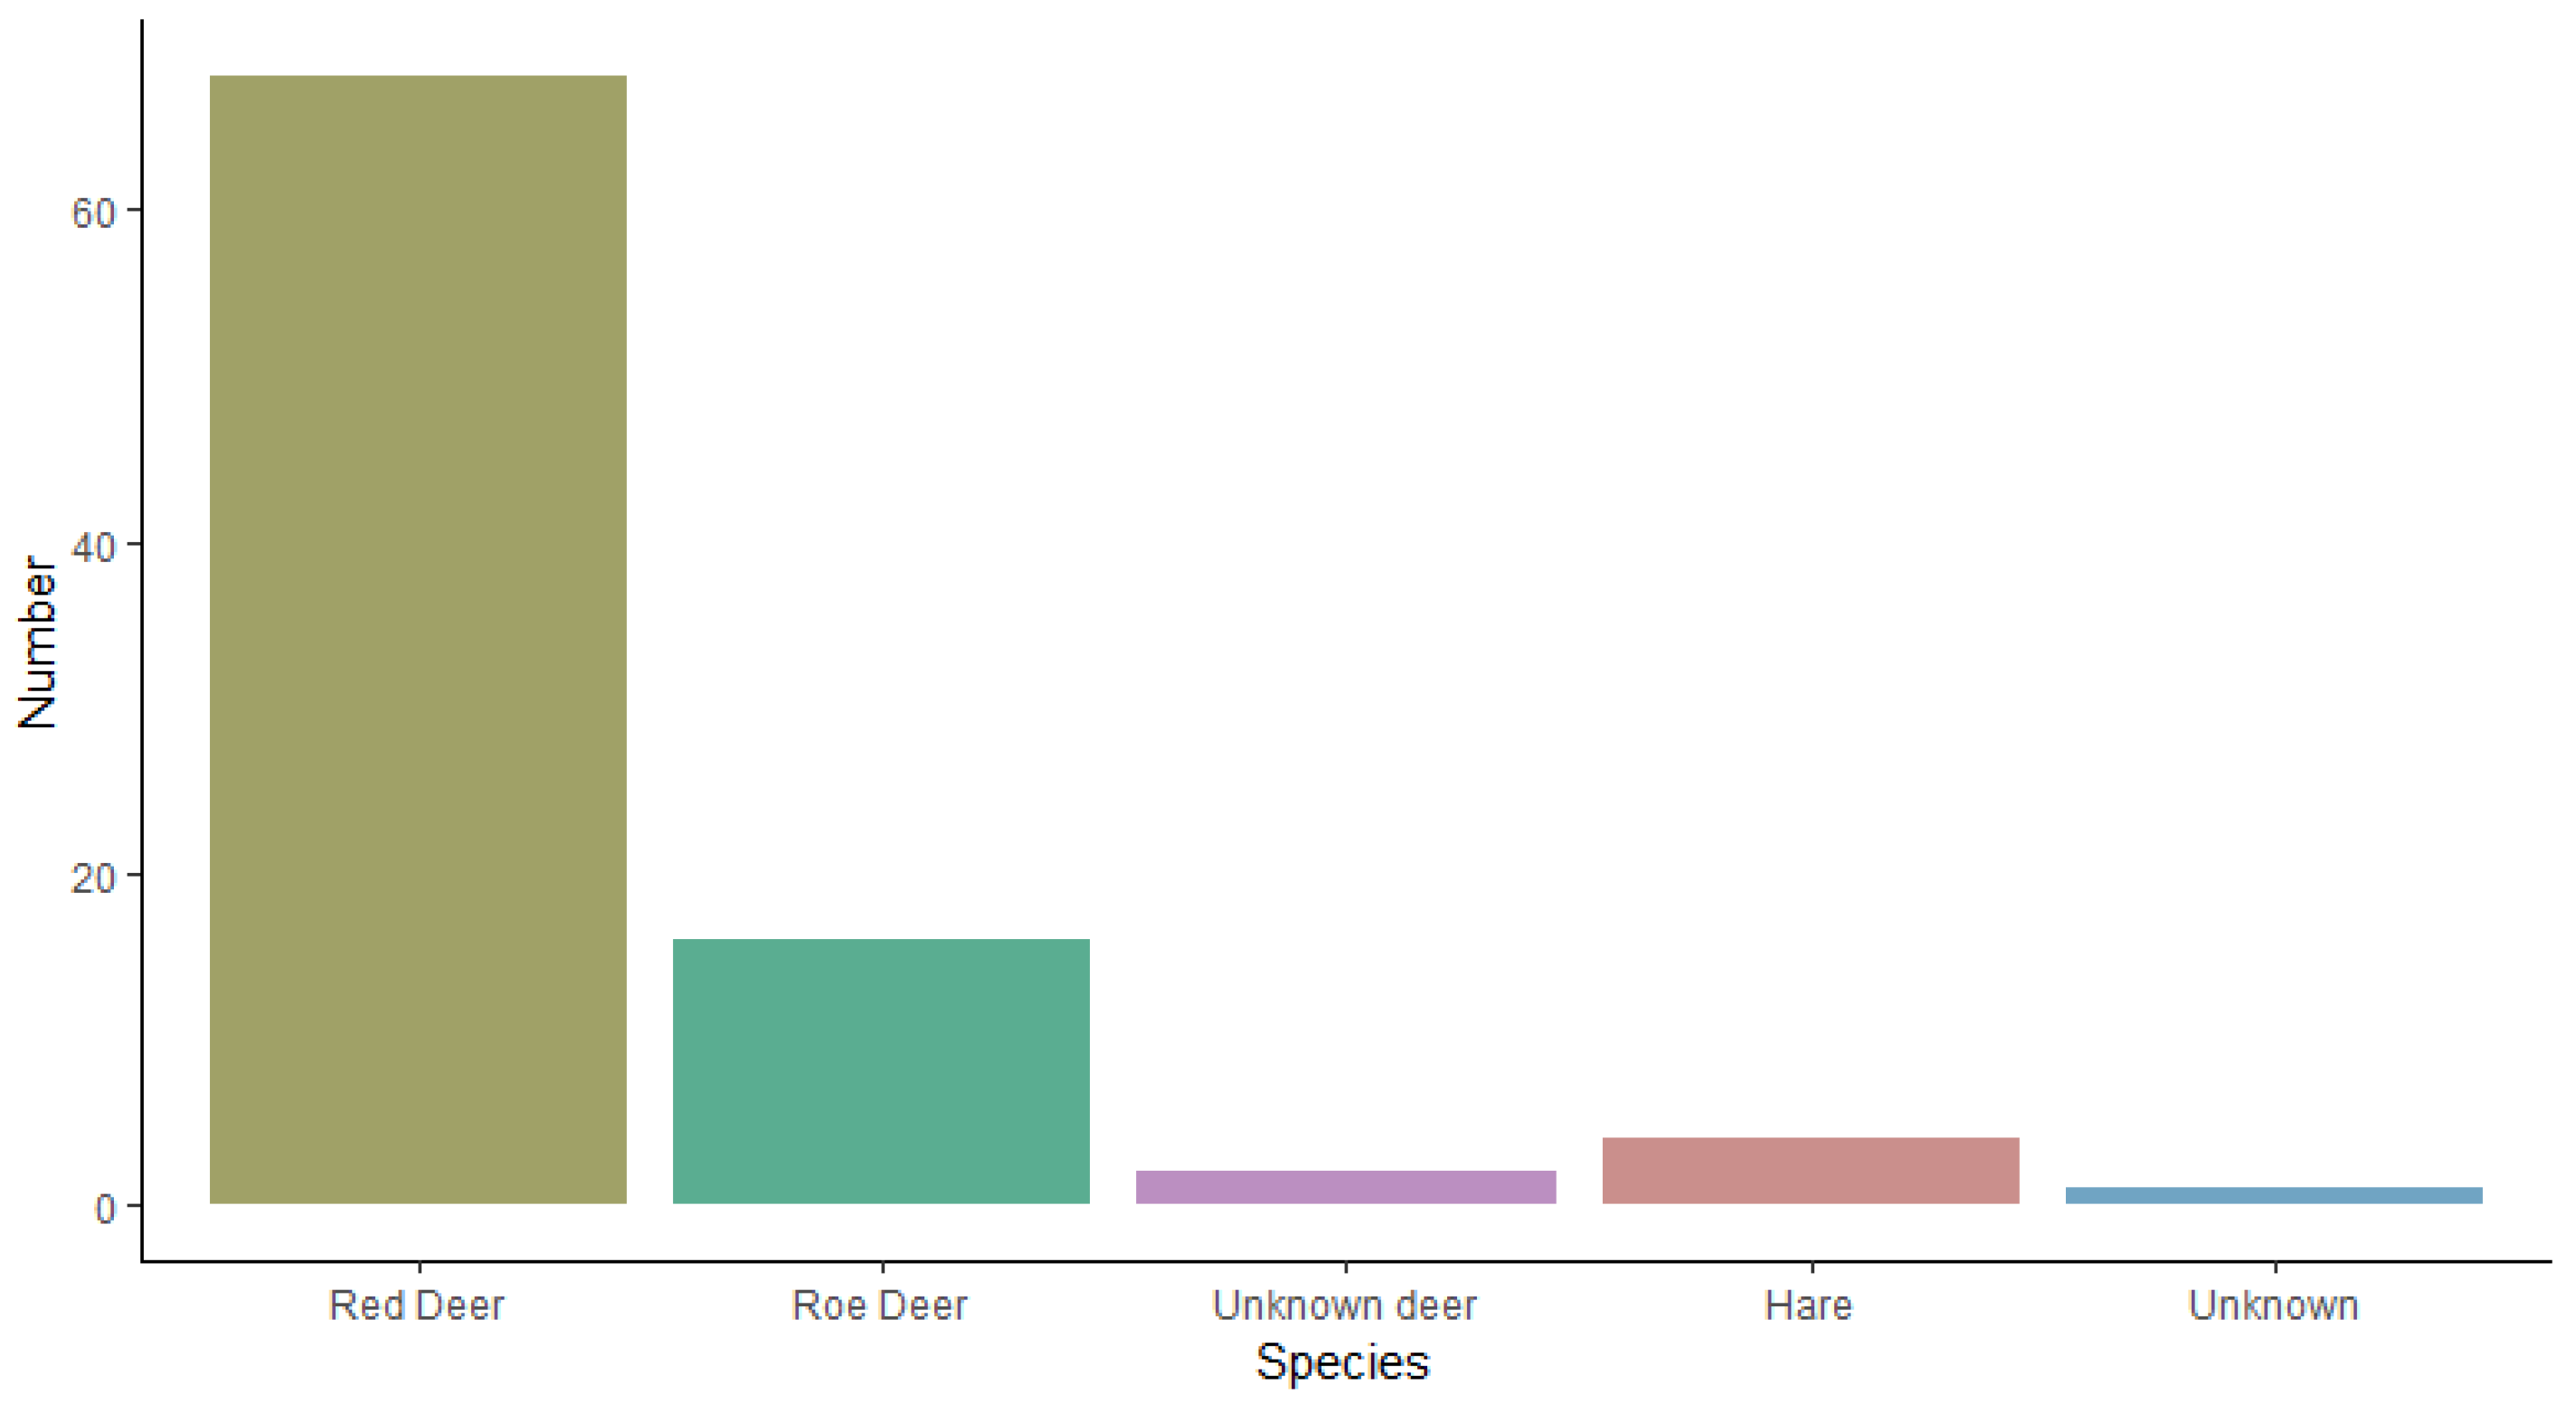
3.5. Species and Population Observed at the Moor, Lyngby Hede

In the moor, a total of 86 deer were spotted on the night of study. The most common deer species was red deer with 68 individuals (79% of deer), followed by roe deer with 16 individuals (19% of deer), and two unidentifiable deer (2% of deer). Four hares and one animal of unknown species were observed (Figure 5).

3.6. Sex and Maturity of Red Deer

Of the 68 red deer that were sighted with the drone, 10 could be identified as hinds and 8 as stags (Figure 5). The remaining 50 individuals could, without certainty, be identified to sex. A total 19 adults and nine juveniles could be recognized. The life stage of the remaining red deer could not be identified (Figure 6).

4. Discussion

4.1. The Parameters Needed for Species Recognition and Population Studies

This study was successful in the differentiation of most wild mammal species by thermal images of their body measures filmed from a drone with the camera perpendicular to the ground above the individuals at an altitude of 60–120 m. When filming animals, it is important to verify the angle of the camera. Features in the landscape such as country roads and cars could be used for estimating the size of an animal. As an additional parameter, the height of an animal could be a beneficial parameter, but images from other angles would be required in addition to the standard one taken perpendicular to the ground [46,47,48,49]. However, body length and width measures were sufficient for species identification of the mammals in this study.
Another important parameter for measuring the length of the mammals was the positioning of the individual. The standard measurements of mammals include tail length and total length [50]. For accurate measurements hereof, the individual should be standing and not laying curled up. More time spent recording individuals increases the possibility of obtaining exact measures.
The maximum amount of time the M300 UAS can fly with the equipped thermal camera, is on average, 45 min per battery, which is enough time to scan around 4 km2 for deer. Our study shows that it is beneficial to gain an overview of an area to find possible locations with animals before a closer inspection to determine sex and life stage.
One of the challenges in monitoring red and roe deer is that they forage in the same areas, and therefore it is important to find ways to distinguish between species of deer from thermal drone images. The group structure of roe deer differs throughout the year. In the summer months, roe deer tend to live alone or in family groups, while in autumn and winter, they gather in groups up to 60–70 individuals [51]. In this study, however, red deer and roe deer could be distinguished from each other by their very different body sizes, head forms and movement speeds. With sufficient data, the shapes of the heads could be measured and analyzed to show if there is a significant difference in the head shape between red deer and roe deer.
In autumn, when the study was conducted, roe deer still moved around in small groups on the moor, Lyngby Hede, and the antlers of the stags were easily recognized by the thermal camera. At other times of the year, when antlers are not present, it is not possible to differentiate between male and female red deer [22]. Jarnemo et al. [52] found that female and male red deer are normally sexually segregated outside of the rut. When the rutting season begins in early September, the male red deer form large harems and the elder stags can be recognized by their roaring, fights, and urination, while the hinds can be determined by whether or not they nurse a calf. However, a young male deer without antlers or with smaller antlers may be confused with a hind due to its size, and because young males sometimes stay with the herd [53].
In this study, the recognition of sex and life stage was possible during autumn (September to October), which is outside the period of velvet antlers. When a calf grows older, it will be more difficult to distinguish from an adult.

4.2. Disturbance by the Drone

Using drones as monitoring tools makes it important to understand when a species is disturbed by the noise and close presence of the drone. The reaction of different mammalian species to different flight altitudes showed variation in terms of both the species’ and individuals’ reactions to the drone, which is in agreement with other studies [31,54]. Of the observed species, only martens were attentive when different flight altitudes were used, but were not disturbed enough to flee. The difference in attention to the drones between species may be due to a difference in sensitivity to sound and different reactions to disturbance [54,55].
This survey demonstrates that caution should be taken not to disturb the species under investigation. Even though drones are useful and less invasive than the presence of humans, animals are still disturbed by the buzzing sound of the drones. The responses to disturbance may vary depending on context, which can affect the way the animal reacts [56]. The reactions of different mammal species may both be species-specific and geographically different. In our study, martens were more alert than badgers, but there may also be differences between mammals living in arable land and cities. Mammals living near or in cities may be used to more machine noise, and therefore less alert than mammals in areas with less noise. Also, hunting activity in an area may influence the alertness of mammals. Badgers, but not stone martens, are protected in Denmark. The altitude of the drone in this study was between 55 and 120 m above ground, which only caused the mammals minimal disturbance.

4.3. Limitations and Challenges Using Drone Survey for Monitoring Mammals

In this survey, still frames from thermal videos were used for species recognition. The more alike species are, the more difficult it is to separate them. For example, the differentiation of red deer and sika (Cervus nippon) may be a challenge. However, sika have a very limited distribution in Denmark. Also, differentiation between stone martens and other members of the Mustelidae family will require more parameters to be able to separate the species. Computational species recognition is under development [57,58]. However, this requires extensive image recognition studies of the mammal in question, as seen from drones, to provide sufficient training data for a neural network [59]. Using artificial intelligence to recognize species may be especially challenging with thermal images compared to ordinary images, which provide both a wider color spectrum and a higher pixilation than thermal images. The computational recognition of species may additionally be complicated by the species’ life stages, different body positions, different weather conditions, and the movement between different background scenarios [60,61,62,63,64,65]. Therefore, body measurement may be an alternative until image recognition is available for the recognition of nocturnal wildlife.
Vegetation cover may challenge the exact enumeration of all individuals in a population. Deer on the moor were located near densely vegetated forests. Deer are known to leave the forest at sunset to forage in open fields or along on the edges of woods, which makes it an advantage to monitor deer using thermal drones after sunset.
The risk of observing individuals more than once, which will result in overestimating the population, increases with the time it takes to cover an area with the drone. There is always a possibility that the same individual will move from one area to another. To ensure we did not observe the same individual twice, we performed a preliminary survey to scout for animals in the area before the closer inspection of individuals.
Also, challenges in drone surveys related to seasonal variations should be considered. Vegetation coverage and foliage on trees, especially during late spring, summer, and early autumn, may prevent the detection of animals in woods and dense vegetation [10]. To overcome the challenges associated with vegetation cover and visibility, distance sampling could be a useful addition.
The identification of sex and life stage is only possible at certain times of the year. In this study, red deer could be sexed by the antlers of the stags, but outside of the period during which red deer stags have antlers, differentiations of sex are difficult. Also, the recognition of offspring in a population requires surveys at times of the year when offspring are notably smaller than adults. In this study, red deer calves could be recognized by their smaller size relative to their mothers in November [66].
It can be calculated that a preprogramed mission flight, with the drone flying in a transect with an overlap of 10% in the view, will take at least 3 h to cover the 13 km2 area of Lyngby Hede. The manual flight in this study, starting with an overview and pinpointing locations with mammals before closer inspection, only took 1 h and 33 min to survey the same area. Mission flights are more time-consuming in larger areas, and may increase the risk of observing the same animals multiple times due to their movement. Furthermore, the battery power consumption would be higher during a mission flight, meaning that a larger power source or more batteries would be necessary.

5. Conclusions

Monitoring populations with drones carrying a thermal camera is efficient when seeking to recognize and count medium-sized and larger nocturnal mammals in open fields. Species of medium-sized and larger mammals may be separated by simple body measures using thermal images. This study was conducted from September to November, during which red deer may be divided by sex and life stage, and foliage and vegetation coverage are low compared to other times of the year.
For species identification, it is recommended to point the camera perpendicular to the ground to mitigate distortions resulting from the camera’s tilted angle. Alertness toward a drone is species-specific, and should be considered before monitoring wild mammals in an area.
Drone monitoring is the optimal method for monitoring, and at the right time of year, sex and life stage may be determined in red deer using this method. A thermal drone also allows for the GPS mapping of individuals, and therefore makes it possible to relate species to vegetation type and niche.

Supplementary Materials

The following supporting information can be downloaded at: https://www.mdpi.com/article/10.3390/drones7110680/s1, Video S1: Red deer stag and female with young.

Author Contributions

Conceptualization, H.L.L., E.M.E.E., K.M.-L., S.B.M., M.T.O., P.P., D.B., C.P. and S.P.; methodology H.L.L., E.M.E.E., K.M.-L., S.B.M., M.T.O.,P.P., D.B., C.P. and S.P.; software H.L.L., E.M.E.E., K.M.-L., S.B.M., M.T.O. and P.P.; formal analysis, H.L.L., E.M.E.E., K.M.-L., S.B.M., M.T.O., C.P. and S.P.; investigation, E.M.E.E., K.M.-L., S.B.M., M.T.O. and P.P.; data curation, H.L.L., E.M.E.E., K.M.-L., S.B.M. and M.T.O.; writing—original draft preparation, E.M.E.E., K.M.-L., S.B.M. and M.T.O.; writing—review and editing H.L.L., P.P., D.B., C.P. and S.P.; supervision, D.B., C.P. and S.P. All authors have read and agreed to the published version of the manuscript.

Funding

This research received no external funding.

Data Availability Statement

Data may be shared by contacting the corresponding author.

Acknowledgments

We are thankful to Tommy Hansen, Danish Nature Agency, Thy, for help with permission to fly with the drone in Lyngby Hede, and to nature photographer Morten Hilmer for permission to fly at his private property during the live stream video. We would also like to thank Karen Ankersen Sønnichsen, as a native English speaker, for providing proofreading.

Ethics

The Danish Nature Agency permitted flight with a drone on the moor, Lyngby Hede, Denmark (56.85°N, 8.30° E), at an altitude no lower than 50 m.

Conflicts of Interest

The authors declare no conflict of interest.

References

  1. Jones, J.P.; Asner, G.P.; Butchart, S.H.; Karanth, K.U. The ‘why’, ‘what’ and ‘how’ of monitoring for conservation. In Key Topics in Conservation Biology 2; Wiley Online Library: Hoboken, NJ, USA, 2013; pp. 327–343. [Google Scholar]
  2. Mitchell, C.; Fox, A.D.; Harradine, J.; Clausager, I.B. Measures of annual breeding success amongst Eurasian Wigeon Anas penelope. Bird. Study 2008, 55, 43–51. [Google Scholar] [CrossRef]
  3. Kahlert, J.; Fox, A.D.; Heldbjerg, H.; Asferg, T.; Sunde, P. Functional responses of human hunters to their prey—Why harvest statistics may not always reflect changes in prey population abundance. Wildl. Biol. 2015, 21, 294–302. [Google Scholar] [CrossRef]
  4. Christensen, T.K.; Haugaard, L. Fallow Deer in Denmark—Status for Population and Yield 2017 (in Danish Dåvildt I Danmark—Status for Betand Og Udbytte 2017). 2017. Available online: https://dce.au.dk/fileadmin/dce.au.dk/Udgivelser/Notater_2017/DAAVILDT_I_DANMARK.pdf (accessed on 8 July 2023).
  5. Webbon, C.C.; Baker, P.J.; Harris, S. Faecal density counts for monitoring changes in red fox numbers in rural Britain. J. Appl. Ecol. 2004, 41, 768–779. [Google Scholar] [CrossRef]
  6. Aubry, P.; Pontier, D.; Aubineau, J.; Berger, F.; Léonard, Y.; Mauvy, B.; Marchandeau, S. Monitoring population size of mammals using a spotlight-count-based abundance index: How to relate the number of counts to the precision? Ecol. Ind. 2012, 18, 599–607. [Google Scholar] [CrossRef]
  7. Princée, F.P.G. Ecological Models. In Exploring Studbooks for Wildlife Management and Conservation, 1st ed.; Springer: Cham, Switzerland, 2016; Volume XVII, p. 291. [Google Scholar]
  8. Delisle, Z.J.; Flaherty, E.A.; Nobbe, M.R.; Wzientek, C.M.; Swihart, R.K. Next-generation camera trapping: Systematic review of historic trends suggests keys to expanded research applications in ecology and conservation. Front. Ecol. Evol. 2021, 9, 617996. [Google Scholar] [CrossRef]
  9. Ingberman, B.; Fusco-Costa, R.; de Araujo Monteiro-Filho, E.L. Population survey and demographic features of a coastal island population of Alouatta clamitans in Atlantic Forest, southeastern Brazil. Int. J. Primatol. 2009, 30, 1–14. [Google Scholar] [CrossRef]
  10. Kays, R.; Sheppard, J.; Mclean, K.; Welch, C.; Paunescu, C.; Wang, V.; Kravit, G.; Crofoot, M. Hot monkey, cold reality: Surveying rainforest canopy mammals using drone-mounted thermal infrared sensors. Int. J. Remote Sens. 2019, 40, 407–419. [Google Scholar] [CrossRef]
  11. Ruette, S.; Stahl, P.; Albaret, M. Applying distance-sampling methods to spotlight counts of foxes. J. Appl. Ecol. 2003, 40, 32–43. [Google Scholar] [CrossRef]
  12. Garel, M.; Bonenfant, C.; Hamann, J.; Klein, F.; Gaillard, J. Are abundance indices derived from spotlight counts reliable to monitor red deer Cervus elaphus populations? Wildl. Biol. 2010, 16, 77–84. [Google Scholar] [CrossRef]
  13. Corlatti, L.; Gugiatti, A.; Pedrotti, L. Spring spotlight counts provide reliable indices to track changes in population size of mountain-dwelling red deer Cervus elaphus. Wildl. Biol. 2016, 22, 268–276. [Google Scholar] [CrossRef]
  14. Strauß, E.; Grauer, A.; Bartel, M.; Klein, R.; Wenzelides, L.; Greiser, G.; Muchin, A.; Nösel, H.; Winter, A. The German wildlife information system: Population densities and development of European Hare (Lepus europaeus PALLAS) during 2002–2005 in Germany. Eur. J. Wildl. Res. 2008, 54, 142–147. [Google Scholar] [CrossRef]
  15. Ferreira, C.M.; Sabino-Marques, H.; Barbosa, S.; Costa, P.; Encarnação, C.; Alpizar-Jara, R.; Pita, R.; Beja, P.; Mira, A.; Searle, J.B. Genetic non-invasive sampling (gNIS) as a cost-effective tool for monitoring elusive small mammals. Eur. J. Wildl. Res. 2018, 64, 46. [Google Scholar] [CrossRef]
  16. Skrbinšek, T.; Luštrik, R.; Majić-Skrbinšek, A.; Potočnik, H.; Kljun, F.; Jelenčič, M.; Kos, I.; Trontelj, P. From science to practice: Genetic estimate of brown bear population size in Slovenia and how it influenced bear management. Eur. J. Wildl. Res. 2019, 65, 29. [Google Scholar] [CrossRef]
  17. Ebert, C.; Sandrini, J.; Welter, B.; Thiele, B.; Hohmann, U. Estimating red deer (Cervus elaphus) population size based on non-invasive genetic sampling. Eur. J. Wildl. Res. 2021, 67, 27. [Google Scholar] [CrossRef]
  18. Collier, B.A.; Ditchkoff, S.S.; Raglin, J.B.; Smith, J.M. Detection probability and sources of variation in white-tailed deer spotlight surveys. J. Wildl. Manag. 2007, 71, 277–281. [Google Scholar] [CrossRef]
  19. Burton, A.C.; Neilson, E.; Moreira, D.; Ladle, A.; Steenweg, R.; Fisher, J.T.; Bayne, E.; Boutin, S. Wildlife camera trapping: A review and recommendations for linking surveys to ecological processes. J. Appl. Ecol. 2015, 52, 675–685. [Google Scholar] [CrossRef]
  20. Nakashima, Y.; Fukasawa, K.; Samejima, H. Estimating animal density without individual recognition using information derivable exclusively from camera traps. J. Appl. Ecol. 2018, 55, 735–744. [Google Scholar] [CrossRef]
  21. Chrétien, L.; Théau, J.; Ménard, P. Visible and thermal infrared remote sensing for the detection of white-tailed deer using an unmanned aerial system. Wildl. Soc. Bull. 2016, 40, 181–191. [Google Scholar] [CrossRef]
  22. Ito, T.Y.; Miyazaki, A.; Koyama, L.A.; Kamada, K.; Nagamatsu, D. Antler detection from the sky: Deer sex ratio monitoring using drone-mounted thermal infrared sensors. Wildl. Biol. 2022, 2022, e01034. [Google Scholar] [CrossRef]
  23. Rahman, D.A.; Setiawan, Y.; Wijayanto, A.K.; Rahman, A.A.A.F.; Martiyani, T.R. An experimental approach to exploring the feasibility of unmanned aerial vehicle and thermal imaging in terrestrial and arboreal mammals research. E3S Web Conf. 2020, 211, 02010. [Google Scholar] [CrossRef]
  24. Howell, L.G.; Clulow, J.; Jordan, N.R.; Beranek, C.T.; Ryan, S.A.; Roff, A.; Witt, R.R. Drone thermal imaging technology provides a cost-effective tool for landscape-scale monitoring of a cryptic forest-dwelling species across all population densities. Wildl. Res. 2021, 49, 66–78. [Google Scholar] [CrossRef]
  25. Lethbridge, M.; Stead, M.; Wells, C. Estimating kangaroo density by aerial survey: A comparison of thermal cameras with human observers. Wildl. Res. 2019, 46, 639–648. [Google Scholar] [CrossRef]
  26. Gallego, D.; Sarasola, J.H. Using drones to reduce human disturbance while monitoring breeding status of an endangered raptor. Remote Sens. Ecol. Conserv. 2021, 7, 550–561. [Google Scholar] [CrossRef]
  27. Israel, M. A UAV-based roe deer fawn detection system. Int. Arch. Photogramm. Remote Sens. 2011, 38, 1–5. [Google Scholar] [CrossRef]
  28. Dunstan, A.; Robertson, K.; Fitzpatrick, R.; Pickford, J.; Meager, J. Use of unmanned aerial vehicles (UAVs) for mark-resight nesting population estimation of adult female green sea turtles at Raine Island. PLoS ONE 2020, 15, e0228524. [Google Scholar] [CrossRef]
  29. Hodgson, J.C.; Mott, R.; Baylis, S.M.; Pham, T.T.; Wotherspoon, S.; Kilpatrick, A.D.; Raja Segaran, R.; Reid, I.; Terauds, A.; Koh, L.P. Drones count wildlife more accurately and precisely than humans. Methods Ecol. Evol. 2018, 9, 1160–1167. [Google Scholar] [CrossRef]
  30. Chabot, D.; Bird, D.M. Evaluation of an off-the-shelf Unmanned Aircraft System for Surveying Flocks of Geese. Waterbirds 2012, 35, 170–174. [Google Scholar] [CrossRef]
  31. Wilson, J.; Amano, T.; Fuller, R.A. Using Drones to Survey Shorebirds. Univ. Qld. 2022, III, 25. [Google Scholar]
  32. Pagon, N.; Grignolio, S.; Pipia, A.; Bongi, P.; Bertolucci, C.; Apollonio, M. Seasonal variation of activity patterns in roe deer in a temperate forested area. Chronobiol. Int. 2013, 30, 772–785. [Google Scholar] [CrossRef]
  33. Ensing, E.P.; Ciuti, S.; de Wijs, F.A.; Lentferink, D.H.; Ten Hoedt, A.; Boyce, M.S.; Hut, R.A. GPS based daily activity patterns in European red deer and North American elk (Cervus elaphus): Indication for a weak circadian clock in ungulates. PLoS ONE 2014, 9, e106997. [Google Scholar] [CrossRef]
  34. Fløjgaard, C.; Haugaard, L.; de Barba, M.; Taberlet, P.; Ejrnæs, R. A DNA-Based Survey of Diet Choice in Red Deer in Klelund Dyrehave. A Survey of the Spacial and Timely Variation in the Diet Choice of Red Deer (In Danish Fødevalg Hos Krondyr i Klelund Dyrehave. Undersøgelse af Den Rumlige og Tidsmæssige Variation i Krondyrenes Fødevalg). DCE National center for Environment and Energy, Aarhus University. 2016, 190, p. 60. Available online: https://dce.au.dk/udgivelser/vr/nr-151-200/abstracts/no-190-a-dna-based-study-of-food-choices-by-red-deer-in-klelund-dyrhave (accessed on 14 December 2022).
  35. Bowers, S.; Gandy, S.; Dickerson, T.; Brown, C.; Strauch, T.; Neuendorff, D.; Randel, R.; Willard, S. Evaluating velvet antler growth in red deer stags (Cervus elaphus) using hand-held and digital infrared thermography. Can. J. Anim. Sci. 2010, 90, 13–21. [Google Scholar] [CrossRef]
  36. Hedearealer mellem Lyngby og Flade Sø. Available online: https://naturstyrelsen.dk/drift-og-pleje/driftsplanlaegning/thy/omraadeplaner/hedearealer-mellem-lyngby-og-flade-soe/ (accessed on 14 December 2022).
  37. R Core Team R: A Language and Environment for Statistical Computing, version 4.2.2; R Foundation for Statistical Computing: Vienna, Austria, 2022.
  38. Wickham, H.; Averick, M.; Bryan, J.; Chang, W.; McGowan, L.D.; François, R.; Grolemund, G.; Hayes, A.; Henry, L.; Hester, J.K.; et al. Welcome to the tidyverse. J. Open Source Softw. 2019, 4, 1686. [Google Scholar] [CrossRef]
  39. Wickham, H. ggplot2: Elegant Graphics for Data Analysis; Springer: New York, NY, USA, 2016. [Google Scholar]
  40. Le, S.; Josse, J.; Husson, F. FactoMineR: A Package for Multivariate Analysis. J. Stat. Softw. 2008, 25, 1–18. [Google Scholar] [CrossRef]
  41. Kassambara, A.; Mundt, F. Factoextra: Extract and Visualize the Results of Multivariate Data Analyses. R Package Version 1.0.7. 2020. Available online: https://CRAN.R-project.org/package=factoextra (accessed on 15 July 2023).
  42. Schneider, C.A.; Rasband, W.S.; Eliceiri, K.W. NIH Image to ImageJ: 25 years of image analysis. Nat. Methods 2012, 9, 671–675. [Google Scholar] [CrossRef]
  43. Ringnér, M. What is principal component analysis? Nat. Biotechnol. 2008, 26, 303–304. [Google Scholar] [CrossRef]
  44. Bray, J.; Maxwell, S. Introduction to Multivariate Analysis of Variance. In Multivariate Analysis of Variance; Sullivan, J.L., Ed.; Sage Publications, Inc.: Newbury Park, CA, USA, 1985; Volume 54, pp. 7–13. [Google Scholar]
  45. Esri ArcGis Desktop: Release 10.8.1.4362. 2020. Available online: https://desktop.arcgis.com/en/arcmap/latest/get-started/main/get-started-with-arcmap.htm (accessed on 20 September 2022).
  46. Tarugara, A.; Clegg, B.W.; Gandiwa, E.; Muposhi, V.K.; Wenham, C.M. Measuring body dimensions of leopards ( Panthera pardus ) from camera trap photographs. PeerJ 2019, 7, e7630. [Google Scholar] [CrossRef]
  47. Marcus Rowcliffe, J.; Carbone, C.; Jansen, P.A.; Kays, R.; Kranstauber, B. Quantifying the sensitivity of camera traps: An adapted distance sampling approach. Methods Ecol. Evol. 2011, 2, 464–476. [Google Scholar] [CrossRef]
  48. Dalla Corte, A.P.; Rex, F.E.; Almeida, D.R.A.d.; Sanquetta, C.R.; Silva, C.A.; Moura, M.M.; Wilkinson, B.; Zam-brano, A.M.A.; Cunha Neto, E.M.d.; Veras, H.F. Measuring individual tree diameter and height using GatorEye High-Density UAV-Lidar in an integrated crop-livestock-forest system. Remote Sens. 2020, 12, 863. [Google Scholar] [CrossRef]
  49. Cui, S.; Chen, D.; Sun, J.; Chu, H.; Li, C.; Jiang, Z. A simple use of camera traps for photogrammetric estimation of wild animal traits. J. Zool. 2020, 312, 12–20. [Google Scholar] [CrossRef]
  50. Ansell, W.F.H. Standardisation of Field Data on Mammals. Zool. Afr. 1965, 1, 97–113. [Google Scholar] [CrossRef]
  51. Bresiński, W. Grouping tendencies in roe deer under agrocenosis conditions. Acta Theriol 1982, 27, 427–447. [Google Scholar] [CrossRef]
  52. Jarnemo, A.; Jansson, G.; Månsson, J. Temporal variations in activity patterns during rut–implications for survey techniques of red deer, Cervus elaphus. Wildl. Res. 2017, 44, 106–113. [Google Scholar] [CrossRef]
  53. Hewison, A.J.M.; Gaillard, J.M.; Angibault, J.M.; van Laere, G.; Vincent, J.P. The influence of density on post-weaning winter growth in roe deer Capreolus capreolus fawns. J. Zool. 2002, 257, 303–309. [Google Scholar] [CrossRef]
  54. Bennitt, E.; Bartlam-Brooks, H.L.A.; Hubel, T.Y.; Wilson, A.M. Terrestrial mammalian wildlife responses to Unmanned Aerial Systems approaches. Sci. Rep. 2019, 9, 2142. [Google Scholar] [CrossRef]
  55. Bracha, H.S. Freeze, flight, fight, fright, faint: Adaptationist perspectives on the acute stress response spectrum. CNS Spectr. 2004, 9, 679–685. [Google Scholar] [CrossRef]
  56. Tablado, Z.; Jenni, L. Determinants of uncertainty in wildlife responses to human disturbance. Biol. Rev. 2017, 92, 216–233. [Google Scholar] [CrossRef]
  57. Wäldchen, J.; Mäder, P. Machine learning for image based species identification. Methods Ecol. Evol. 2018, 9, 2216–2225. [Google Scholar] [CrossRef]
  58. Park, G.; Lee, Y.; Yoon, Y.; Ahn, J.; Lee, J.; Jang, Y. Machine Learning-Based Species Classification Methods Using DART-TOF-MS Data for Five Coniferous Wood Species. Forests 2022, 13, 1688. [Google Scholar] [CrossRef]
  59. Hey, T.; Butler, K.; Jackson, S.; Thiyagalingam, J. Machine learning and big scientific data. Philos. Trans. R. Soc. A 2020, 37, 20190054. [Google Scholar] [CrossRef]
  60. Lindenfors, P.; Gittleman, J.L.; Jones, K.E. Sexual size dimorphism in mammals. Sex Size Gend. Roles Evol. Stud. Sex. Size Dimorphism 2007, 16, 26. [Google Scholar]
  61. Marti, I.; Ryser-Degiorgis, M. Morphometric characteristics of free-ranging Eurasian lynx Lynx lynx in Switzerland and their suitability for age estimation. Wildl. Biol. 2018, 2018, 1–10. [Google Scholar] [CrossRef]
  62. Dawson, T.J.; Norton, M.A.; Rodoreda, S.; Abbott, S.K.; McLeod, S.R. The burden of size and growth for the juveniles of large mammalian herbivores: Structural and functional constraints in the feeding biology of juveniles relative to adults in red kangaroos, Osphranter rufus. Ecol. Evol. 2021, 11, 9062–9078. [Google Scholar] [CrossRef]
  63. Schwarz, J.M.; McCarthy, M.M. Steroid-induced sexual differentiation of the developing brain: Multiple pathways, one goal. J. Neurochem. 2008, 105, 1561–1572. [Google Scholar] [CrossRef]
  64. McPherson, F.J.; Chenoweth, P.J. Mammalian sexual dimorphism. Anim. Reprod. Sci. 2012, 131, 109–122. [Google Scholar]
  65. Swanson, E.M.; McElhinny, T.L.; Dworkin, I.; Weldele, M.L.; Glickman, S.E.; Holekamp, K.E. Ontogeny of sexual size dimorphism in the spotted hyena (Crocuta crocuta). J. Mammal. 2013, 94, 1298–1310. [Google Scholar] [CrossRef]
  66. Wang, Y.; Zhang, C.; Wang, N.; Li, Z.; Heller, R.; Liu, R.; Zhao, Y.; Han, J.; Pan, X.; Zheng, Z.; et al. Genetic basis of ruminant headgear and rapid antler regeneration. Science 2019, 364, eaav6335. [Google Scholar] [CrossRef]
Figure 1. Map of Lyngby Hede showing the area covered by the drone (red line) and the distributions of the deer observed. The black line indicates the border of the area that the Danish Nature Agency permitted the flying of the drone. The orange line is the flight path. The blue dotted line indicates the area observed by the drone. Red deer (red dots), roe deer (yellow dots), and unidentified deer (dot with tick).
Drones 07 00680 g001
Figure 2. The measurement of each different observed species. From top right: hare, red deer (stag), stone marten, badger, roe deer, and cow. A: head–body. B: hip width. C: waist width. D: shoulder width. E: total length.
Drones 07 00680 g002
Figure 3. PCA ordination (PC1 the highest variation among parameters, PC2 the second highest variation among parameters) of body measures of adult animals from frame thermal images. The numbers of individuals are badger (n = 7, red), cow (n = 19, blue), hare (n = 1, green), stone marten (n = 6, purple), red deer (n = 6, orange), and roe deer (n = 6, yellow).
Drones 07 00680 g003
Figure 4. A still frame from the thermal video (S1) taken 19 October 2022 showing, from left to right, a hind with a calf, in the middle a stag red deer with antlers and a hind with a suckling calf.
Drones 07 00680 g004
Figure 5. Species observed with the thermal drone in the Lyngby Hede moor labeled as red deer (dust green), European roe deer (green), unknown deer (purple), hare (red), and unidentified species (blue).
Drones 07 00680 g005
Figure 6. (A) Of the deer that could be identified as male, female or calf (n = 28), 11 were females (Red), 8 were male (green), and 40 were not identified (blue). (B) The number of adults was 19, with 9 calves (juveniles), and 40 could not be identified (blue).
Drones 07 00680 g006
Table 1. Disturbance in different species investigated based on different flight altitude in meters (m) and noise levels from the drone measured in decibel (dB).
SpeciesAttentiveFleeingAltitude (m)dBObserved Change
Marten 1NoNo12055
YesNo10955Froze
Marten 2NoNo90–120~61.5–55
YesNo8060Froze
Marten 3NoNo60–12060–55
YesNo55~61.5Froze
HareYesNo11655Ears moving
BadgerNoNo12055
NoNo11055
NoNo10055
NoNo9057.5
NoNo7060
NoNo55~61.5
Disclaimer/Publisher’s Note: The statements, opinions and data contained in all publications are solely those of the individual author(s) and contributor(s) and not of MDPI and/or the editor(s). MDPI and/or the editor(s) disclaim responsibility for any injury to people or property resulting from any ideas, methods, instructions or products referred to in the content.

