
A Modified YOLOv8 Detection Network for UAV Aerial Image Recognition

1
College of Big Data Statistics, Guizhou University of Finance and Economics, Guiyang 550025, China
2
Key Laboratory of Advanced Manufacturing Technology, Ministry of Education, Guizhou University, Guiyang 550025, China
*
Author to whom correspondence should be addressed.
Drones 2023, 7(5), 304; https://doi.org/10.3390/drones7050304
Submission received: 9 April 2023
/
Revised: 27 April 2023
/
Accepted: 2 May 2023
/
Published: 5 May 2023
(This article belongs to the Section Innovative Urban Mobility)
Abstract
:UAV multitarget detection plays a pivotal role in civil and military fields. Although deep learning methods provide a more effective solution to this task, changes in target size, shape change, occlusion, and lighting conditions from the perspective of drones still bring great challenges to research in this field. Based on the above problems, this paper proposes an aerial image detection model with excellent performance and strong robustness. First, in view of the common problem that small targets in aerial images are prone to misdetection and missed detection, the idea of Bi-PAN-FPN is introduced to improve the neck part in YOLOv8-s. By fully considering and reusing multiscale features, a more advanced and complete feature fusion process is achieved while maintaining the parameter cost as much as possible. Second, the GhostblockV2 structure is used in the backbone of the benchmark model to replace part of the C2f module, which suppresses information loss during long-distance feature transmission while significantly reducing the number of model parameters; finally, WiseIoU loss is used as bounding box regression loss, combined with a dynamic nonmonotonic focusing mechanism, and the quality of anchor boxes is evaluated by using “outlier” so that the detector takes into account different quality anchor boxes to improve the overall performance of the detection task. The algorithm’s performance is compared and evaluated on the VisDrone2019 dataset, which is widely used worldwide, and a detailed ablation experiment, contrast experiment, interpretability experiment, and self-built dataset experiment are designed to verify the effectiveness and feasibility of the proposed model. The results show that the proposed aerial image detection model has achieved obvious results and advantages in various experiments, which provides a new idea for the deployment of deep learning in the field of UAV multitarget detection.
1. Introduction
The combination of UAV aerial imagery and deep learning detection technology has become a hot research direction today [1,2,3]. Due to the characteristics of maneuverability and flexibility, and the ability to overcome the limitations of natural conditions such as the environment and terrain, UAV monitoring has the advantages of a wide monitoring area, high efficiency, and low cost [4,5]. However, deep learning models have always been difficult to deploy in practical UAV object detection tasks [6,7,8]. The reasons are mainly due to two points: on the one hand, the aerial photography images of UAVs are different from ground photography and have the characteristics of large scenes, small targets, being multiscale, having complex backgrounds [9], and overlapping occlusions [10,11,12]. It is difficult to accurately detect specific objects; on the other hand, such detection tasks often require the realization of inference processes in embedded devices and have high requirements for accuracy and real-time performance. Complex object detection models are difficult to deploy in edge devices, and lightweight object detectors have difficulty improving accuracy [13,14,15]. These factors hinder the development of deep learning methods in the field of UAV multitarget detection. In June 2021, at the Global Artificial Intelligence Technology Conference 2021 (GAITC 2021), the Tencent Youtu Lab, and Xiamen University Artificial Intelligence Research Institute officially released the “Top Ten Artificial Intelligence Trends in 2021”, pointing out that meeting low edge-end models with computational complexity and small model size will gradually become a new tool for enterprises to reduce costs and increase efficiency. It is foreseeable that in the future, increasingly more intelligent enterprises will face a new stage, from rapid expansion in the early stage to efficient operation, and in this process, the marginalized deployment of deep models will undoubtedly become an important means for them. Therefore, it is of great practical significance to design a model that takes into account both detection accuracy and light weight to compensate for the bottleneck of deep learning in the application of UAV aerial images. This paper focuses on the above problems and improves the versatility and effectiveness of a multitarget detection model of UAV aerial images.
The following are the main contributions of this work:
- From the perspective of paying attention to large-size feature maps and introducing the idea of Bi-PAN-FPN, this work improves the detection ability of the model for small targets, and at the same time increases the probability and time of multiscale feature fusion to obtain better feature engineering. This solves the common problem of easy misdetection and missed detection of small targets in aerial images;
- Optimizes the backbone network and loss function of the model. The Ghostblock unit and Wise-IoU bounding box regression loss are integrated to improve the generalization performance of the model from the perspectives of feature diversity, long-distance capture of feature information, and avoidance of excessive penalty of geometric factors. Suppresses the number of parameters of the model while improving the accuracy of the model. This solves the long-range information loss problem and the balance problem of predicting anchors;
- The feasibility and effectiveness of the constructed model are verified using ablation experiments. Compared with the original benchmark network, the MAP performance of the model on the international open-source dataset VisDrone2019 is improved by 9.06% (test set), the number of parameters is reduced by 13.21% (test set), and the comprehensive ability is improved significantly.
- The proposed model is compared with six current most mainstream and advanced deep object detection models to prove the superiority of our proposed model. Furthermore, comparing the interpretability of three excellent models illustrates the reason for the superiority of this method.
The rest of this paper is organized as follows: Section 2 reviews previous related work. Section 3 presents an improved aerial image detection model and details the structure and working mechanism of the model. Section 4 first introduces the experimental environment and parameter settings and then conducts ablation experiments, comparison experiments, and interpretability experiments on the international open-source dataset VisDrone2019 to comprehensively verify the feasibility of the proposed method. Section 5 summarizes the results of the full text and looks forward to future research directions.
2. Related Work
Target detection from the perspective of UAVs faces many challenges while being widely used, which has profound practical and research significance. With the continuous progress of target detection technology, some effective methods have emerged for UAV image detection tasks [16,17,18,19,20]. For example, reference [16] proposed a drone image object detection method called UFPMP-Net. In this method, considering the characteristics of UAV datasets that are small in scale and single-scene compared with natural image datasets, the unified foreground packing (UFP) module was designed to cluster the subregions given by the coarse detector to suppress the background. The resulting images were thereafter assembled into a mosaic for single inference, which significantly reduced the overall time cost and improved the accuracy and efficiency of the detector. Reference [17] aimed at the problem of small target detection in UAV images, proposing a high-resolution detection network (HRDNet). This network solved the problem that high-resolution images input to the network can lead to increased computational cost. The network uses two feature fusion methods, a multidepth image pyramid network (MD-IPN) and a multiscale feature pyramid network (MS-FPN), to fully optimize feature engineering. It feeds high-resolution features into a shallow network to reduce computational cost, while low-resolution features are fed into a deep network to extract more semantics. This processing method enables the network to improve accuracy in high-resolution image training mode and reduce the harsh requirements for hardware. Reference [18] proposed a cross-modality fusion transformer (CFT) combined with an attention mechanism, an efficient cross-modal feature fusion idea. This method extracts image features based on the transform architecture, which enables the network to focus on global contextual features. In addition, by designing an attention mechanism, the network can simultaneously perform intramodal and intermodal fusion. This significantly improves the comprehensive performance of multispectral target detection in aerial images. Experiments show that the method has excellent generalization ability and robustness in a large number of datasets. Reference [19] observed that the targets under aerial photography have the characteristic of high clustering. It proposed a clustered detection (ClusDet) network, which completes the end-to-end detection process by designing a cluster proposal subnetwork (CPNet), a scale estimation subnetwork (ScaleNet), and a dedicated detection network (DetecNet). When monitoring begins, the network focuses on aggregated regions rather than directly detecting individual targets. After that, it is cropped and sent to the fine detector for further detection, which solves the problem of small target aggregation and uneven distribution in UAV images to a certain extent. Reference [20] proposed a feature fusion and scaling-based single shot detector (FS-SSD) to quickly and accurately detect small objects from aerial angles. The method was based on the SSD detector, which adjusts the feature fusion module by adding an extra branch of the deconvolution module and average pooling to form a special feature pyramid. In addition, the method combines the spatial relationship of objects with the detection task, which further improves the detection accuracy.
Although advanced target detection methods have played a crucial role in promoting UAV multitarget detection tasks, most of these methods require huge memory overhead and computing requirements, and it is difficult to directly deploy in low-power image processors, such as edge devices. The emergence of YOLO series detection networks has solved this problem. This series of models has currently iterated through eight official versions and multiple branch versions [21]. The standard YOLO model can usually be divided into three parts: backbone, neck, and head. Among them, backbone is a feature extraction network which is used to extract feature information from images [22,23]; neck can fuse the features extracted from backbone, making the features learned by the network more diverse and improving the performance of the detection network; head can make accurate predictions by utilizing previous high-quality feature engineering. Almost every generation of YOLO models has made corresponding improvements and enhancements in these three structures. Due to their outstanding performance in detection accuracy and speed, the YOLO series models have been widely used in industries, remote sensing, transportation, medicine, and other fields [24]. At present, scholars have conducted corresponding research on the application of YOLO and other lightweight models in the field of UAV aerial image recognition [25,26,27,28]. For example, in reference [25], aiming at the contradictory problem that the resources of the UAV deployment platform are limited but the requirements for real-time reasoning are relatively high, an adaptive model compression method was proposed to reduce the number of parameters and computation of the model. By designing a “transfer factor” in the process of model pruning, this method can judge whether to prune a certain type of channel through the scale factor and can appropriately suppress the effect of pruning on the subsequent structure through the transfer factor. Thus, the model can automatically prune the convolutional layer channels. The method is validated in the YOLOv3-SPP3 model. Reference [26] focused on improving the inference speed of the deep model by comparing the accuracy and real-time performance of several common detection frameworks; the UAV aerial image detection model UAV-Net was finally built on the basis of SSD. Due to the improvement of the backbone and neck and the use of the automatic pruning method, the size of the model is only 0.4 MB, which has excellent universality. To address the balance between detection accuracy and computational cost, reference [27] proposed a new large-scale marine target detection method for UAVs based on YOLOv5. On the one hand, the algorithm introduces the transformer idea to enhance feature engineering, which improves the detection accuracy of small objects and occluded objects; on the other hand, the use of linear transformation with a simple structure and fast calculation replaces part of the convolution structure, reducing the number of parameters of the model. The experimental results show that compared with other advanced models, this method has certain advantages in detection accuracy, recall rate, average precision, and number of parameters. Reference [28] proposed an insulator defect detection method that integrates mobile edge computing and deep learning. This method is based on the YOLOv4 detector and uses the lightweight network MobilieNetv3 to replace the original backbone, which greatly reduces the network parameters. In addition, by improving the activation function in MobilieNetv3 and optimizing the loss function of the model, the comprehensive quality of model checking is further improved. In addition, due to the introduction of the particle swarm optimization idea, the algorithm can efficiently split the deep neural network within limited time and computing resources.
3. Improved Aerial Image Detection Model
In this paper, a UAV aerial image detection model with both detection accuracy and speed is constructed from the following three aspects: First, aiming at the common problem that small targets in aerial images are prone to misdetection and missed detection, the path aggregation network-feature pyramid networks (PAN-FPN) in YOLOv8 is replaced with bidirectional path aggregation network-feature pyramid networks (Bi-PAN-FPN), and an upsampling process is added to focus on small target features. By fully considering and reusing multi-scale features, we achieve more advanced and comprehensive feature fusion while maintaining parameter costs as much as possible. Second, considering that a small number of parameters have been added in the improvement of FPN, it is proposed to use the GhostblockV2 structure to replace some C2f modules in backbone, which suppresses information loss during long-distance feature transmission while significantly reducing the number of model parameters. Finally, the bounding box regression loss replaces CIoU loss in WiseIoU loss with WiseIoU loss. It incorporates a dynamic nonmonotonic focusing mechanism to evaluate anchor box quality by using “outlier” so that the detector takes into account anchor boxes of different qualities and improves the overall performance of the detection task.
3.1. Improvement of the Neck
In YOLOv8, feature maps are divided into five types of scale features in descending order, which are represented as B1–B5, P3–P5, and N4–N5 in backbone, FPN [29], and PAN [30] structures, respectively. The PAN-FPN structure used by the original YOLOv8 is a complement to the traditional FPN, which uses a top-down form to transfer deep semantic features. By fusing B3–P3 and B4–P4, the feature pyramid is semantically enhanced, resulting in a certain degree of loss of positioning information. PAN-FPN supplements the bottom-up structure behind the FPN, and the fusion of P4–N4 and P5–N5 is used to strengthen the learning of localization features to achieve a complementary effect. However, there is room for improvement when such a structure is applied to small target object detection: on the one hand, due to the lack of attention to large-scale feature maps, the detection model may ignore some useful features and reduce the detection quality; on the other hand, even if the fusion and supplementation of B, P, and N features are considered, the reuse rate of features is low, and the original features lose some information after a long upsampling and downsampling path. Therefore, the following adjustments were made to the neck structure for the UAV aerial photography dataset:
First, we refocused on large-scale feature maps. An upsampling process was added to the FPN and fused with the B2 layer features in backbone to improve the detection effect of small targets. Similar to the previous upsampling process in FPN, the C2f module was used to further improve the quality of feature extraction after feature fusion. The C2f module is an improvement on the original C3 module, which mainly refers to the advantage of the ELAN structure in YOLOv7 with richer gradient information. This module reduces one standard convolutional layer and makes full use of the bottleneck module to expand the gradient branch to obtain richer gradient flow information while ensuring light weight. Its basic structure is shown in Figure 1.
Second, we introduced the idea of Bi-PAN-FPN [31]. The core idea of this structure is to improve the probability and times of multiscale feature fusion to obtain higher detection accuracy. Its implementation steps are as follows: For feature maps with only one input path, no other processing is performed. Normally, such features have a low contribution to feature engineering. For feature maps with two input paths, if the size of the feature maps is the same, an additional path is added from the features in backbone, and the features in PAN are fused. Such a processing method does not add additional parameter cost. Finally, treat each bidirectional (top–bottom and bottom–top) path as a unit and reuse this unit multiple times to improve blending. Considering the light weight of the model, only extra paths of B3–N3 and B4–N4 were added here, and only one unit was used. This process can be expressed as follows:
where C2f and Conv are the corresponding module operations; B, P, and N correspond to the feature maps at backbone, FPN, and PAN, respectively; represents the number of uses of C2f; and takes the value three or four. The structure of the entire neck is shown in Figure 2.
3.2. Improvement of the Backbone
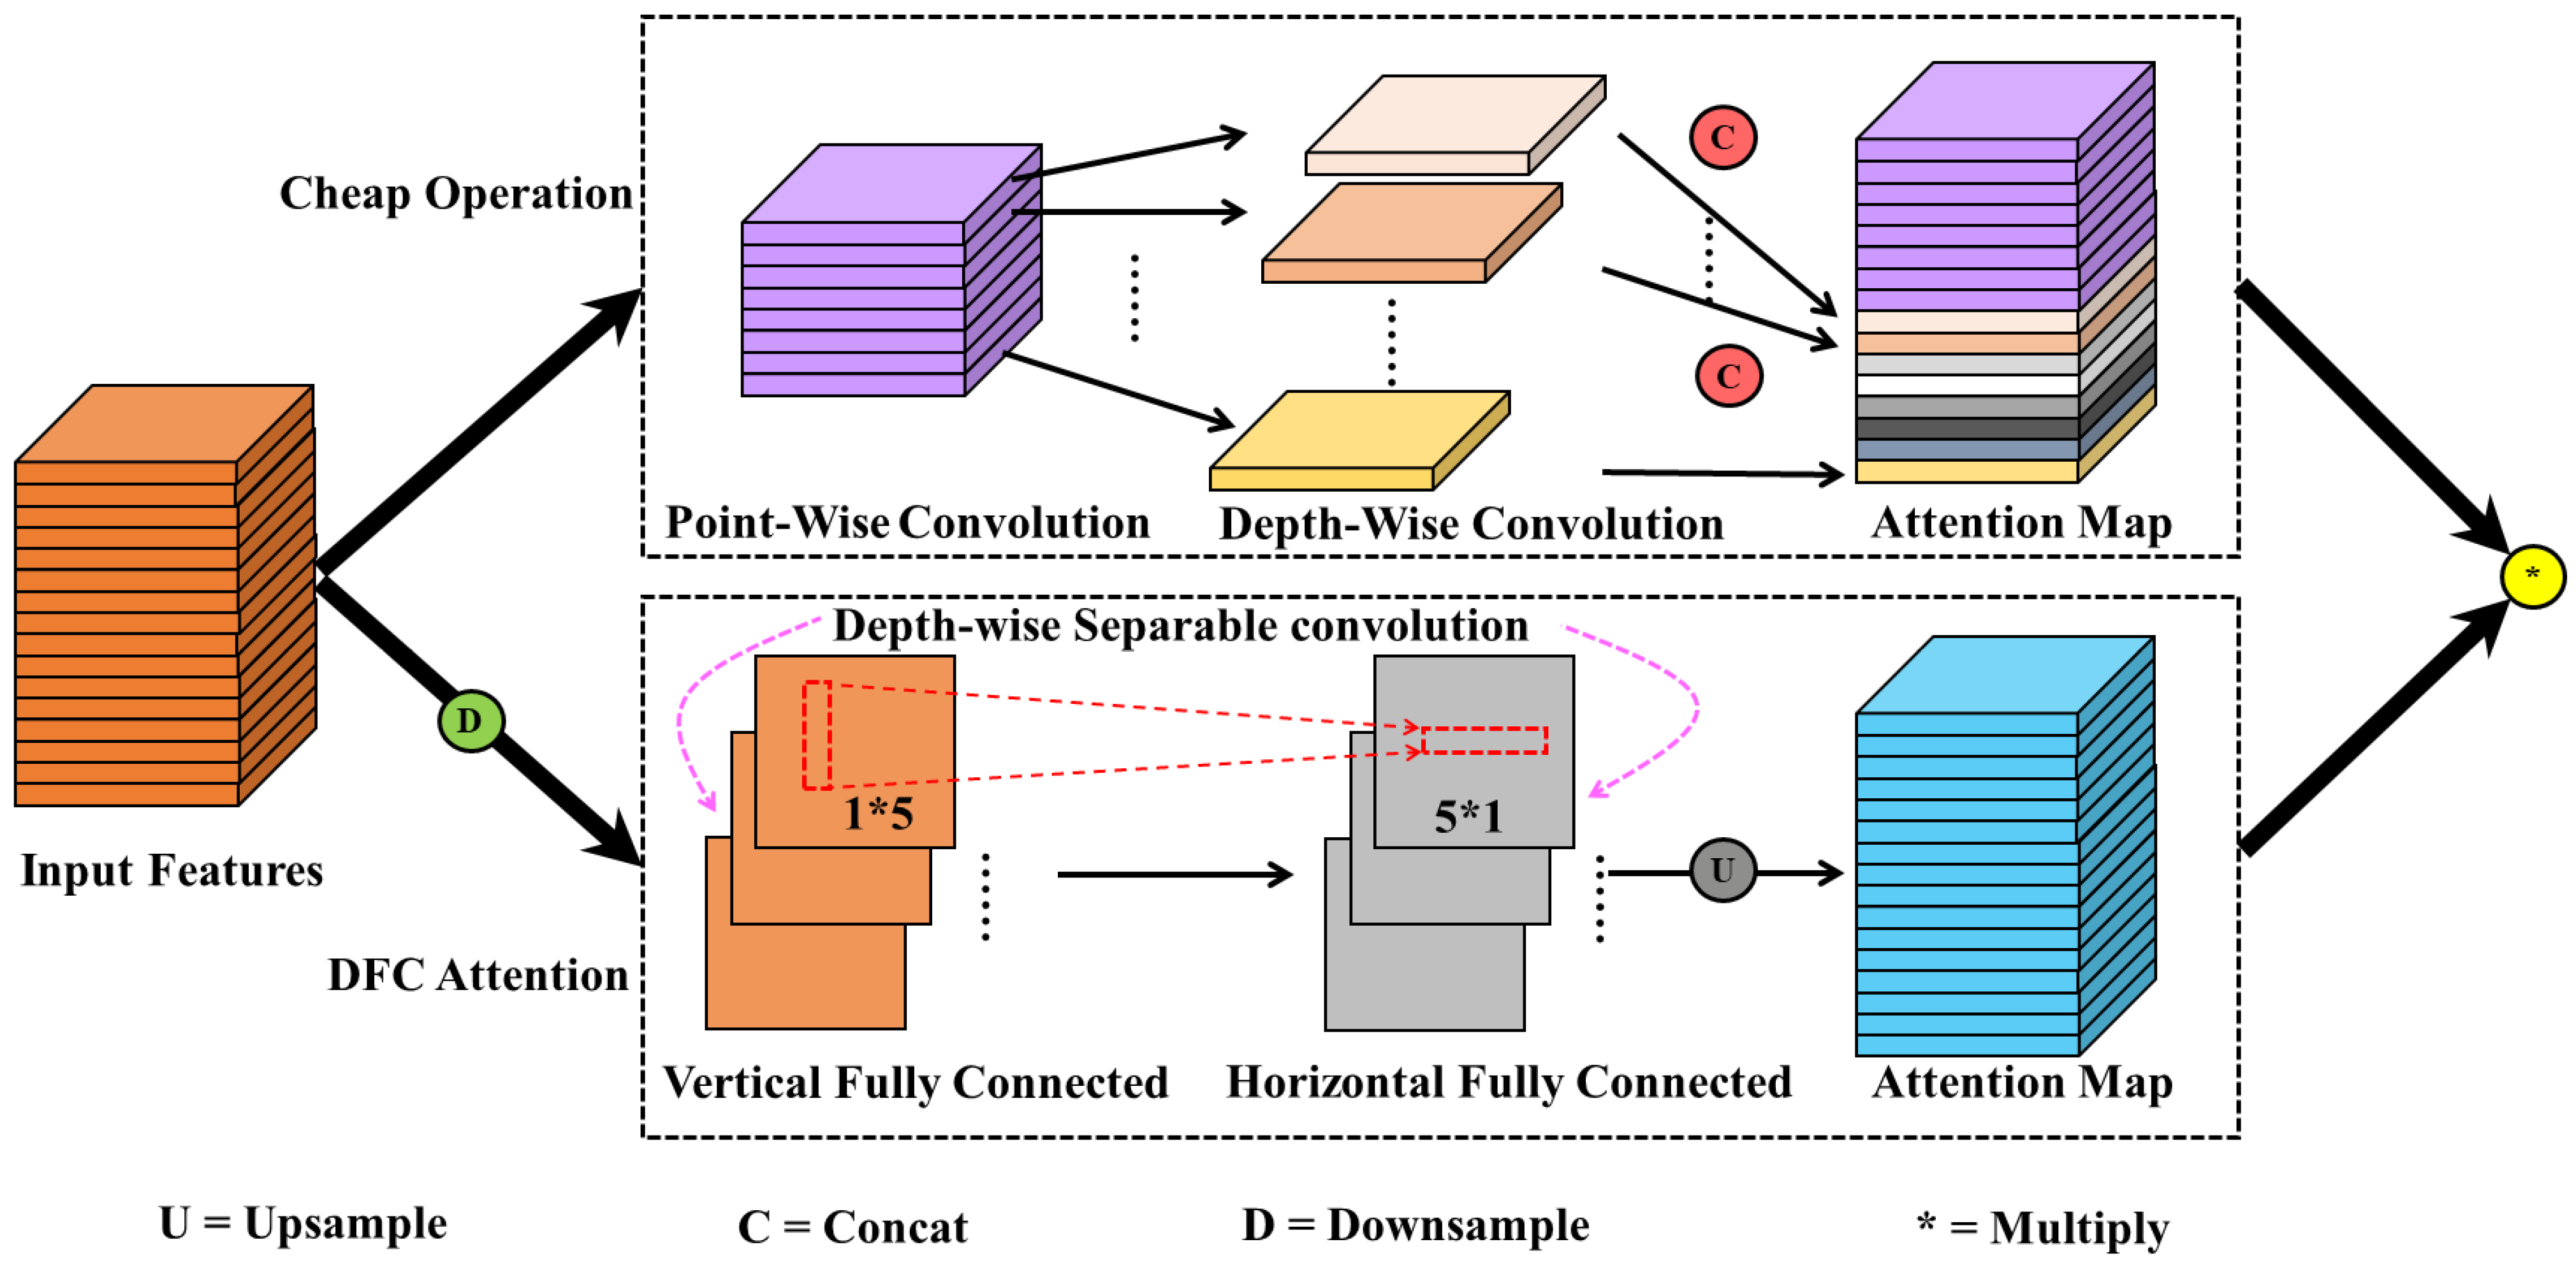
The conventional convolution module and C2f module were used in YOLOv8 to achieve high-quality feature extraction and downsampling of images. However, due to the addition of an upsampling process in the neck part and the use of Bi-PAN-FPN, the number of parameters and complexity of the model were increased to a certain extent. This article will introduce the Ghostblock idea in backbone and use this structure to replace some C2f modules. Ghostblock is an optimization method for lightweight convolution GhostNet [32]. Its advantages are mainly reflected in two parts. On the one hand, Ghostblock follows the essence of GhostNet. It first uses conventional convolution to generate the original feature map and then combines various linear transformation operations to enhance the feature map’s information. This ensures feature diversity while efficiently extracting features. On the other hand, a decoupled fully connected (DFC) attention mechanism is proposed [33]. Through its particularity, this mechanism avoids the limitations of traditional attention algorithms in terms of computational complexity and captures feature information over long distances. The advantages of the structure improve the quality of feature engineering of the entire structure. Specifically, the convolution form used in GhostNet is called the cheap operation. Its implementation process is shown in Equations (3) and (4):
where , ; represents pointwise convolution; represents depth-wise convolution; and . Unlike conventional convolution, at the beginning of the implementation of the cheap operation, only pointwise convolution is considered to obtain a feature map smaller than the actual output standard in proportion (one-half by default), and then depth-wise convolution acts on these feature maps to achieve a linear transformation process. Finally, the feature maps of the two steps are spliced to obtain the output result. This processing method significantly reduces the parameter cost and computational cost by reusing features and discards redundant information that may exist in conventional convolutions. However, the drawbacks of doing so are also obvious: pointwise convolution loses the interaction process with other pixels in space, which results in only the feature map obtained using depth-wise convolution capturing spatial information. The representation of spatial information will be significantly weakened, thus affecting the detection accuracy of the model. In addition, the convolutional structure can only focus on local information, but the self-attention mechanism that can focus on global information can easily increase the complexity of the model.
The DFC attention mechanism can improve the above problems well. The core idea is to directly use a deeply separable structure with a simple structure to obtain the attention map with global information. The specific calculation process is shown in Equations (5) and (6).
where , which is consistent with the input in Equation (3); is a depth-wise separable convolution process divided into horizontal () and vertical () directions; is the attention map in the vertical direction; is the attention map based on in the horizontal direction. The decoupling of the two directions greatly simplifies the process of extracting global information of features. At the same time, due to the use of deep separable structures such as and , the complexity of the DFC is greatly reduced (full connection: ; DFC: ). Ghostblock combines cheap operation with DFC, which greatly reduces the complexity of the model while taking into account the global information of features. Its structure is shown in Figure 3.
3.3. Improvement of the Loss Function
Due to the use of the anchor-free idea, the loss function of YOLOv8 has been greatly changed from that of the YOLOv5 series. Its optimization direction consists of two parts, namely, classification and regression. The classification loss still uses binary cross entropy loss (BCEL), and the regression part uses distribution focal loss (DFL) and bounding box regression loss (BBRL). The complete loss function can be expressed as:
Among them, the prediction category loss is essentially the cross entropy loss, and the expression is:
where is the number of categories; denotes the weights for each class; and is the probability value after sigmoid activation. DFL is an optimization of the focal loss function, which generalizes the discrete results of classification into continuous results through integration. The expression is:
where , represents the values from the left and right sides near the consecutive labels , satisfying , ; among the equation, P can be implemented through a softmax layer, , that is, .
Different from the CIoU loss used in YoloV8, the Wise-IoU loss function is used here as the bounding box regression loss [34]. On the one hand, when the labeling quality of the training data is low, the loss function combines a dynamic nonmonotonic focusing mechanism to evaluate the quality of the anchor frame by using the “outlier” to avoid excessive penalties for geometric factors (such as distance and aspect ratio) to the model. On the other hand, when the prediction box has a high degree of coincidence with the target box, the loss function makes the model obtain better generalization ability with less training intervention by weakening the penalty of geometric factors. Based on this, this paper uses Wise-IoU v3 with a two-layer attention mechanism and a dynamic nonmonotonic FM mechanism. Its expression is as follows:
where indicates the degree of abnormality of the predicted box, and a smaller degree of abnormality means that the quality of the anchor box is higher. Therefore, using to construct a nonmonotonic focal number can assign small gradient gains to prediction boxes with large outliers, effectively reducing harmful gradients of low-quality training samples; and are hyperparameters. The meanings of the other parameters are shown in Figure 4. and represent the coordinate values of the prediction box, while and represent the coordinate values of the Ground truth. The corresponding H and W values represent the width and height of the two boxes, respectively. It can be seen that .
To date, the improved aerial image detection model based on Yolov8 is shown in Figure 5. Compared with the original YOLOv8, the neck, backbone, and loss functions have been improved. The specific changes are located in the graphic labels in the figure.
4. Results
4.1. Dataset and Its Preprocessing
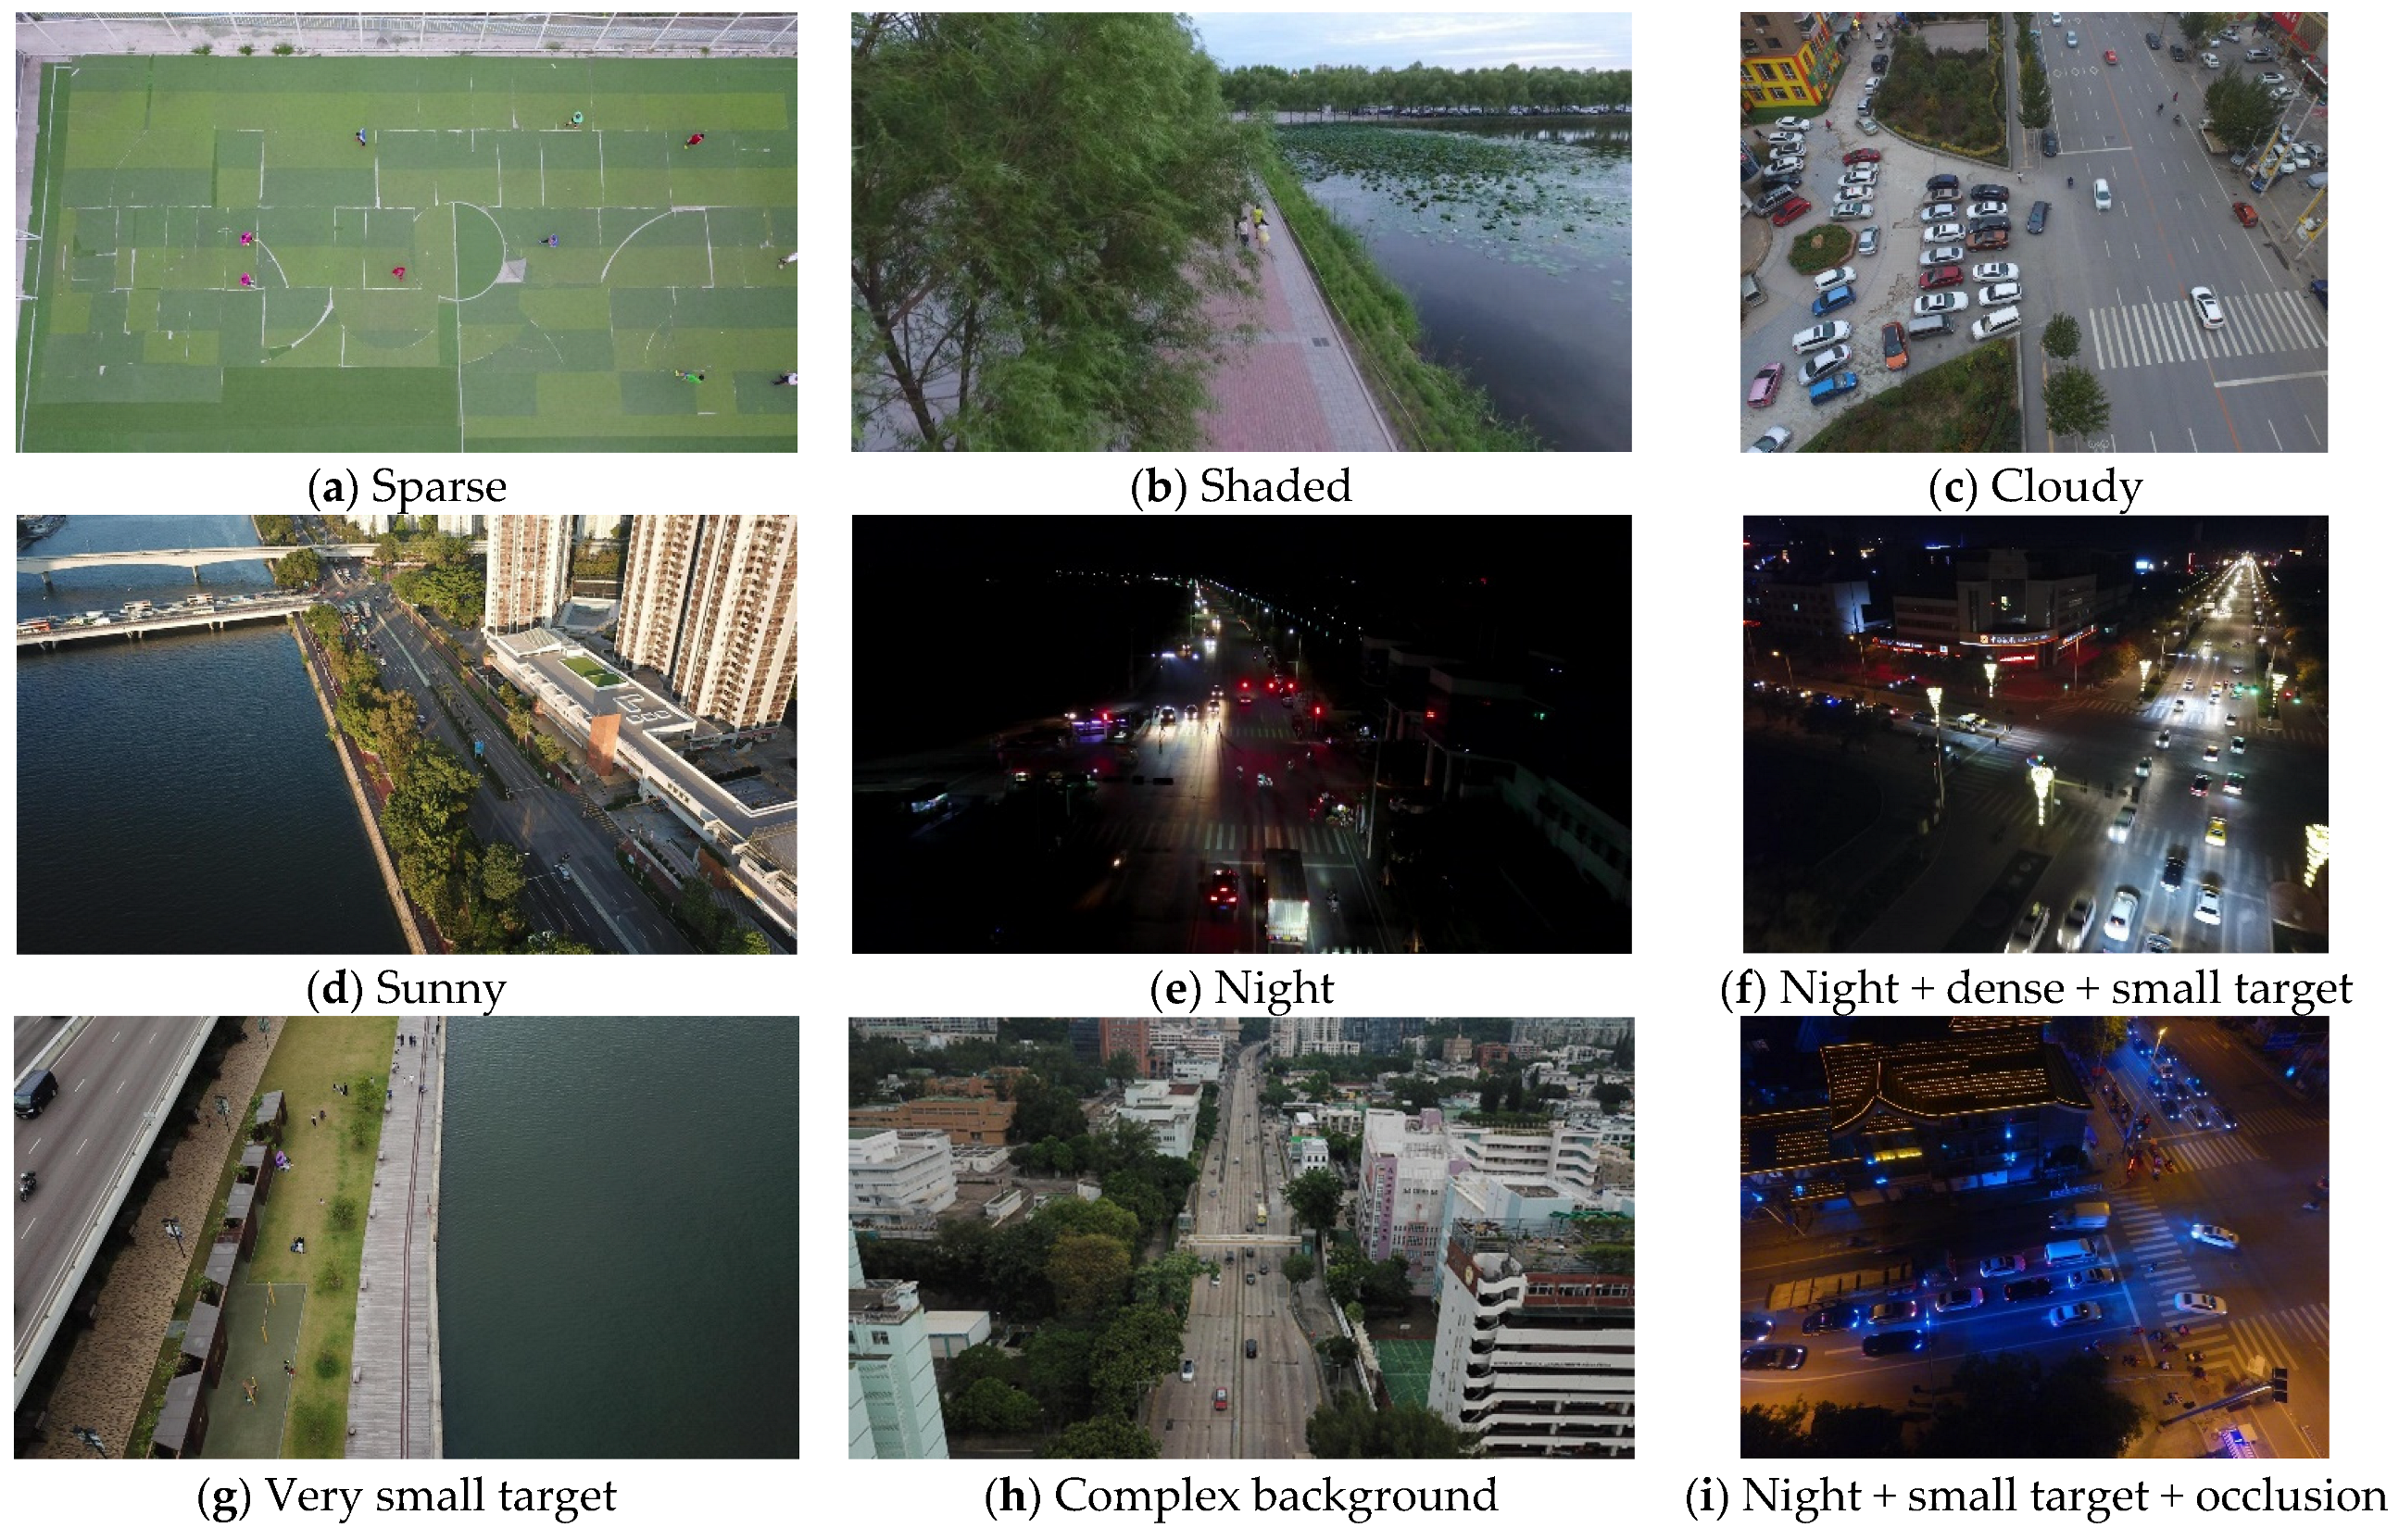
Selected for this paper, VisDrone, an authoritative dataset in the field of international drone vision, is used as an experimental verification object. At present, drones have been widely used in various fields, such as agriculture, aerial photography, and personalized monitoring. Due to the comprehensive influence of shooting angle, light, background, and other factors, intelligent understanding of UAV visual data is more difficult than conventional computer vision tasks. The VisDrone2019 dataset was collected by the AISKYEYE team at the Machine Learning and Data Mining Laboratory of Tianjin University, China [35]. This dataset consists of 288 video clips, including 261,908 frames and 10,209 still images. The dataset uses a variety of drones for multiscene, multitask shooting, including locations (taken from 14 different cities in China separated by thousands of kilometers), environments (urban and rural), objects (pedestrians, vehicles, bicycles, etc.), density (sparse and crowded scenes), weather (sunny and cloudy), and lighting conditions (day and night). Unlike conventional detection datasets, each image may contain hundreds of objects to be detected, and the dataset contains a total of 2.6 million manual annotations of bounding boxes. In addition, VisDrone provides some important attributes such as scene visibility, object class, and occlusion to improve the utilization of data in various tasks. Some data examples are shown in Figure 6.
There are 10 categories of objects in the dataset. This paper divides the entire dataset into a training set (6471 samples), validation set (548 samples), and test set (1610 samples) according to the dataset division method of the VisDrone 2019 challenge. Considering that the sample image contains a large number of small targets, to make the detection process take into account the requirements of real-time and accuracy, the sample size was normalized to 640 × 640. Such a size can make the model truly deployable to edge devices without destroying too much of the useful information of the image. In terms of hardware and software, we used an Intel(R) Core(TM) i9-12,900 K processor, 16 cores, and 24 threads, a main frequency of 3.19 GHz, 32 GB running memory, graphics processor GeForce RTX 3090Ti, and 24 GB video memory; the deep learning model framework used Pytorch1.9.1 and Torchvision 0.10.1; YOLOV8’s benchmark version was Ultralytics 8.0.25. To ensure the fairness and comparability of the model effects, all ablation experiments and various model training processes in the comparison experiments did not use any pretraining weights. In addition, considering that only edge devices can be used to realize real-time target detection and reasoning on UAVs, such limitations require a small number of model parameters, less memory occupation, and a short inference time. Therefore, YOLOv8-s was used as the benchmark model for improvement and promotion. This model follows all the ideas of the v8 series and is only scaled in network width and depth. The important parameters of the training process were set as shown in Table 1. In the table, image scale, image flip left-right, mosaic, and image translation are all data enhancement methods, and the following parameters indicate the probability of their occurrence.
4.2. Ablation Experiment
The aerial image detection model designed in this paper mainly improves the neck and backbone parts of the benchmark model (YOLOv8-s) and uses WiseIoU instead of CIoU as the bounding box regression loss in the final loss function. To systematically analyze the improvement of the model performance of each unit, the benchmark model A, the improved model A + B (neck), the improved model A + B + C (neck, backbone), and the improved model A + B + C + D (neck, backbone, loss function) are defined in turn, and the changes in the evaluation indicators of the four models are quantitatively explored. The experiment used precision rate (P), recall rate (R), average precision (AP), mean value of average precision (mAP), frames per second (FPS), number of parameters, and model size as evaluation indices. The experimental results of the model on the validation set and test set are shown in Table 2 and Table 3 and Figure 7.
Summarizing the subcategory results and overall results in Table 2 and Table 3 and Figure 7, the following conclusions can be drawn:
- The A model (i.e., the benchmark model) performed poorly. Its accuracy indicators were in the lowest position, but the FPS was in the first place, reaching 182/f.s−1. This indicates that even if the number of model parameters was reduced (only 9.659 million) in the improved model, it would still increase the number of network layers and some inference time. The FPS index of the improved model reached 167/f.s−1, which can also ensure real-time requirements in actual deployment.
- After integrating the B, C, and D structures, the model improved performance in several aspect—focusing on small target features, multiplexing multiscale features, suppressing information loss during long-range feature transmission, and taking into account anchor boxes of different qualities, feature engineering was significantly strengthened. This can be seen from each single-category indicator. In most cases, whenever a structure was added, the performance of the P, R, and AP indicators of the model were improved to a certain extent. However, after incorporating the D structure, the model’s indicator data in some categories were not as good as before. That is, in some cases, A + B + C was better than A + B + C + D, but this did not affect the overall trend.
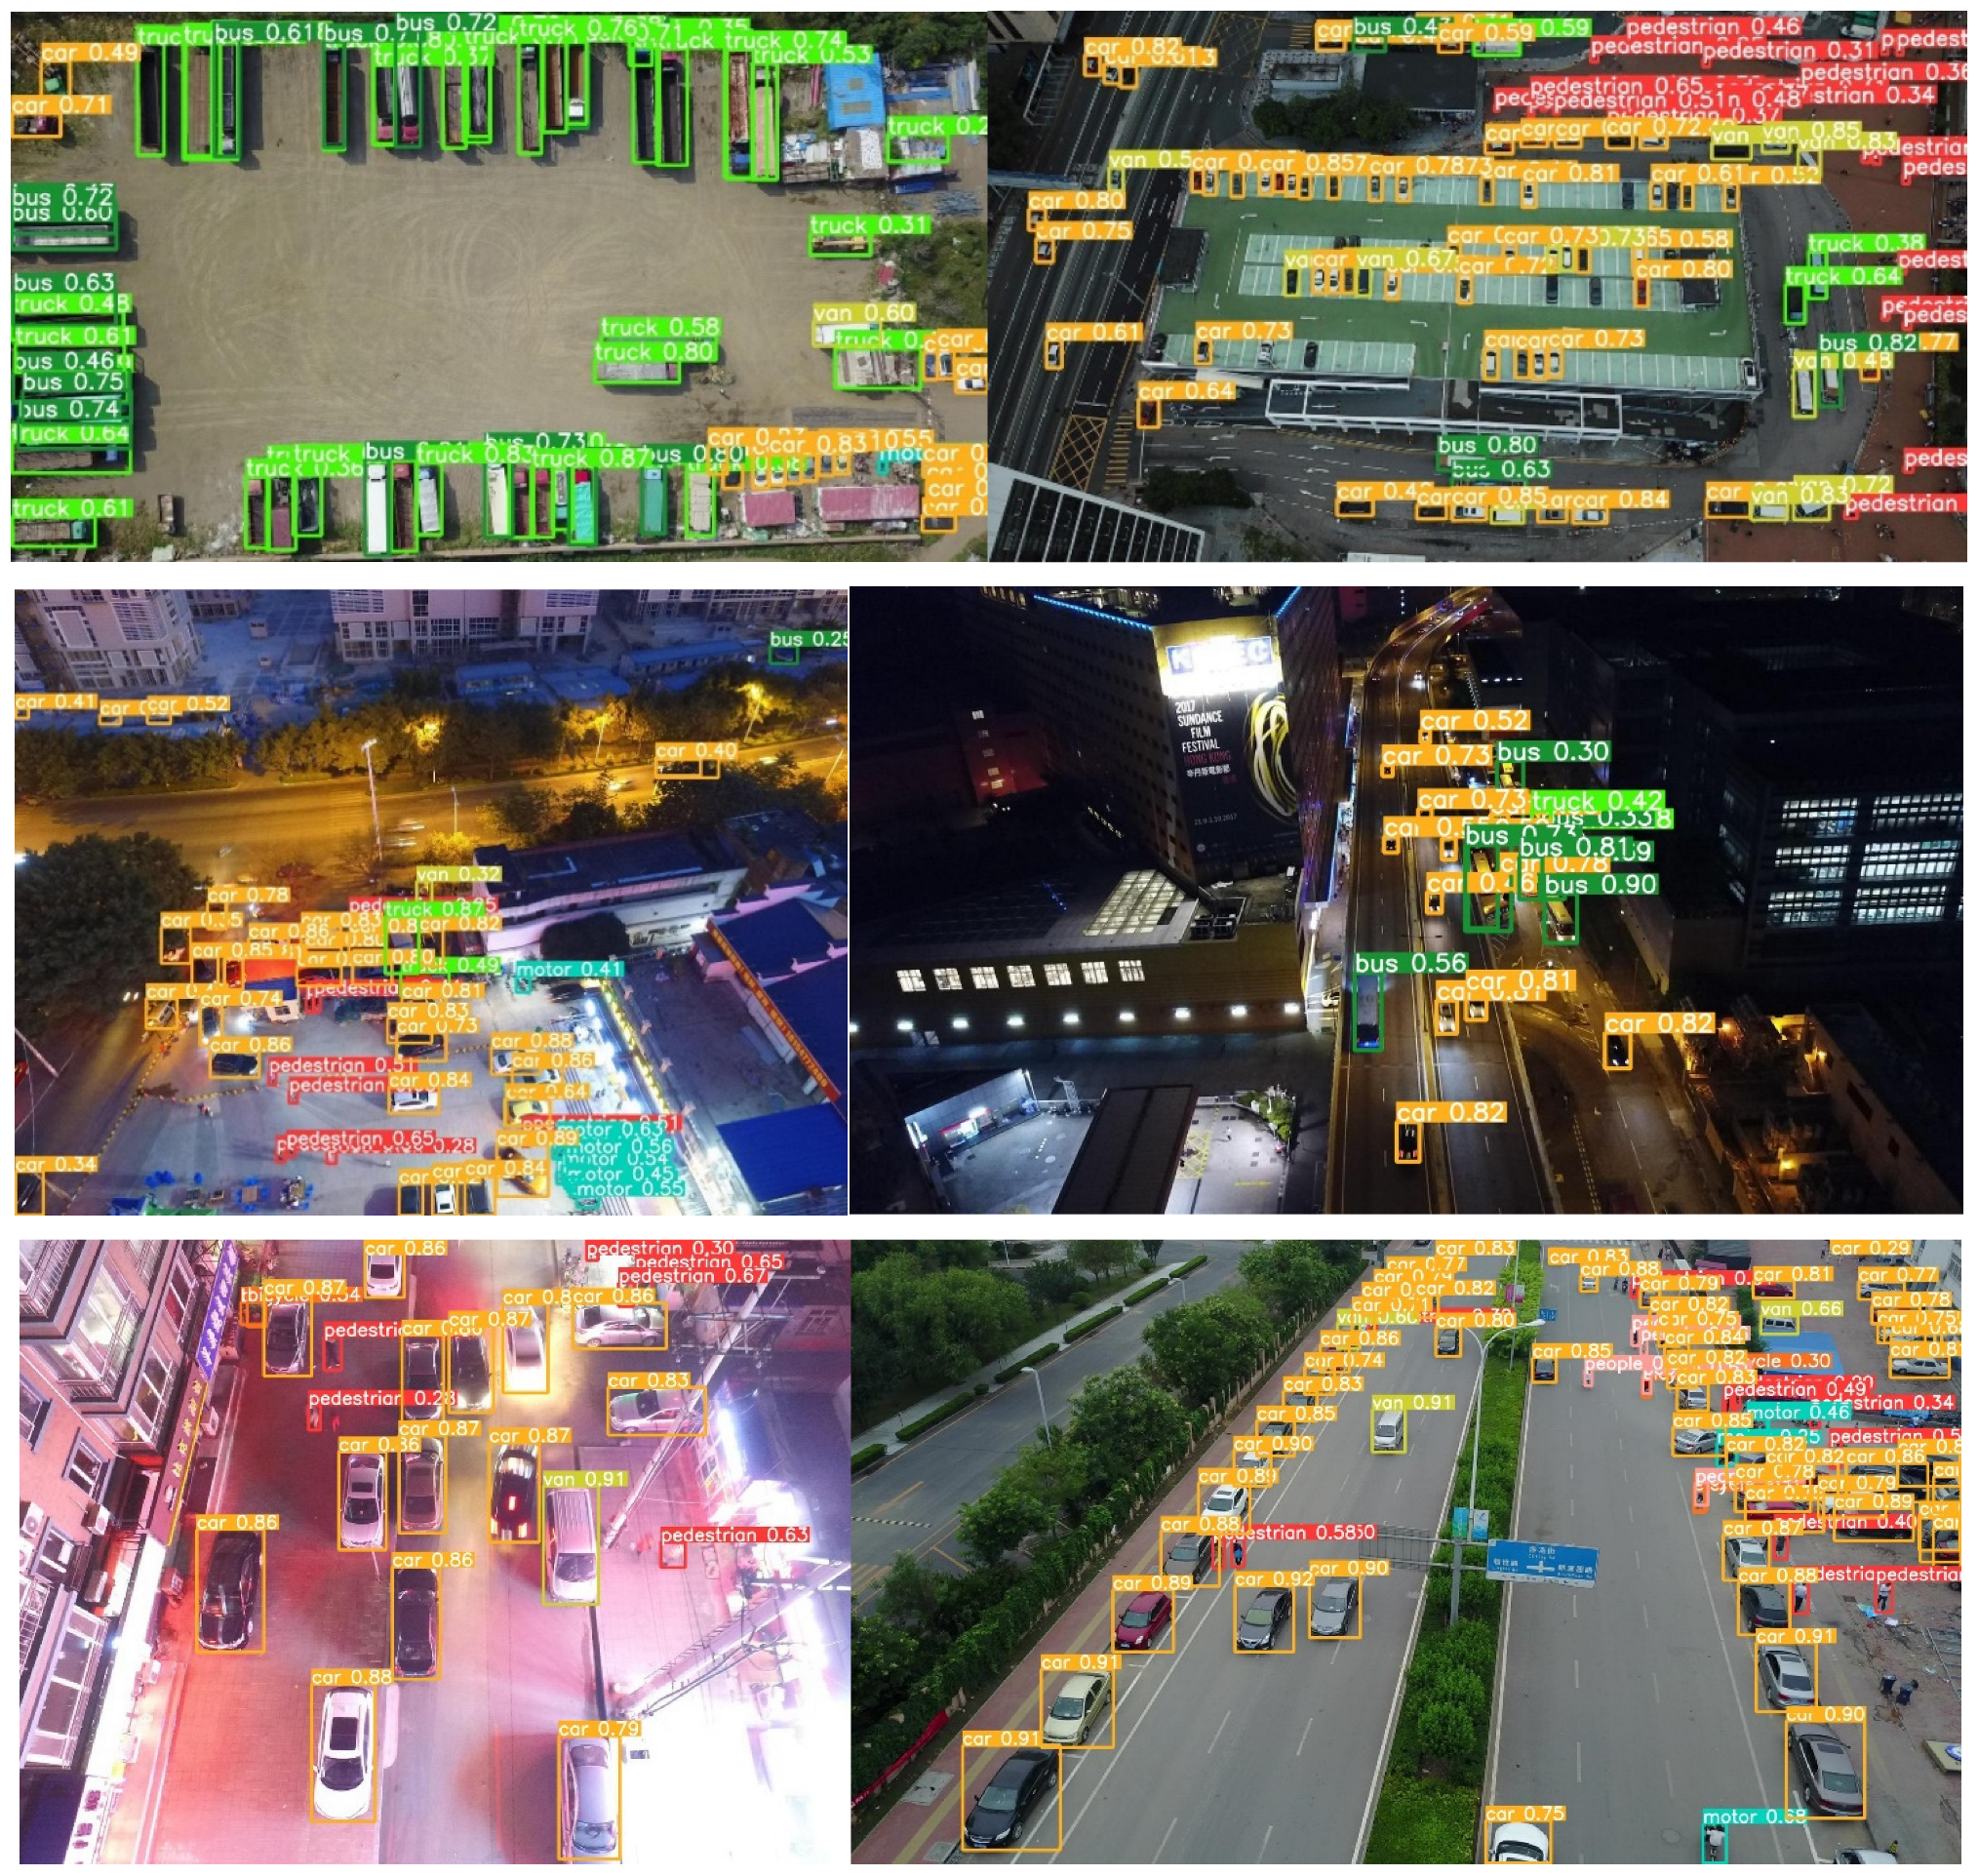
- On the whole, the sequential improvement of the three structures made the model in the VisDrone dataset improve the accuracy continuously, the number of parameters gradually decreased, and the final model size was only 19.157 MB. This shows that the improvement to the baseline model is feasible and effective, taking into account the accuracy and speed of edge device detection scenarios. The detection effect of some scenes is shown in Figure 8.
The detection samples selected in Figure 8 are all test set samples. Regardless of the scenario, the constructed model had strong detection ability, and the robustness met the actual engineering needs. However, in the detection tasks of small targets and dense targets, the model inevitably missed detection and false detection. For example, due to the high similarity between the truck class and the bus class in the high-altitude perspective, there were many misdetected targets in the detection process; if the car class and pedestrian class are too small, they may be considered by the model as backgrounds and missed detections.
4.3. Performance Comparison Experiment of the Deep Learning Model
According to the different anchor generation mechanisms, deep learning methods are mainly divided into one-stage and two-stage methods in the field of target detection. Processing aerial images in real time is more in line with practical engineering scenarios. Therefore, it is more practical to choose the one-stage target detection method with lower hardware dependence and taking into account the accuracy. In the experiment, the YOLO series and SSD, which are more advanced and universal in the field, were selected as the objects to complete the comparative test. Specifically, it included YOLOv4-s [36], YOLOv5-s [37], YOLOX-s [38], YOLOv7-tiny [39], and MobilNetv2-SSD [40], which have been widely used in various embedded scenarios and published in many papers. To reflect the superiority of the model in this paper, YOLOv5-m was also selected as the comparison object in the experiment. Thus far, this paper has named MobilNetv2-SSD, YOLOv4-s, YOLOv5-s, YOLOv5-m, YOLOX-s, YOLOv7-tiny, and the models proposed in this paper as A, B, C, D, E, F, and G in turn. The parameters of the comparison experiment were carried out in accordance with Table 1, and the comparison indicators were consistent with those in Table 3 in the ablation experiment. It should be noted that YOLOv5 is the official version 6.0, and the rest of the models are official versions. To ensure fairness, all models were not trained with pretrained weights. The results of the comparative experiments are shown in Table 4.
By comprehensively analyzing the relevant data in Table 4 and Figure 9, the performance and comparison results of each model can be summarized as follows:
- MobilNetv2-SSD had the worst overall performance. This model had the lowest number of parameters, only 3.94 million. In the target detection task, its R index was the lowest in both the validation set and the test set, which means that the model had a large number of missed detections. However, its p value showed a high performance, and it can be seen that the objects detected by the model were easier to identify, except for the missed objects. The above situation is mainly because the VisDrone dataset has high requirements for the target detection model in terms of shooting angle, target size, and environmental complexity. MobilNetv2-SSD often has high applicability in simpler tasks, but it is not suitable for this type of complex task.
- YOLOX-s also had the above problems. The R value of the model on this dataset was relatively low, and the missed detection rate was high. The p value achieved the best results in both the validation set and the test set, which made the YOLOX-s model achieve better results (better than those of YOLOv4-s). However, the model had the worst FPS performance. The performance of YOLOv4-s was relatively mediocre, and it was only better than MobilNetv2-SSD in the detection task, but the R value of this model was greatly improved compared with the previous two models, and the missed detection rate decreased.
- The two lightweight models, YOLOv5-s and YOLOv7-tiny, both achieved excellent performance in the test set. Especially for YOLOv5-s, after the official iteration of multiple versions, the overall performance was greatly improved. The P and R indicators of the two models were in a relatively balanced state, and the detection rate and the correct rate were relatively coordinated. YOLOv7-tiny was the smallest model. The performance of YOLOv5-s and YOLOv7-tiny in the test set was second only to the lightweight model proposed in this paper, and they were also suitable for target detection tasks in UAV aerial images.
- The MAP index of the model proposed in this paper was optimal in both the validation set and the test set. Compared with the non-lightweight model YOLOv5-m, the P, R, and MAP metrics all performed comparably or better than YOLOv5-m. From the three indicators of FPS, parameters, and model size, the model performance was in the first echelon, which shows that the model had the best comprehensive performance. In the UAV aerial image target detection task involved in this paper, the proposed model met the needs of actual production scenarios in terms of detection accuracy and deployment difficulty and had considerable robustness and practicability.
4.4. Interpretability Experiments
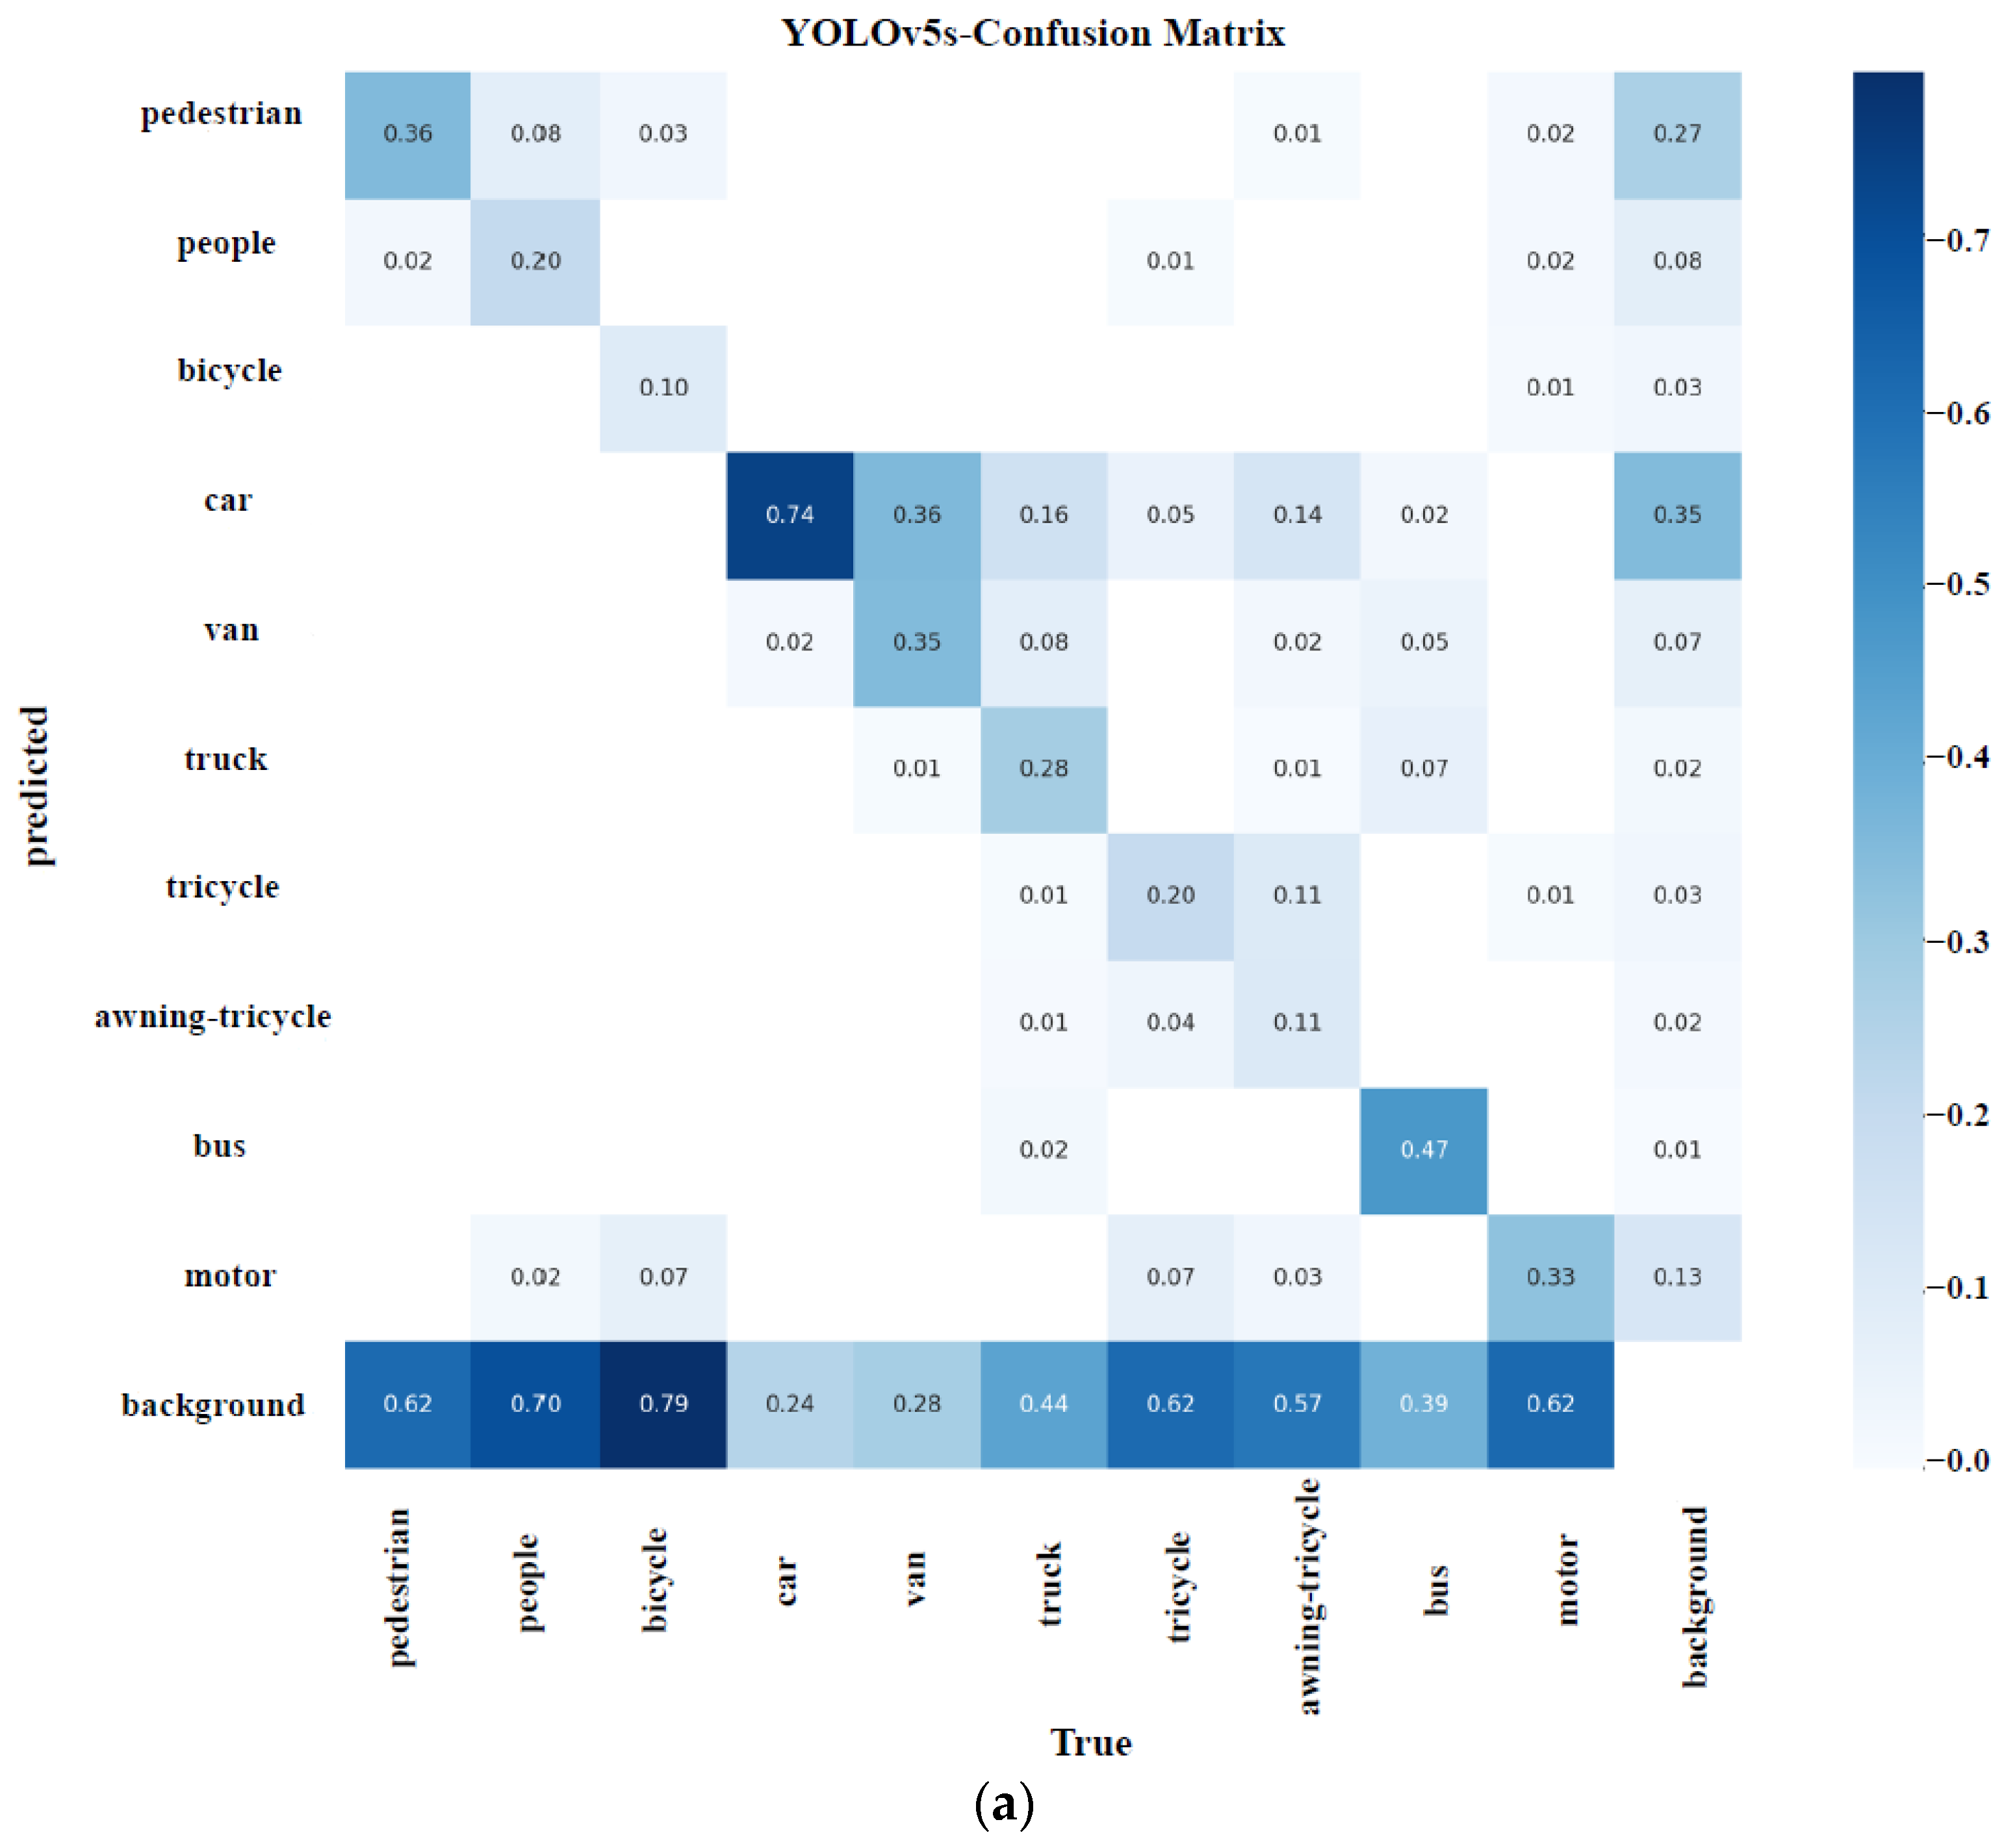
Deep learning is often referred to as the “black box”. Although deep learning models are widely used in various types of engineering fields, due to the lack of interpretability of algorithms, deep learning has not made great progress in some high-tech fields. Therefore, deep learning interpretability is the mainstream direction of artificial intelligence research. UAVs play a pivotal role in intelligent agriculture, the military, and other fields, and the in-depth discussion of interpretability is a key link in the establishment of their in-depth models. The experiment selected lightweight deep models that performed well in Section 4.3 as validation objects (YOLOv5-s, YOLOv7-tiny, and the model in this article). After fully discussing their performances in the confusion matrix of the VisDrone dataset, we used Gradient weighted Class Activation Mapping (Grade CAM) to visually analyze the attention areas of the three models [41]. Figure 10 shows the confusion between the categories of the three models.
It can be seen that all three models had a large missed detection rate (that is, each category was identified as a background category). The detailed analysis shows that the recognition of cars and buses was relatively good; the difficult-to-recognize categories included bicycles and people; trunks, tricycles, and awning-tricycles had the worst recognition effect. In view of the above characteristics, Grad-CAM was selected in the experiment to show some special categories of attention, and the reasons for viewing the performance of the three models were explained from the perspective of interpretability. Grad-CAM is based on the gradient calculated by backpropagation of class confidence scores and generates corresponding weights. Since the weight contains category information, it has great positive significance for the final detection performance. Specifically, we will focus on the display of the output layer effect of the backbone part of each model, and based on this, we will analyze the attention areas in trunk, people, and bicycle detection. The experimental results are shown in Figure 11.
As shown in Figure 11, when detecting the same class in the same image, YOLOv7-tiny, YOLOv5-s, and the model in this paper showed the evolution of attention from “narrow” to “wide”. YOLOv7-tiny, which had the worst performance among the three models, had a certain area of concern for similar targets but could not cover a large number of targets. This was especially true when there were occlusions and tiny types of targets; YOLOv5-s had a greater improvement than YOLOv7-tiny. The focus area in YOLOv5-s was significantly improved. This played a crucial role in comprehensively improving the detection accuracy of various categories; the Grad-CAM map of the model in this paper is the best, and the dark red parts (focus areas) are the same type of targets. In the visual interface of the bicycle class, it was the only model among the three models that fully considered the bicycle class on both sides of the street. This is in line with the original intention of designing a model to detect tiny objects. In summary, the model in this paper achieves the best results with interpretability.
4.5. Self-Built Dataset Experiment
To demonstrate the universality of the algorithm, this article constructs a drone multi-target detection dataset based on various scenarios in Guiyang, Guizhou Province, China. This dataset was captured using a DJI Mavic 3 model drone (as shown in Figure 12), and the detailed parameters of the drone are shown in Table 5. Among the four attributes, Angle of view, Equivalent focal length, Aperture, and Pixel, the first parameter is related to Hasselblad, and the second parameter is related to Telephoto camera. During the data collection process, factors such as environment (campus and city), density (sparse and crowded scenes), weather (sunny and cloudy), and object and target size were mainly considered. Each photo may contain several to dozens of objects to be detected. The dataset contains a total of over 10,000 manually annotated bounding boxes, with four detection categories (people, motorcycles, cars, and bicycles), totaling 906 sheets. Some example images of the dataset are shown in Figure 13. During the experiment, the entire dataset was divided into a training set (725 samples) and a testing set (181 samples). Consistent with the VisDrone2019 dataset, the sample size was normalized to 640 × 640 for training and testing, and the training parameters in Table 1 were used.
There was verification in Section 4.3 that MobilNetv2-SSD is not suitable for complex tasks such as drone multi target detection. Therefore, referring to Section 4.3, YOLOv4-s, YOLOv5-s, YOLOX-s, YOLOv7-tiny, and YOLOv8-s were selected as the comparison objects in this section. The paper names YOLOv4-s, YOLOv5-s, YOLOX-s, YOLOv7-tiny, YOLOv8-s, and the proposed model as A, B, C, D, E, and F. The comparison indicators are consistent with those in Table 3 of the ablation experiment, and all models do not use pretraining weights for training. The experimental results are shown in Table 6 and Figure 14.
Based on the comprehensive analysis of the relevant data in Table 6 and Figure 14, the performance effects and comparison results of each model can be summarized as follows:
- YOLOv4 s and YOLOv7-tiny performed similarly on the self-built dataset, both obtaining relatively low map values on the test set. Although YOLOv7-tiny had the relatively lowest model size and number of parameters, its universal performance was not excellent. However, these two models can still be used in occasions where precision requirements are not critical. Both had more than 150/f.s−1 in FPS, and are capable of being deployed in Edge device;
- YOLOv5-s, YOLOX-s, and YOLOv8-s all achieved excellent results, approximately at the same level of detection accuracy, but YOLOv8-s had the best accuracy. In terms of FPS, YOLOv5-s and YOLOv8-s both exceeded 300/f.s−1, but YOLOX-s did not reach 100 in this indicator, indicating that the former two have considerable advantages in detection accuracy and speed;
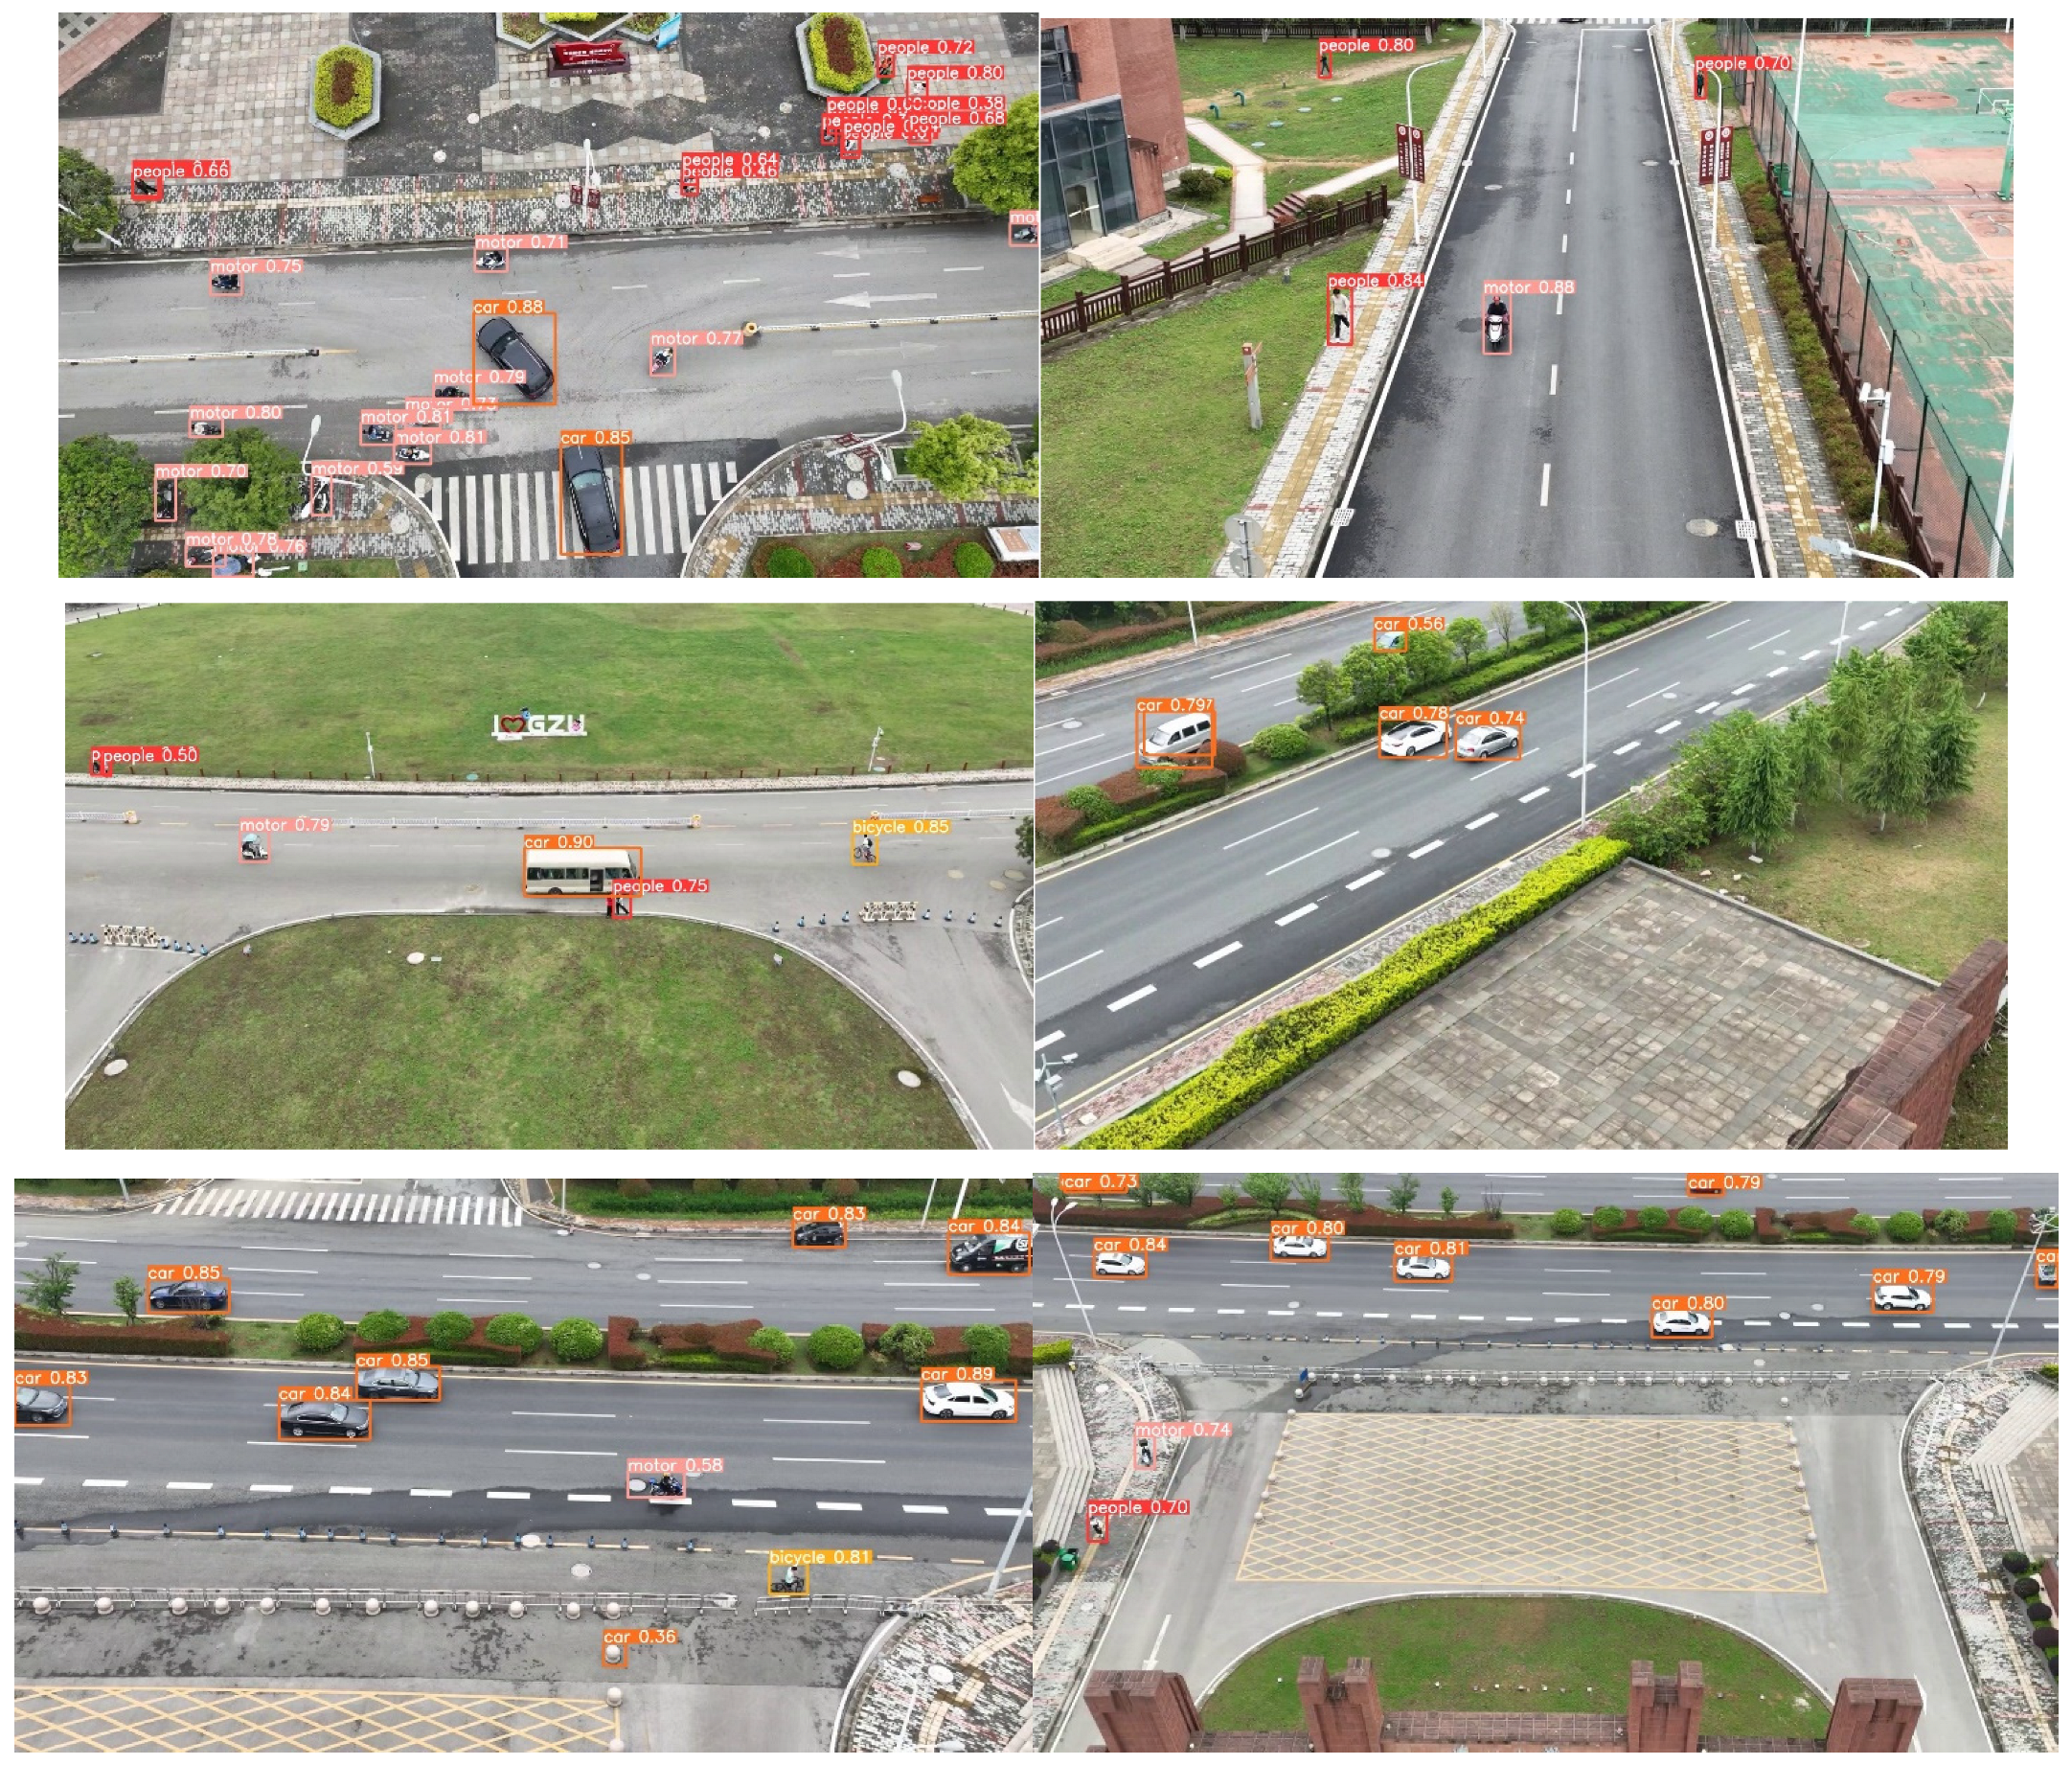
- The model in this article led the original YOLOv8-s by nearly two percentage points in the map of the test set, and led the worst performing YOLOv7-tiny by 18.4 percentage points. At the same time, the FPS reached 294/f.s−1, achieving a good balance between detection accuracy and speed. This also indicates that the model in this paper achieved the best detection performance in various scenarios and datasets, and has strong universality. The partial detection performance of this model on the test set is shown in Figure 15. It can be seen that for small targets, there is basically no missed detection phenomenon in the model. However, in some cases, redundant detection boxes may appear, and in a few cases, similar backgrounds may be mistaken for targets.
5. Conclusions
This paper proposes an aerial image detection model based on YOLOv8-s, which can accurately detect aerial image targets in real time under the premise of satisfying the deployment of edge devices. This model overcomes the negative effects of shooting angle, light, background, and other factors on the detection task. Specifically: First, in view of the common problem that small targets in aerial images are prone to misdetection and missed detection, the idea of Bi-PAN-FPN is introduced to improve the neck part in YOLOv8-s. By fully considering and reusing multiscale features, a more advanced and complete feature fusion process is achieved while maintaining the parameter cost as much as possible. Second, the GhostblockV2 structure is used in the backbone of the benchmark model to replace part of the C2f module, which suppresses information loss during long-distance feature transmission while significantly reducing the number of model parameters; finally, WiseIoU loss is used as bounding box regression loss, combined with a dynamic nonmonotonic focusing mechanism, and the quality of anchor boxes is evaluated by using “outlier” so that the detector takes into account different quality anchor boxes to improve the overall performance of the detection task. In this paper, the authoritative dataset VisDrone in the field of international drone vision is used as the experimental verification object; ablation experiments, comparison experiments, and interpretability experiments are designed; and the feasibility and effectiveness of the proposed method are expounded from multiple perspectives. The results show that the proposed improved method does play an obvious role in aerial image detection. Compared with the baseline model, the MAP performance of our method on the test set is improved by 9.06%, and the number of parameters is reduced by 13.21%. Compared with the other six comparison algorithms, the method in this paper achieved the best performance in terms of accuracy. The performance of this method has strong interpretability. In addition, the model also achieved the optimal detection accuracy (MAP: 91.7%) on the self-built dataset, with an FPS of up to 293/f.s−1. In general, the proposed method is suitable for deployment in complex working conditions, and also has considerable universality and robustness.
However, a problem was also exposed during the experiment: from the ablation experiments, the model in this paper cannot achieve better results than other structures in all small categories. For example, the performance of tricycle and bus is not as good as that of A + B + C, and the performance of van is not as good as that of A + B. In future research, we will focus on the above problems, combined with customized detection tasks, and explore the adaptive adjustment of the model structure from the perspectives of model hyperparameters and network composition. In addition, training deep learning networks often requires a large number of labeled images, which is often unrealistic in aerial image detection tasks. In future research, we will focus on using unsupervised theory to act on public datasets and self-built datasets by reducing the data distribution differences between the source domains and target domains, reducing the dependence of deep learning on labeled data.
Author Contributions
Conceptualization, Y.L. and Q.F.; methodology, Y.L.; software, Y.L.; validation, Y.L., Q.F. and Z.H.; formal analysis, Q.G.; investigation, Q.G.; resources, H.H.; data curation, Y.L.; writing—original draft preparation, Y.L.; writing—review and editing, Y.L.; visualization, Y.L.; supervision, Q.F.; project administration, Y.L. and H.H.; funding acquisition, Y.L. All authors have read and agreed to the published version of the manuscript.
Funding
This research was funded by the Youth Science and Technology Talent Growth Project of Guizhou Provincial Department of Education (No. KY [2022] 199), the Research Fund of Guizhou University of Finance and Economics (No. 2021KYYB08), the National Natural Science Foundation of China (No. 52165063), the Guizhou Provincial Science and Technology Plan Project (No. ZK [2021]337), the Open Fund Project supported by the Key Laboratory of Advanced Manufacturing Technology Ministry of Education, China (No. QianJiaoJi [2022]436), the Guizhou Province Graduate Research Fund (YJSCXJH [2021] 068), and Guizhou Provincial Science and Technology Plan Project (ZK[2023]029).
Institutional Review Board Statement
Not applicable.
Informed Consent Statement
Not applicable.
Data Availability Statement
Not applicable.
Conflicts of Interest
The authors declare no conflict of interest.
References
- Adaimi, G.; Kreiss, S.; Alahi, A. Perceiving Traffic from Aerial Images. arXiv 2020, arXiv:2009.07611. [Google Scholar]
- Bouguettaya, A.; Zarzour, H.; Kechida, A.; Taberkit, A.M. Vehicle Detection from UAV Imagery with Deep Learning: A Review. IEEE Trans. Neural Netw. Learn. Syst. 2021, 33, 6047–6067. [Google Scholar] [CrossRef] [PubMed]
- Byun, S.; Shin, I.-K.; Moon, J.; Kang, J.; Choi, S.-I. Road Traffic Monitoring from UAV Images Using Deep Learning Networks. Remote Sens. 2021, 13, 4027. [Google Scholar] [CrossRef]
- Chang, Y.-C.; Chen, H.-T.; Chuang, J.-H.; Liao, I.-C. Pedestrian Detection in Aerial Images Using Vanishing Point Transformation and Deep Learning. In Proceedings of the 2018 25th IEEE International Conference on Image Processing (ICIP), Athens, Greece, 7–10 October 2018; pp. 1917–1921. [Google Scholar]
- Božić-Štulić, D.; Marušić, Ž.; Gotovac, S. Deep Learning Approach in Aerial Imagery for Supporting Land Search and Rescue Missions. Int. J. Comput. Vis. 2019, 127, 1256–1278. [Google Scholar] [CrossRef]
- Chen, C.; Zhang, Y.; Lv, Q.; Wei, S.; Wang, X.; Sun, X.; Dong, J. Rrnet: A Hybrid Detector for Object Detection in Drone-Captured Images. In Proceedings of the IEEE/CVF International Conference on Computer Vision Workshops, Seoul, Republic of Korea, 27–28 October 2019; pp. 100–108. [Google Scholar]
- Chen, Y.; Lee, W.S.; Gan, H.; Peres, N.; Fraisse, C.; Zhang, Y.; He, Y. Strawberry Yield Prediction Based on a Deep Neural Network Using High-Resolution Aerial Orthoimages. Remote Sens. 2019, 11, 1584. [Google Scholar] [CrossRef]
- Chen, Y.; Li, J.; Niu, Y.; He, J. Small Object Detection Networks Based on Classification-Oriented Super-Resolution GAN for UAV Aerial Imagery. In Proceedings of the 2019 Chinese Control and Decision Conference (CCDC), Nanchang, China, 3–5 June 2019; pp. 4610–4615. [Google Scholar]
- Cai, W.; Wei, Z. Remote Sensing Image Classification Based on a Cross-Attention Mechanism and Graph Convolution. IEEE Geosci. Remote Sens. Lett. 2020, 19, 1–5. [Google Scholar] [CrossRef]
- Deng, S.; Li, S.; Xie, K.; Song, W.; Liao, X.; Hao, A.; Qin, H. A Global-Local Self-Adaptive Network for Drone-View Object Detection. IEEE Trans. Image Process. 2020, 30, 1556–1569. [Google Scholar] [CrossRef]
- Domozi, Z.; Stojcsics, D.; Benhamida, A.; Kozlovszky, M.; Molnar, A. Real Time Object Detection for Aerial Search and Rescue Missions for Missing Persons. In Proceedings of the 2020 IEEE 15th International Conference of System of Systems Engineering (SoSE), Budapest, Hungary, 2–4 June 2020; pp. 519–524. [Google Scholar]
- Hong, S.; Kang, S.; Cho, D. Patch-Level Augmentation for Object Detection in Aerial Images. In Proceedings of the IEEE/CVF International Conference on Computer Vision Workshops, Seoul, Republic of Korea, 27–28 October 2019; pp. 127–134. [Google Scholar]
- Dong, J.; Ota, K.; Dong, M. UAV-Based Real-Time Survivor Detection System in Post-Disaster Search and Rescue Operations. IEEE J. Miniat. Air Space Syst. 2021, 2, 209–219. [Google Scholar] [CrossRef]
- Hsieh, M.-R.; Lin, Y.-L.; Hsu, W.H. Drone-Based Object Counting by Spatially Regularized Regional Proposal Network. In Proceedings of the IEEE International Conference on Computer Vision, Venice, Italy, 22–29 October 2017; pp. 4145–4153. [Google Scholar]
- Liao, J.; Piao, Y.; Su, J.; Cai, G.; Huang, X.; Chen, L.; Huang, Z.; Wu, Y. Unsupervised Cluster Guided Object Detection in Aerial Images. IEEE J. Sel. Top. Appl. Earth Obs. Remote Sens. 2021, 14, 11204–11216. [Google Scholar] [CrossRef]
- Huang, Y.; Chen, J.; Huang, D. UFPMP-Det: Toward Accurate and Efficient Object Detection on Drone Imagery. In Proceedings of the AAAI Conference on Artificial Intelligence, Vancouver, BC, Canada, 22 February–1 March 2022; Volume 36, pp. 1026–1033. [Google Scholar]
- Liu, Z.; Gao, G.; Sun, L.; Fang, Z. HRDNet: High-Resolution Detection Network for Small Objects. In Proceedings of the 2021 IEEE International Conference on Multimedia and Expo (ICME), Shenzhen, China, 5–9 July 2021; pp. 1–6. [Google Scholar]
- Qingyun, F.; Dapeng, H.; Zhaokui, W. Cross-Modality Fusion Transformer for Multispectral Object Detection. arXiv 2021, arXiv:2111.00273. [Google Scholar]
- Yang, F.; Fan, H.; Chu, P.; Blasch, E.; Ling, H. Clustered Object Detection in Aerial Images. In Proceedings of the IEEE/CVF International Conference on Computer Vision, Seoul, Republic of Korea, 27 October–2 November 2019; pp. 8311–8320. [Google Scholar]
- Liang, X.; Zhang, J.; Zhuo, L.; Li, Y.; Tian, Q. Small Object Detection in Unmanned Aerial Vehicle Images Using Feature Fusion and Scaling-Based Single Shot Detector with Spatial Context Analysis. IEEE Trans. Circuits Syst. Video Technol. 2019, 30, 1758–1770. [Google Scholar] [CrossRef]
- Jiao, L.; Zhang, F.; Liu, F.; Yang, S.; Li, L.; Feng, Z.; Qu, R. A Survey of Deep Learning-Based Object Detection. IEEE Access 2019, 7, 128837–128868. [Google Scholar] [CrossRef]
- Cai, W.; Ning, X.; Zhou, G.; Bai, X.; Jiang, Y.; Li, W.; Qian, P. A Novel Hyperspectral Image Classification Model Using Bole Convolution With Three-Direction Attention Mechanism: Small Sample and Unbalanced Learning. IEEE Trans. Geosci. Remote Sens. 2023, 61, 1–17. [Google Scholar] [CrossRef]
- Li, J.; Li, B.; Jiang, Y.; Tian, L.; Cai, W. MrFDDGAN: Multireceptive Field Feature Transfer and Dual Discriminator-Driven Generative Adversarial Network for Infrared and Color Visible Image Fusion. IEEE Trans. Instrum. Meas. 2023, 72, 1–28. [Google Scholar] [CrossRef]
- Zou, Z.; Shi, Z.; Guo, Y.; Ye, J. Object Detection in 20 Years: A Survey. Proc. IEEE 2019, 111, 257–276. [Google Scholar] [CrossRef]
- Chen, Y.; Li, R.; Li, R. HRCP: High-Ratio Channel Pruning for Real-Time Object Detection on Resource-Limited Platform. Neurocomputing 2021, 463, 155–167. [Google Scholar] [CrossRef]
- Ringwald, T.; Sommer, L.; Schumann, A.; Beyerer, J.; Stiefelhagen, R. UAV-Net: A Fast Aerial Vehicle Detector for Mobile Platforms. In Proceedings of the IEEE/CVF Conference on Computer Vision and Pattern Recognition Workshops, Long Beach, CA, USA, 16–17 June 2019; pp. 544–552. [Google Scholar]
- Li, Y.; Yuan, H.; Wang, Y.; Xiao, C. GGT-YOLO: A Novel Object Detection Algorithm for Drone-Based Maritime Cruising. Drones 2022, 6, 335. [Google Scholar] [CrossRef]
- Deng, F.; Xie, Z.; Mao, W.; Li, B.; Shan, Y.; Wei, B.; Zeng, H. Research on Edge Intelligent Recognition Method Oriented to Transmission Line Insulator Fault Detection. Int. J. Electr. Power Energy Syst. 2022, 139, 108054. [Google Scholar] [CrossRef]
- Lin, T.-Y.; Dollár, P.; Girshick, R.; He, K.; Hariharan, B.; Belongie, S. Feature Pyramid Networks for Object Detection. In Proceedings of the IEEE Conference on Computer Vision and Pattern Recognition, Honolulu, HI, USA, 21–26 July 2017; pp. 2117–2125. [Google Scholar]
- Liu, S.; Qi, L.; Qin, H.; Shi, J.; Jia, J. Path Aggregation Network for Instance Segmentation. In Proceedings of the IEEE Conference on Computer Vision and Pattern Recognition, Salt Lake City, UT, USA, 18–23 June 2018; pp. 8759–8768. [Google Scholar]
- Tan, M.; Pang, R.; Le, Q.V. Efficientdet: Scalable and Efficient Object Detection. In Proceedings of the IEEE/CVF Conference on Computer Vision and Pattern Recognition, Seattle, WA, USA, 13–19 June 2020; pp. 10781–10790. [Google Scholar]
- Han, K.; Wang, Y.; Tian, Q.; Guo, J.; Xu, C.; Xu, C. Ghostnet: More Features from Cheap Operations. In Proceedings of the IEEE/CVF Conference on Computer Vision and Pattern Recognition, Seattle, WA, USA, 13–19 June 2020; pp. 1580–1589. [Google Scholar]
- Tang, Y.; Han, K.; Guo, J.; Xu, C.; Xu, C.; Wang, Y. GhostNetV2: Enhance Cheap Operation with Long-Range Attention. arXiv 2022, arXiv:2211.12905. [Google Scholar]
- Tong, Z.; Chen, Y.; Xu, Z.; Yu, R. Wise-IoU: Bounding Box Regression Loss with Dynamic Focusing Mechanism. arXiv 2023, arXiv:2301.10051. [Google Scholar]
- Cao, Y.; He, Z.; Wang, L.; Wang, W.; Yuan, Y.; Zhang, D.; Zhang, J.; Zhu, P.; Van Gool, L.; Han, J. VisDrone-DET2021: The Vision Meets Drone Object Detection Challenge Results. In Proceedings of the IEEE/CVF International Conference on Computer Vision, Montreal, BC, Canada, 11–17 October 2021; pp. 2847–2854. [Google Scholar]
- Bochkovskiy, A.; Wang, C.-Y.; Liao, H.-Y.M. Yolov4: Optimal Speed and Accuracy of Object Detection. arXiv 2020, arXiv:2004.10934. [Google Scholar]
- Fang, Y.; Guo, X.; Chen, K.; Zhou, Z.; Ye, Q. Accurate and Automated Detection of Surface Knots on Sawn Timbers Using YOLO-V5 Model. BioResources 2021, 16, 5390–5406. [Google Scholar] [CrossRef]
- Ge, Z.; Liu, S.; Wang, F.; Li, Z.; Sun, J. Yolox: Exceeding Yolo Series in 2021. arXiv 2021, arXiv:2107.08430. [Google Scholar]
- Wang, C.-Y.; Bochkovskiy, A.; Liao, H.-Y.M. YOLOv7: Trainable Bag-of-Freebies Sets New State-of-the-Art for Real-Time Object Detectors. arXiv 2022, arXiv:2207.02696. [Google Scholar]
- Howard, A.; Sandler, M.; Chu, G.; Chen, L.-C.; Chen, B.; Tan, M.; Wang, W.; Zhu, Y.; Pang, R.; Vasudevan, V. Searching for mobilenetv3. In Proceedings of the IEEE/CVF International Conference on Computer Vision, Seoul, Republic of Korea, 27 October–2 November 2019; pp. 1314–1324. [Google Scholar]
- Selvaraju, R.R.; Cogswell, M.; Das, A.; Vedantam, R.; Parikh, D.; Batra, D. Grad-Cam: Visual Explanations from Deep Networks via Gradient-Based Localization. In Proceedings of the IEEE International Conference on Computer Vision, Venice, Italy, 22–29 October 2017; pp. 618–626. [Google Scholar]
Figure 1.
Schematic diagram of the C2f module structure.

Figure 2.
Improvement scheme at the neck.

Figure 3.
Ghostblock structure used by backbone.

Figure 4.
Schematic diagram of the Wise-IoU solution.

Figure 5.
Overall structure of the aerial image detection model.

Figure 6.
Samples example of the VisDrone dataset.

Figure 7.
Normalization effect diagram of overall indicators.

Figure 8.
Examples of the detection effect.

Figure 9.
Comparison of the normalization effect of experimental indicators (comparison experiment).
Figure 9.
Comparison of the normalization effect of experimental indicators (comparison experiment).

Figure 10.
Confusion matrix diagram of the three models. (a) YOLOv5-s confusion matrix diagram. (b) YOLOv7-tiny confusion matrix diagram. (c) Confusion matrix of the model in this paper.
Figure 10.
Confusion matrix diagram of the three models. (a) YOLOv5-s confusion matrix diagram. (b) YOLOv7-tiny confusion matrix diagram. (c) Confusion matrix of the model in this paper.


Figure 11.
Grad-CAM visualization. (a) Original image. (b) YOLOv7-tiny Grad-CAM map. (c) YOLOv5-s Grad-CAM map. (d) Our model Grad-CAM diagram.
Figure 11.
Grad-CAM visualization. (a) Original image. (b) YOLOv7-tiny Grad-CAM map. (c) YOLOv5-s Grad-CAM map. (d) Our model Grad-CAM diagram.

Figure 12.
DJI Mavic 3 drone shooting live scenes.

Figure 13.
Samples of self-built dataset.

Figure 14.
3on of the normalization effect of experimental indicators (self-built dataset).

Figure 15.
Examples of self-built dataset detection effect.


Table 1.
Training parameter setting table.
| Parameters | Setup |
|---|---|
| Epochs | 150 |
| Batch Size | 8 |
| Optimizer | SGD |
| NMS IoU | 0.7 |
| Initial Learning Rate | 1 × 10⁻² |
| Final Learning Rate | 1 × 10⁻⁴ |
| Momentum | 0.937 |
| Weight-Decay | 5 × 10⁻⁴ |
| Image Scale | 0.5 |
| Image Flip Left-Right | 0.5 |
| Mosaic | 1.0 |
| Image Translation | 0.1 |
| (Wise-IoU) | 1.9 |
| (Wise-IoU) | 3 |
| Close Mosaic | Last 10 epochs |
Table 2.
Experimental results of ablation of various categories of indicators.
| Classification | Data Set | Indicators | A | A + B | A + B + C | A + B + C + D |
|---|---|---|---|---|---|---|
| Pedestrian | Val | P | 0.492 | 0.544 | 0.560 | 0.574 |
| R | 0.403 | 0.414 | 0.424 | 0.424 | ||
| AP | 0.416 | 0.444 | 0.459 | 0.467 | ||
| Test | P | 0.478 | 0.514 | 0.519 | 0.546 | |
| R | 0.251 | 0.269 | 0.279 | 0.270 | ||
| AP | 0.265 | 0.287 | 0.299 | 0.300 | ||
| People | Val | P | 0.525 | 0.579 | 0.582 | 0.586 |
| R | 0.281 | 0.268 | 0.295 | 0.305 | ||
| AP | 0.315 | 0.330 | 0.350 | 0.360 | ||
| Test | P | 0.468 | 0.486 | 0.488 | 0.518 | |
| R | 0.099 | 0.109 | 0.120 | 0.117 | ||
| AP | 0.134 | 0.147 | 0.152 | 0.158 | ||
| Bicycle | Val | P | 0.255 | 0.273 | 0.310 | 0.286 |
| R | 0.134 | 0.146 | 0.176 | 0.160 | ||
| AP | 0.113 | 0.133 | 0.151 | 0.140 | ||
| Test | P | 0.271 | 0.275 | 0.278 | 0.277 | |
| R | 0.101 | 0.106 | 0.138 | 0.114 | ||
| AP | 0.092 | 0.095 | 0.110 | 0.106 | ||
| Car | Val | P | 0.713 | 0.738 | 0.754 | 0.761 |
| R | 0.773 | 0.772 | 0.782 | 0.780 | ||
| AP | 0.795 | 0.803 | 0.814 | 0.814 | ||
| Test | P | 0.674 | 0.688 | 0.692 | 0.707 | |
| R | 0.715 | 0.723 | 0.735 | 0.724 | ||
| AP | 0.715 | 0.728 | 0.735 | 0.734 | ||
| Van | Val | P | 0.527 | 0.514 | 0.525 | 0.536 |
| R | 0.449 | 0.457 | 0.479 | 0.490 | ||
| AP | 0.458 | 0.464 | 0.477 | 0.487 | ||
| Test | P | 0.387 | 0.404 | 0.390 | 0.414 | |
| R | 0.416 | 0.437 | 0.457 | 0.443 | ||
| AP | 0.366 | 0.395 | 0.393 | 0.391 | ||
| Truck | Val | P | 0.481 | 0.514 | 0.503 | 0.522 |
| R | 0.372 | 0.377 | 0.383 | 0.385 | ||
| AP | 0.363 | 0.382 | 0.380 | 0.391 | ||
| Test | P | 0.402 | 0.383 | 0.397 | 0.422 | |
| R | 0.411 | 0.419 | 0.437 | 0.439 | ||
| AP | 0.367 | 0.369 | 0.378 | 0.385 | ||
| Tricycle | Val | P | 0.406 | 0.441 | 0.451 | 0.446 |
| R | 0.314 | 0.297 | 0.314 | 0.316 | ||
| AP | 0.278 | 0.279 | 0.306 | 0.315 | ||
| Test | P | 0.229 | 0.249 | 0.264 | 0.277 | |
| R | 0.253 | 0.283 | 0.308 | 0.291 | ||
| AP | 0.146 | 0.178 | 0.201 | 0.187 | ||
| Awning-tricycle | Val | P | 0.324 | 0.322 | 0.302 | 0.310 |
| R | 0.192 | 0.188 | 0.173 | 0.207 | ||
| AP | 0.153 | 0.161 | 0.167 | 0.182 | ||
| Test | P | 0.355 | 0.412 | 0.359 | 0.382 | |
| R | 0.207 | 0.237 | 0.222 | 0.231 | ||
| AP | 0.166 | 0.204 | 0.189 | 0.214 | ||
| Bus | Val | P | 0.637 | 0.647 | 0.672 | 0.661 |
| R | 0.486 | 0.558 | 0.574 | 0.574 | ||
| AP | 0.569 | 0.577 | 0.602 | 0.584 | ||
| Test | P | 0.639 | 0.663 | 0.662 | 0.669 | |
| R | 0.535 | 0.549 | 0.556 | 0.538 | ||
| AP | 0.558 | 0.585 | 0.588 | 0.580 | ||
| Motor | Val | P | 0.529 | 0.554 | 0.560 | 0.566 |
| R | 0.435 | 0.429 | 0.456 | 0.463 | ||
| AP | 0.446 | 0.452 | 0.473 | 0.481 | ||
| Test | P | 0.415 | 0.435 | 0.442 | 0.462 | |
| R | 0.315 | 0.325 | 0.346 | 0.350 | ||
| AP | 0.276 | 0.293 | 0.310 | 0.316 |
Table 3.
Overall index ablation experiment results.
| Data Set | Indicators | A | A + B | A + B + C | A + B + C + D |
|---|---|---|---|---|---|
| Val | P | 0.489 | 0.513 | 0.522 | 0.525 |
| R | 0.384 | 0.391 | 0.406 | 0.410 | |
| MAP | 0.391 | 0.402 | 0.418 | 0.422 | |
| Test | P | 0.432 | 0.451 | 0.449 | 0.467 |
| R | 0.330 | 0.346 | 0.360 | 0.351 | |
| MAP | 0.309 | 0.328 | 0.335 | 0.337 | |
| FPS /f.s−1 | 182 | 161 | 167 | 167 | |
| Parameters/million | 11.129 | 11.409 | 9.659 | 9.659 | |
| Model size/MB | 21.972 | 22.542 | 19.157 | 19.157 | |
Table 4.
Comparison of experimental results.
| Data Set | Indicators | A | B | C | D | E | F | G |
|---|---|---|---|---|---|---|---|---|
| Val | P | 0.495 | 0.376 | 0.495 | 0.534 | 0.817 | 0.395 | 0.525 |
| R | 0.016 | 0.349 | 0.378 | 0.397 | 0.182 | 0.348 | 0.410 | |
| MAP | 0.066 | 0.313 | 0.385 | 0.415 | 0.325 | 0.307 | 0.422 | |
| Test | P | 0.331 | 0.362 | 0.427 | 0.458 | 0.678 | 0.355 | 0.467 |
| R | 0.098 | 0.309 | 0.338 | 0.358 | 0.160 | 0.325 | 0.351 | |
| MAP | 0.042 | 0.265 | 0.310 | 0.337 | 0.263 | 0.268 | 0.337 | |
| FPS /f.s−1 | 113 | 115 | 185 | 143 | 54 | 154 | 167 | |
| Parameters/million | 3.940 | 9.119 | 9.115 | 25.051 | 8.942 | 6.015 | 9.659 | |
| Model size/MB | 19.320 | 18.178 | 18.063 | 49.295 | 35.183 | 12.011 | 19.157 | |
Table 5.
DJI Mavic 3 technical parameters.
| Technical Parameter | Value |
|---|---|
| Maximum range (km) | 30 |
| Maximum wind resistance speed (m/s) | 8 |
| Maximum tilt angle (°) | 35 |
| Vertical hover accuracy (m) | ±0.1 |
| Horizontal hover accuracy (m) | ±0.3 |
| Onboard memory (GB) | 8 |
| Shot | Hasselblad, Telephoto camera |
| Angle of view (°) | 84, 15 |
| Equivalent focal length (mm) | 24, 162 |
| Aperture | f/2.8–f/11, f/4.4 |
| Pixel (w) | 2000, 1200 |
Table 6.
Comparison of self-built dataset experimental results.
| Data Set | Indicators | A | B | C | D | E | F |
|---|---|---|---|---|---|---|---|
| Test | P | 0.765 | 0.794 | 0.665 | 0.893 | 0.772 | 0.854 |
| R | 0.575 | 0.872 | 0.900 | 0.645 | 0.881 | 0.883 | |
| MAP | 0.742 | 0.880 | 0.852 | 0.733 | 0.898 | 0.917 | |
| FPS /f.s−1 | 185 | 333 | 87 | 159 | 357 | 294 | |
| Parameters/million | 9.119 | 9.115 | 8.942 | 6.015 | 11.129 | 9.659 | |
| Model size/MB | 18.178 | 18.063 | 35.183 | 12.011 | 21.972 | 19.157 | |
Disclaimer/Publisher’s Note: The statements, opinions and data contained in all publications are solely those of the individual author(s) and contributor(s) and not of MDPI and/or the editor(s). MDPI and/or the editor(s) disclaim responsibility for any injury to people or property resulting from any ideas, methods, instructions or products referred to in the content. |
© 2023 by the authors. Licensee MDPI, Basel, Switzerland. This article is an open access article distributed under the terms and conditions of the Creative Commons Attribution (CC BY) license (https://creativecommons.org/licenses/by/4.0/).
Share and Cite
MDPI and ACS Style
Li, Y.; Fan, Q.; Huang, H.; Han, Z.; Gu, Q. A Modified YOLOv8 Detection Network for UAV Aerial Image Recognition. Drones 2023, 7, 304. https://doi.org/10.3390/drones7050304
AMA Style
Li Y, Fan Q, Huang H, Han Z, Gu Q. A Modified YOLOv8 Detection Network for UAV Aerial Image Recognition. Drones. 2023; 7(5):304. https://doi.org/10.3390/drones7050304
Chicago/Turabian StyleLi, Yiting, Qingsong Fan, Haisong Huang, Zhenggong Han, and Qiang Gu. 2023. "A Modified YOLOv8 Detection Network for UAV Aerial Image Recognition" Drones 7, no. 5: 304. https://doi.org/10.3390/drones7050304