
A Review on Unmanned Aerial Vehicle Remote Sensing: Platforms, Sensors, Data Processing Methods, and Applications


1
College of Information Science and Technology, Zhongkai University of Agriculture and Engineering, Guangzhou 510225, China
2
Guangdong Laboratory for Lingnan Modern Agriculture, Guangzhou 510642, China
3
School of Mechanical and Electrical Engineering, Zhongkai University of Agriculture and Engineering, Guangzhou 510225, China
*
Author to whom correspondence should be addressed.
Drones 2023, 7(6), 398; https://doi.org/10.3390/drones7060398
Submission received: 29 April 2023
/
Revised: 9 June 2023
/
Accepted: 10 June 2023
/
Published: 15 June 2023
Abstract
:In recent years, UAV remote sensing has gradually attracted the attention of scientific researchers and industry, due to its broad application prospects. It has been widely used in agriculture, forestry, mining, and other industries. UAVs can be flexibly equipped with various sensors, such as optical, infrared, and LIDAR, and become an essential remote sensing observation platform. Based on UAV remote sensing, researchers can obtain many high-resolution images, with each pixel being a centimeter or millimeter. The purpose of this paper is to investigate the current applications of UAV remote sensing, as well as the aircraft platforms, data types, and elements used in each application category; the data processing methods, etc.; and to study the advantages of the current application of UAV remote sensing technology, the limitations, and promising directions that still lack applications. By reviewing the papers published in this field in recent years, we found that the current application research of UAV remote sensing research can be classified into four categories according to the application field: (1) Precision agriculture, including crop disease observation, crop yield estimation, and crop environmental observation; (2) Forestry remote sensing, including forest disease identification, forest disaster observation, etc.; (3) Remote sensing of power systems; (4) Artificial facilities and the natural environment. We found that in the papers published in recent years, image data (RGB, multi-spectral, hyper-spectral) processing mainly used neural network methods; in crop disease monitoring, multi-spectral data are the most studied type of data; for LIDAR data, current applications still lack an end-to-end neural network processing method; this review examines UAV platforms, sensors, and data processing methods, and according to the development process of certain application fields and current implementation limitations, some predictions are made about possible future development directions.
1. Introduction
Since the 1960s, Earth observation satellites have garnered significant attention from both military [1,2] and civilian [3,4,5] sectors, due to their unique high-altitude observation ability, enabling simultaneous monitoring of a wide range of ground targets. Since the 1970s, several countries have launched numerous Earth observation satellites, such as NASA’s Landsat [6] series; ESA’s SPOT [7] series; and commercial satellites such as IKONOS [8], QuickBird, and the WorldView series, generating an enormous volume of remote sensing data. These satellites have facilitated the development of several generations of remote sensing image analysis methods, including remote sensing index methods [9,10,11,12,13,14,15], object-oriented analysis methods (OBIA) [16,17,18,19,20,21,22], and deep neural network methods [23,24,25,26,27] in recent years, all of which rely on the multi-spectral and high-resolution images generated by these remote sensing satellites.
From the 1980s onward, remote sensing research had mainly been based on satellite data. Due to the cost of satellite launches, there were only a few remote sensing satellites available for a long time, and most satellite images required high costs to obtain limited data, except for a few satellites such as the Landsat series that were partially free. This also affected the direction of remote sensing research. During this period, many remote sensing index methods based on ground target spectral characteristics mainly used free Landsat satellite data. Other satellite data were less used, due to their high purchase costs.
Beside the high cost and lack of supply, remote sensing satellite data acquisition is also constrained by several factors that affect the observation ability and direction of research:
- The observation ability of a remote sensing satellite is determined by its cameras. A satellite can only carry one or two cameras as sensors, and these cameras cannot be replaced once the satellite has been launched. Therefore, the observation performance of a satellite cannot be improved in its lifetime;
- Remote sensing satellites can only observe targets when flying over the adjacent area above the target and along the satellite’s orbit, which limits the ability to observe targets from a specific angle;
- Optical remote sensing satellites use visible and infrared light reflected by observation targets as a medium, such as panchromatic, colored, multi-spectral, and hyper-spectral remote sensing satellites. For these satellites, the target illumination conditions seriously affect the observation quality. Effective remote sensing imagery data only can be obtained when the satellite is flying over the observation target and when the target has good illumination conditions;
- For optical remote sensing satellites, meteorological conditions, such as cloud cover, can also affect the observation result, which limits the selection of remote sensing images for research;
- The resolution of remote sensing imagery data is limited by the distance between the satellite and the target. Since remote sensing satellites are far from ground targets, their image resolution is relatively low.
These constraints not only limit the scope of remote sensing research but also affect research directions. For instance, land cover/land use is a important aspect of remote sensing research. However, the research object of land cover/land use is limited by the spatial resolution of remote sensing image data. The current panchromatic cameras carried by remote sensing satellites have a resolution of 31 cm/pixel, which can only identify the type, location, and outline information of ground targets with a 3 m [28] size or more, such as buildings, roads, trees, ships, cars, etc. Ground objects with smaller sized aerial projections, such as people, animals, bicycles, etc., cannot be distinguished from the images, due to the relatively large pixel size. Similarly, change detection, which compares different information in images taken of the same target in two or more periods, is another example. Since the data used in many research articles are images taken by the same remote sensing satellite at different times along its orbit and at the same spatial location, the observation angles and spatial resolution of these images are similar, making them suitable for pixel-by-pixel information comparison methods. Hence, change detection has become a key direction in remote sensing research since the 1980s.
In the past decade, the emergence of multi-rotor unmanned aerial vehicles (UAV) has gradually changed the above-mentioned limitations in remote sensing research. This type of unmanned aircraft is pilotless, consumes no fuel, and does not require maintenance of turboshaft engines. These multi-copters are equipped with cheap but reliable brushless motors, which only require a small amount of electricity per flight. Users can schedule the entire flight process of a multi-copter, from takeoff to landing, and edit flight parameters such as passing points, flight speed, acceleration, and climbing rate. Compared to human-crewed aircraft such as helicopters and small fixed-wing aircraft, multi-rotor drones are more stable and reliable, and have several advantages for remote sensing applications.
First, multi-copter drones can carry a variety of sensors flexibly, according to the requirements of the task. Second, the UAV’s observation angle and target observation time are not constrained by specific conditions, as it can be flown by remote control or on a preset route. Third, even under cloudy, rainy, and night conditions, the UAV can be close to the target and data can still be obtained. Finally, the spatial resolution of an image obtained by UAV remote sensing can be up to a millimeter/pixel.
In recent years, there have been several reviews [29,30,31] on UAV remote sensing. Some of these reviews [32,33] focused on similar methods developed from satellite remote sensing in UAV remote sensing data, and some focused on specific application fields, such as forestry [34,35] and precision agriculture [36,37,38,39,40] remote sensing. In this review, we try to explore the progress and changes in the application of UAV remote sensing in recent years. It is worth noting that, besides traditional remote sensing methods such as land cover/land use and change detection, many recent research papers have employed structure-from-motion and multi-view stereo (SfM-MVS) methods [41] and LIDAR scanning to obtain elevation information of ground targets. UAV remote sensing is no longer just a cheap substitute for satellite remote sensing in industrial and agricultural applications. Instead, it is now being used to solve problems that were previously difficult to address using satellite remote sensing, thanks to their flight platform and sensor advantages. As a result, non-traditional research fields such as forestry, artificial buildings, precision agriculture, and the natural environment have received increased attention in recent years.
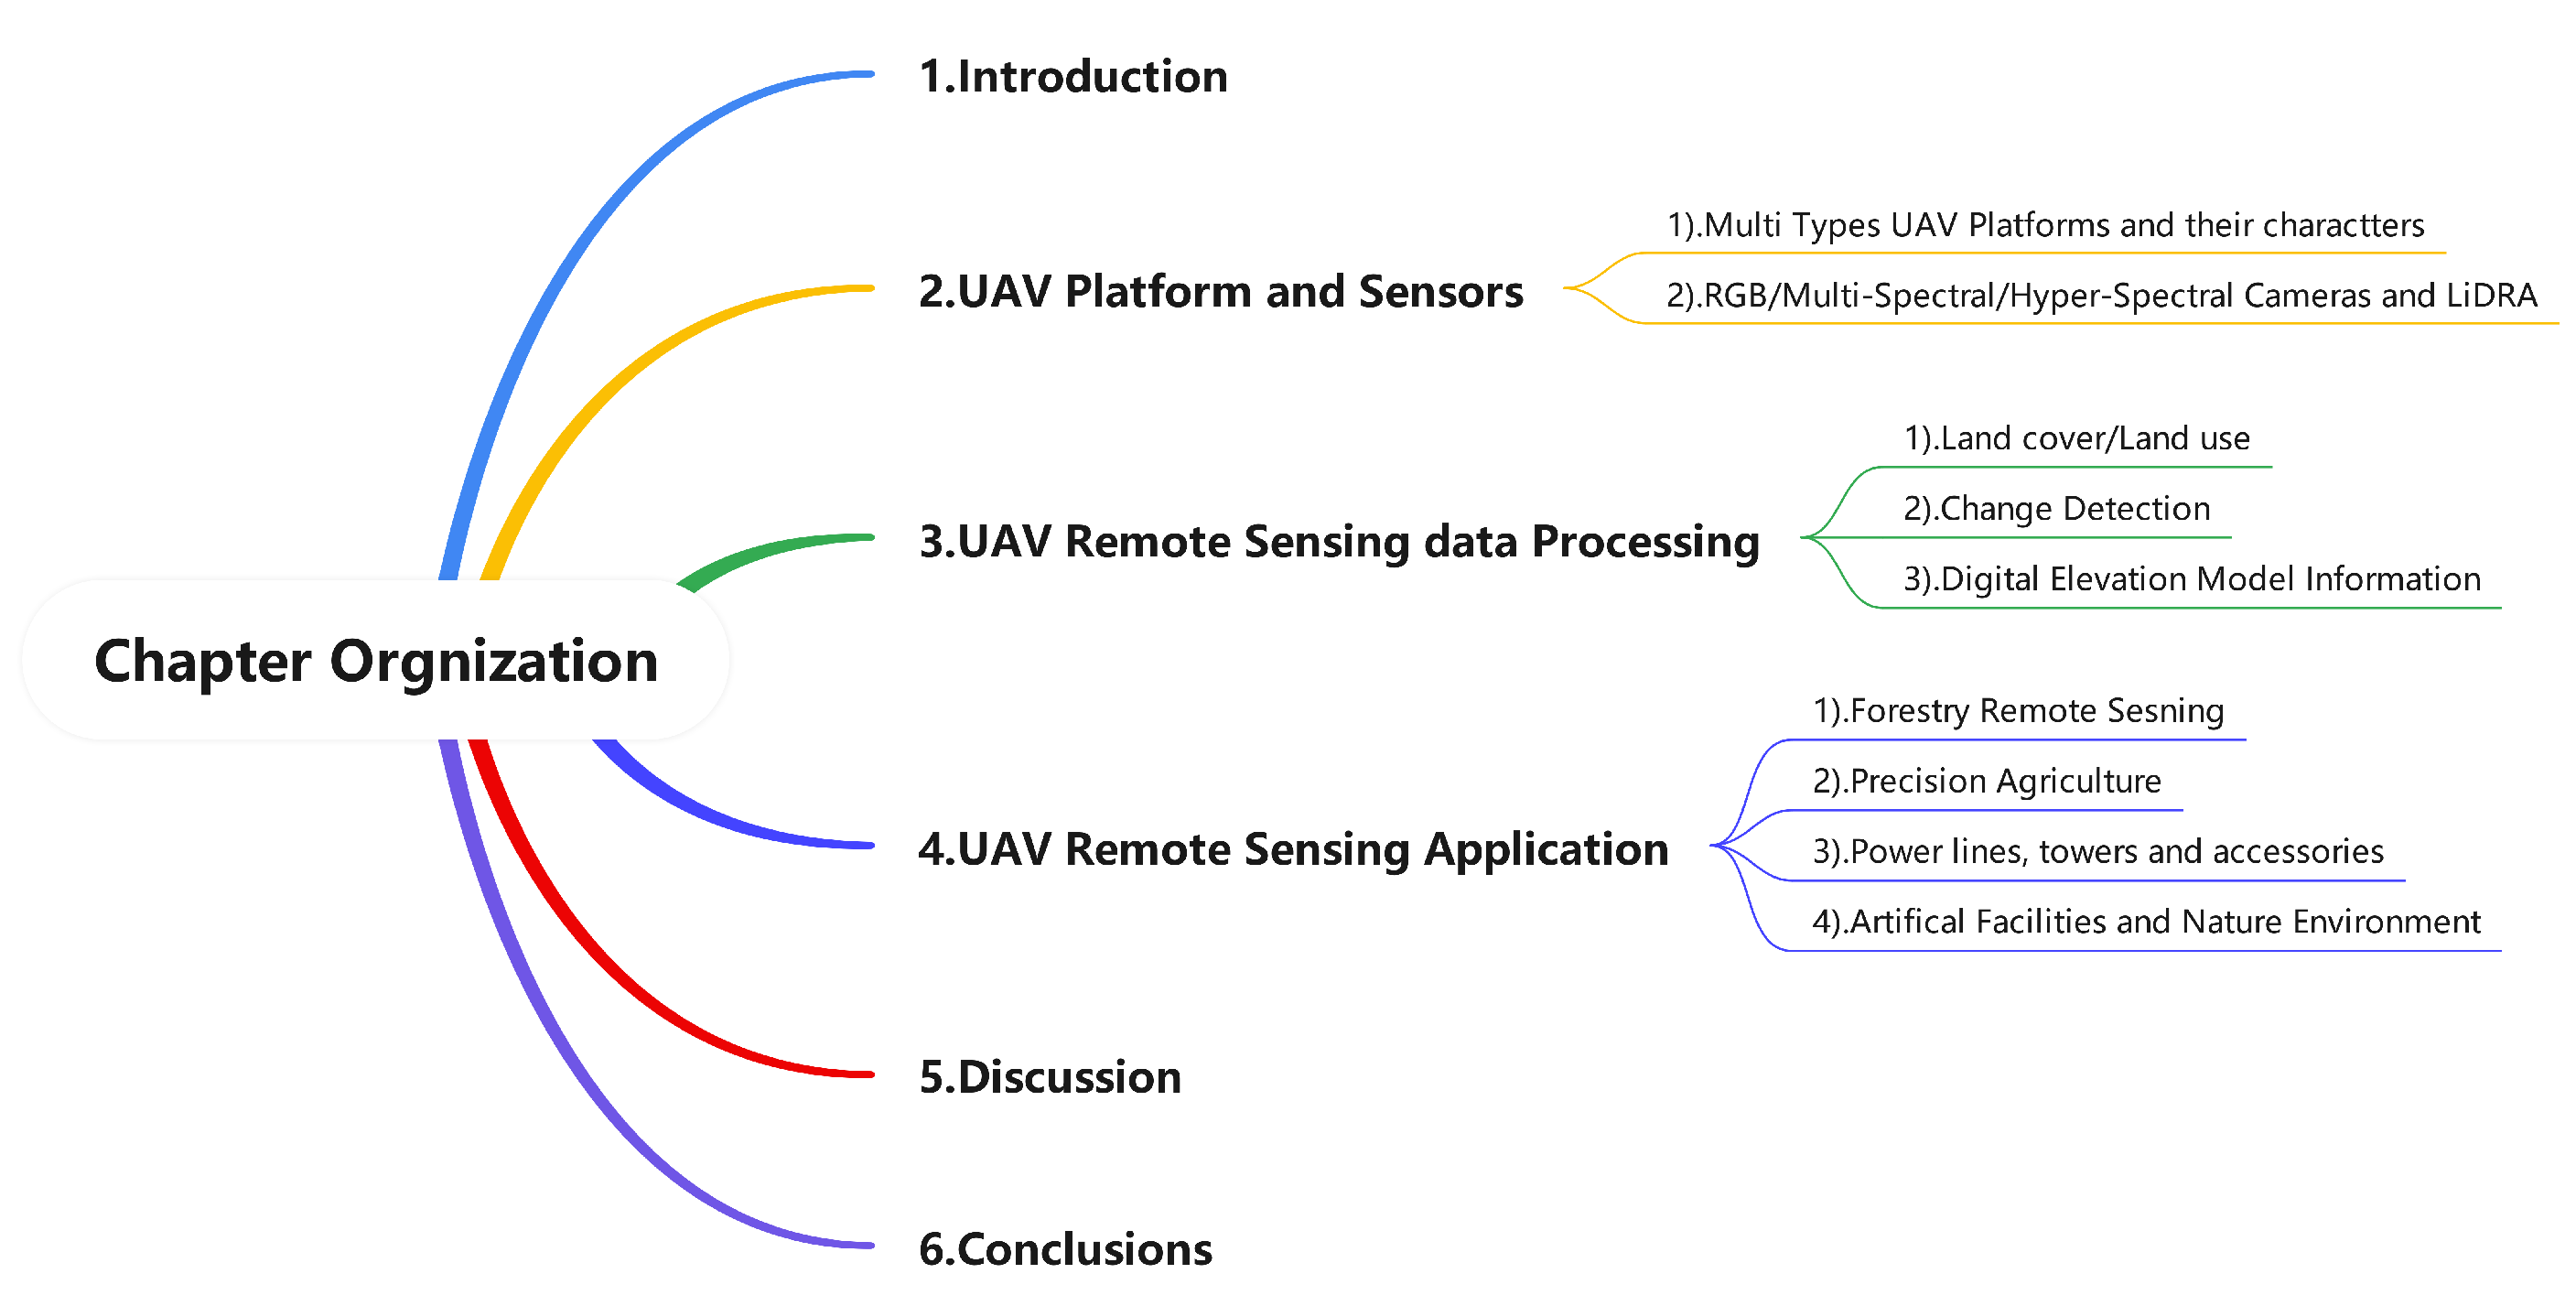
As shown in Figure 1, the structure of this article includes the following sections: Section 1 is the introduction of the review, which includes the limitations of traditional satellite remote sensing, the technological background of UAV remote sensing, and the current application scope. Section 2 introduces the different types of platform and sensor for drones. Section 3 introduces the processing methods of UAV remote sensing data, including methods of land cover/land, change detection, and digital elevation models. Section 4 presents typical application scenarios reflected in recent journal articles on UAV remote sensing, including forest remote sensing, precision agriculture, power line remote sensing, artificial targeting, and natural environment remote sensing. Section 5 provides a discussion, and Section 6 presents the conclusions.
2. UAV Platforms and Sensors
The hardware of a UAV remote sensing platform consists of two parts: the flight platform of the drone, and the sensors they are equipped with. Compared to remote sensing satellites, one of the most significant advantages of UAV remote sensing is the flexible replacement of sensors, which allows researchers to use the same drone to study the properties and characteristics of different objects by using different types of sensors. Figure 2 shows this sections’ structure, including the drone’s flight platform and the different types of sensors carried.
2.1. UAV Platform
UAVs have been increasingly employed as a remote sensing observation platform for near-ground applications. Multi-rotor, fixed-wing, hybrid UAVs, and unmanned helicopters are the commonly used categories of UAVs. Among these, multi-rotor UAVs have gained the most popularity, owing to their numerous advantages. These UAVs, which come in various configurations, such as four-rotor, six-rotor, and eight-rotor, offer high safety during takeoff and landing and do not require a large airport or runway. They are highly controllable during flight and can easily adjust their flight altitude and speed. Additionally, some multi-rotor UAVs are equipped with obstacle detection abilities, allowing them to stop or bypass obstacles during flight. Figure 3 shows four typical UAV platforms.
Multi-rotor UAVs utilize multiple rotating propellers powered by brushless motors to control lift. This mechanism enables each rotor to independently and frequently adjust its rotation speed, thereby facilitating quick recovery of flight altitude and attitude in case of disturbances. However, the power efficiency of multi-rotor UAVs is not prominent, and their flight duration is relatively short. Common consumer grade drones, after carefully optimizing their weight and power, have a duration of about 30 min; for example, DJI’s Mavic Pro has a flight range of 27 min, Mavic 2 has a range of 31 min, and Mavic Air 2 has a range of 34 min. Despite these limitations, multi-rotor UAVs have been extensively used as remote sensing data acquisition platforms in the reviewed literature.
Fixed-wing UAVs, which are similar in structure to common aircraft, generate lift force from the upper and lower air pressure generated by their fixed wings during forward movement. These UAVs require a runway for takeoff and landing, and their landing process is more challenging to control than that of multi-rotor UAVs. The stable flight of fixed-wing UAVs necessitates that the wings provide more lift than the weight of the aircraft, requiring the UAV to maintain a certain minimum speed throughout its flight. Consequently, these UAVs cannot hover, and their response to rising or falling airflow is limited. While the flight speed of fixed-wing UAVs is superior to that of multi-rotor UAVs, their flight duration is also longer.
Unmanned helicopters, which have a structure similar to helicopters, employ a large rotor to provide lift and a tail rotor to control direction. These UAVs possess excellent power efficiency and flight duration, but their mechanical blade structure is complex, leading to high vibrations and costs. Nonetheless, limited research work on using unmanned helicopters as a remote sensing platform was reported in the reviewed literature.
Hybrid UAVs, also known as vertical take-off and landing (VTOL), combine the features of both multi-rotor and fixed-wing UAVs. These UAVs take off and land in multi-rotor mode and fly in fixed-wing mode, providing the advantages of easy control during takeoff and landing and energy-saving during flight.
2.2. Sensors Carried by UAVs
UAVs have been widely utilized as a platform for remote sensing, and the sensors carried by these aircraft play a critical role in data acquisition. Among the sensors commonly used by multi-rotor UAVs, there are two main categories: imagery sensors and three-dimensional information sensors. In addition to the two types of sensor that are commonly used, other types of sensors carried by drones include gas sensors, air particle sensors, small radars, etc. Figure 4 shows four typical UAV-carried sensors.
Imagery sensors capture images of the observation targets and can be further classified into several types. RGB cameras capture images in the visible spectrum and are commonly used for vegetation mapping, land use classification, and environmental monitoring. Multi-spectral/hyper-spectral cameras capture images in multiple spectral bands, enabling the identification of specific features such as vegetation species, water quality, and mineral distribution. Thermal imagers capture infrared radiation emitted by the targets, making it possible to identify temperature differences and detect heat anomalies. These sensors can provide high-quality imagery data for various remote sensing applications.
In addition to imagery sensors, multi-rotor UAVs can also carry three-dimensional information sensors. These sensors are relatively new and have been developed in recent years with the advancement of simultaneous localization and mapping (SLAM) technology. LIDAR sensors use laser beams to measure the distance between the UAV and the target, enabling the creation of high-precision three-dimensional maps. Millimeter wave radar sensors use electromagnetic waves to measure the distance and velocity of the targets, making them suitable for applications that require long-range and all-weather sensing. Multi-camera arrays capture images from different angles, allowing the creation of 3D models of the observation targets. These sensors can provide rich spatial information, enabling the analysis of terrain elevation, structure, and volume.
2.2.1. RGB Cameras
RGB cameras are a prevalent remote sensing sensor among UAVs, and two types of RGB cameras are commonly used on UAV platforms. The first type is the UAV-integrated camera, which is mounted on the UAV using its gimbal. This camera typically has a resolution of 20 megapixels or higher, such as the 20-megapixel 4/3-inch image sensor integrated into the DJI Mavic 3 aircraft and the 20-megapixel 1-inch image sensor integrated into AUTEL’s EVO II Pro V3 UAV. These cameras can capture high-resolution images at high frame rates, offering the advantages of being lightweight, compact, and having a long endurance. However, they cannot replace the original lens with telephoto and wide-angle lenses, which are required for remote and wide-angle environments.
The second type of camera commonly carried by UAVs is a single lens reflex (SLR) camera, which enables the replacement of lenses with different focal lengths. UAVs equipped with SLR cameras offer the advantage of lens flexibility and can be used for remote sensing or wide-angle observation, making them a valuable tool for such applications. Nonetheless, SLR cameras are heavier and require gimbals for installation, necessitating a UAV with sufficient size and load capacity to accommodate them. For example, Liu et al. [42] utilized the SONY A7R camera, which provides multiple lens options, including zoom and fixed focus lenses, to produce a high-precision digital elevation model (DEM) in their research.
2.2.2. Multi-Spectral and Hyper-Spectral Camera
Multi-spectral and hyper-spectral cameras are remote sensing instruments that collect the spectral radiation intensity of reflected sunlight at specific wavelengths. A multi-spectral camera is designed to provide data similar to that of multi-spectral remote sensing satellites, allowing for quantitative observation of the radiation intensity of reflected light on ground targets in specific sunlight bands. In processing multi-spectral satellite remote sensing image data, the reflected light intensity data of the same ground target in different spectral bands are used as remote sensing indices, such as the widely used normalized difference vegetation index (NDVI) [9] dimensionless index, which is defined as in Equation (1):
In Equation (1), NIR refers to the measured intensity of reflected light in the near-infrared spectral range (700∼800 nm), while Red refers to the measured intensity of reflected light in the red spectral range (600∼700 nm). The NDVI index is used to measure vegetation density, as living green plants, algae, cyanobacteria, and other photosynthetic autotrophs absorb red and blue light but reflect near-infrared light. Thus, vegetation-rich areas have higher NDVI values.
After the launch of the Landsat-1 satellite in 1972, multi-spectral scanner system (MSS) sensors that can independently observe the ground reflected light according to the frequency range became a research hot spot data source. When dealing with the problem of spring vegetation greening and subsequent degradation in the Great Plains of the Central United States, the studied regional latitude differences are large, so NVDI [9] was proposed as a spectral index method that is not sensitive to changes of latitude and solar zenith angle. The NDVI index ranges from 0.3 to 0.8 in densely vegetated areas, and the NDVI value range is negative for cloud- and snow-covered areas; for a water body, the NDVI value is close to 0; for bare soil, the NDVI value is a small positive value.
In addition to the vegetation index, other common remote sensing indices include the normalized difference water index (NDWI) [12], enhanced vegetation index (EVI) [11], leaf area index (LAI) [43], modified soil adjusted vegetation index (MSAVI) [13], soil adjusted vegetation index (SAVI) [14], and other remote sensing index methods. These methods measure the spectral radiation intensity of blue light, green light, red light, red edge, near-infrared, and other object reflection bands.
Table 1 presents a comparison between the multi-spectral cameras of UAVs and the multi-spectral sensors of satellites. One notable difference is that a UAV’s multi-spectral camera has a specific narrow band known as the “red edge” [44], which is not present in many satellites’ multi-spectral sensors. This band has a wavelength range of 680 nm to 730 nm, transitioning from the visible light frequencies easily absorbed by plants to the infrared band largely reflected by plant cells. From a spectral perspective, this band represents an area where the reflectance of sunlight of plants changes significantly. A few satellites, such as the European Space Agency(ESA)’s Sentinel-2, have data available in this band. Research on satellite data has revealed a correlation between leaf area index (LAI) [43] and this band [45,46,47]. LAI [43] is a crucial variable in predicting photosynthetic productivity and evapotranspiration. Another significant difference between UAV multi-spectral cameras and satellite sensors is the advantage of UAVs’ multi-spectral cameras in spatial resolution. UAV multi-spectral cameras can reach centimeter/pixel spatial resolution, which is currently unattainable by satellite sensors. Centimeter-resolution multi-spectral images have many applications in precision agriculture.
Hyper-spectral and multi-spectral cameras are both imaging devices that can capture data across multiple wavelengths of light. However, there are some key differences between these two types of camera. Multi-spectral cameras typically capture data across a few discrete wavelength bands, while hyper-spectral cameras capture data across many more (often hundreds) of narrow and contiguous wavelength bands. Moreover, multi-spectral cameras generally have a higher spatial resolution than hyper-spectral cameras. Additionally, hyper-spectral cameras are typically more expensive than multi-spectral cameras. Table 2 provides a summary of several hyper-spectral cameras and their features and that were utilized in the papers we reviewed.
The data produced by hyper-spectral cameras are not only useful for investigating the reflected spectral intensity of green plants but also for analyzing the chemical properties of ground targets. Hyper-spectral data can provide information about the chemical composition and water content of soil [48], as well as the chemical composition of ground minerals [49,50]. This is because hyper-spectral cameras can capture data across many narrow and contiguous wavelength bands, allowing for detailed analysis of the unique spectral signatures of different materials. The chemical composition and water content of soil can be determined based on the unique spectral characteristics of certain chemical compounds or water molecules, while the chemical composition of minerals and artifacts can be identified based on their distinctive spectral features. As such, hyper-spectral cameras are highly versatile tools that can be utilized for a broad range of applications in various fields, including agriculture, geology, and archaeology.
2.2.3. LIDAR
LIDAR, an acronym for “laser imaging, detection, and ranging”, is a remote sensing technology that has become increasingly popular in recent years, due to its ability to generate precise and highly accurate 3D images of the Earth’s surface. LIDAR systems mounted on UAVs are capable of collecting data for a wide range of applications, including surveying [51,52], environmental monitoring [53], and infrastructure inspection [54,55,56].
One of the key advantages of using LIDAR in UAV remote sensing is its ability to provide highly accurate and detailed elevation data. By measuring the time it takes for laser pulses to bounce off the ground and return to the sensor, LIDAR can create a high-resolution digital elevation model (DEM) of the terrain. This data can be used to create detailed 3D maps of the landscape, which are useful for a variety of applications, such as flood modeling, land use planning, and urban design.
Another benefit of using LIDAR in UAV remote sensing is its ability to penetrate vegetation cover to some extent, allowing for the creation of detailed 3D models of forests and other vegetation types. Multiple return LIDAR has the ability to measure the return time of different pulses of reflected light emitted at the same time. By precisely using this feature, information on the canopy structure in a forest can be obtained by measuring the different return times. This data can be used for ecosystem monitoring, wildlife habitat assessment, and other environmental applications.
In addition to mapping and environmental monitoring, LIDAR-equipped UAVs are also used for infrastructure inspection and construction environment monitoring. By collecting high-resolution images of bridges, buildings, and other structures, LIDAR can help engineers and construction professionals identify potential problems. Figure 5 shows mechanical scanning and solid-state LIDAR.
LIDAR technology has evolved significantly in recent years with the emergence of solid-state LIDAR technology, which uses an array of stationary lasers and photodetectors to scan the target area. Solid-state LIDAR technology offers several advantages over mechanical scanning LIDAR, which use a rotating mirror or prism to scan a laser beam across the target area. Solid-state LIDAR is typically more compact and lightweight, making it well suited for use on UAVs.
3. UAV Remote Sensing Data Processing
UAV remote sensing has several advantages compared with satellite remote sensing: (1) UAV remote sensing can be equipped with specific sensors for observation, as required. (2) UAV remote sensing can observe targets at any time period allowed by weather and environmental conditions. (3) UAV remote sensing can set a repeatable flight route, to achieve multiple target observations from a set altitude and angle. (4) The image sensor mounted on the UAV is closer to the target, and the image resolution obtained by observation is higher. These characteristics have not only allowed the remote sensing community to produce new techniques in land cover/land use and change detection based on remote sensing satellite data in the past, but have also contributed to the growth of forest remote sensing, precision agriculture remote sensing, and other research directions.
3.1. Land Cover/Land Use
Land cover and land use are fundamental topics in satellite remote sensing research. This field aims to extract information about ground observation targets from low-resolution image data captured by early remote sensing satellites. NASA’s Landsat series satellite program is the longest-running Earth resource observation satellite program to date, with 50 years of operation since the launch of Landsat-1 [57] in 1972.
In the early days of remote sensing, land use classification methods focused on identifying and classifying the spectral information of pixels covering the target object, known as sub-pixel approaches [58]. The concept of these methods is that the spectral characteristics of a single pixel in a remote sensing image are based on the spatial average of the spectral signatures reflected from multiple object surfaces within the area covered by that pixel.
However, with the emergence of high-resolution satellites, such as QuickBird and IKONOS, which can capture images with meter-level or decimeter-level spatial resolution, the industry has produced a large amount of high-resolution remote sensing data with sufficient object textural features. This has led to the development of object-based image analysis (OBIA) methods for land use/land cover.
OBIA uses a super-pixel segmentation method to segment the image and then applies a classifier method to classify the spectral features of the segmented blocks and identify the type of ground targets. In recent years, neural network methods, especially the full convolution neural network (FCN) [59] method, have become the mainstream methods of land use and land cover research. Semantic segmentation [23,60,61] and instance segmentation [24,62,63] neural network methods can extract the type, location, and spatial range information of ground targets end-to-end from remote sensing images.
The emergence of unmanned aerial vehicle (UAV) remote sensing has produced a new generation of data for land cover/land use research. The image sensors carried by UAVs can acquire images with decimeter-level, centimeter-level, or even millimeter-level resolution, allowing the problem of information extraction for small objects on the ground, which were previously difficult to study, to become a new research interest, such as people on the street, cars, animals, and plants.
Researchers have proposed various methods to address these challenges. For instance, PEMCNet [64], an encoder–decoder neural network method proposed by Zhao et al., achieved good classification results for LIDAR data taken by UAVs, with a high accuracy for ground objects such as buildings, shrubs, and trees. Harvey et al. [65] proposed a terrain matching system based on the Xception [66] network model, which uses a pretrained neural network to determine the position of the aircraft without relying on inertial measurement units (IMUs) and global navigation satellite systems (GNSS). Additionally, Zhuang et al. [67] proposed a method based on neural networks to match remote sensing images of the same location taken from different perspectives and resolutions, called multiscale block attention (MSBA). By segmenting and combining the target image and calculating the loss function separately for the local area of the image, the authors realized a matching method for complex building targets photographed from different angles.
3.2. Change Detection
Remote sensing satellites can observe the same target area multiple times. Comparing the images obtained from two observations, we can detect changes in the target area over time. Change detection using remote sensing satellite data has wide-ranging applications, such as in urban planning, agricultural surveying, disaster detection and assessment, map compilation, and more.
UAV remote sensing technology allows for data acquisition from multiple aerial photos taken at different times along a preset route. Compared to other types of remote sensing, UAV remote sensing has advantages in spatial resolution and data acquisition for change detection. Some of the key benefits include: (1) UAV remote sensing operates at a lower altitude, making it less susceptible to meteorological conditions such as clouds and rain. (2) The data obtained through UAV remote sensing are generated through structure-from-motion and multi-view stereo (SfM-MVS) and airborne laser scanning (ALS) methods, which enable the creation of a DEM for the observed target and adjacent areas, allowing us to monitor changes in three dimensions over time. (3) UAVs can acquire data at user-defined time intervals by conducting multiple flights in a short time.
Recent research on change detection based on UAV remote sensing data has focused on identifying small and micro-targets, such as vehicles, bicycles, motorcycles, and tricycles, and tracking their movements using UAV aerial images and video data. Another area of research involves the practical application of UAV remote sensing for detecting changes in 3D models of terrain, landforms, and buildings.
For instance, Chen et al. [68] proposed a method to detect changes in buildings using RGB images obtained from UAV aerial photography and 3D reconstruction of RGB-D data. Cook et al. [69] compared the accuracy of 3D models generated using a SfM-MVS method and LIDAR scanning measurement for reconstructing complex mountainous river terrain areas, with a root-mean-square error (RMSE) of 30∼40 cm. Mesquita et al. [70] developed a change detection method, which was tested on the Oil Pipes Construction Dataset(OPCD) and successfully detected construction traces from multiple pictures taken by UAV at different times in the same area and space. Hastaouglu et al. [71] monitored three-dimensional displacement in a garbage dump using aerial image data and the SfM-MVS method [41] to generate a three-dimensional model. Lucieer et al. [72] proposed a method for reconstructing a three-dimensional model of landslides in mountainous areas based on unmanned aerial vehicle multi-view images using the SfM-MVS method. The measured horizontal accuracy was 7 cm, and the vertical accuracy was 6 cm. Li et al. [73] monitored the deformation of the slope section of large water conservancy projects using UAV aerial photography and achieved a measurement error of less than 3 mm, which was significantly higher than traditional aerial photography methods. Han et al. [74] proposed a method of using UAVs to monitor road construction, which was applied to an extended road construction site and accurately identified changed ground areas with an accuracy of 84.5∼85%. Huang et al. [75] developed a semantic detection method for changes in construction sites, based on a 3D point cloud data model generated from images obtained through UAV aerial photography.
3.3. Digital Elevation Model (DEM) Information
In recent years, the accurate generation of digital elevation models (DEM) has become increasingly important in remote sensing landform research. DEMs provide crucial information about ground elevation, including both digital terrain models (DTM) and digital surface models (DSM). A DTM represents the natural surface elevation, while a DSM includes additional features such as vegetation and artificial objects. There are two primary methods for calculating elevation information: structure-from-motion and multi-view stereo (SfM-MVS) [41] and airborne laser scanning (ALS).
Among the reviewed articles, the SfM-MVS method gained more attention due to its simple requirements. Sanz-Ablanedo et al. [76] conducted a comparative experiment to assess the accuracy of the SfM-MVS method when establishing a DTM model in a complex mining area covering over 1200 hectares ( m2). The results showed that when a small number of ground control points (GCPs) were used, the root-mean-square error (RMSE) of the checkpoint was plus or minus five times the ground sample distance (GSD), or about 34 cm. In contrast, when more GCPs were used (i.e., more than 2 GCP in 100 images), the RMSE of the checkpoint response converged to twice the GSD, or about 13.5 cm. Increasing the number of GCPs had a significant impact on the accuracy of the 3D-model generated by the SfM-MVS method. It is worth noting that the authors used a small fixed-wing UAV as their remote sensing platform. Rebelo et al. [77] proposed a method to generate a DTM by taking RGB images from multi-rotor UAVs. The authors used an RGB sensor carried by a DJI Phantom 4 UAV to take images within an area of 55 hectares ( m2) and established a 3D point cloud DTM through the SfM-MVS method. Although the GNSS receiver used was the same model, the horizontal RMSE of the DTM was 3.1 cm, the vertical RMSE was 8.3 cm, and the comprehensive RMSE was 8.8 cm. This precision was much better than that of the fixed-wing UAV method of Sanz-Ablanedo et al. [76]. In another study, Almeida et al. [78] proposed a method for qualitative detection of single trees in forest land based on UAV remote sensing RGB data. In their experiment, the authors used a 20-megapixel camera carried by a DJI Phantom 4 PRO to reconstruct a DTM in the SfM-MVS mode of Agisoft Metashape, over an area of 0.15 hectares. For the DTM model obtained, the RMSE of GCPs in the horizontal direction was 1.6 cm, and that in the vertical direction was 3 cm. Hartwig et al. [79] reconstructed different forms of ravine using SfM-MVS based on multi-view images captured by multiple drones. Through experiments, the authors verified that, even without using GCP for geographic registration, SfM-MVS technology alone could achieve a 5% accuracy in the volume measurement of ravines.
In airborne laser scanning (ALS) methods, Zhang et al. [53] proposed a method to detect ground height in tropical rainforests based on LIDAR data. This method involved scanning a forest area with airborne LIDAR to obtain three-dimensional point cloud data. Local minima were extracted from the point cloud data as candidate points, with some of these candidates representing the ground between trees in the forest area. The DTM generated by the method had high consistency with the ALS-based reference, with a RMSE of 2.1 m.
4. UAV Remote Sensing Application
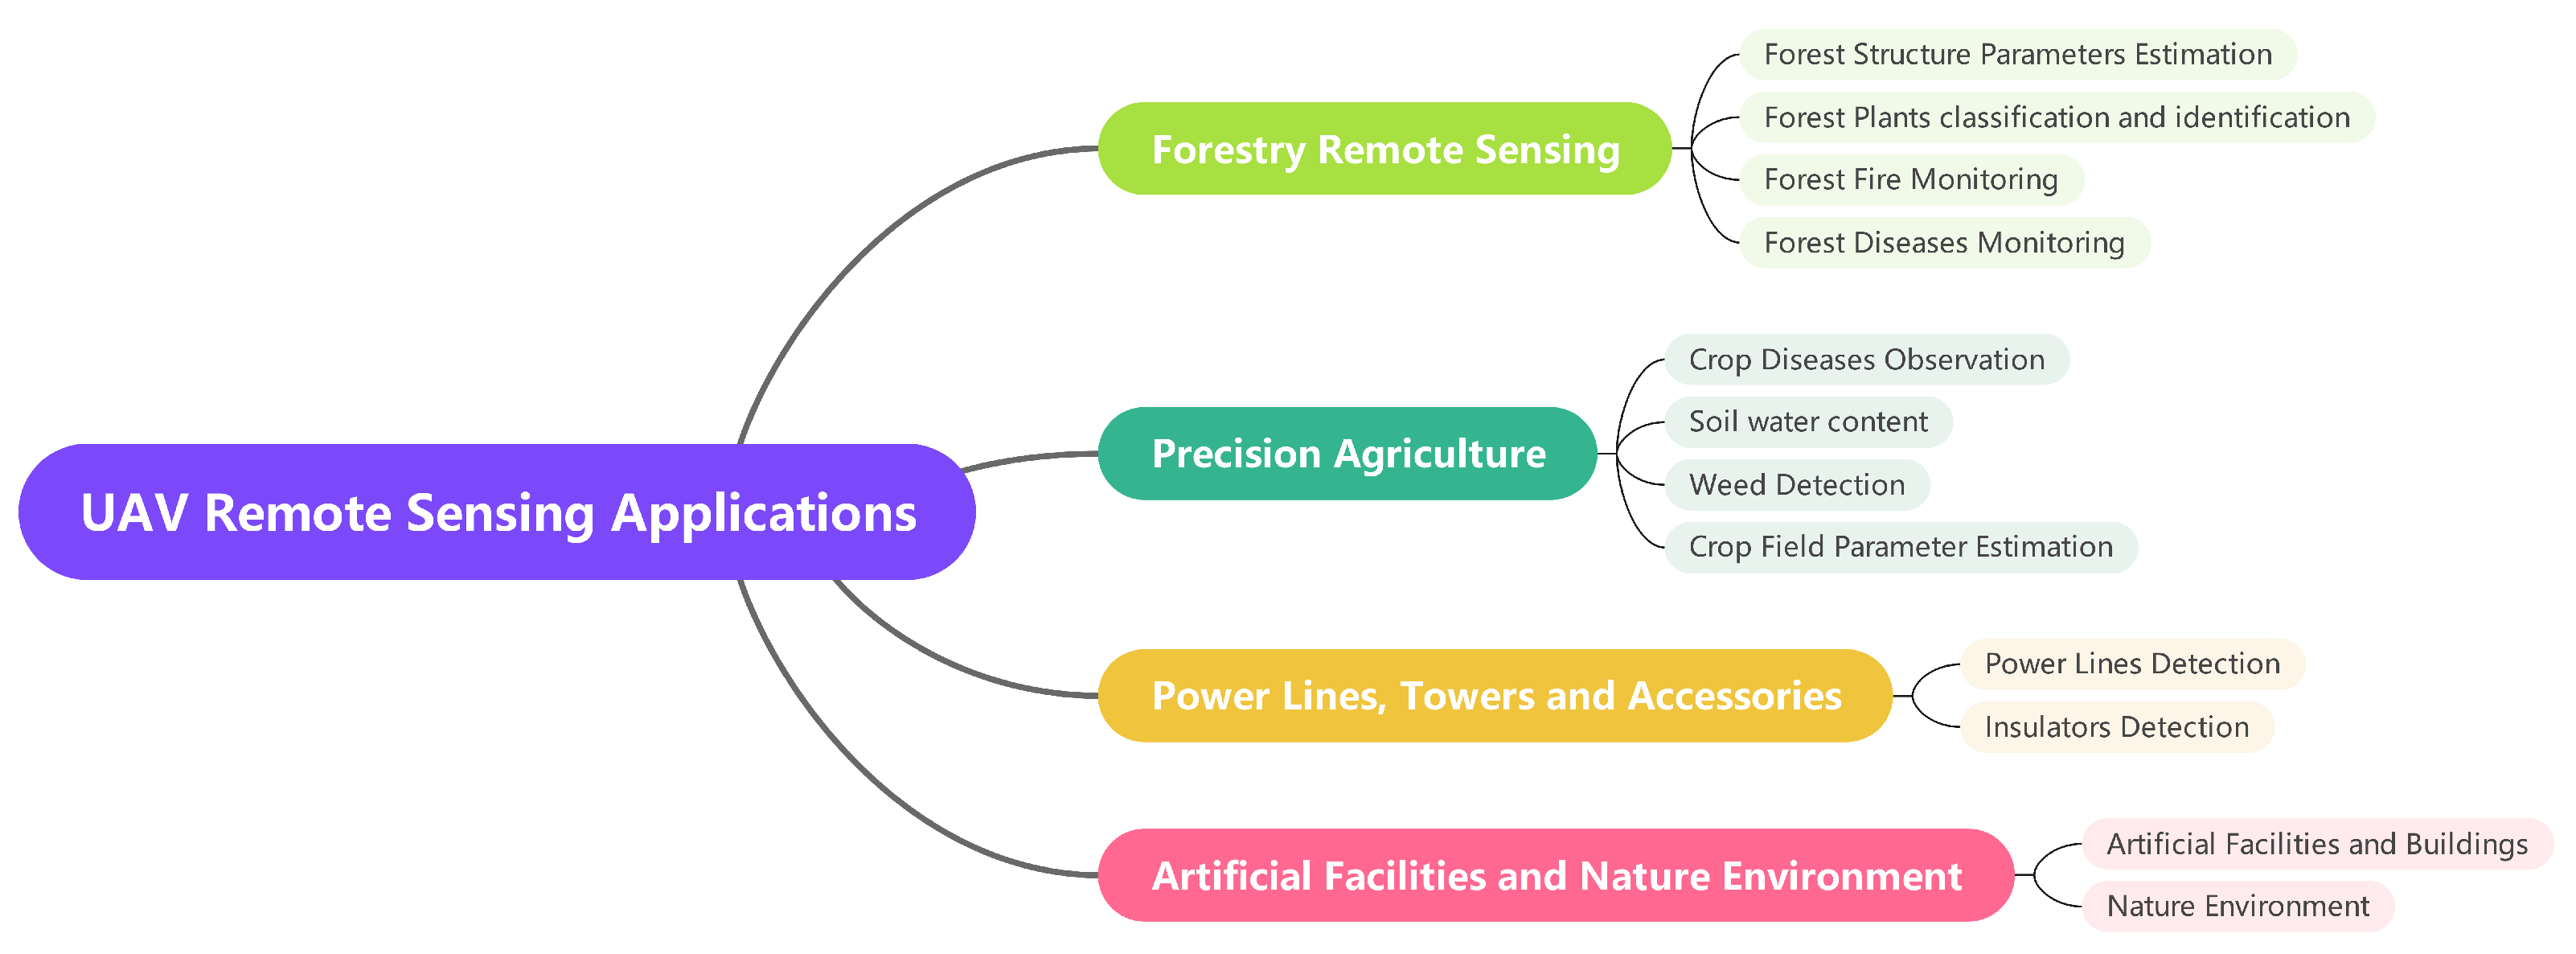
In recent years, the utilization of UAV remote sensing technology has gained significant attention in a variety of fields, such as agriculture [80,81,82,83], forestry [84,85,86], environmental monitoring [87,88,89], and infrastructure inspection [55,67,90]. UAVs provide high-resolution and accurate data that can facilitate informed decision-making and support diverse applications. With the continuous advancement of UAV technology, we can anticipate further innovative and impactful applications in the foreseeable future. Figure 6 shows the organization of the sections on UAV applications.
4.1. UAV Remote Sensing in Forestry
Forestry remote sensing is a relatively small aspect of satellite remote sensing. Multi-spectral and hyper-spectral data related to tree photosynthesis are among the various types of remote sensing satellite data. However, the spatial resolution of remote sensing satellite data is limited and cannot meet the requirements for specific tree types and disease identification. Additionally, remote sensing satellites cannot provide the high-accuracy elevation information necessary for forestry structure studies. Figure 7 shows the organization of the applications in the forestry section.
UAV-based remote sensing technology has introduced a new dimension to forestry remote sensing. With the ability to carry high-resolution and multi-spectral cameras, UAV remote sensing can identify tree types and observe forest diseases. It can also use LIDAR to measure the canopy information of multi-layered forest canopies. Therefore, in recent years, UAV remote sensing technology has emerged as a developing research direction for monitoring forestry ecology. Its primary research areas include (1) Estimation of forest structure parameters; (2) Classification and identification of forest plants; (3) Monitoring of forest fires; and (4) Monitoring of forest diseases.
4.1.1. Estimation of Forest Structural Parameters
The estimation of forest structural parameters, including tree height and canopy parameters, is a crucial research area in forestry. UAV remote sensing technology provides an efficient and accurate approach for estimating these parameters.
Krause et al. [51] investigated two different methods of measuring tree height in dense forests: field measurement, and a method using UAV remote sensing RGB image data. The authors applied UAV remote sensing to measure multiple trees and obtained a RMSE = 0.479 m (2.78%). Ganz et al. [91] investigated the difference in measured tree heights between LiDAR data and UAV RGB images. The authors achieved a RMSE = 0.36 m based on LIDAR data, with a RMSE = 2.89 m on RGB image. Fakhri et al. [92] proposed an object-based image analysis (OBIA) method to estimate tree height and canopy area. The authors employed marker-controlled watershed segmentation (MCWS) [93] to segment the UAV aerial images and classify and post-process the ground target with information from a digital surface model (DSM) and digital terrain model (DTM).
Pu et al. [94] proposed two methods to measure the canopy closure (CC) parameters of trees using unmanned aerial LIDAR data, which can replace the time-consuming and laborious hemispheric photography (HP) method. The first method is based on a canopy-height model (CHM), while the second method is based on synthetic hemispheric photography (SHP). The CHM-based method exhibited a high accuracy in the range of 45 degrees zenith angle, but the accuracy decreased rapidly in the range of 60 to 75 degrees zenith angle. In contrast, the SHP-based method demonstrated a high accuracy in the range of 45, 60, and 75 degrees.
Zhang et al. [53] proposed a method to detect the ground height of tropical rainforest using LIDAR data. The method has three steps: (1) Selecting points with a local minimum value from a large number of point cloud data as candidate points; (2) Comparing each point in the selected local minimum point set with the DTM of their sampling source location, and the points with errors within 2 m are considered as real ground points, while the rest are regarded as non-ground points; and (3) Training a random forest classifier using the local minimum point set of marker type as the training data. This classifier can be used to distinguish ground points from other regional point cloud data. Finally, the DTM is interpolated from the ground points obtained by the random forest classifier using a downsampling method.
4.1.2. Classification and Identification of Forest Plants
Classification and identification of forest plants is an important application of UAV remote sensing in forestry. Different methods have been proposed to achieve this goal.
Mo et al. [95] proposed a neural network method for litchi tree instance segmentation using multi-spectral remote sensing image data. Reder et al. [96] proposed a semantic segmentation neural network method to monitor collapsed trees in a forest after a storm using UAV data. Yu et al. [52] developed a method to classify forest vertical structure using spectral index maps generated from multi-spectral data and canopy height maps generated from LIDAR data. They compared the classification results of three classifiers: random forest (RF), XGBoost [97], and support vector machine (SVM), and obtained the best results with XGBoost. Guo et al. [98] proposed a method to extract tree seedlings in a cost-effective manner in a complex vegetation environment using image data collected by UAV. They combined RGB and grey-level co-occurrence matrix (GLCM) features and used a random forest classifier to identify the crown area in the image. Taylor-Zavala et al. [99] investigated the correlation between the biochemical characteristics of plant cells and their spectral characteristics by comparing the multi-spectral data collected by UAV with the biochemical characteristics of sampled plant leaves.
4.1.3. Monitoring of Forest Fires
Fire is one of the most severe disasters in forest areas, with the potential to spread rapidly and cause widespread damage. Given the potential threat to the safety of first-line firefighters, it is important to have an effective and safe method of monitoring and evaluating forest fires. UAVs are suitable tools for forest fire monitoring, given their ability to provide remote sensing information of fire in real time.
Li et al. [100] proposed a method for predicting the spread process of forest fires using a long–short-term memory (LSTM) [101] neural network model called FNU-LSTM. The authors collected video data of the forest fire spread process using an infrared camera mounted on a UAV and trained the LSTM network model to predict the forest fire spread rate. Hu et al. [102] developed a method for monitoring forest fires using a group of UAVs for remote sensing. Namburu et al. [103] proposed a method to identify forest fires using UAV remote sensing RGB image data. The authors trained an improved artificial neural network, x-mobilenet, a varied MobileNet [104] network model to identify forest fires through the RGB image data of forest fires collected by UAVs and an existing public fire image database, achieving an accuracy rate of 97.22%.
Beltrán-Marcos et al. [105] investigated the relationship between satellite and UAV remote sensing multi-spectral image data for measuring fire severity after a forest fire. The authors found that soil organic carbon (SOC) and soil water content (SMC), which can be estimated using multi-spectral image data, were highly correlated with the severity of the fire.
4.1.4. Monitoring of Forest Diseases
Monitoring forest diseases is essential for forest protection. Pine wilt is a widespread tree disease, with a concentrated research field. The reasons for this include its obvious external symptoms, which can be observed and detected from RGB, multi-spectral, and hyper-spectral image data. Pine is a widely distributed tree species in wild forest areas. Pine wilt disease is widely distributed in forest areas with average temperatures exceeding 20 degrees Celsius [106] and is considered a global threat to forest ecosystems [107]. Table 3 lists part of the reviewed forestry disease articles and compares their data collection locations, drone platforms, sensors, tree species, disease types, and methods of forestry disease identification. Figure 8 shows symptoms of pine wilt disease.
Hu et al. [86] proposed a neural network method based on UAV remote sensing RGB image data to identify diseased pine trees in a forest. The spatial resolution of the dataset sampled by the authors was 5 cm/pixel, and the UAV’s flight height was 380 m. The authors tested several classifiers on the sampled data, and the proposed deep neural network achieved the highest recall rate (91.3%). Wu et al. [108] proposed a method to identify pine wilt based on UAV remote sensing RGB image data. The author divided the disease course of pine wilt into early stage and late stage, plus healthy pine, and divided this into three categories. In the experiment, the recognition accuracy of the neural network method for late stage of fusarium wilt (73.9∼77.2%) was much higher than that of the early stage of fusarium wilt (46.5∼50.8%). Xia et al. [109] studied the shape of pine blight based on camera RGB data taken by a UAV platform and combined with a ground survey. Their research showed that from the RGB images taken with the ordinary SLR camera, using current neural network tools, the accuracy of detecting pine blight could reach 80.6%, while the recall rate could reach 83.1%. Li et al. [110] proposed a pine wilt detection method that can be used with edge computing hardware and that can be placed on UAVs. This method is based on remote sensing RGB data from a UAV and uses the YOLOv4 [111] tiny neural network model to detect the infection of pine with fusarium wilt. Ren et al. [84] proposed a neural network method for detecting pine wilt from UAV remote sensing RGB image data. The spatial resolution of the RGB image sampled by the authors was 5 cm/pixel. The authors considered diseased pine trees as positive samples and other red ground targets (such as red cars, red roofs, and red floors) as negative samples. All samples were checked with boxes. The recall rate of this method was 86.6%, and the accuracy rate was 79.8%. Sun et al. [112] proposed an object-oriented method for detecting pine wilt using UAV remote sensing RGB data.
Yu et al. [85] proposed a neural network method for identifying pine wilt based on UAV remote sensing multi-spectral data. The UAV flew at a height of 100 m, and the spatial resolution of multi-spectral images was 12 cm/pixel. The authors divided the course of pine wilt disease into three stages: early stage, middle stage, and late stage. In addition, healthy pines and other broad-leaved trees were added as two kinds of comparison samples, which made a total of five types of sample. Based on the classified multi-spectral data, the authors found that the correct recognition rate was nearly 50% in the early stage of pine wilt and more than 70% in the middle stage of pine wilt. Yu et al. [113] also proposed a method to detect early pine wilt disease based on UAV hyper-spectral image data. The authors ran a UAV at a flight height of 120 m above ground, using a Resonon Pika L hyper-spectral camera for sampling data. The spatial resolution of the image was 44 cm/pixel, and the LR1601-IRIS LIDAR system was used to collect LIDAR point cloud data. The authors classified UAV hyper-spectral forest image data using a 3D convolution neural network, and the comprehensive accuracy rate of the five types of ground target (pine wilt at early stage, middle stage and late stage, health pine, and other broad-leaved trees) reached 88.11%. Yu et al. [114] also proposed a method to identify pine wilt based on UAV hyper-spectral and LIDAR data. The UAV flew at a height of 70 m, and the spatial resolution of hyper-spectral images was 25.6 cm/pixel. Using a random forest classifier, the authors recognized five types ground target (pine wilt at early stage, middle stage and late stage, health pine, and other broad-leaved trees). Under the condition of using only hyper-spectral data, the classification accuracy was 66.86%; under the condition of using only LIDAR data, the accuracy was 45.56%; with the combination of the two data sources, the accuracy reached 73.96%. Li et al. [115] proposed a method of data recognition based on UAV remote sensing hyper-spectral images. Using a Headwall Nano-Hyperspec as an instrument, 8 data blocks were obtained, each a size of pixels, and with a spatial resolution of 11 cm/pixel. When tested on these different data blocks, the accuracy rate of this method was from 84% to 99.8%, and the recall rate was from 88.3% to 99.9%.
For other types of trees, Dash et al. [116] simulated the changes of leaf reflectance spectrum characteristics caused by forest disease outbreaks through small-scale experiments. This result also proved the feasibility of monitoring forest diseases through UAV multi-spectral remote sensing. Sandino et al. [117] proposed a method for detecting fungal infection of trees in forests based on UAV remote sensing hyper-spectral image data. The authors took images of paperbark tea trees from a forest environment under the condition of partial myrtle rust infection using a Headwall Nano-Hyperspec hyper-spectral camera. The image marked each pixel according to five types: health, infected, background, soil, and protruding tree stump. By training the XGBoost [97] classifier, the authors obtained a comprehensive accuracy of 97.35% on the validation data. Nasi et al. [118] proposed a method for detecting the damage of spruce from beetle disease in a forest based on the UAV remote sensing hyper-spectral data. Gobbi et al. [119] experimented with a method of identifying the degraded state of forests using UAV remote sensing RGB image data. The proposed method generates a 3D point cloud and canopy height model (CHM) through the SfM-MVS method based on UAV remote sensing RGB images. The method measures forest degradation from three dimensions: forest structural integrity, structural complexity, and forest middle vegetation density. The authors stated that the SfM-MVS method is an appropriate tool for building and evaluating forest degradation models. Coletta et al. [120] proposed a method for identifying eucalyptus infection with ceratocystis wilt disease based on UAV remote sensing RGB image data. Xiao et al. [121] proposed a method for detecting apple tree fire blight based on UAV remote sensing multi-spectral data.

Table 3.
Papers reviewed in forest diseases.
| Year | Authors | Study Area | UAV Type | Sensor | Species | Disease | Method Type |
|---|---|---|---|---|---|---|---|
| 2020 | Hu et al. [86] | Anhui, China | Mulit-rotor | RGB | Pine | Pine Wilt | Neural Network |
| 2021 | Wu et al. [108] | Qingkou, Fujian, China | Mulit-rotor | RGB | Pine | Pine Wilt | Neural Network |
| 2021 | Xia et al. [109] | Qingdao, Shandong, China | Fixed-wing | RGB | Pine | Pine Wilt | Neural Network |
| 2021 | Li et al. [110] | Taián, Shandong, China | Mulit-rotor | RGB | Pine | Pine Wilt | Neural Network |
| 2022 | Ren et al. [84] | Yichang, Hubei, China | Mulit-rotor | RGB | Pine | Pine Wilt | Neural Network |
| 2022 | Sun et al. [112] | Dayu, Jiangxi, China | Mulit-rotor | RGB | Pine | Pine Wilt | OBIA |
| 2021 | Yu et al. [85] | Yiwu, Zhejiang, China | Mulit-rotor | Multi-spectral | Pine | Pine Wilt | Neural Network |
| 2021 | Yu et al. [113] | Fushun, Liaoning, China | Mulit-rotor | Hyper-spectral | Pine | Pine Wilt | Neural Network |
| 2021 | Yu et al. [114] | Yiwu, Zhejiang, China | Mulit-rotor | Hyper-spectral & LiDAR | Pine | Pine Wilt | Random Forest |
| 2022 | Li et al. [115] | Yantai, Shandong, China | Mulit-rotor | Hyper-spectral | Pine | Pine Wilt | Neural Network |
| 2022 | Coletta et al. [120] | Fixed-wing | RGB | Eucalyptus | Ceratocystis Wilt | Ensemble Method | |
| 2022 | Xiao et al. [121] | Biglerville, Pennsylvania, USA | Mulit-rotor | Multi-spectral | Apple | Apple Fire Blight | Vegetation Index |
4.2. Remote Sensing for Precision Agriculture
Precision agriculture [122,123] can be defined as the application of modern information technology to process multi-source data for decision-making and operations in crop production management.
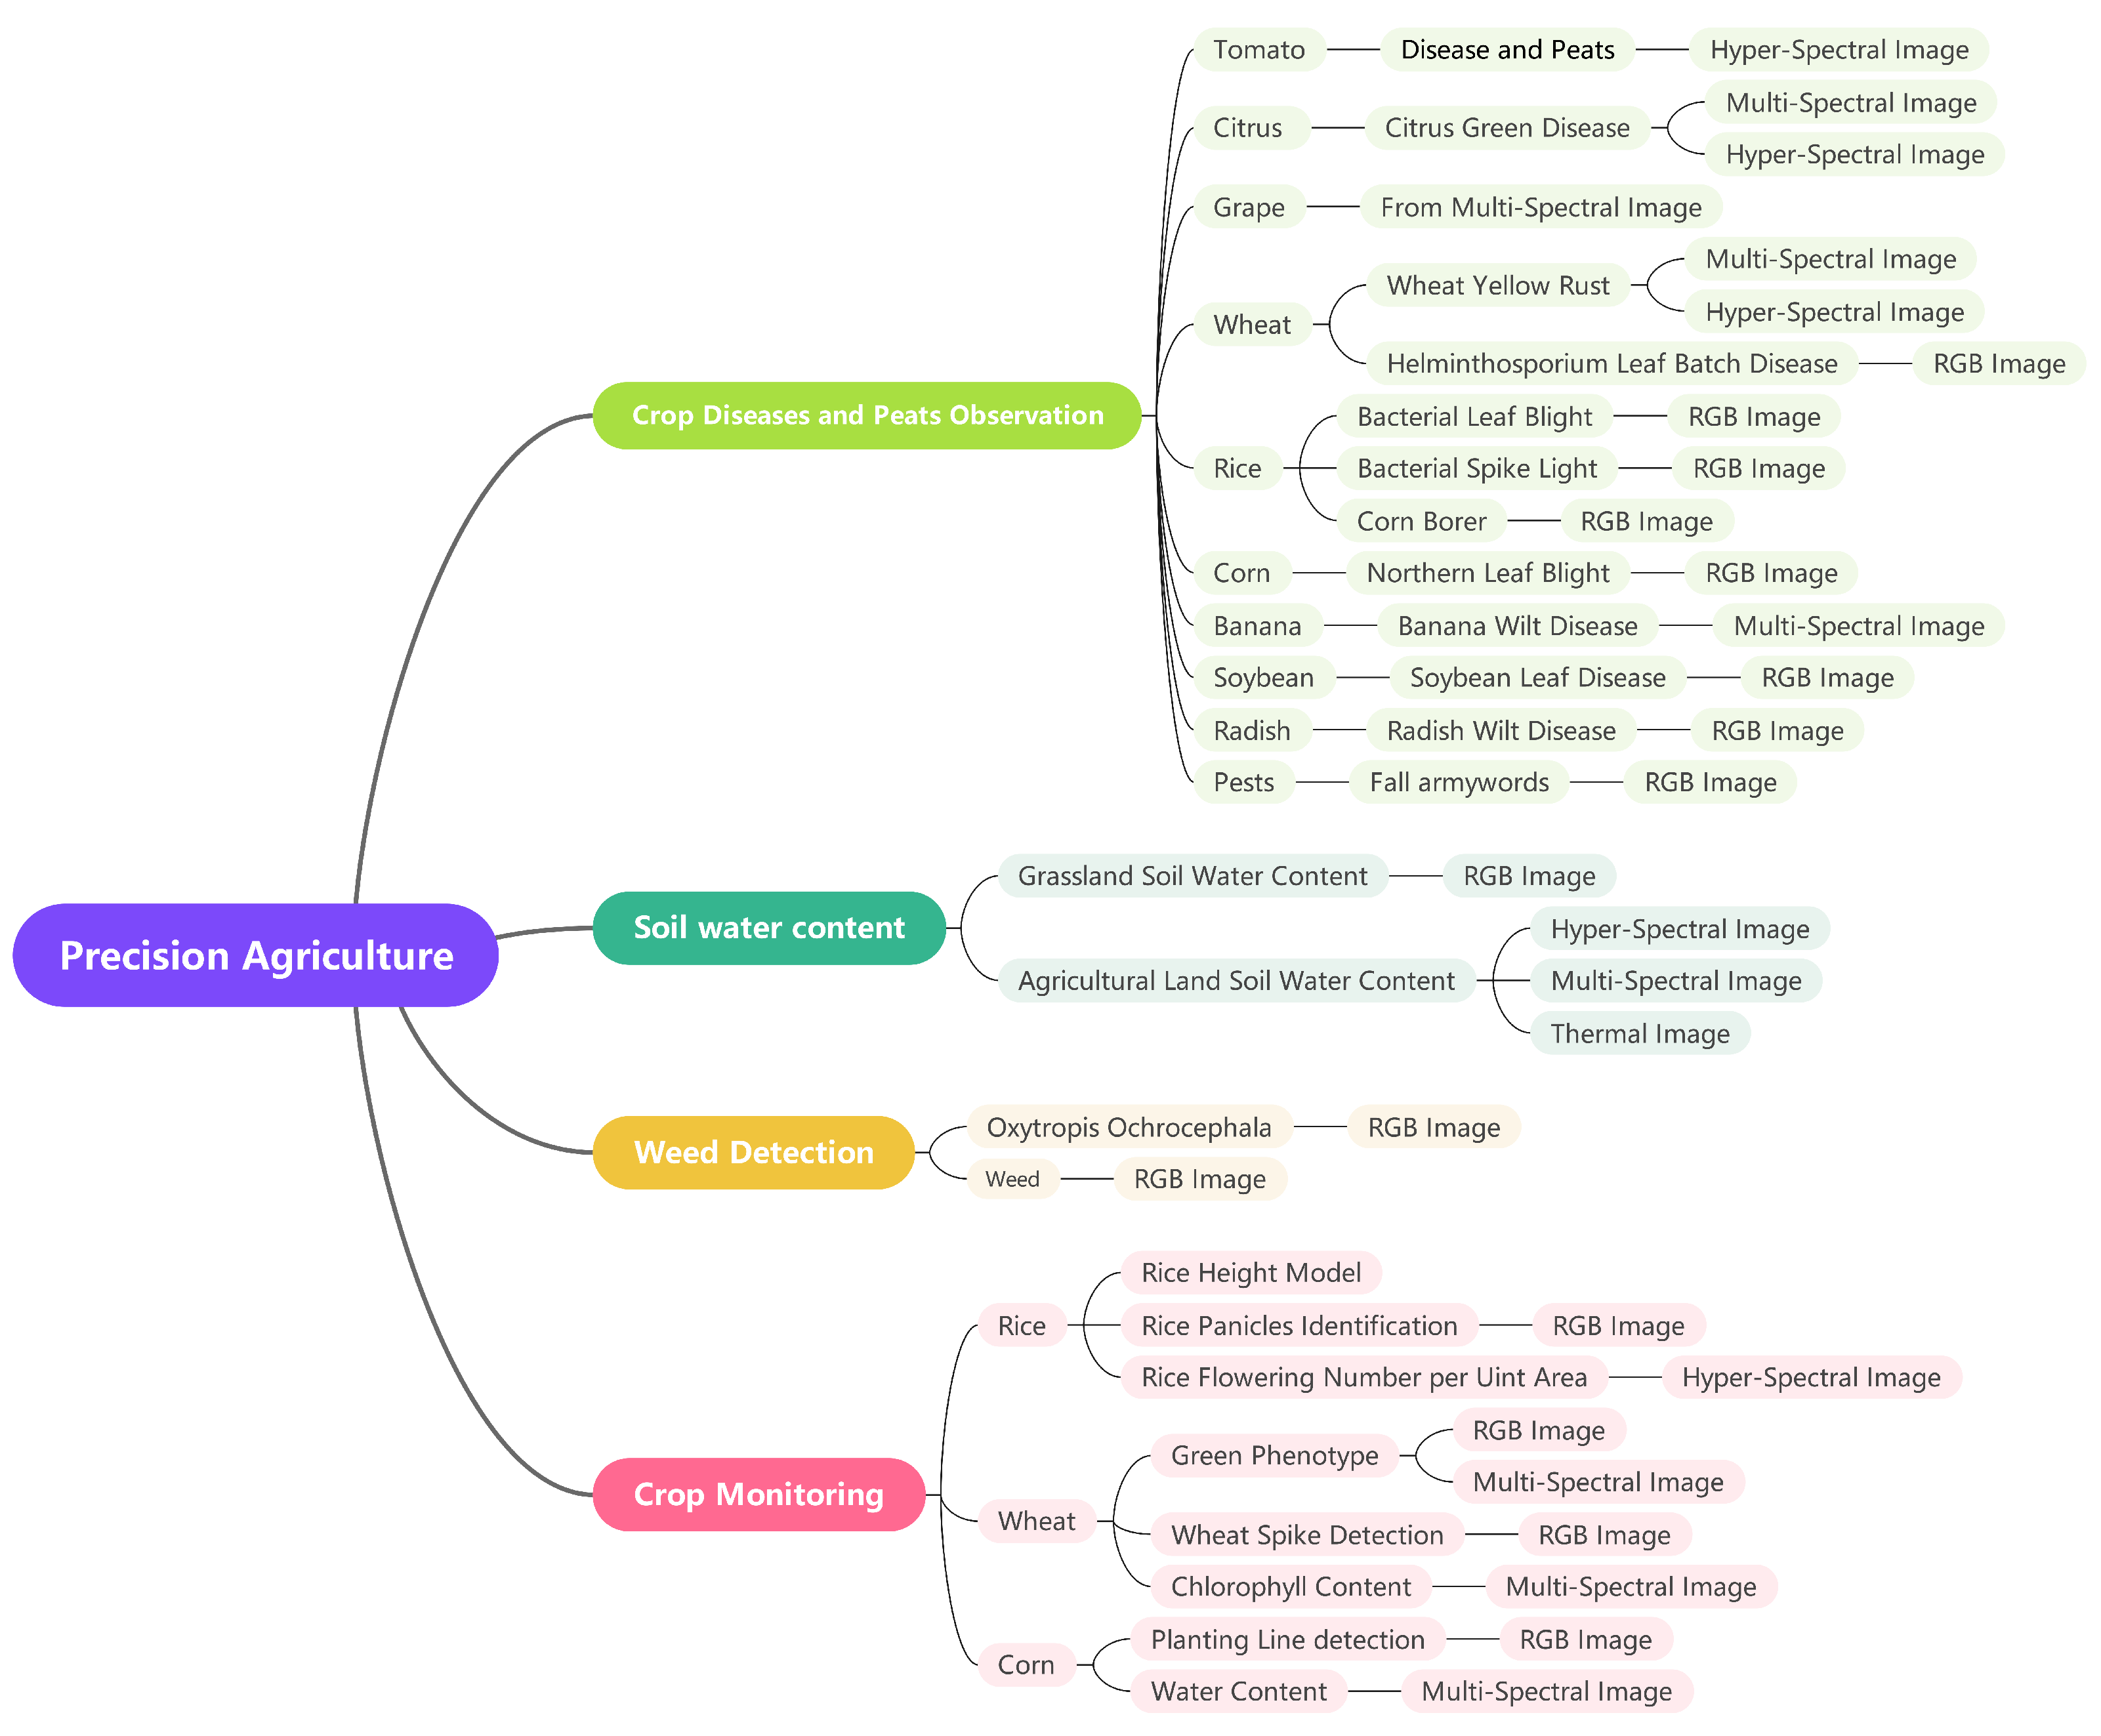
The utilization of UAV remote sensing allows for the acquisition of high-resolution imagery data that facilitates detailed observations of agricultural disease. This approach has gained popularity among researchers in recent years, due to its ability to enhance crop disease observation, water management, weed management, crop monitoring, and yield estimation. UAV remote sensing has become an increasingly useful tool for precision agriculture applications. Figure 9 shows the organization of the applications in precision agriculture.
4.2.1. Crop Disease Observation
Crop diseases can be caused by a variety of pathogens, including viruses, fungi, bacteria, and insects, which can cause phenotypic changes in different plants. As the diameter of the spots on the leaves of plants in the early stage of disease is small (for example, the diameter of the spots of the early stage of wheat yellow rust is only 1∼2 mm), it is difficult to distinguish the early stages of crop disease using satellite remote sensing image data (spatial resolution is larger than 1 m/pixel). The image data provided by satellite remote sensing can only show spectral changes when the chlorophyll and carotene in crop cells in large fields change significantly at the end of the disease, but at this stage, it may be too late to effectively deal with the crops, resulting in irreparable loss of crop yields.
In recent years, UAV remote sensing has been used to observe crop diseases by acquiring near-ground high-resolution images, providing a feasible method for automatic disease observation and prediction in the field. In the articles we reviewed, the application of UAV remote sensing in crop diseases covered a variety of crops. Many crop disease identification methods still rely on certain vegetation indices, but some studies started to use neural networks instead of vegetation indices to achieve high-accuracy identification of diseased crops. Table 4 lists part of the reviewed articles on crop diseases, comparing the drone platforms, sensors, species, disease, and methods of crop disease identification.
Abdulridha et al. [80] proposed a method for distinguishing diseases and pests that are visually similar to tomatoes in the field based on hyper-spectral imagery collected by UAVs.
One severe disease of citrus is huanglongbing (HLB), also known as citrus green disease. Figure 10 shows the symptoms of huanglongbing (HLB). Chang et al. [124] investigated the differences between healthy and diseased orange trees with four vegetation indices: NDVI [9], NDRE [125], MSAVI [13], and chlorophyll index (CI) [126]. NDRE and CI, which are related to the red-edge band, are more capable of monitoring citrus greening disease. In addition, the volume of CHM is also a valuable indicator to distinguish normal and diseased plants. Deng et al. [127] proposed a multi-feature fusion citrus yellow dragon disease recognition method based on hyper-spectral camera data, and the recognition accuracy on the verification dataset reached 99.73%. Moriya et al. [82] examined the spectral band that is most easily distinguished for HLB disease using hyper-spectral camera data. The authors found that the reflected energy of the diseased strain was significantly stronger than that of the normal strain at 460 nm.
Figure 11 shows symptoms of grape disease. Kerkech et al. [128] proposed a neural network method for detecting esca disease plants from grape fields based on UAV RGB image data. By using several energy difference-related vegetation indexes (ExR [129], ExG [130], and ExGR [131]) of diseased and normal plants reflecting light at different wavebands as key features, the authors achieved a recognition accuracy of 95.80%. Kerkech et al. [83] proposed a neural network method for grape disease detection based on UAV remote sensing multi-spectral data. The authors constructed a DSM model of grape fields based on UAV remote sensing images and combined the infrared and visible spectra of image data to detect diseased plants in grape fields. The recognition accuracy of this method was 93.72%.
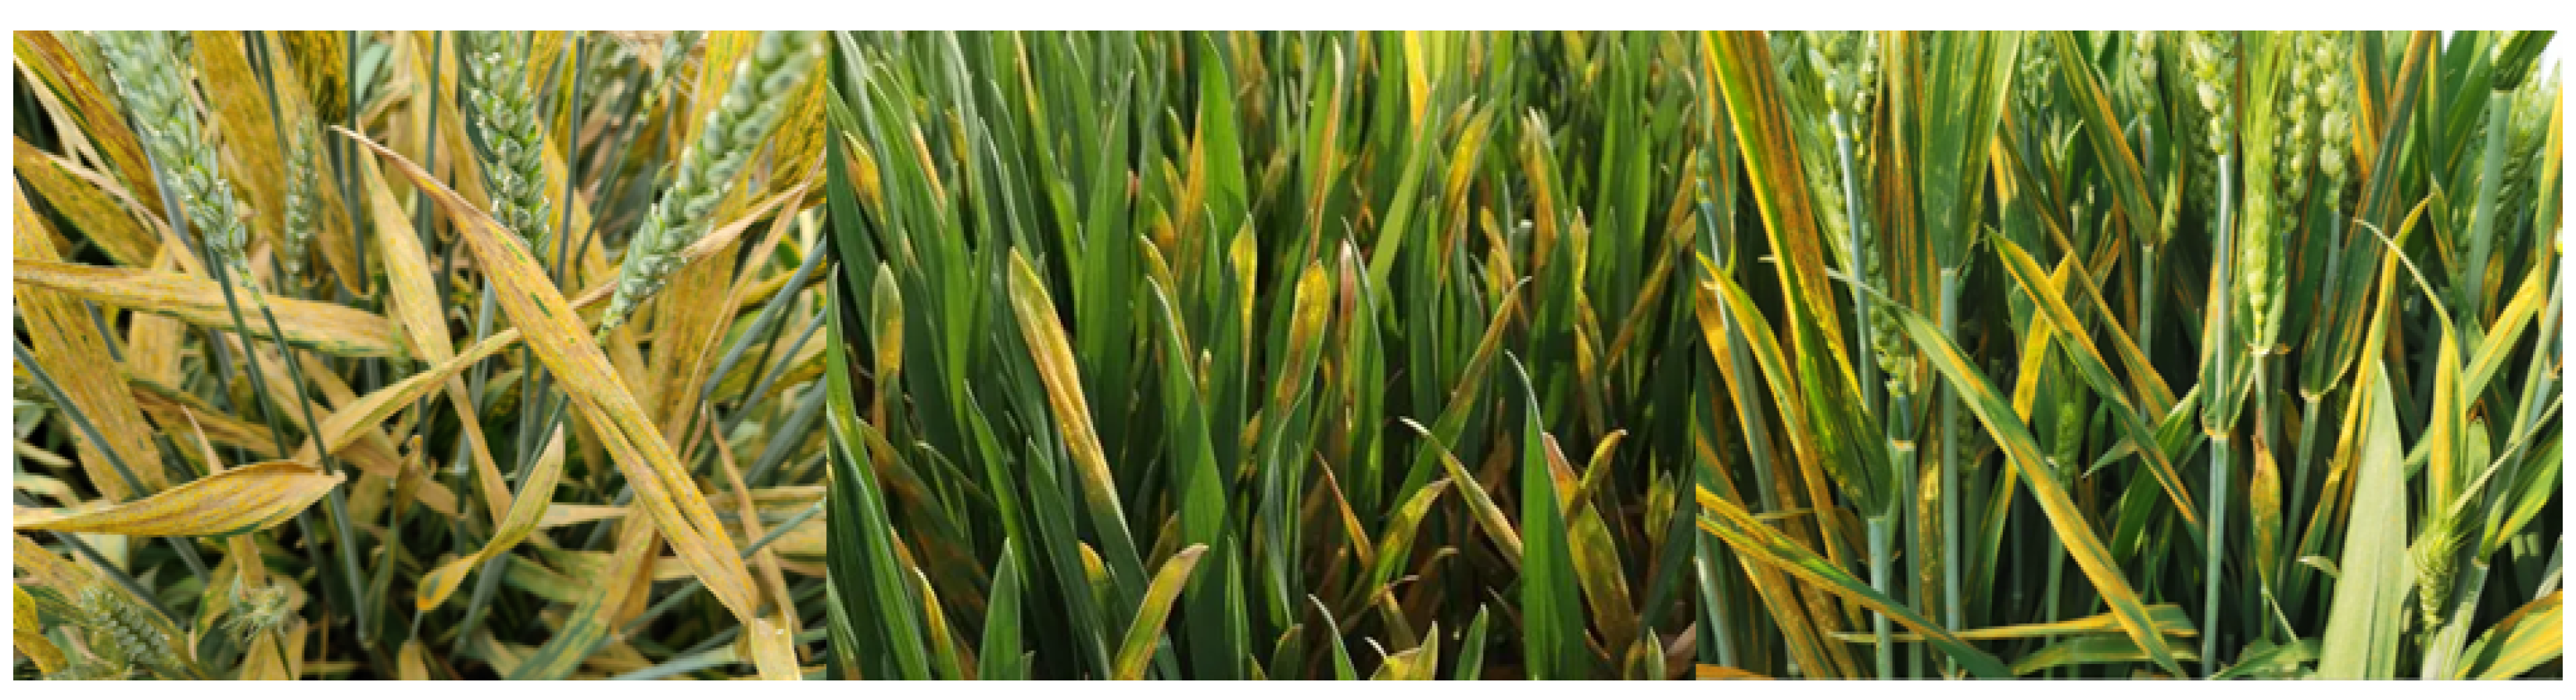
Figure 12 shows symptoms of wheat yellow rust disease. Su et al. [132] proposed a method for identifying wheat yellow rust based on UAV remote sensing multi-spectral data. In the experiment, the authors found that when the spatial resolution of the image reached 1∼1.5 cm/pixel, the UAV remote sensing method could provide enough spectral information to distinguish wheat yellow rust. The recognition accuracy of the random forest classifier was 89.2%. The authors found that RVI [10], NDVI [9], and OSAVI [15] were three most effective vegetation index methods to distinguish healthy wheat from wheat yellow rust plants. Zhang et al. [133] proposed a neural network method for detection of wheat yellow rust plants based on UAV remote sensing hyper-spectral image data. The method’s recognition accuracy rate was 85%. Zhang et al. [134] proposed a neural network method for detecting wheat yellow rust based on UAV remote sensing multi-spectral image data. This method improved the network performance by adding an irregular encoding module (IEM), irregular decoding module (IDM), and channel weighting module (CCRM) to the U-Net [23] structure. Compared with U-Net [23], this proposed network achieved a higher recognition accuracy on multi-spectral image data of wheat yellow rust. Huang et al. [135] proposed a wheat helminthosporium leaf batch disease identification method based on UAV remote sensing RGB image data.
Kharim et al. [136] proposed a method to predict the invasion degree of bacterial leaf blight (BLB), bacterial spike light (BPB), and stem borer (SB) in rice fields based on UAV remote sensing RGB image data. The authors named their method the IPCA-RGB vegetation index () to determine the chlorophyll content in rice plant leaves, which is positively correlated with the degree of damage of rice plant from BLB, BPB, and SB. Stewart et al. [137] proposed a quantitative method of maize northern leaf blight (NLB) based on UAV remote sensing RGB data. The authors conducted experiments based on the validation data set of the MASK-RCNN [24] neural network model, and the obtained intersection over union (IoU) was 73%. Shegoma et al. [138] established the Fall Armywords (FAW) infection dataset based on RGB images collected by UAVs. Based on this dataset, the authors investigated four neural networks: VGG16 and VGG19 [139], InceptionV3 [140], and MobileNetV2 [141]. Through transfer learning, these four methods achieved a higher accuracy on this dataset.
Table 4.
Papers reviewed about crop disease observation.
| Year | Authors | UAV Type | Sensor | Species | Disease | Method Type |
|---|---|---|---|---|---|---|
| 2020 | Abdulridha et al. [80] | Multi-rotor | Hyper-spectral | Tomato | TYLC, BS, and TS 1 | SVM |
| 2020 | Chang et al. [124] | Multi-rotor | Multi-spectral | Citrus | HLB 2 | Vegetation index |
| 2020 | Deng et al. [127] | Multi-rotor | Hyper-spectral | Citrus | HLB 2 | Neural Network |
| 2021 | Moriya et al. [82] | Multi-rotor | Hyper-spectral | Citrus | HLB 2 | Spectral Feature |
| 2018 | Kerkech et al. [128] | Multi-rotor | RGB | Grape | Virus or Fungi | Neural Network |
| 2020 | Kerkech et al. [83] | Multi-rotor | Multi-spectral | Grape | Virus or Fungi | Neural Network |
| 2018 | Su et al. [132] | Multi-rotor | Multi-spectral | Wheat | Wheat Yellow Rust | Random Forest |
| 2019 | Zhang et al. [133] | Multi-rotor | Hyper-spectral | Wheat | Wheat Yellow Rust | Neural Network |
| 2021 | Zhang et al. [134] | Multi-rotor | Multi-spectral | Wheat | Wheat Yellow Rust | Neural Network |
| 2019 | Huang et al. [135] | Multi-rotor | RGB | Wheat | Helminthosporium leaf batch | Neural Network |
| 2022 | Kharim et al. [136] | Multi-rotor | RGB | Rice | BLB, BPB, and SB 3 | Vegetation index |
| 2019 | Stewart et al. [137] | Multi-rotor | RGB | Corn | Northern Leaf Blight (NLB) | Neural Network |
| 2021 | Shegoma et al. [138] | Multi-rotor | RGB | Corn | Fall Armywords (FAW) | Neural Network |
| 2020 | Ye et al. [142] | Multi-rotor | Multi-spectral | Banana | Banana Wilt | Vegetation index |
| 2019 | Tetila et al. [143] | Multi-rotor | Multi-spectral | Soybean | Soybean Leaf Disease | Neural Network |
| 2017 | Ha et al. [144] | Multi-rotor | Multi-spectral | Radish | Radish Wilt | Neural Network |
1 TYLC: yellow leaf curl, BS: bacterial spot, TS: target spot. 2 HLB: huanglongbing, also known as citrus green disease. 3 BLB: bacterial leaf blight; BPB: bacterial spike light, SB: stem borer.
Ye et al. [142] studied the multi-spectral characteristics of banana wilt disease plants in two fields in Guangxi and Hainan Province, China. They found that the chlorophyll content of the banana leaf and body surface would decrease significantly with the development of fusarium wilt, and the red edge frequency in the multi-spectral data was highly sensitive to the change in chlorophyll. This method is based on several vegetation indexes (green chlorophyll index () and red-edge chlorophyll index() [126], NDVI [9], NDRE [125]) of UAV aerial multi-spectral images. The authors obtained a 80% accuracy with a binary regression classifier.Tetila et al. [143] proposed a recognition method for soybean leaf disease. The method is based on a RGB image taken by a UAV using SLIC segmentation method and a neural network classifier. In the experiment, image data with a spatial resolution of 0.85 mm/pixel were acquired at a height of 2 m above the field, and the accuracy rate was 99.04%. Ha et al. [144] proposed a neural network method for detecting radish wilt disease based on field RGB data photographed by a UAV.
4.2.2. Soil Water Content
Lu et al. [145] proposed a method to estimate grassland soil water content based on UAV remote sensing RGB image data. In the study, the authors verified the feasibility of estimating soil moisture at 0∼10 cm depth using a RGB image and established a model to estimate soil moisture through linear regression, with a correlation coefficient . Ge et al. [146] proposed a method to estimate the soil water content of agricultural land based on hyper-spectral remote sensing image data of UAVs. By using a XQBoost [97] classifier, the correlation coefficient was obtained. Bertalan et al. [147] proposed a method to estimate soil water content based on the remote sensing multi-spectral and thermal imaging data of UAVs. In the study, the authors found that the effect of estimating soil water content using multi-spectral data was better than that using thermal imaging data, with a correlation coefficient . Datta et al. [48] studied the relationship between hyper-spectral image data and soil moisture content. Based on all hyper-spectral band (AHSB) data, the authors used support vector regression (SVR) [148], which achieved a result correlation coefficient , RMSE = 0.8. The authors also found that using the visible and infrared bands (454∼742 nm) achieved the approximate same estimation results as using all hyper-spectral band (AHSB) data. Zhang et al. [149] studied the estimation of soil moisture content in corn fields based on multi-spectral, RGB, and thermal infrared (TIR) image data.
4.2.3. Weed Detection
Zhang et al. [150] proposed a method to observe and estimate the distribution of the harmful plant Oxytropis ochrocephala Bunge based on UAV remote sensing image. Lan et al. [151] proposed two neural network models, MobileNetv2-UNet and FFB-BiseNetV2, to monitor weeds in farmland. MobileNetv2-UNet is a small model neural network, which can be run on edge computer hardware. FFB-BiSeNetV2 is a larger parameter neural network method that is used to identify weed targets with high accuracy at the ground end.
4.2.4. Crop Monitoring
In recent years, the use of UAV remote sensing has enabled crop monitoring and yield estimation with an increased precision and efficiency. Several studies have explored different approaches to obtaining valuable information from UAV remote sensing data, including crop distribution, fruit density and distribution, biomass estimation, and crop water content.
Lu et al. [152] proposed two methods for creating rice height models. Digital surface point cloud (DSPC) is a model that includes the surface ground, vegetation canopy, and water surface, while digital terrain point cloud (DTPC) represents surface cloud points without any vegetation. The first method subtracts the DTPC from the DSPC to obtain the height of vegetation on the ground. The second method measures vegetation height using depth sensors on a DSPC. The height difference between the water surface reference layer and the crop canopy is calculated to obtain the crop height. Through experiments, the authors verified that both methods can provide reliable crop height estimates, and the second method is better. Wei et al. [153] verified the high accuracy of an existing neural network model for identifying rice panicles from UAV remote sensing RGB images. In the experiment, the authors used the YOLOv4 [111] neural network model to detect rice panicles, with an average accuracy of 98.84%. The accuracy of identifying rice ears was 95.42% in the rice field without any pathogen infection, which was slightly infected. The accuracy of data set recognition was 98.84%. The accuracy of identification of moderately infected rice was 94.35%. The accuracy of identification of severely infected rice data was 93.36%. Cao et al. [154] compared the differences between RGB and multi-spectral data obtained based on UAV aerial photography on the green phenotype of wheat. In comparative experiments, the multi-spectral index, including red edge and infrared information, was more effective than the color index with only visible light for wheat phenotypic classification. Zhao et al. [155] proposed a wheat spike detection method based on a UAV remote sensing RGB image number neural network method. The authors’ method was based on the YOLOv5 [156] network model and improved the weight post-processing part of the network’s conjecture results. During experimental verification, the proposed method achieved a significant improvement on the recognition accuracy of the original YOLOv5 [156] structure network, with an overall accuracy of 94.1%, and the processing speed was consistent with YOLOv5 [156] under the condition of processing different resolution images. Wang et al. [157] proposed a method for estimating the chlorophyll content of winter wheat based on remote sensing multi-spectral image data from UAVs. Based on the remote sensing image data of winter wheat taken by a multi-spectral camera, the authors tested 26 different remote sensing indexes combined with four estimation methods, such as random forest regression. After experimental comparison, an RF-SVR-sigmoid model, a combination of RF variable selection and an SVR algorithm based on the sigmoid kernel, achieved a good accuracy when estimating wheat soil plant analysis development canopy data. Nazeri et al. [158] proposed a neural network detection method for outliers of 3D point cloud signals based on UAV LIDAR data. Based on f-score, this method successfully removed different levels of outliers in a crop LIDAR 3D point cloud. This method was proven effective in experiments on sorghum and maize plants. Chen et al. [159] proposed a method to detect agricultural crop rows in UAV images. The accuracy rate of detecting corn planting lines with UAV remote sensing RGB image was higher than 95.45%. When identifying wheat planting lines, the recall rate was more than 96%, and the accuracy rate was more than 89%. Wang et al. [160] proposed a method to detect the fluorescence ratio index (FRI) and fluorescence difference index (FDI) of rice flowering numbers per unit area with hyper-spectral image data. Through this index system, rice yield was estimated by taking multi-spectral images to detect the early stage of rice flowering. Traore et al. [161] proposed a neural network method based on multi-spectral remote sensing data to detect equivalent water thickness (EWT). Ndlovu et al. [162] proposed a random forest regression method based on multi-spectral remote sensing image data to estimate corn water content. Padua et al. [163] proposed an OBIA method for the classification of vineyard objects, which included four categories: soil, shadow, other vegetation, and grape plants. In the classification stage of the method, the author experimented with three different classifiers (support vector machine (SVM), random forest (RF), and artificial neural network (ANN)), and the ANN achieved the highest accuracy.
4.3. Power Lines, Towers, and Accessories
In recent years, the detection of power lines, towers, and accessories has become an increasing industry application. A power line tower system is exposed in the field or wild areas. After a period of time, some cables and insulators made of ceramic or glass can become damaged through natural causes. Therefore, the power line tower must be inspected regularly, to replace the damaged parts. Before the rise of UAV remote sensing, the standard method of patrolling and maintaining power line towers depended on regularly arranging workers to climb the towers. However, due to the height of power towers, and many of them being located in remote mountains and highlands, it is labor-intensive and inefficient work to check and maintain the towers one by one. The operation becomes extremely dangerous in winter or the rainy season. UAV remote sensing has greatly reduced the difficulty of power line and tower inspection. Table 5 lists part of the reviewed remote sensing articles related to power line towers and compares the data research on drone platforms, sensors, observation objects, and method purpose. Figure 13 shows the organization of the applications for power lines, towers, and accessories.
The inspection objects in the research papers we reviewed mainly included transmission lines, towers, insulators, and other accessories.
4.3.1. Detection of Power Lines
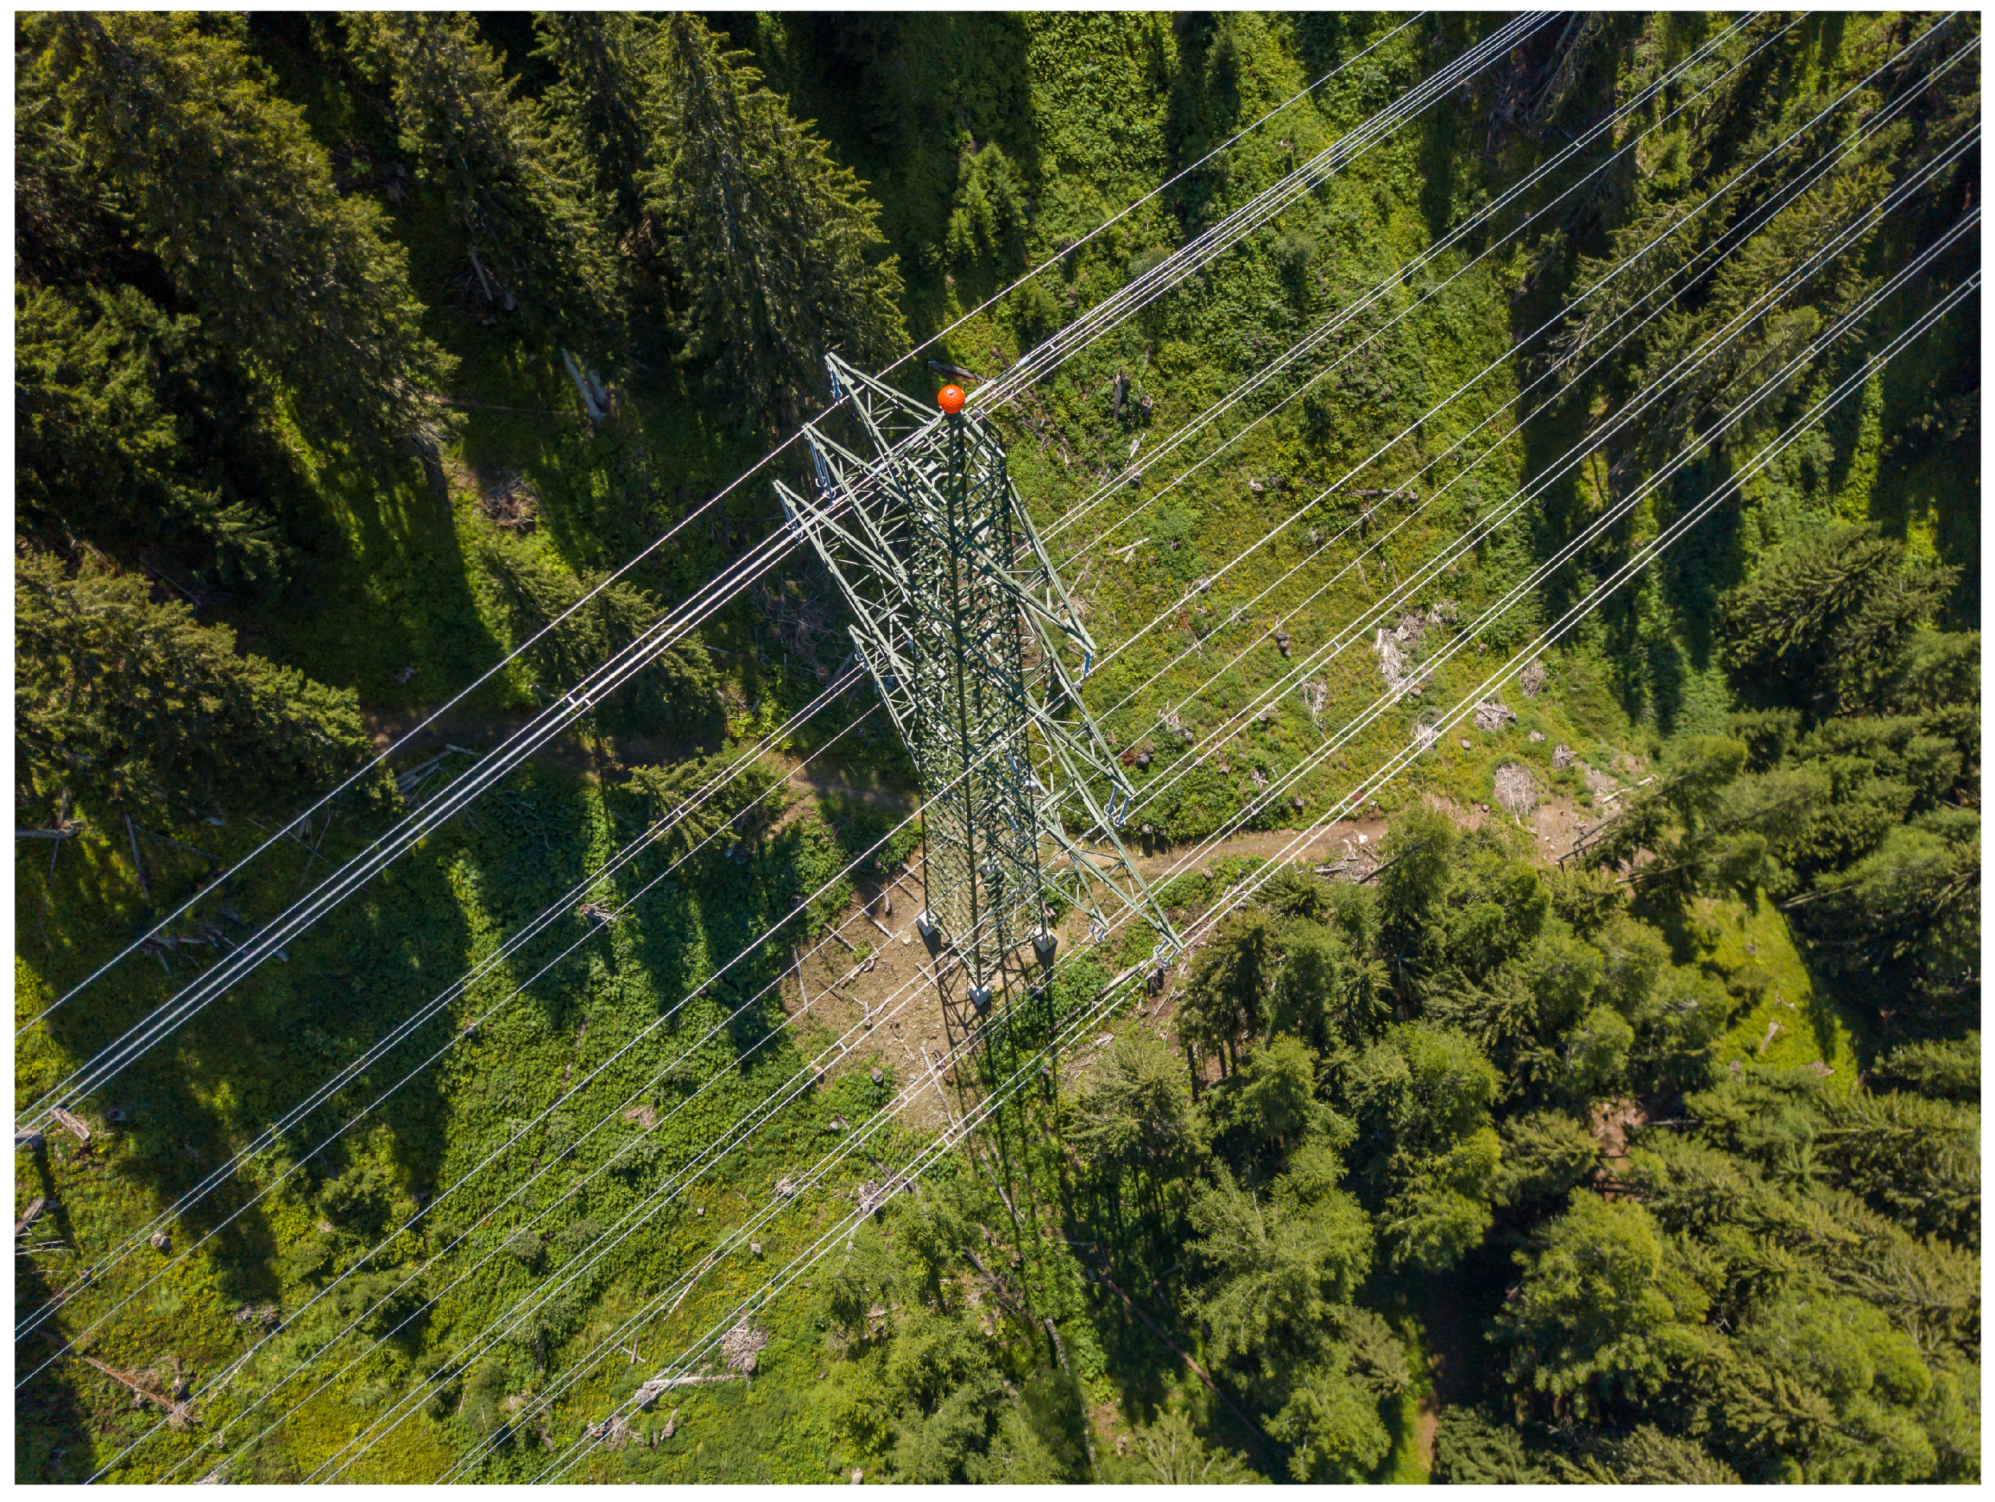
As shown in Figure 14, power lines have unique image texture features in remote sensing images. The power towers located in the field also have unique material, height, and composition characteristics compared to the surrounding environment.
Zhang et al. [164] proposed a power line detection method based on UAV remote sensing RGB image data. In the study, the authors also disclosed two datasets: a power line dataset of urban scenes, and a power line dataset of mountain scenes, which were UAV remote sensing power line datasets in urban and outdoor environments. The method proposed by the authors is based on an improvement of the VGG16 neural network model [139], and the f-score value was 91.4% on the proposed dataset. Pastucha et al. [165] proposed a power line detection method based on UAV remote sensing RGB image data. The method was validated on two open-source datasets and reached accuracies of 98.96% and 92.16%, respectively.
Chen et al. [54] proposed a method of detecting transmission lines based on UAV remote sensing LIDAR data. The LIDAR equipment carried by the UAV obtained a laser spot density of 35 points/ due to low-altitude flights, which is better than the detection density that can be obtained by manned aircraft. With this method, the detection accuracy rate was 96.5%, the recall rate was 94.8%, and f-score was 95.6%. Tan et al. [166] proposed a method to detect transmission lines based on UAV remote sensing LIDAR data. The authors established four datasets to verify the performance of the method. The LIDAR point sampling density ranged from 215 points/ to 685 points/, which is significantly higher than the previous datasets. The accuracy of the method was higher than on four different datasets, and the recall rate was higher than .
Zhang et al. [167] proposed a power line automatic measurement method based on epipolar constraints. First, the authors acquired the spatial position of the power lines. Second, semi-patch matching based on an epipolar constraint dense matching method was applied to automatically extract dense point clouds within the power line corridor. Then, obstacles were automatically detected by calculating the spatial distance between a power line and the ground, which was represented by a 3D point cloud. This method generated 3D point cloud data based on UAV RGB data through the SfM-MVS method, with a detection accuracy of 93.2%, which is equivalent to manual measurement. The above results show that this method could replace manual measurement. Zhou et al. [168] proposed an automatic power line inspection system based on binocular vision. This method used binocular cameras to identify the direction of the power line and then calculate its own course.
4.3.2. Detection of Power Towers
Zhang et al. [55] proposed a power tower detection method based on near-earth remote sensing LIDAR point cloud data. The authors used an unmanned helicopter as the remote sensing platform, flying at heights of 180 m and 220 m at different moments, and the laser spot detection density was 30.7 points/ and 42.2 points/ respectively, to detect the power line area. The accuracy rate of the results obtained was 96.5%, the recall rate was 96%, and the f-score was 96.4%. Ortega et al. [169] proposed a method to detect power tower and lines based on helicopter LIDAR data. The authors used Riegl VUX-1LR LIDAR equipment. The helicopter flight height was 300 m, the LIDAR sampling density was 13 points/, the accuracy rate of tower recognition was 90.77%, and the recall rate was 94.90%. This method had an accuracy of 99.44% and a recall rate of 99.58% for the detection of power lines. Lu et al. [90] proposed a method to detect the tilt state of transmission towers based on UAV LIDAR data. The authors inspected the tilt degree of the body and head of the power tower in operation, to detect the safety status of the power tower.
4.3.3. Detection of Insulators and Other Accessories
Insulators and springs are vulnerable components in power lines and are key objects in power line inspections, requiring identification of their condition.
Figure 15 shows insulators on power lines. Zhao et al. [170] proposed a power line tower insulator detection method based on RGB image data. Based on the R-CNN neural network framework [171], the accuracy of detecting insulators with different lengths reached 81.8%. Ma et al. [172] proposed a circuit tower insulator detection method based on UAV binocular vision. The image depth information of the insulator was calculated using the remote sensing image from a dual-view camera to assist in the accurate identification of the insulators. The accuracy of the authors’ method was higher than 91.9%. Liu et al. [173] proposed a neural network detection method for power tower insulators based on UAV RGB images. The authors collected and sorted the data set “CCIN detection” of power line tower insulators and trained MTI-YOLO, a neural network model that can be deployed on edge computing equipment, to detect insulators in UAV images. Prates et al. [174] proposed an insulator defect identification method for power line towers based on UAV RGB image data. The authors constructed an insulator image dataset with more than 2500 pictures. The accuracy of the method proposed by the authors was 92% in identifying insulator types and 85% in detecting defective insulators. Wang et al. [175] proposed a neural network method to detect defects of circuit insulators. The detection accuracy was 98.38%, and 12.8 pictures could be detected per second. Wen et al. [176] proposed a neural network detection method for the insulator defects of power line towers based on UAV RGB images. The authors used a two-level neural network to identify the defects in the insulators of a power line tower. The first-level R-CNN [171] network detects the position of the insulator from the remote sensing image, and the second-level coder–decoder network accurately identifies the defect position. In the authors’ experiment, the recognition accuracy was 88.7%. Chen et al. [177] proposed a method to generate wire insulator image data based on UAV RGB images. Aiming at the characteristics of a low spatial resolution and less training data of insulator image data of power line towers obtained from UAV RGB images, the authors proposed a method to generate high-resolution and realistic insulator detection images with a conditional GAN [178] for expanding training data. Liu et al. [179] proposed a method for autonomous inspection of power line towers using UAVs.
Table 5.
Papers reviewed on power lines, towers, and accessories.
| Year | Authors | UAV Type | Sensor | Object | Propose |
|---|---|---|---|---|---|
| 2019 | Zhang et al. [164] | Multi-rotor | RGB | Power Lines | Detection |
| 2020 | Pastucha et al. [165] | Multi-rotor | RGB | Power Lines | Detection |
| 2018 | Chen et al. [54] | Multi-rotor | LiDAR | Power Lines | Detection |
| 2021 | Tan et al. [166] | Multi-rotor | LiDAR | Power Lines | Detection |
| 2017 | Zhang et al. [167] | Multi-rotor | RGB | Power Lines | Auto-measurement |
| 2022 | Zhou et al. [168] | Multi-rotor | Binocular Vision | Power Lines | Auto-inspection |
| 2019 | Zhang et al. [55] | Unmanned Helicopter | LIDAR | Power Tower | Detection |
| 2019 | Ortega et al. [169] | Helicopter | LIDAR | Power Tower & Lines | Detection |
| 2022 | Lu et al. [90] | Multi-rotor | LIDAR | Power Tower | Tilt State |
| 2019 | Zhao et al. [170] | Multi-Rotor | RGB | Insulators | Detection |
| 2021 | Ma et al. [172] | Multi-Rotor | Binocular Vision | Insulators | Detection |
| 2021 | Liu et al. [173] | Multi-Rotor | RGB | Insulators | Detection |
| 2019 | Prates et al. [174] | Multi-Rotor | RGB | Insulators | Detection |
| 2020 | Wang et al. [175] | Multi-Rotor | RGB | Insulators | Detection |
| 2021 | Wen et al. [176] | Multi-Rotor | RGB | Insulators | Detection |
| 2021 | Bao et al. [180] | Multi-rotor | RGB | Shock Absorber | Detection |
| 2022 | Bao et al. [181] | Multi-rotor | RGB | Shock Absorber | Detection |
Figure 16 shows a shock absorber on power lines. Bao et al. [180] proposed an improved neural network model based on the YOLOv4 [111] network to identify shock absorbers of transmission lines on power towers. After a period of experimentation, Bao et al. [181] put forward an improved neural network to identify transmission line shock absorbers based on the YOLOv5 [156] network model and using the dataset they had collected before.
4.4. Buildings, Artificial Facilities, Natural Environments, and Others
UAV remote sensing has been increasingly applied in detection and information extraction tasks for buildings, artificial targets, and other objects, due to its multi-altitude and multi-angle observation capabilities and the ability to carry 3D sensors that can provide elevation information of observation targets. Figure 17 shows the organization of the applications in buildings, artificial facilities, and natural environments.
4.4.1. Buildings and Other Artificial Facilities
In recent years, a trend in the research on remote sensing of buildings has been to use high-resolution image data to establish elevation information and the SfM-MVS method for further processing. These research works focused on estimating the status of buildings after disasters, identifying disaster zones, change detection, identifying building types, and others. Nex et al. [182] proposed a method for detecting damaged buildings and their ground coverage areas after disasters based on UAV RGB images. The authors used multiple overlapping images to generate a sparse point cloud and using the SfM-MVS method to detect damaged buildings. Yeom et al. [183] proposed a method for estimating the degree of building damage caused by hurricanes based on UAV remote sensing RGB images. Li et al. [184] proposed a method for 3D change detection of buildings based on UAV RGB images. The authors used the SfM-MVS method to generate a digital elevation model (DEM) and detect changes in buildings. Wu et al. [185] proposed a method for detecting building types in built-up areas based on RGB images. The authors classified buildings into four categories based on their number of floors: one floor, two floors, three to six floors, and above six floors. The authors established a DEM model using the SfM-MVS method and classified buildings based on elevation data.
Detecting buildings and their attributes based on UAV image data is also a practical research direction. Zheng et al. [186] proposed a neural network method for detecting buildings in UAV RGB images. Li et al. [187] proposed a neural network method for detecting damaged buildings in RGB images. Based on the SSD [188] network model, the authors achieved a high accuracy in detecting damaged buildings by adding a CBAM module [189]. Xu et al. [190] proposed an encoding and decoding semantic segmentation neural network based on a channel space enhanced attention mechanism for accurate detection and segmentation of blue rooftop buildings from drone remote sensing RGB images.
As UAVs can observe buildings and artificial facilities from a predefined height and angle, there have been applications focused on 3D reconstruction of buildings in recent years. For this aim, a facade image can be used for 3D reconstruction. He et al. [191] proposed a method to accurately map the exterior texture images of real buildings onto their virtual models. The authors used multi-angle images of the exterior of the building, and through geometric transformation, pasted the transformed texture image of the exterior wall of the building onto the virtual model of the building. Zhu et al. [67] proposed a method based on a neural network to match remote sensing images of the same location taken from different angles and at different resolutions. By segmenting and combining the target image and calculating the loss function separately for the local area of the image, the authors realized a cross-view spatial geographic location method.
The 3D reconstruction technology based on UAV remote sensing has been applied to archaeology and ancient building mapping. Alshawabkeh et al. [56] proposed an image and 3D point cloud fusion algorithm for reconstructing complex architectural scenes. Based on a LIDAR point cloud and image data collected by UAVs, the authors were able to reconstruct an ancient village in three dimensions. Laugier et al. [192] proposed an archaeological remote sensing method based on multiple data sources. Based on various data sources, such as aerial remote sensing images, satellite remote sensing images, and drone remote sensing images, the authors conducted a remote sensing survey of pre-modern land use information in the Irwan Valley of Iraq. The targets included canals, karez, orbits, and field systems.
UAV remote sensing is also used to detect larger vehicles, such as cars and ships. Ammour et al. [193] proposed a neural network method for detecting cars in UAV RGB images. The authors divided the images into multiple blocks using the mean shift method, extracted regional image features using a VGG network, and then identified whether a certain area contained car targets using a linear SVM classifier. Li et al. [194] proposed a method for estimating the ground speed of multi-vehicles from UAV video. Zhang et al. [195] proposed a neural network method CFF-SDN for detecting ship targets based on UAV RGB images. The network model proposed by the authors has three branches that respectively examine large, medium, and small targets, which can adapt to ship detection tasks of different sizes in different sea areas and can detect overlapping targets.
4.4.2. Natural Environments and Others
UAV remote sensing has been widely used for environmental research. In the papers we reviewed, the contents were varied. The natural environment investigations included predicting the probability of landslides, detecting rockfalls in mountainous areas, observing glacier changes, and observing rivers and their environment near sea outlets.
Micieli et al. [87] proposed a method of observing the water resources of rivers with UAV thermal cameras. Compared with satellite remote sensing, the data collected by drone sensors can have a higher temporal resolution. Lubczonek et al. [88] developed a bathymetric method for a coastline’s critical area, combining underwater acoustic data and UAV remote sensing image data. Lubczonek et al. [196] proposed a method for measuring the topographical surface of shoals and coastal areas. Ioli et al. [197] used UAVs to monitor glaciers for seven years. The authors found that using UAVs allowed effectively monitoring the dynamics of glaciers, which is currently impossible with other observation platforms, including remote sensing satellites. Nardin et al. [198] proposed a method for investigating the seasonal changes of salina vegetation based on UAV images and ground survey data.
UAV remote sensing has been applied in the investigation of wild animals, with methods for detecting animals such as wild boars and marine animal activities. Kim et al. [199] proposed a method to monitor wild boars in plains, mountainous areas, and forested areas with thin tree canopies using infrared cameras carried by UAVs. Ranvcic et al. [200] used the YOLOv4 neural network to identify and count deer in low-altitude forest scenes, achieving an accuracy of 70.45% and a recall rate of 75%. Christie et al. [89] proposed an effective method to measure the morphology of small dolphin species based on UAV RGB images.
5. Discussion
According to the different application types of drone remote sensing, comparing some of the reviewed papers can reveal the commonalities and differences in tasks, data collection, data processing, and other stages of these studies.
In recent years, there have been several reviews [29,30,31] on UAV remote sensing. Osco et al. [32] focused on the deep learning methods applied in UAV remote sensing. Aasen et al. [33] focused on the data processing of hyper-spectral UAV remote sensing. Guimaraes et al. [34] and Torresan et al. [35] focused on the application of UAV remote sensing in forestry. Maes et al. [36] and Tsouros et al. [37] focused applications in precision agriculture. Jafarbiglu et al. [40] reviewed UAV remote sensing of nut crops.
In this review, we mainly reviewed research papers published in the past three years on all application fields and data processing methods for UAV remote sensing. Our goal was to grasp the current status of the hardware, software, and data processing methods used in UAV remote sensing research, as well as the main application directions, in order to analyze the future development direction of this research field.
5.1. Forestry Remote Sensing
Judging the differences between UAV remote sensing and satellite remote sensing in forestry remote sensing, UAVs can set the flight height, carry LIDAR sensors for remote sensing, and have advantages over satellite remote sensing in forest parameter measurement and estimation. In disease monitoring, high-resolution images from UAV remote sensing can produce better accuracy results.
In terms of forest parameter estimation, Ganz et al. [91] used RGB images and Krause et al. [51] used LIDAR data from UAV remote sensing to measure tree height, and the RMSEs obtained were 0.479 m and 0.36 m, respectively; However, Ge et al. [201] measured forest tree height based on satellite SAR data, and the RMSE obtained was as high as 25%. The accuracy of drone remote sensing in measuring an important parameter of forest remote sensing, tree height, is significantly higher than that of satellite remote sensing.
In terms of forestry disease monitoring, taking the monitoring of pine blight as an example, Ren et al. [84] proposed a method based on UAV remote sensing RGB images with an accuracy of 79.8%; Li et al. [110] proposed a method based on UAV remote sensing hyper-spectral data, with an accuracy from 84% to 99.8%; However, Zhang et al. [202] used data obtained from remote sensing satellites, and their accuracy rate for similar diseases was only 67.7%.
Compared with satellites, UAV remote sensing methods have a higher accuracy in forest parameter estimation because the sensors can directly measure target elevation information. In the forest disease monitoring problem, due to the spatial resolution advantage of UAV remote sensing image data, it is also difficult for satellite remote sensing data methods to compete.
From the perspective of the application of UAV remote sensing in forestry remote sensing, and through a comparison of parameters in Table 3, we can notice some differences and connections in the observation platforms, sensors, and information processing methods: (1) Only two articles [109,120] used fixed-wing UAVs, but in these two studies, the data sampling range was significantly more extensive than that of the multi-rotor methods, the flying height was higher, and RGB sensors were used; (2) Yu et el. [85,113,114] used multi-spectral and hyper-spectral LIDAR as sensors in their three studies, all with multi-rotor UAVs; (3) In the research papers on pine wilt, except for the article [114] using LIDAR data and another OBIA method [112], the research papers using RGB, multi-spectral, and hyper-spectral all used neural networks. (4) No article used the flight data of drones, including GNSS, flight speed, and other information.
Based on the above two perspectives, we summarize the characteristics of forestry UAV remote sensing: (1) Due to the higher spatial resolution of satellite remote sensing data, UAV remote sensing can achieve higher accuracy in remote sensing monitoring of forestry diseases; (2) UAV remote sensing method has the characteristics of carrying LIDAR and flying according to a set altitude, so it can achieve better accuracy in measuring forest parameters than satellite remote sensing; (3) Fixed UAVs can be used as vehicles for large-area forest remote sensing. However, this vehicle also needs to be set to fly at a higher spatial position, and the spatial resolution of the acquired image data will be relatively low; (4) In current research, multi-rotor UAVs are often equipped with multi-spectral cameras, hyper-spectral cameras, and LIDARs; (5) For the data processing methods of collected RGB, multi-spectral, and hyper-spectral sensors, the neural network method is the mainstream method in current research; however, LIDAR data have special elevation information, and the processing method is still relatively cumbersome; (6) Current research papers lack the processing and utilization of UAV flight data, such as GNSS, azimuth, flight speed, and other information.
5.2. Precision Agriculture
In precision agriculture, satellite plant remote sensing data are considered insufficient to support an accurate assessment of crop growth [203]. One of the significant achievements of UAV remote sensing in recent years is crop disease detection and classification. Compared to the 30 m/pixel resolution image of the Landsat-5 satellite and the 10 m/pixel resolution image of the Sentinel-2 satellite, UAV remote sensing can produce image data with a spatial resolution up to decimeters/pixel or even centimeters/pixel.
Take the studies on wheat yellow rust as an example. The study of [204] based on satellite remote sensing data could only verify the effectiveness of the vegetation indexes on a m field; The study of [132] based on UAV remote sensing multi-spectral images with a spatial resolution of 1–1.5 cm/pixel could precisely identify the most relevant changes in different spectrums of the disease. The accuracy of wheat yellow rust image sample classification and recognition in a m farmland area was 89.2%, significantly better than the method based on satellite image data. Bohnenkamp et al. [205] studied the relationship between the UAV-based hyper-spectral method and ground handheld instruments. From the perspective of spectral features, the observation and recognition of the crop canopy based on UAV remote sensing already has a similar effectiveness compared to handheld ground methods.
Comparing the data in Table 4, we can determine some rules: (1) Articles applied to crop disease monitoring generally used multi-rotor drones; (2) Most papers used multi-spectral cameras, followed by RGB and hyper-spectral cameras. LIDAR was not used; (3) Most studies used neural networks as the detection method.
We can make a summary of remote sensing for precision agriculture based on these points: (1) The high-spatial-resolutiof images that UAV remote sensing can provide can bring higher a recognition accuracy in monitoring and identifying crop diseases than satellite remote sensing data with a lower spatial resolution; (2) Multi-spectral image data are the most extensively studied data in agricultural disease remote sensing. However, current unmanned aerial vehicle multi-spectral remote sensing technology still lacks the ability to identify early symptoms of fungal infections in crop leaves. With the development of higher resolution image sensors and data fusion technology, obtaining early crop disease infection information from drone remote sensing images will become possible. (3) The current research has limited demand for large-scale, low-spatial-resolution data for crop disease monitoring. The main research focused on high-spatial resolution and small ground area remote sensing. Therefore, multi-rotor UAVs meet the needs of this application; (4) Most of these studies were based on using neural network methods as detectors or classifiers.
5.3. Artificial Facilities
For the remote sensing of artificial facilities, the RGB and LIDAR sensors carried by UAVs for remote sensing can establish the elevation information of the target through ALS or SfM-MVS methods, which is difficult to achieve based on satellite remote sensing data.
For particular targets, such as power lines, with a diameter of only a few centimeters, UAV remote sensing has shown technical advantages. Comparing Table 5, we can see some rules: (1) For the remote sensing of power line towers, most remote sensing observation platforms are the multi-rotor type. When LIDAR is used as a sensor, a helicopter can also be used as a platform; (2) When the observation object is a power line, a RGB camera or LIDAR can be selected as the sensor. However, when RGB is used as the sensor, the power line detection is solved as a semantic segmentation method, using a neural network; but when LIDAR is used as the sensor, the power line detection is based on three-dimensional point cloud data, and the recognition method is more cumbersome than a neural network; (3) The sensors are all LIDAR when the detection object is a power tower. The experimental results show that using LIDAR data to detect power towers can provide a high accuracy rate; (4) When the detection objects are insulators and springs, the data used in studies are all RGB images, and the recognition method is the neural network method.
5.4. Further Research Topics
Regarding the different platforms among the many studies reviewed so far, the multi-rotor UAV was the most adopted flying observation platform. Among the reviewed articles, these were equipped with all types of sensor. When large-scale observations are required in environments such as forestry remote sensing, fixed-wing UAVs need to be used as platforms.
From the perspective of data types, in precision agriculture, the most important data source is multi-spectral imagery. Since the current research has not yet used the image texture features of crop diseases, there is still space for improvement in crop disease detection using UAV remote sensing. Many fungal crop diseases can cause spots on plant leaves, and these spots’ morphology and spatial distribution vary by fungal type. In the early and middle stages of wheat powdery mildew, spots with a diameter of only 1–2 mm appear on the leaves of wheat plants. In the papers we reviewed, most research data were sampled at an altitude of 100–120 m, and the spatial resolution of the multi-spectral images was 4–8 cm/pixel. Therefore, the speckled features caused by fungi were not visible in these images. The later stage of the disease, when a large amount of leaf cells are affected by the fungus and photosynthesis decreases a lot, results in apparent changes in the reflectance spectrum, which can determine whether the farmland wheat is infected or not. The current limitations are also opportunities for future research. With the improvement of spatial resolution of image sensors and multi-band image registration methods, drones equipped with higher spatial resolution multi-spectral cameras can perform close-range remote sensing of crops. Soon, researchers will be able to obtain multi-spectral image data with a spatial resolution of millimeters per pixel. At that time, the characteristics of fungi and other diseases on crop leaves will be observable not only from the spectrum but also from the texture features of multi-spectral images. Currently, neural network methods that have been extensively studied can recognize the textural features of images with high accuracy and recall. In summary, from the perspective of data and identification methods, the current technological development trends are creating a robust foundation for accurately identifying crop diseases using UAV remote sensing in the future.
RGB and LIDAR are two important data sources for the remote sensing of buildings and artificial objects. With the improvement of the resolution of image sensors, progress can be made in observing the position, speed, and activity of smaller artificial objects. Li et al. [194] proposed a method for estimating the ground speed of multi-vehicles from UAV video. Saeed et al. [206] proposed a small neural network that can run on the NVIDIA Jetson nano embedded platform and which can be placed on a UAV, aiming to directly detect common ground targets, including pedestrians, cars, motorcycles, direct driving, etc. With the development of imaging camera resolution, exposure speed, and embedded computing platforms equipped with drones, it will be possible to detect more diverse and smaller artificial targets from UAV remote sensing image data in the future.
From the perspective of method migration, there is existing work [90] using UAVs equipped with LIDAR sensors to realize the measurement of the tile state of power line towers. Such methods can be widely transferred to measure other artificial structures, such as bridges, high-rise buildings, etc. At present, in a work of [164,165] on automatic detection of power lines by drones, since the sensor used is an RGB camera and the detection method is a neural network, this also has the prospect of being easily migrated to scenarios such as railway tracks and road surfaces.
Regarding data processing methods, neural networks are mostly used as detectors and classifiers in the current research based on RGB, multi-spectral, and hyper-spectral image data. The neural network needs to annotate the image data and can then modify a neural network with better results based on the characteristics of the specific scene. However, in the review of research using LIDAR data, most papers did not use neural networks to process LIDAR data, and the current methods are still relatively complicated. Processing UAV 3D point cloud data through neural networks may become an important feature research direction.
Fusing multi-source data is also an important development direction in UAV remote sensing. The current research is less focused on applying multi-source and multi-type UAV remote sensing data, such as LiDA and RGB fusion data, LiDAR and multi-spectral fusion data, etc. Therefore, the fusion method of different source data is also a development focus.
In UAV research papers, there is only a small amount of content that used information such as GNSS coordinates and speed during UAV flight and no research papers based on drone video data. Data of these two aspects may become a new research hot spot.
In addition to data and processing methods, UAVs can make repeated observations of the same ground target area at the same height and angle in the air, because they can fly according to preset routes and take remote sensing shots at set crossing points. This feature is suitable for research on change detection, but there is a lack of corresponding research and applications at present.
6. Conclusions
Through this review of UAV-related papers in recent years, the authors verified that UAV technology has been widely used in remote sensing applications such as precision agriculture, forestry, power transmission lines, buildings, artificial objects, and natural environments, and has shown its unique advantages. Compared with satellite remote sensing, UAV remote sensing can provide higher resolution image data, which makes the accuracy of crop type identification, agricultural plant disease monitoring, and crop information extraction significantly better than when using satellite remote sensing data. UAV LIDAR data can produce accurate elevation information for power transmission lines, buildings, and artificial objects, which provides better results when detecting and identifying the attributes of these targets and demonstrates that UAV remote sensing can be used in accurate ground object identification and detection.
There are still many advantages and characteristics of UAV technology that have not been applied in remote sensing. Considering the classification of sensors that drones can carry, optical image data have been studied the most. With the improvement of spatial resolution of these data, more detailed information about large targets could be extracted, such as fungal infections on crop surfaces, or information such as the position and speed of smaller targets. In terms of 3D stereoscopic data, multi-view stereoscopic imaging has had more research and applications compared to LIDAR data, due to low equipment requirements, low costs, and simple initial data processing. However, in remote sensing tasks for buildings, bridges, iron towers, and other targets, research based on LIDAR data will continue to be the main research object, due to its outstanding accuracy advantages.
We can find other research opportunities if we look at the current lack of usage and processing of certain types of data from drones. The flight data of drones, such as GNSS, flight altitude, speed, and gyroscope data during the flight, were rarely used in the research we reviewed. The main reason for this is that the current mainstream UAV sensors lack a data channel to link with the drone’s flight controller, so the flight controller’s data cannot be synchronously saved to the UAV sensors.
The GNSS information of drones is crucial for accurately measuring the coordinates of ground targets from an aerial perspective. Due to the fact that drones can achieve accurate positioning with a horizontal error of less than 1 cm through RTK, the absolute GNSS coordinates of ground targets can be obtained not only from the relative position of ground targets and the drone but also from the GNSS coordinates of the drone itself, and the error mainly depends on the relative position error measured from image and video data with the drone.
The flight altitude of drones plays a crucial role in determining the spatial resolution of the image sensors carried and for measuring the elevation information of ground targets. However, in the papers we reviewed, most drones flew at a fixed altitude when collecting data. This flight method is suitable for observing targets on flat ground. For targets that require elevation information, rich multi-view images can be established by remote sensing the targets at different altitudes using drones, and three-dimensional information of the targets can be reconstructed through the SfM-MVS method.
In the currently reviewed drone remote sensing articles, neither image nor video data were synchronized with gyroscope data. However, in recent years, in the newly published articles on SLAM, the use of high-precision gyroscopes has made relatively considerable progress in accuracy in 3D imaging and 3D reconstruction. A drone flight controller’s gyroscope system has advanced sensors and complete physical damping and sensor noise elimination methods. Therefore, it could be possible that some indoor SLAM methods could be migrated to drone platforms, to utilize the gyroscope data.
The above is a prediction of the future development direction of drone remote sensing from different data sources and processing perspectives. In addition, drones are excellent data acquisition and observation platforms for performing change detection tasks, due to their ability to program flight routes and remote sensing positions and observe the determined flight routes multiple times. Using drones, not only can observation targets be observed multiple times from the same angle, but also unrestricted temporal resolutions can be achieved. Therefore, we believe that change detection based on drones should experience significant development in the next few years.
Author Contributions
Conceptualization, L.Z.; Literature view, Z.Z. and L.Z.; writing, Z.Z. and L.Z.; editing, Z.Z. All authors have read and agreed to the published version of the manuscript.
Funding
This work was funded by the Laboratory of Lingnan Modern Agriculture Project (Grant No. NZ2021038).
Data Availability Statement
Data available on request from the authors.
Conflicts of Interest
The authors declare no conflict of interest.
Abbreviations
The following abbreviations are used in this manuscript:
| UAV | unmanned aerial vehicle |
| OBIA | object-oriented analysis methods |
| TM | thematic mapper |
| MSS | multi-spectral scanner system |
| VTOL | vertical take-off and landing |
| NIR | near-infrared |
| LIDAR | laser imaging, detection, and ranging |
| IMU | inertial measurement units |
| GNSS | global navigation satellite systems |
| DEM | digital elevation model |
| DTM | digital terrain model |
| DSM | digital surface model |
| SfM-MVS | structure from motion and multi-view stereo |
| ALS | airbrone lisar scanning |
| GCP | ground control point |
| GSD | ground sample distance |
| CC | canopy closure |
| HP | hemispheric photography |
| CHM | canopy-height model |
| SHP | synthetic hemispheric photography |
| SLAM | simultaneous localization and mapping |
| SLR | single lens reflex |
| GLCM | grey-level co-occurrence matrix |
| SPAD | soil plant analysis development |
| LSTM | long-short term memory |
| SOC | soil organic carbon |
| SMC | soil water content |
| HLB | huanglongbing |
| IEM | irregular encoding module |
| IDM | irregular decoding module |
| CCRM | channel weighting module |
| AHSB | all hyper-spectral bands |
| TIR | thermal infrared |
| RMSE | root-mean-square error |
| NDVI | normalized difference vegetation index |
| NDWI | normalized difference water index |
| EVI | enhanced vegetation index |
| LAI | leaf area index |
| NDRE | normalized difference red edge index |
| SAVI | soil adjusted vegetation index |
| MSAVI | improved soil adjusted vegetation index |
| CI | chlorophyll index |
| FRI | fluorescence ratio index |
| FDI | fluorescence difference index |
| EWT | equivalent water thicknes |
| DSPC | digital terrain point cloud |
| DTPC | digital terrain point cloud |
| PLDU | power line dataset of urban scene |
| PLDM | power line dataset of mountain scene |
| SVM | support vector machine |
| RF | random forest |
| ANN | artificial neural network |
| SVR | support vector regression |
| PLAMEC | power line automatic measurement method based on epipolar constraints |
| SPMEC | semi patch matching based on epipolar constraints |
References
- Simonett, D.S. Future and Present Needs of Remote Sensing in Geography; Technical Report; 1966. Available online: https://ntrs.nasa.gov/citations/19670031579 (accessed on 23 May 2023).
- Hudson, R.; Hudson, J.W. The military applications of remote sensing by infrared. Proc. IEEE 1975, 63, 104–128. [Google Scholar] [CrossRef]
- Badgley, P.C. Current Status of NASA’s Natural Resources Program. Exploring Unknown. 1960; p. 226. Available online: https://ntrs.nasa.gov/citations/19670031597 (accessed on 23 May 2023).
- Roads, B.O.P. Remote Sensing Applications to Highway Engineering. Public Roads 1968, 35, 28. [Google Scholar]
- Taylor, J.I.; Stingelin, R.W. Infrared imaging for water resources studies. J. Hydraul. Div. 1969, 95, 175–190. [Google Scholar] [CrossRef]
- Roy, D.P.; Wulder, M.A.; Loveland, T.R.; Woodcock, C.E.; Allen, R.G.; Anderson, M.C.; Helder, D.; Irons, J.R.; Johnson, D.M.; Kennedy, R.; et al. Landsat-8: Science and product vision for terrestrial global change research. Remote Sens. Environ. 2014, 145, 154–172. [Google Scholar] [CrossRef] [Green Version]
- Chevrel, M.; Courtois, M.; Weill, G. The SPOT satellite remote sensing mission. Photogramm. Eng. Remote Sens. 1981, 47, 1163–1171. [Google Scholar]
- Dial, G.; Bowen, H.; Gerlach, F.; Grodecki, J.; Oleszczuk, R. IKONOS satellite, imagery, and products. Remote Sens. Environ. 2003, 88, 23–36. [Google Scholar] [CrossRef]
- Rouse, J.W., Jr.; Haas, R.H.; Schell, J.; Deering, D. Monitoring the Vernal Advancement and Retrogradation (Green Wave Effect) of Natural Vegetation; Technical Report; 1973. Available online: https://ntrs.nasa.gov/citations/19740022555 (accessed on 23 May 2023).
- Jordan, C.F. Derivation of leaf-area index from quality of light on the forest floor. Ecology 1969, 50, 663–666. [Google Scholar] [CrossRef]
- Huete, A.; Didan, K.; Miura, T.; Rodriguez, E.P.; Gao, X.; Ferreira, L.G. Overview of the radiometric and biophysical performance of the MODIS vegetation indices. Remote Sens. Environ. 2002, 83, 195–213. [Google Scholar] [CrossRef]
- Gao, B.C. NDWI—A normalized difference water index for remote sensing of vegetation liquid water from space. Remote Sens. Environ. 1996, 58, 257–266. [Google Scholar] [CrossRef]
- Qi, J.; Chehbouni, A.; Huete, A.R.; Kerr, Y.H.; Sorooshian, S. A modified soil adjusted vegetation index. Remote Sens. Environ. 1994, 48, 119–126. [Google Scholar] [CrossRef]
- Huete, A.R. A soil-adjusted vegetation index (SAVI). Remote Sens. Environ. 1988, 25, 295–309. [Google Scholar] [CrossRef]
- Rondeaux, G.; Steven, M.; Baret, F. Optimization of soil-adjusted vegetation indices. Remote Sens. Environ. 1996, 55, 95–107. [Google Scholar] [CrossRef]
- Blaschke, T.; Lang, S.; Lorup, E.; Strobl, J.; Zeil, P. Object-oriented image processing in an integrated GIS/remote sensing environment and perspectives for environmental applications. Environ. Inf. Plan. Politics Public 2000, 2, 555–570. [Google Scholar]
- Blaschke, T.; Strobl, J. What’s wrong with pixels? Some recent developments interfacing remote sensing and GIS. Z. Geoinformationssysteme 2001, 12–17. Available online: https://www.researchgate.net/publication/216266284_What’s_wrong_with_pixels_Some_recent_developments_interfacing_remote_sensing_and_GIS (accessed on 23 May 2023).
- Schiewe, J. Segmentation of high-resolution remotely sensed data-concepts, applications and problems. Int. Arch. Photogramm. Remote Sens. Spat. Inf. Sci. 2002, 34, 380–385. [Google Scholar]
- Hay, G.J.; Blaschke, T.; Marceau, D.J.; Bouchard, A. A comparison of three image-object methods for the multiscale analysis of landscape structure. ISPRS J. Photogramm. Remote Sens. 2003, 57, 327–345. [Google Scholar] [CrossRef]
- Benz, U.C.; Hofmann, P.; Willhauck, G.; Lingenfelder, I.; Heynen, M. Multi-resolution, object-oriented fuzzy analysis of remote sensing data for GIS-ready information. ISPRS J. Photogramm. Remote Sens. 2004, 58, 239–258. [Google Scholar] [CrossRef]
- Blaschke, T.; Burnett, C.; Pekkarinen, A. New contextual approaches using image segmentation for objectbased classification. In Remote Sensing Image Analysis: Including the Spatial Domain; De Meer, F., de Jong, S., Eds.; 2004; Available online: https://courses.washington.edu/cfr530/GIS200106012.pdf (accessed on 23 May 2023).
- Zhan, Q.; Molenaar, M.; Tempfli, K.; Shi, W. Quality assessment for geo-spatial objects derived from remotely sensed data. Int. J. Remote Sens. 2005, 26, 2953–2974. [Google Scholar] [CrossRef]
- Ronneberger, O.; Fischer, P.; Brox, T. U-net: Convolutional networks for biomedical image segmentation. In Proceedings of the Medical Image Computing and Computer-Assisted Intervention–MICCAI 2015: 18th International Conference, Munich, Germany, 5–9 October 2015; Proceedings, Part III 18. Springer: Cham, Switzerland, 2015; pp. 234–241. [Google Scholar]
- He, K.; Gkioxari, G.; Dollár, P.; Girshick, R. Mask r-cnn. In Proceedings of the IEEE international Conference on Computer Vision, Venice, Italy, 22–29 October 2017; pp. 2961–2969. [Google Scholar]
- Hu, J.; Shen, L.; Sun, G. Squeeze-and-excitation networks. In Proceedings of the IEEE Conference on Computer Vision and Pattern Recognition, Salt Lake City, UT, USA, 18–23 June 2018; pp. 7132–7141. [Google Scholar]
- Chen, L.C.; Papandreou, G.; Kokkinos, I.; Murphy, K.; Yuille, A.L. Deeplab: Semantic image segmentation with deep convolutional nets, atrous convolution, and fully connected crfs. IEEE Trans. Pattern Anal. Mach. Intell. 2017, 40, 834–848. [Google Scholar] [CrossRef] [Green Version]
- Chu, X.; Zheng, A.; Zhang, X.; Sun, J. Detection in crowded scenes: One proposal, multiple predictions. In Proceedings of the IEEE/CVF Conference on Computer Vision and Pattern Recognition, Seattle, WA, USA, 13–19 June 2020; pp. 12214–12223. [Google Scholar]
- Blaschke, T. Object based image analysis for remote sensing. ISPRS J. Photogramm. Remote Sens. 2010, 65, 2–16. [Google Scholar] [CrossRef] [Green Version]
- Yao, H.; Qin, R.; Chen, X. Unmanned aerial vehicle for remote sensing applications—A review. Remote Sens. 2019, 11, 1443. [Google Scholar] [CrossRef] [Green Version]
- Colomina, I.; Molina, P. Unmanned aerial systems for photogrammetry and remote sensing: A review. ISPRS J. Photogramm. Remote Sens. 2014, 92, 79–97. [Google Scholar] [CrossRef] [Green Version]
- Alvarez-Vanhard, E.; Corpetti, T.; Houet, T. UAV & satellite synergies for optical remote sensing applications: A literature review. Sci. Remote Sens. 2021, 3, 100019. [Google Scholar]
- Osco, L.P.; Junior, J.M.; Ramos, A.P.M.; de Castro Jorge, L.A.; Fatholahi, S.N.; de Andrade Silva, J.; Matsubara, E.T.; Pistori, H.; Gonçalves, W.N.; Li, J. A review on deep learning in UAV remote sensing. Int. J. Appl. Earth Obs. Geoinf. 2021, 102, 102456. [Google Scholar] [CrossRef]
- Aasen, H.; Honkavaara, E.; Lucieer, A.; Zarco-Tejada, P.J. Quantitative remote sensing at ultra-high resolution with UAV spectroscopy: A review of sensor technology, measurement procedures, and data correction workflows. Remote Sens. 2018, 10, 1091. [Google Scholar] [CrossRef] [Green Version]
- Guimarães, N.; Pádua, L.; Marques, P.; Silva, N.; Peres, E.; Sousa, J.J. Forestry remote sensing from unmanned aerial vehicles: A review focusing on the data, processing and potentialities. Remote Sens. 2020, 12, 1046. [Google Scholar] [CrossRef] [Green Version]
- Torresan, C.; Berton, A.; Carotenuto, F.; Di Gennaro, S.F.; Gioli, B.; Matese, A.; Miglietta, F.; Vagnoli, C.; Zaldei, A.; Wallace, L. Forestry applications of UAVs in Europe: A review. Int. J. Remote Sens. 2017, 38, 2427–2447. [Google Scholar] [CrossRef]
- Maes, W.H.; Steppe, K. Perspectives for remote sensing with unmanned aerial vehicles in precision agriculture. Trends Plant Sci. 2019, 24, 152–164. [Google Scholar] [CrossRef]
- Tsouros, D.C.; Bibi, S.; Sarigiannidis, P.G. A review on UAV-based applications for precision agriculture. Information 2019, 10, 349. [Google Scholar] [CrossRef] [Green Version]
- Olson, D.; Anderson, J. Review on unmanned aerial vehicles, remote sensors, imagery processing, and their applications in agriculture. Agron. J. 2021, 113, 971–992. [Google Scholar] [CrossRef]
- Sishodia, R.P.; Ray, R.L.; Singh, S.K. Applications of remote sensing in precision agriculture: A review. Remote Sens. 2020, 12, 3136. [Google Scholar] [CrossRef]
- Jafarbiglu, H.; Pourreza, A. A comprehensive review of remote sensing platforms, sensors, and applications in nut crops. Comput. Electron. Agric. 2022, 197, 106844. [Google Scholar] [CrossRef]
- Carrivick, J.L.; Smith, M.W.; Quincey, D.J. Structure from Motion in the Geosciences; John Wiley & Sons: Hoboken, NJ, USA, 2016. [Google Scholar]
- Liu, Y.; Zheng, X.; Ai, G.; Zhang, Y.; Zuo, Y. Generating a high-precision true digital orthophoto map based on UAV images. ISPRS Int. J. Geo-Inf. 2018, 7, 333. [Google Scholar] [CrossRef] [Green Version]
- Watson, D.J. Comparative physiological studies on the growth of field crops: I. Variation in net assimilation rate and leaf area between species and varieties, and within and between years. Ann. Bot. 1947, 11, 41–76. [Google Scholar] [CrossRef]
- Seager, S.; Turner, E.L.; Schafer, J.; Ford, E.B. Vegetation’s red edge: A possible spectroscopic biosignature of extraterrestrial plants. Astrobiology 2005, 5, 372–390. [Google Scholar] [CrossRef]
- Delegido, J.; Verrelst, J.; Meza, C.; Rivera, J.; Alonso, L.; Moreno, J. A red-edge spectral index for remote sensing estimation of green LAI over agroecosystems. Eur. J. Agron. 2013, 46, 42–52. [Google Scholar] [CrossRef]
- Lin, S.; Li, J.; Liu, Q.; Li, L.; Zhao, J.; Yu, W. Evaluating the effectiveness of using vegetation indices based on red-edge reflectance from Sentinel-2 to estimate gross primary productivity. Remote Sens. 2019, 11, 1303. [Google Scholar] [CrossRef] [Green Version]
- Imran, H.A.; Gianelle, D.; Rocchini, D.; Dalponte, M.; Martín, M.P.; Sakowska, K.; Wohlfahrt, G.; Vescovo, L. VIS-NIR, red-edge and NIR-shoulder based normalized vegetation indices response to co-varying leaf and Canopy structural traits in heterogeneous grasslands. Remote Sens. 2020, 12, 2254. [Google Scholar] [CrossRef]
- Datta, D.; Paul, M.; Murshed, M.; Teng, S.W.; Schmidtke, L. Soil Moisture, Organic Carbon, and Nitrogen Content Prediction with Hyperspectral Data Using Regression Models. Sensors 2022, 22, 7998. [Google Scholar] [CrossRef]
- Jackisch, R.; Madriz, Y.; Zimmermann, R.; Pirttijärvi, M.; Saartenoja, A.; Heincke, B.H.; Salmirinne, H.; Kujasalo, J.P.; Andreani, L.; Gloaguen, R. Drone-borne hyperspectral and magnetic data integration: Otanmäki Fe-Ti-V deposit in Finland. Remote Sens. 2019, 11, 2084. [Google Scholar] [CrossRef] [Green Version]
- Thiele, S.T.; Bnoulkacem, Z.; Lorenz, S.; Bordenave, A.; Menegoni, N.; Madriz, Y.; Dujoncquoy, E.; Gloaguen, R.; Kenter, J. Mineralogical mapping with accurately corrected shortwave infrared hyperspectral data acquired obliquely from UAVs. Remote Sens. 2021, 14, 5. [Google Scholar] [CrossRef]
- Krause, S.; Sanders, T.G.; Mund, J.P.; Greve, K. UAV-based photogrammetric tree height measurement for intensive forest monitoring. Remote Sens. 2019, 11, 758. [Google Scholar] [CrossRef] [Green Version]
- Yu, J.W.; Yoon, Y.W.; Baek, W.K.; Jung, H.S. Forest Vertical Structure Mapping Using Two-Seasonal Optic Images and LiDAR DSM Acquired from UAV Platform through Random Forest, XGBoost, and Support Vector Machine Approaches. Remote Sens. 2021, 13, 4282. [Google Scholar] [CrossRef]
- Zhang, H.; Bauters, M.; Boeckx, P.; Van Oost, K. Mapping canopy heights in dense tropical forests using low-cost UAV-derived photogrammetric point clouds and machine learning approaches. Remote Sens. 2021, 13, 3777. [Google Scholar] [CrossRef]
- Chen, C.; Yang, B.; Song, S.; Peng, X.; Huang, R. Automatic clearance anomaly detection for transmission line corridors utilizing UAV-Borne LIDAR data. Remote Sens. 2018, 10, 613. [Google Scholar] [CrossRef] [Green Version]
- Zhang, R.; Yang, B.; Xiao, W.; Liang, F.; Liu, Y.; Wang, Z. Automatic extraction of high-voltage power transmission objects from UAV lidar point clouds. Remote Sens. 2019, 11, 2600. [Google Scholar] [CrossRef] [Green Version]
- Alshawabkeh, Y.; Baik, A.; Fallatah, A. As-Textured As-Built BIM Using Sensor Fusion, Zee Ain Historical Village as a Case Study. Remote Sens. 2021, 13, 5135. [Google Scholar] [CrossRef]
- Short, N.M. The Landsat Tutorial Workbook: Basics of Satellite Remote Sensing; National Aeronautics and Space Administration, Scientific and Technical Information Branch: Washington, DC, USA, 1982; Volume 1078.
- Schowengerdt, R.A. Soft classification and spatial-spectral mixing. In Proceedings of the International Workshop on Soft Computing in Remote Sensing Data Analysis, Milan, Italy, 4–5 December 1995; pp. 4–5. [Google Scholar]
- Long, J.; Shelhamer, E.; Darrell, T. Fully convolutional networks for semantic segmentation. In Proceedings of the IEEE Conference on Computer Vision and Pattern Recognition, Boston, MA, USA, 7–12 June 2015; pp. 3431–3440. [Google Scholar]
- Badrinarayanan, V.; Kendall, A.; Cipolla, R. Segnet: A deep convolutional encoder-decoder architecture for image segmentation. IEEE Trans. Pattern Anal. Mach. Intell. 2017, 39, 2481–2495. [Google Scholar] [CrossRef]
- Chen, L.C.; Zhu, Y.; Papandreou, G.; Schroff, F.; Adam, H. Encoder-decoder with atrous separable convolution for semantic image segmentation. In Proceedings of the European Conference on Computer Vision (ECCV), Munich, Germany, 8–14 September 2018; pp. 801–818. [Google Scholar]
- Wang, X.; Kong, T.; Shen, C.; Jiang, Y.; Li, L. Solo: Segmenting objects by locations. In Proceedings of the Computer Vision–ECCV 2020: 16th European Conference, Glasgow, UK, 23–28 August 2020; Proceedings, Part XVIII 16. Springer: Cham, Switzerland, 2020; pp. 649–665. [Google Scholar]
- Bolya, D.; Zhou, C.; Xiao, F.; Lee, Y.J. Yolact: Real-time instance segmentation. In Proceedings of the IEEE/CVF International Conference on Computer Vision, Seoul, Republic of Korea, 27 October–2 November 2019; pp. 9157–9166. [Google Scholar]
- Zhao, G.; Zhang, W.; Peng, Y.; Wu, H.; Wang, Z.; Cheng, L. PEMCNet: An Efficient Multi-Scale Point Feature Fusion Network for 3D LiDAR Point Cloud Classification. Remote Sens. 2021, 13, 4312. [Google Scholar] [CrossRef]
- Harvey, W.; Rainwater, C.; Cothren, J. Direct Aerial Visual Geolocalization Using Deep Neural Networks. Remote Sens. 2021, 13, 4017. [Google Scholar] [CrossRef]
- Chollet, F. Xception: Deep learning with depthwise separable convolutions. In Proceedings of the IEEE Conference on Computer Vision and Pattern Recognition, Honolulu, HI, USA, 21–26 July 2017; pp. 1251–1258. [Google Scholar]
- Zhuang, J.; Dai, M.; Chen, X.; Zheng, E. A Faster and More Effective Cross-View Matching Method of UAV and Satellite Images for UAV Geolocalization. Remote Sens. 2021, 13, 3979. [Google Scholar] [CrossRef]
- Chen, B.; Chen, Z.; Deng, L.; Duan, Y.; Zhou, J. Building change detection with RGB-D map generated from UAV images. Neurocomputing 2016, 208, 350–364. [Google Scholar] [CrossRef]
- Cook, K.L. An evaluation of the effectiveness of low-cost UAVs and structure from motion for geomorphic change detection. Geomorphology 2017, 278, 195–208. [Google Scholar] [CrossRef]
- Mesquita, D.B.; dos Santos, R.F.; Macharet, D.G.; Campos, M.F.; Nascimento, E.R. Fully convolutional siamese autoencoder for change detection in UAV aerial images. IEEE Geosci. Remote Sens. Lett. 2019, 17, 1455–1459. [Google Scholar] [CrossRef]
- Hastaoğlu, K.Ö.; Gül, Y.; Poyraz, F.; Kara, B.C. Monitoring 3D areal displacements by a new methodology and software using UAV photogrammetry. Int. J. Appl. Earth Obs. Geoinf. 2019, 83, 101916. [Google Scholar] [CrossRef]
- Lucieer, A.; Jong, S.M.d.; Turner, D. Mapping landslide displacements using Structure from Motion (SfM) and image correlation of multi-temporal UAV photography. Prog. Phys. Geogr. 2014, 38, 97–116. [Google Scholar] [CrossRef]
- Li, M.; Cheng, D.; Yang, X.; Luo, G.; Liu, N.; Meng, C.; Peng, Q. High precision slope deformation monitoring by uav with industrial photogrammetry. IOP Conf. Ser. Earth Environ. Sci. 2021, 636, 012015. [Google Scholar] [CrossRef]
- Han, D.; Lee, S.B.; Song, M.; Cho, J.S. Change detection in unmanned aerial vehicle images for progress monitoring of road construction. Buildings 2021, 11, 150. [Google Scholar] [CrossRef]
- Huang, R.; Xu, Y.; Hoegner, L.; Stilla, U. Semantics-aided 3D change detection on construction sites using UAV-based photogrammetric point clouds. Autom. Constr. 2022, 134, 104057. [Google Scholar] [CrossRef]
- Sanz-Ablanedo, E.; Chandler, J.H.; Rodríguez-Pérez, J.R.; Ordóñez, C. Accuracy of unmanned aerial vehicle (UAV) and SfM photogrammetry survey as a function of the number and location of ground control points used. Remote Sens. 2018, 10, 1606. [Google Scholar] [CrossRef] [Green Version]
- Rebelo, C.; Nascimento, J. Measurement of Soil Tillage Using UAV High-Resolution 3D Data. Remote Sens. 2021, 13, 4336. [Google Scholar] [CrossRef]
- Almeida, A.; Gonçalves, F.; Silva, G.; Mendonça, A.; Gonzaga, M.; Silva, J.; Souza, R.; Leite, I.; Neves, K.; Boeno, M.; et al. Individual Tree Detection and Qualitative Inventory of a Eucalyptus sp. Stand Using UAV Photogrammetry Data. Remote Sens. 2021, 13, 3655. [Google Scholar] [CrossRef]
- Hartwig, M.E.; Ribeiro, L.P. Gully evolution assessment from structure-from-motion, southeastern Brazil. Environ. Earth Sci. 2021, 80, 548. [Google Scholar] [CrossRef]
- Abdulridha, J.; Ampatzidis, Y.; Qureshi, J.; Roberts, P. Laboratory and UAV-based identification and classification of tomato yellow leaf curl, bacterial spot, and target spot diseases in tomato utilizing hyperspectral imaging and machine learning. Remote Sens. 2020, 12, 2732. [Google Scholar] [CrossRef]
- Ampatzidis, Y.; Partel, V. UAV-based high throughput phenotyping in citrus utilizing multispectral imaging and artificial intelligence. Remote Sens. 2019, 11, 410. [Google Scholar] [CrossRef] [Green Version]
- Moriya, É.A.S.; Imai, N.N.; Tommaselli, A.M.G.; Berveglieri, A.; Santos, G.H.; Soares, M.A.; Marino, M.; Reis, T.T. Detection and mapping of trees infected with citrus gummosis using UAV hyperspectral data. Comput. Electron. Agric. 2021, 188, 106298. [Google Scholar] [CrossRef]
- Kerkech, M.; Hafiane, A.; Canals, R. VddNet: Vine disease detection network based on multispectral images and depth map. Remote Sens. 2020, 12, 3305. [Google Scholar] [CrossRef]
- Ren, D.; Peng, Y.; Sun, H.; Yu, M.; Yu, J.; Liu, Z. A Global Multi-Scale Channel Adaptation Network for Pine Wilt Disease Tree Detection on UAV Imagery by Circle Sampling. Drones 2022, 6, 353. [Google Scholar] [CrossRef]
- Yu, R.; Luo, Y.; Zhou, Q.; Zhang, X.; Wu, D.; Ren, L. Early detection of pine wilt disease using deep learning algorithms and UAV-based multispectral imagery. For. Ecol. Manag. 2021, 497, 119493. [Google Scholar] [CrossRef]
- Hu, G.; Yin, C.; Wan, M.; Zhang, Y.; Fang, Y. Recognition of diseased Pinus trees in UAV images using deep learning and AdaBoost classifier. Biosyst. Eng. 2020, 194, 138–151. [Google Scholar] [CrossRef]
- Micieli, M.; Botter, G.; Mendicino, G.; Senatore, A. UAV Thermal Images for Water Presence Detection in a Mediterranean Headwater Catchment. Remote Sens. 2021, 14, 108. [Google Scholar] [CrossRef]
- Lubczonek, J.; Kazimierski, W.; Zaniewicz, G.; Lacka, M. Methodology for combining data acquired by unmanned surface and aerial vehicles to create digital bathymetric models in shallow and ultra-shallow waters. Remote Sens. 2021, 14, 105. [Google Scholar] [CrossRef]
- Christie, A.I.; Colefax, A.P.; Cagnazzi, D. Feasibility of Using Small UAVs to Derive Morphometric Measurements of Australian Snubfin (Orcaella heinsohni) and Humpback (Sousa sahulensis) Dolphins. Remote Sens. 2021, 14, 21. [Google Scholar] [CrossRef]
- Lu, Z.; Gong, H.; Jin, Q.; Hu, Q.; Wang, S. A transmission tower tilt state assessment approach based on dense point cloud from UAV-based LiDAR. Remote Sens. 2022, 14, 408. [Google Scholar] [CrossRef]
- Ganz, S.; Käber, Y.; Adler, P. Measuring tree height with remote sensing—A comparison of photogrammetric and LiDAR data with different field measurements. Forests 2019, 10, 694. [Google Scholar] [CrossRef] [Green Version]
- Fakhri, S.A.; Latifi, H. A Consumer Grade UAV-Based Framework to Estimate Structural Attributes of Coppice and High Oak Forest Stands in Semi-Arid Regions. Remote Sens. 2021, 13, 4367. [Google Scholar] [CrossRef]
- Meyer, F.; Beucher, S. Morphological segmentation. J. Vis. Commun. Image Represent. 1990, 1, 21–46. [Google Scholar] [CrossRef]
- Pu, Y.; Xu, D.; Wang, H.; An, D.; Xu, X. Extracting Canopy Closure by the CHM-Based and SHP-Based Methods with a Hemispherical FOV from UAV-LiDAR Data in a Poplar Plantation. Remote Sens. 2021, 13, 3837. [Google Scholar] [CrossRef]
- Mo, J.; Lan, Y.; Yang, D.; Wen, F.; Qiu, H.; Chen, X.; Deng, X. Deep Learning-Based Instance Segmentation Method of Litchi Canopy from UAV-Acquired Images. Remote Sens. 2021, 13, 3919. [Google Scholar] [CrossRef]
- Reder, S.; Mund, J.P.; Albert, N.; Waßermann, L.; Miranda, L. Detection of Windthrown Tree Stems on UAV-Orthomosaics Using U-Net Convolutional Networks. Remote Sens. 2021, 14, 75. [Google Scholar] [CrossRef]
- Chen, T.; Guestrin, C. Xgboost: A scalable tree boosting system. In Proceedings of the 22nd ACM Sigkdd International Conference on Knowledge Discovery and Data Mining, San Francisco, CA, USA, 13–17 August 2016; pp. 785–794. [Google Scholar]
- Guo, X.; Liu, Q.; Sharma, R.P.; Chen, Q.; Ye, Q.; Tang, S.; Fu, L. Tree Recognition on the Plantation Using UAV Images with Ultrahigh Spatial Resolution in a Complex Environment. Remote Sens. 2021, 13, 4122. [Google Scholar] [CrossRef]
- Taylor-Zavala, R.; Ramírez-Rodríguez, O.; de Armas-Ricard, M.; Sanhueza, H.; Higueras-Fredes, F.; Mattar, C. Quantifying Biochemical Traits over the Patagonian Sub-Antarctic Forests and Their Relation to Multispectral Vegetation Indices. Remote Sens. 2021, 13, 4232. [Google Scholar] [CrossRef]
- Li, X.; Gao, H.; Zhang, M.; Zhang, S.; Gao, Z.; Liu, J.; Sun, S.; Hu, T.; Sun, L. Prediction of Forest Fire Spread Rate Using UAV Images and an LSTM Model Considering the Interaction between Fire and Wind. Remote Sens. 2021, 13, 4325. [Google Scholar] [CrossRef]
- Hochreiter, S.; Schmidhuber, J. Long short-term memory. Neural Comput. 1997, 9, 1735–1780. [Google Scholar] [CrossRef] [PubMed]
- Hu, J.; Niu, H.; Carrasco, J.; Lennox, B.; Arvin, F. Fault-tolerant cooperative navigation of networked UAV swarms for forest fire monitoring. Aerosp. Sci. Technol. 2022, 123, 107494. [Google Scholar] [CrossRef]
- Namburu, A.; Selvaraj, P.; Mohan, S.; Ragavanantham, S.; Eldin, E.T. Forest Fire Identification in UAV Imagery Using X-MobileNet. Electronics 2023, 12, 733. [Google Scholar] [CrossRef]
- Howard, A.G.; Zhu, M.; Chen, B.; Kalenichenko, D.; Wang, W.; Weyand, T.; Andreetto, M.; Adam, H. Mobilenets: Efficient convolutional neural networks for mobile vision applications. arXiv 2017, arXiv:1704.04861. [Google Scholar]
- Beltrán-Marcos, D.; Suárez-Seoane, S.; Fernández-Guisuraga, J.M.; Fernández-García, V.; Marcos, E.; Calvo, L. Relevance of UAV and sentinel-2 data fusion for estimating topsoil organic carbon after forest fire. Geoderma 2023, 430, 116290. [Google Scholar] [CrossRef]
- Rutherford, T.; Webster, J. Distribution of pine wilt disease with respect to temperature in North America, Japan, and Europe. Can. J. For. Res. 1987, 17, 1050–1059. [Google Scholar] [CrossRef]
- Hunt, D. Pine wilt disease: A worldwide threat to forest ecosystems. Nematology 2009, 11, 315–316. [Google Scholar] [CrossRef] [Green Version]
- Wu, B.; Liang, A.; Zhang, H.; Zhu, T.; Zou, Z.; Yang, D.; Tang, W.; Li, J.; Su, J. Application of conventional UAV-based high-throughput object detection to the early diagnosis of pine wilt disease by deep learning. For. Ecol. Manag. 2021, 486, 118986. [Google Scholar] [CrossRef]
- Xia, L.; Zhang, R.; Chen, L.; Li, L.; Yi, T.; Wen, Y.; Ding, C.; Xie, C. Evaluation of Deep Learning Segmentation Models for Detection of Pine Wilt Disease in Unmanned Aerial Vehicle Images. Remote Sens. 2021, 13, 3594. [Google Scholar] [CrossRef]
- Li, F.; Liu, Z.; Shen, W.; Wang, Y.; Wang, Y.; Ge, C.; Sun, F.; Lan, P. A remote sensing and airborne edge-computing based detection system for pine wilt disease. IEEE Access 2021, 9, 66346–66360. [Google Scholar] [CrossRef]
- Bochkovskiy, A.; Wang, C.Y.; Liao, H.Y.M. Yolov4: Optimal speed and accuracy of object detection. arXiv 2020, arXiv:2004.10934. [Google Scholar]
- Sun, Z.; Wang, Y.; Pan, L.; Xie, Y.; Zhang, B.; Liang, R.; Sun, Y. Pine wilt disease detection in high-resolution UAV images using object-oriented classification. J. For. Res. 2022, 33, 1377–1389. [Google Scholar] [CrossRef]
- Yu, R.; Luo, Y.; Li, H.; Yang, L.; Huang, H.; Yu, L.; Ren, L. Three-Dimensional Convolutional Neural Network Model for Early Detection of Pine Wilt Disease Using UAV-Based Hyperspectral Images. Remote Sens. 2021, 13, 4065. [Google Scholar] [CrossRef]
- Yu, R.; Luo, Y.; Zhou, Q.; Zhang, X.; Wu, D.; Ren, L. A machine learning algorithm to detect pine wilt disease using UAV-based hyperspectral imagery and LiDAR data at the tree level. Int. J. Appl. Earth Obs. Geoinf. 2021, 101, 102363. [Google Scholar] [CrossRef]
- Li, J.; Wang, X.; Zhao, H.; Hu, X.; Zhong, Y. Detecting pine wilt disease at the pixel level from high spatial and spectral resolution UAV-borne imagery in complex forest landscapes using deep one-class classification. Int. J. Appl. Earth Obs. Geoinf. 2022, 112, 102947. [Google Scholar] [CrossRef]
- Dash, J.P.; Watt, M.S.; Pearse, G.D.; Heaphy, M.; Dungey, H.S. Assessing very high resolution UAV imagery for monitoring forest health during a simulated disease outbreak. ISPRS J. Photogramm. Remote Sens. 2017, 131, 1–14. [Google Scholar] [CrossRef]
- Sandino, J.; Pegg, G.; Gonzalez, F.; Smith, G. Aerial mapping of forests affected by pathogens using UAVs, hyperspectral sensors, and artificial intelligence. Sensors 2018, 18, 944. [Google Scholar] [CrossRef] [Green Version]
- Näsi, R.; Honkavaara, E.; Blomqvist, M.; Lyytikäinen-Saarenmaa, P.; Hakala, T.; Viljanen, N.; Kantola, T.; Holopainen, M. Remote sensing of bark beetle damage in urban forests at individual tree level using a novel hyperspectral camera from UAV and aircraft. Urban For. Urban Green. 2018, 30, 72–83. [Google Scholar] [CrossRef]
- Gobbi, B.; Van Rompaey, A.; Gasparri, N.I.; Vanacker, V. Forest degradation in the Dry Chaco: A detection based on 3D canopy reconstruction from UAV-SfM techniques. For. Ecol. Manag. 2022, 526, 120554. [Google Scholar] [CrossRef]
- Coletta, L.F.; de Almeida, D.C.; Souza, J.R.; Manzione, R.L. Novelty detection in UAV images to identify emerging threats in eucalyptus crops. Comput. Electron. Agric. 2022, 196, 106901. [Google Scholar] [CrossRef]
- Xiao, D.; Pan, Y.; Feng, J.; Yin, J.; Liu, Y.; He, L. Remote sensing detection algorithm for apple fire blight based on UAV multispectral image. Comput. Electron. Agric. 2022, 199, 107137. [Google Scholar] [CrossRef]
- Singh, P.; Pandey, P.C.; Petropoulos, G.P.; Pavlides, A.; Srivastava, P.K.; Koutsias, N.; Deng, K.A.K.; Bao, Y. Hyperspectral remote sensing in precision agriculture: Present status, challenges, and future trends. In Hyperspectral Remote Sensing; Elsevier: Amsterdam, The Netherlands, 2020; pp. 121–146. [Google Scholar]
- Fuglie, K. The growing role of the private sector in agricultural research and development world-wide. Glob. Food Secur. 2016, 10, 29–38. [Google Scholar] [CrossRef]
- Chang, A.; Yeom, J.; Jung, J.; Landivar, J. Comparison of canopy shape and vegetation indices of citrus trees derived from UAV multispectral images for characterization of citrus greening disease. Remote Sens. 2020, 12, 4122. [Google Scholar] [CrossRef]
- Barnes, E.; Clarke, T.; Richards, S.; Colaizzi, P.; Haberland, J.; Kostrzewski, M.; Waller, P.; Choi, C.; Riley, E.; Thompson, T.; et al. Coincident detection of crop water stress, nitrogen status and canopy density using ground based multispectral data. In Proceedings of the Fifth International Conference on Precision Agriculture, Bloomington, MN, USA, 16–19 July 2000; Volume 1619, p. 6. [Google Scholar]
- Gitelson, A.A.; Viña, A.; Arkebauer, T.J.; Rundquist, D.C.; Keydan, G.; Leavitt, B. Remote estimation of leaf area index and green leaf biomass in maize canopies. Geophys. Res. Lett. 2003, 30. Available online: https://www.researchgate.net/publication/43256762_Coincident_detection_of_crop_water_stress_nitrogen_status_and_canopy_density_using_ground_based_multispectral_data (accessed on 23 May 2023). [CrossRef] [Green Version]
- Deng, X.; Zhu, Z.; Yang, J.; Zheng, Z.; Huang, Z.; Yin, X.; Wei, S.; Lan, Y. Detection of citrus huanglongbing based on multi-input neural network model of UAV hyperspectral remote sensing. Remote Sens. 2020, 12, 2678. [Google Scholar] [CrossRef]
- Kerkech, M.; Hafiane, A.; Canals, R. Deep leaning approach with colorimetric spaces and vegetation indices for vine diseases detection in UAV images. Comput. Electron. Agric. 2018, 155, 237–243. [Google Scholar] [CrossRef]
- Meyer, G.E.; Hindman, T.W.; Laksmi, K. Machine vision detection parameters for plant species identification. In Proceedings of the Precision Agriculture and Biological Quality, Boston, MA, USA, 3–4 November 1999; Volume 3543, pp. 327–335. [Google Scholar]
- Woebbecke, D.M.; Meyer, G.E.; Von Bargen, K.; Mortensen, D.A. Color indices for weed identification under various soil, residue, and lighting conditions. Trans. ASAE 1995, 38, 259–269. [Google Scholar] [CrossRef]
- Meyer, G.E.; Neto, J.C. Verification of color vegetation indices for automated crop imaging applications. Comput. Electron. Agric. 2008, 63, 282–293. [Google Scholar] [CrossRef]
- Su, J.; Liu, C.; Coombes, M.; Hu, X.; Wang, C.; Xu, X.; Li, Q.; Guo, L.; Chen, W.H. Wheat yellow rust monitoring by learning from multispectral UAV aerial imagery. Comput. Electron. Agric. 2018, 155, 157–166. [Google Scholar] [CrossRef]
- Zhang, X.; Han, L.; Dong, Y.; Shi, Y.; Huang, W.; Han, L.; González-Moreno, P.; Ma, H.; Ye, H.; Sobeih, T. A deep learning-based approach for automated yellow rust disease detection from high-resolution hyperspectral UAV images. Remote Sens. 2019, 11, 1554. [Google Scholar] [CrossRef] [Green Version]
- Zhang, T.; Xu, Z.; Su, J.; Yang, Z.; Liu, C.; Chen, W.H.; Li, J. Ir-UNet: Irregular Segmentation U-Shape Network for Wheat Yellow Rust Detection by UAV Multispectral Imagery. Remote Sens. 2021, 13, 3892. [Google Scholar] [CrossRef]
- Huang, H.; Deng, J.; Lan, Y.; Yang, A.; Zhang, L.; Wen, S.; Zhang, H.; Zhang, Y.; Deng, Y. Detection of helminthosporium leaf blotch disease based on UAV imagery. Appl. Sci. 2019, 9, 558. [Google Scholar] [CrossRef] [Green Version]
- Kharim, M.N.A.; Wayayok, A.; Abdullah, A.F.; Shariff, A.R.M.; Husin, E.M.; Mahadi, M.R. Predictive zoning of pest and disease infestations in rice field based on UAV aerial imagery. Egypt. J. Remote Sens. Space Sci. 2022, 25, 831–840. [Google Scholar]
- Stewart, E.L.; Wiesner-Hanks, T.; Kaczmar, N.; DeChant, C.; Wu, H.; Lipson, H.; Nelson, R.J.; Gore, M.A. Quantitative phenotyping of Northern Leaf Blight in UAV images using deep learning. Remote Sens. 2019, 11, 2209. [Google Scholar] [CrossRef] [Green Version]
- Ishengoma, F.S.; Rai, I.A.; Said, R.N. Identification of maize leaves infected by fall armyworms using UAV-based imagery and convolutional neural networks. Comput. Electron. Agric. 2021, 184, 106124. [Google Scholar] [CrossRef]
- Simonyan, K.; Zisserman, A. Very deep convolutional networks for large-scale image recognition. arXiv 2014, arXiv:1409.1556. [Google Scholar]
- Szegedy, C.; Vanhoucke, V.; Ioffe, S.; Shlens, J.; Wojna, Z. Rethinking the inception architecture for computer vision. In Proceedings of the IEEE Conference on Computer Vision and Pattern Recognition, Las Vegas, NV, USA, 27–30 June 2016; pp. 2818–2826. [Google Scholar]
- Sandler, M.; Howard, A.; Zhu, M.; Zhmoginov, A.; Chen, L.C. Mobilenetv2: Inverted residuals and linear bottlenecks. In Proceedings of the IEEE Conference on Computer Vision and Pattern Recognition, Salt Lake City, UT, USA, 18–22 June 2018; pp. 4510–4520. [Google Scholar]
- Ye, H.; Huang, W.; Huang, S.; Cui, B.; Dong, Y.; Guo, A.; Ren, Y.; Jin, Y. Recognition of banana fusarium wilt based on UAV remote sensing. Remote Sens. 2020, 12, 938. [Google Scholar] [CrossRef] [Green Version]
- Tetila, E.C.; Machado, B.B.; Menezes, G.K.; Oliveira, A.d.S.; Alvarez, M.; Amorim, W.P.; Belete, N.A.D.S.; Da Silva, G.G.; Pistori, H. Automatic recognition of soybean leaf diseases using UAV images and deep convolutional neural networks. IEEE Geosci. Remote Sens. Lett. 2019, 17, 903–907. [Google Scholar] [CrossRef]
- Ha, J.G.; Moon, H.; Kwak, J.T.; Hassan, S.I.; Dang, M.; Lee, O.N.; Park, H.Y. Deep convolutional neural network for classifying Fusarium wilt of radish from unmanned aerial vehicles. J. Appl. Remote Sens. 2017, 11, 042621. [Google Scholar] [CrossRef]
- Lu, F.; Sun, Y.; Hou, F. Using UAV visible images to estimate the soil moisture of steppe. Water 2020, 12, 2334. [Google Scholar] [CrossRef]
- Ge, X.; Ding, J.; Jin, X.; Wang, J.; Chen, X.; Li, X.; Liu, J.; Xie, B. Estimating agricultural soil moisture content through UAV-based hyperspectral images in the arid region. Remote Sens. 2021, 13, 1562. [Google Scholar] [CrossRef]
- Bertalan, L.; Holb, I.; Pataki, A.; Szabó, G.; Szalóki, A.K.; Szabó, S. UAV-based multispectral and thermal cameras to predict soil water content–A machine learning approach. Comput. Electron. Agric. 2022, 200, 107262. [Google Scholar] [CrossRef]
- Awad, M.; Khanna, R.; Awad, M.; Khanna, R. Support vector regression. In Efficient Learning Machines: Theories, Concepts, and Applications for Engineers and System Designers; 2015; pp. 67–80. Available online: https://www.researchgate.net/publication/277299933_Efficient_Learning_Machines_Theories_Concepts_and_Applications_for_Engineers_and_System_Designers (accessed on 23 May 2023).
- Zhang, Y.; Han, W.; Zhang, H.; Niu, X.; Shao, G. Evaluating soil moisture content under maize coverage using UAV multimodal data by machine learning algorithms. J. Hydrol. 2023, 129086. [Google Scholar] [CrossRef]
- Zhang, X.; Yuan, Y.; Zhu, Z.; Ma, Q.; Yu, H.; Li, M.; Ma, J.; Yi, S.; He, X.; Sun, Y. Predicting the Distribution of Oxytropis ochrocephala Bunge in the Source Region of the Yellow River (China) Based on UAV Sampling Data and Species Distribution Model. Remote Sens. 2021, 13, 5129. [Google Scholar] [CrossRef]
- Lan, Y.; Huang, K.; Yang, C.; Lei, L.; Ye, J.; Zhang, J.; Zeng, W.; Zhang, Y.; Deng, J. Real-Time Identification of Rice Weeds by UAV Low-Altitude Remote Sensing Based on Improved Semantic Segmentation Model. Remote Sens. 2021, 13, 4370. [Google Scholar] [CrossRef]
- Lu, W.; Okayama, T.; Komatsuzaki, M. Rice Height Monitoring between Different Estimation Models Using UAV Photogrammetry and Multispectral Technology. Remote Sens. 2021, 14, 78. [Google Scholar] [CrossRef]
- Wei, L.; Luo, Y.; Xu, L.; Zhang, Q.; Cai, Q.; Shen, M. Deep Convolutional Neural Network for Rice Density Prescription Map at Ripening Stage Using Unmanned Aerial Vehicle-Based Remotely Sensed Images. Remote Sens. 2021, 14, 46. [Google Scholar] [CrossRef]
- Cao, X.; Liu, Y.; Yu, R.; Han, D.; Su, B. A Comparison of UAV RGB and Multispectral Imaging in Phenotyping for Stay Green of Wheat Population. Remote Sens. 2021, 13, 5173. [Google Scholar] [CrossRef]
- Zhao, J.; Zhang, X.; Yan, J.; Qiu, X.; Yao, X.; Tian, Y.; Zhu, Y.; Cao, W. A wheat spike detection method in UAV images based on improved YOLOv5. Remote Sens. 2021, 13, 3095. [Google Scholar] [CrossRef]
- Jocher, G.; Stoken, A.; Borovec, J.; Christopher, S.; Laughing, L.C. ultralytics/yolov5: V4. 0-nn. SiLU () activations, Weights & Biases logging, PyTorch Hub integration. Zenodo 2021. [Google Scholar] [CrossRef]
- Wang, J.; Zhou, Q.; Shang, J.; Liu, C.; Zhuang, T.; Ding, J.; Xian, Y.; Zhao, L.; Wang, W.; Zhou, G.; et al. UAV-and Machine Learning-Based Retrieval of Wheat SPAD Values at the Overwintering Stage for Variety Screening. Remote Sens. 2021, 13, 5166. [Google Scholar] [CrossRef]
- Nazeri, B.; Crawford, M. Detection of Outliers in LiDAR Data Acquired by Multiple Platforms over Sorghum and Maize. Remote Sens. 2021, 13, 4445. [Google Scholar] [CrossRef]
- Chen, P.; Ma, X.; Wang, F.; Li, J. A New Method for Crop Row Detection Using Unmanned Aerial Vehicle Images. Remote Sens. 2021, 13, 3526. [Google Scholar] [CrossRef]
- Wang, F.; Yao, X.; Xie, L.; Zheng, J.; Xu, T. Rice Yield Estimation Based on Vegetation Index and Florescence Spectral Information from UAV Hyperspectral Remote Sensing. Remote Sens. 2021, 13, 3390. [Google Scholar] [CrossRef]
- Traore, A.; Ata-Ul-Karim, S.T.; Duan, A.; Soothar, M.K.; Traore, S.; Zhao, B. Predicting Equivalent Water Thickness in Wheat Using UAV Mounted Multispectral Sensor through Deep Learning Techniques. Remote Sens. 2021, 13, 4476. [Google Scholar] [CrossRef]
- Ndlovu, H.S.; Odindi, J.; Sibanda, M.; Mutanga, O.; Clulow, A.; Chimonyo, V.G.; Mabhaudhi, T. A comparative estimation of maize leaf water content using machine learning techniques and unmanned aerial vehicle (UAV)-based proximal and remotely sensed data. Remote Sens. 2021, 13, 4091. [Google Scholar] [CrossRef]
- Pádua, L.; Matese, A.; Di Gennaro, S.F.; Morais, R.; Peres, E.; Sousa, J.J. Vineyard classification using OBIA on UAV-based RGB and multispectral data: A case study in different wine regions. Comput. Electron. Agric. 2022, 196, 106905. [Google Scholar] [CrossRef]
- Zhang, H.; Yang, W.; Yu, H.; Zhang, H.; Xia, G.S. Detecting power lines in UAV images with convolutional features and structured constraints. Remote Sens. 2019, 11, 1342. [Google Scholar] [CrossRef] [Green Version]
- Pastucha, E.; Puniach, E.; Ścisłowicz, A.; Ćwiąkała, P.; Niewiem, W.; Wiącek, P. 3d reconstruction of power lines using UAV images to monitor corridor clearance. Remote Sens. 2020, 12, 3698. [Google Scholar] [CrossRef]
- Tan, J.; Zhao, H.; Yang, R.; Liu, H.; Li, S.; Liu, J. An entropy-weighting method for efficient power-line feature evaluation and extraction from lidar point clouds. Remote Sens. 2021, 13, 3446. [Google Scholar] [CrossRef]
- Zhang, Y.; Yuan, X.; Li, W.; Chen, S. Automatic power line inspection using UAV images. Remote Sens. 2017, 9, 824. [Google Scholar] [CrossRef] [Green Version]
- Zhou, Y.; Xu, C.; Dai, Y.; Feng, X.; Ma, Y.; Li, Q. Dual-view stereovision-guided automatic inspection system for overhead transmission line corridor. Remote Sensing 2022, 14, 4095. [Google Scholar] [CrossRef]
- Ortega, S.; Trujillo, A.; Santana, J.M.; Suárez, J.P.; Santana, J. Characterization and modeling of power line corridor elements from LiDAR point clouds. ISPRS J. Photogramm. Remote Sens. 2019, 152, 24–33. [Google Scholar] [CrossRef]
- Zhao, Z.; Zhen, Z.; Zhang, L.; Qi, Y.; Kong, Y.; Zhang, K. Insulator detection method in inspection image based on improved faster R-CNN. Energies 2019, 12, 1204. [Google Scholar] [CrossRef] [Green Version]
- Girshick, R.; Donahue, J.; Darrell, T.; Malik, J. Rich feature hierarchies for accurate object detection and semantic segmentation. In Proceedings of the IEEE Conference on Computer Vision and Pattern Recognition, Columbus, OH, USA, 23–28 June 2014; pp. 580–587. [Google Scholar]
- Ma, Y.; Li, Q.; Chu, L.; Zhou, Y.; Xu, C. Real-time detection and spatial localization of insulators for UAV inspection based on binocular stereo vision. Remote Sens. 2021, 13, 230. [Google Scholar] [CrossRef]
- Liu, C.; Wu, Y.; Liu, J.; Han, J. MTI-YOLO: A light-weight and real-time deep neural network for insulator detection in complex aerial images. Energies 2021, 14, 1426. [Google Scholar] [CrossRef]
- Prates, R.M.; Cruz, R.; Marotta, A.P.; Ramos, R.P.; Simas Filho, E.F.; Cardoso, J.S. Insulator visual non-conformity detection in overhead power distribution lines using deep learning. Comput. Electr. Eng. 2019, 78, 343–355. [Google Scholar] [CrossRef]
- Wang, S.; Liu, Y.; Qing, Y.; Wang, C.; Lan, T.; Yao, R. Detection of insulator defects with improved ResNeSt and region proposal network. IEEE Access 2020, 8, 184841–184850. [Google Scholar] [CrossRef]
- Wen, Q.; Luo, Z.; Chen, R.; Yang, Y.; Li, G. Deep learning approaches on defect detection in high resolution aerial images of insulators. Sensors 2021, 21, 1033. [Google Scholar] [CrossRef]
- Chen, W.; Li, Y.; Zhao, Z. InsulatorGAN: A Transmission Line Insulator Detection Model Using Multi-Granularity Conditional Generative Adversarial Nets for UAV Inspection. Remote Sens. 2021, 13, 3971. [Google Scholar] [CrossRef]
- Mirza, M.; Osindero, S. Conditional generative adversarial nets. arXiv 2014, arXiv:1411.1784. [Google Scholar]
- Liu, Z.; Miao, X.; Xie, Z.; Jiang, H.; Chen, J. Power Tower Inspection Simultaneous Localization and Mapping: A Monocular Semantic Positioning Approach for UAV Transmission Tower Inspection. Sensors 2022, 22, 7360. [Google Scholar] [CrossRef]
- Bao, W.; Ren, Y.; Wang, N.; Hu, G.; Yang, X. Detection of Abnormal Vibration Dampers on Transmission Lines in UAV Remote Sensing Images with PMA-YOLO. Remote Sens. 2021, 13, 4134. [Google Scholar] [CrossRef]
- Bao, W.; Du, X.; Wang, N.; Yuan, M.; Yang, X. A Defect Detection Method Based on BC-YOLO for Transmission Line Components in UAV Remote Sensing Images. Remote Sens. 2022, 14, 5176. [Google Scholar] [CrossRef]
- Nex, F.; Duarte, D.; Steenbeek, A.; Kerle, N. Towards real-time building damage mapping with low-cost UAV solutions. Remote Sens. 2019, 11, 287. [Google Scholar] [CrossRef] [Green Version]
- Yeom, J.; Han, Y.; Chang, A.; Jung, J. Hurricane building damage assessment using post-disaster UAV data. In Proceedings of the IGARSS 2019—2019 IEEE International Geoscience and Remote Sensing Symposium, Yokohama, Japan, 28 July–2 August 2019; pp. 9867–9870. [Google Scholar]
- Wenzhuo, L.; Kaimin, S.; Chuan, X. Automatic 3D Building Change Detection Using UAV Images. In Proceedings of the IGARSS 2019—2019 IEEE International Geoscience and Remote Sensing Symposium, Yokohama, Japan, 28 July–2 August 2019; pp. 1574–1577. [Google Scholar]
- Wu, H.; Nie, G.; Fan, X. Classification of Building Structure Types Using UAV Optical Images. In Proceedings of the IGARSS 2020—2020 IEEE International Geoscience and Remote Sensing Symposium, Waikoloa, HI, USA, 26 September–2 October 2020; pp. 1193–1196. [Google Scholar]
- Zheng, L.; Ai, P.; Wu, Y. Building recognition of UAV remote sensing images by deep learning. In Proceedings of the IGARSS 2020—2020 IEEE International Geoscience and Remote Sensing Symposium, Waikoloa, HI, USA, 26 September–2 October 2020; pp. 1185–1188. [Google Scholar]
- Li, X.; Yang, J.; Li, Z.; Yang, F.; Chen, Y.; Ren, J.; Duan, Y. Building Damage Detection for Extreme Earthquake Disaster Area Location from Post-Event Uav Images Using Improved SSD. In Proceedings of the IGARSS 2022—2022 IEEE International Geoscience and Remote Sensing Symposium, Kuala Lumpur, Malaysia, 17–22 July 2022; pp. 2674–2677. [Google Scholar]
- Liu, W.; Anguelov, D.; Erhan, D.; Szegedy, C.; Reed, S.; Fu, C.Y.; Berg, A.C. SSD: Single shot multibox detector. In Proceedings of the Computer Vision–ECCV 2016: 14th European Conference, Amsterdam, The Netherlands, 11–14 October 2016; Proceedings, Part I 14. Springer: Cham, Switzerland, 2016; pp. 21–37. [Google Scholar]
- Woo, S.; Park, J.; Lee, J.Y.; Kweon, I.S. Cbam: Convolutional block attention module. In Proceedings of the European Conference on Computer Vision (ECCV), Munich, Germany, 8–14 September 2018; pp. 3–19. [Google Scholar]
- Shi, X.; Huang, H.; Pu, C.; Yang, Y.; Xue, J. CSA-UNet: Channel-Spatial Attention-Based Encoder–Decoder Network for Rural Blue-Roofed Building Extraction from UAV Imagery. IEEE Geosci. Remote Sens. Lett. 2022, 19, 1–5. [Google Scholar] [CrossRef]
- He, H.; Yu, J.; Cheng, P.; Wang, Y.; Zhu, Y.; Lin, T.; Dai, G. Automatic, Multiview, Coplanar Extraction for CityGML Building Model Texture Mapping. Remote Sens. 2021, 14, 50. [Google Scholar] [CrossRef]
- Laugier, E.J.; Casana, J. Integrating Satellite, UAV, and Ground-Based Remote Sensing in Archaeology: An Exploration of Pre-Modern Land Use in Northeastern Iraq. Remote Sens. 2021, 13, 5119. [Google Scholar] [CrossRef]
- Ammour, N.; Alhichri, H.; Bazi, Y.; Benjdira, B.; Alajlan, N.; Zuair, M. Deep learning approach for car detection in UAV imagery. Remote Sens. 2017, 9, 312. [Google Scholar] [CrossRef] [Green Version]
- Li, J.; Chen, S.; Zhang, F.; Li, E.; Yang, T.; Lu, Z. An adaptive framework for multi-vehicle ground speed estimation in airborne videos. Remote Sens. 2019, 11, 1241. [Google Scholar] [CrossRef] [Green Version]
- Zhang, Y.; Guo, L.; Wang, Z.; Yu, Y.; Liu, X.; Xu, F. Intelligent ship detection in remote sensing images based on multi-layer convolutional feature fusion. Remote Sens. 2020, 12, 3316. [Google Scholar] [CrossRef]
- Lubczonek, J.; Wlodarczyk-Sielicka, M.; Lacka, M.; Zaniewicz, G. Methodology for Developing a Combined Bathymetric and Topographic Surface Model Using Interpolation and Geodata Reduction Techniques. Remote Sens. 2021, 13, 4427. [Google Scholar] [CrossRef]
- Ioli, F.; Bianchi, A.; Cina, A.; De Michele, C.; Maschio, P.; Passoni, D.; Pinto, L. Mid-Term Monitoring of Glacier’s Variations with UAVs: The Example of the Belvedere Glacier. Remote Sens. 2021, 14, 28. [Google Scholar] [CrossRef]
- Nardin, W.; Taddia, Y.; Quitadamo, M.; Vona, I.; Corbau, C.; Franchi, G.; Staver, L.W.; Pellegrinelli, A. Seasonality and Characterization Mapping of Restored Tidal Marsh by NDVI Imageries Coupling UAVs and Multispectral Camera. Remote Sens. 2021, 13, 4207. [Google Scholar] [CrossRef]
- Kim, M.; Chung, O.S.; Lee, J.K. A Manual for Monitoring Wild Boars (Sus scrofa) Using Thermal Infrared Cameras Mounted on an Unmanned Aerial Vehicle (UAV). Remote Sens. 2021, 13, 4141. [Google Scholar] [CrossRef]
- Rančić, K.; Blagojević, B.; Bezdan, A.; Ivošević, B.; Tubić, B.; Vranešević, M.; Pejak, B.; Crnojević, V.; Marko, O. Animal Detection and Counting from UAV Images Using Convolutional Neural Networks. Drones 2023, 7, 179. [Google Scholar] [CrossRef]
- Ge, S.; Gu, H.; Su, W.; Praks, J.; Antropov, O. Improved semisupervised unet deep learning model for forest height mapping with satellite sar and optical data. IEEE J. Sel. Top. Appl. Earth Obs. Remote Sens. 2022, 15, 5776–5787. [Google Scholar] [CrossRef]
- Zhang, B.; Ye, H.; Lu, W.; Huang, W.; Wu, B.; Hao, Z.; Sun, H. A spatiotemporal change detection method for monitoring pine wilt disease in a complex landscape using high-resolution remote sensing imagery. Remote Sens. 2021, 13, 2083. [Google Scholar] [CrossRef]
- Barrile, V.; Simonetti, S.; Citroni, R.; Fotia, A.; Bilotta, G. Experimenting Agriculture 4.0 with Sensors: A Data Fusion Approach between Remote Sensing, UAVs and Self-Driving Tractors. Sensors 2022, 22, 7910. [Google Scholar] [CrossRef] [PubMed]
- Zheng, Q.; Huang, W.; Cui, X.; Shi, Y.; Liu, L. New spectral index for detecting wheat yellow rust using Sentinel-2 multispectral imagery. Sensors 2018, 18, 868. [Google Scholar] [CrossRef] [PubMed] [Green Version]
- Bohnenkamp, D.; Behmann, J.; Mahlein, A.K. In-field detection of yellow rust in wheat on the ground canopy and UAV scale. Remote Sens. 2019, 11, 2495. [Google Scholar] [CrossRef] [Green Version]
- Saeed, Z.; Yousaf, M.H.; Ahmed, R.; Velastin, S.A.; Viriri, S. On-Board Small-Scale Object Detection for Unmanned Aerial Vehicles (UAVs). Drones 2023, 7, 310. [Google Scholar] [CrossRef]
Figure 1.
Article organization and content diagram.

Figure 2.
UAV platforms and sensors.

Figure 3.
UAV platforms: (a) Multi-rotor UAV, (b) Fixed-wing UAV, (c) Unmanned Helicopter, (d) VTOL UAV.
Figure 3.
UAV platforms: (a) Multi-rotor UAV, (b) Fixed-wing UAV, (c) Unmanned Helicopter, (d) VTOL UAV.

Figure 4.
Sensors carried by UAVs: (a) RGB Camera, (b) Multi-spectral Camera, (c) Hyper-spectral Camera, (d) LIDAR.
Figure 4.
Sensors carried by UAVs: (a) RGB Camera, (b) Multi-spectral Camera, (c) Hyper-spectral Camera, (d) LIDAR.

Figure 5.
LIDAR: (a) Mechanical Scanning LIDAR, (b) Solid-state LIDAR.

Figure 6.
UAV remote sensing applications.

Figure 7.
UAV remote sensing research in forestry.

Figure 8.
Symptoms of pine wilt disease.

Figure 9.
UAV remote sensing research in precision agriculture.

Figure 10.
Symptoms of huanglongbing (HLB), also known as citrus green disease.

Figure 11.
Symptoms of grape disease.

Figure 12.
Symptoms of wheat yellow rust disease.

Figure 13.
UAV remote sensing research of power lines and accessories.

Figure 14.
Power lines and tower.

Figure 15.
Insulators on power lines.

Figure 16.
Shock absorbers on power lines.

Figure 17.
UAV remote sensing research on artificial facilities and natural environments.

Table 1.
Parameters of UAV multi-spectral cameras and several satellite multi-spectral sensors.
| Device Name | Multi-Spectral Bandwidth and Spatial Resolution | ||||||
|---|---|---|---|---|---|---|---|
| Blue | Green | Red | Red Edge | Near Infrared I | Spatial Resolution | ||
| Multi-spectral Camera of UAV | Parrot Sequoia+ | None | nm 1 | nm | nm | nm | 8 cm/pixel 2 |
| Rededge-MX | nm | nm | nm | nm | nm | 8 cm/pixel 2 | |
| Altum PT | nm | nm | nm | nm | nm | 2.5 cm/pixel 2 | |
| Sentera 6X | nm | nm | nm | nm | nm | 5.2 cm/pixel 2 | |
| DJI P4 Multi 3 | nm | nm | nm | nm | nm | ||
| Landsat-5 TM 4 | nm | nm | nm | None | nm | 30 m/pixel | |
| Multi-spectral Sensors on Satellites | Landsat-5 MSS 5 | None | nm | nm | None | nm | 60 m/pixel |
| Landsat-7 ETM+ 6 | nm | nm | nm | None | nm | 30 m/pixel | |
| Landsat-8 OLI 7 | nm | nm | nm | None | nm | 30 m/pixel | |
| IKONOS 8 | nm | nm | nm | None | nm | 3.28 m/pixel | |
| QuickBird 9 | nm | nm | nm | None | nm | 2.62 m/pixel | |
| WorldView-4 10 | nm | nm | nm | None | nm | 1.24 m/pixel | |
| Sentinel-2A 11 | nm | nm | nm | nm 12 | nm | 10 m/pixel | |
1 nm—nanometer. 2 Flight height at 120 m. 3 DJI Phantom 4 Multispectral Camera. 4 Landsat 4–5 Thematic Mapper. 5 Landsat 1–5 Multispectral Scanner. 6 Landsat 7 Enhanced Thematic Mapper Plus. 7 Landsat 8–9 Operational Land Imager. 8 IKONOS Multispectral Sensor. 9 QuickBird Multispectral Sensor. 10 WorldView-4 Multispectral Sensor. 11 Sentinel-2A Multispectral Sensor of Sentinel-2. 12 Sentinel-2A have 3 red-edge spectral band, with the spatial resolution 20 m/pixel.
Table 2.
Parameters of Hyper-spectral Cameras.
| Camera Name | Spectral Range | Spectral Bands | Spectral Sampling | FWHM 1 |
|---|---|---|---|---|
| Cubert S185 | 450∼950 nm | 125 bands | 4 nm | 8 nm |
| Headwall Nano-Hyperspec | 400∼1000 nm | 301 bands | 2 nm | 6 nm |
| RESONON PIKA L | 400∼1000 nm | 281 bands | 2.1 nm | 3.3 nm |
| RESONON PIKA XC2 | 400∼1000 nm | 447 bands | 1.3 nm | 1.9 nm |
| HySpex Mjolnir S-620 | 970∼2500 nm | 300 bands | 5.1 nm | unspecified |
1 FWHM–Full Width at Half Maximum of Spectral Resolution.
Disclaimer/Publisher’s Note: The statements, opinions and data contained in all publications are solely those of the individual author(s) and contributor(s) and not of MDPI and/or the editor(s). MDPI and/or the editor(s) disclaim responsibility for any injury to people or property resulting from any ideas, methods, instructions or products referred to in the content. |
© 2023 by the authors. Licensee MDPI, Basel, Switzerland. This article is an open access article distributed under the terms and conditions of the Creative Commons Attribution (CC BY) license (https://creativecommons.org/licenses/by/4.0/).
Share and Cite
MDPI and ACS Style
Zhang, Z.; Zhu, L. A Review on Unmanned Aerial Vehicle Remote Sensing: Platforms, Sensors, Data Processing Methods, and Applications. Drones 2023, 7, 398. https://doi.org/10.3390/drones7060398
AMA Style
Zhang Z, Zhu L. A Review on Unmanned Aerial Vehicle Remote Sensing: Platforms, Sensors, Data Processing Methods, and Applications. Drones. 2023; 7(6):398. https://doi.org/10.3390/drones7060398
Chicago/Turabian StyleZhang, Zhengxin, and Lixue Zhu. 2023. "A Review on Unmanned Aerial Vehicle Remote Sensing: Platforms, Sensors, Data Processing Methods, and Applications" Drones 7, no. 6: 398. https://doi.org/10.3390/drones7060398