
Digital Twin Development for the Airspace of the Future


School of Aerospace, Transport and Manufacturing, Cranfield University, Cranfield MK43 0AL, UK
*
Author to whom correspondence should be addressed.
Drones 2023, 7(7), 484; https://doi.org/10.3390/drones7070484
Submission received: 13 June 2023
/
Revised: 14 July 2023
/
Accepted: 18 July 2023
/
Published: 23 July 2023
(This article belongs to the Section Drone Communications)
Abstract
:The UK aviation industry is committed to achieving net zero emissions by 2050 through sustainable measures and one of the key aspects of this effort is the implementation of Unmanned Traffic Management (UTM) systems. These UTM systems play a crucial role in enabling the safe and efficient integration of unmanned aerial vehicles (UAVs) into the airspace. As part of the Airspace of the Future (AoF) project, the development and implementation of UTM services have been prioritised. This paper aims to create an environment where routine drone services can operate safely and effectively. To facilitate this, a digital twin of the National Beyond Visual Line of Sight Experimentation Corridor has been created. This digital twin serves as a virtual replica of the corridor and allows for the synthetic testing of unmanned traffic management concepts. The implementation of the digital twin involves both simulated and hybrid flights with real drones. Simulated flights allow for the testing and refinement of UTM services in a controlled environment. Hybrid flights, on the other hand, involve the integration of real drones into the airspace to assess their performance and compatibility with the UTM systems. By leveraging the capabilities of UTM systems and utilising the digital twin for testing, the AoF project aims to advance the development of safer and more efficient drone operations. The Experimentation Corridor has been developed to simulate and test concepts related to managing unmanned traffic. The paper provides a detailed account of the implementation of the digital twin for the AoF project, including simulated and hybrid flights involving real drones.
1. Introduction
The aerospace industry has always been at the forefront of innovation, pushing the boundaries of human exploration and technological advancement. As we embark on the journey towards the future, a new concept known as “digital twins” is poised to revolutionise the aerospace landscape [1]. Digital twins, virtual replicas of physical assets, have the potential to transform how we design, build and operate aerospace systems [2]. By integrating real-time data from sensors installed on physical assets, digital twins can monitor equipment health, predict maintenance needs and proactively address potential issues [3]. This predictive maintenance approach minimises downtime, improves safety and maximises the lifespan of aerospace systems.
Cities are ill-prepared for the integration of UAM (Urban Air Mobility) into their existing transportation infrastructure, which presents a significant challenge. UAM has the capacity to revolutionise a city economy, generate employment opportunities, reduce emissions compared to conventional road vehicles and aircraft and lower infrastructure costs [4,5]. It heralds the beginning of a new era of multimodal transportation. While UAM has been considered a luxury mode of transport since the pandemic, AAM (Advanced Air Mobility) may play a crucial role in the efficient transport of time-sensitive cargo, including vital medical supplies, manufacturing equipment and other packages where saving 30 min to an hour or more justifies the use of airborne vehicles [6]. The focus of the study was specifically on the application of UAM and air taxis within an urban setting [7]. In [8], the authors explore the application of 3D GIS environments for Advanced Air Mobility route planning operations, demonstrating the role of data analytics in decision-making by visually representing key influential factors. Ref. [9] propose an innovative method for modelling future Urban Air Mobility (UAM) for Middle-Mile Delivery (MMD) using Systems-of-Systems (SoS) methodologies and real-world datasets, presenting a framework that allows for analysis of resources, operations, policies and economics involved in the operation of future UAM fleets for MMD. However, their research lacks empirical validation in real-world contexts, signifying a need for future studies that apply and test these models in diverse locations and scenarios. A comprehensive review of the advancements, standards and regulations related to major unmanned aircraft systems can be found in [10], evaluating the specific technologies required for urban air mobility and exploring operational scenarios based on lessons learnt from remotely piloted aviation and novel unmanned traffic management systems.
While the advent of Urban Air Mobility (UAM) and Advanced Air Mobility (AAM) paints a promising picture for the future of transportation, it concurrently introduces new complexities in air traffic management. Unmanned Traffic Management (UTM) systems are emerging as an essential solution to manage and control the growing traffic in low-altitude airspace, particularly in urban environments [11,12,13]. UTM systems are designed to integrate manned and unmanned aircraft operations in the same airspace, enhancing safety and efficiency while ensuring minimal human intervention [14,15]. The adoption and success of UAM and AAM highly depend on effective UTM systems that can dynamically adapt to diverse and high-density traffic scenarios while ensuring safety, security and regulatory compliance. As we dive deeper into this new era of aviation, it becomes increasingly crucial to develop sophisticated UTM systems that can fully unlock the potential of UAM and AAM [16,17,18].
In this context, the AoF project holds the potential to advance UAM initiatives by offering a detailed case study and a framework for cities to address the challenges associated with UAM and UTM implementation [19]. The vision for the Airspace of the Future (AoF) project is to enable routine operational drone services in a safe coordinated environment on a regional and national basis in cognisance of realistic end user requirements; validated by robust business cases, simulation, stakeholder and public engagement; underpinned by an integrated transportation model with aviation at its core and an exploitation roadmap for the UK [20]. The Airspace of the Future study encompasses a wide range of interconnected domains, including the development and compliance of regulatory frameworks, enabling technologies and tool-sets such as digital twins and simulation. Additionally, it also addresses crucial societal concerns such as the validation of public acceptance of commercial drone operations. The key objectives are:
- Develop the rules, system of systems and operational safety cases to allow mixed use airspace by manned and unmanned traffic.
- Establish a national test and evaluation facility for commercial unmanned vehicles with representative operational environments which are digitally trusted and secure.
- Develop customer use cases for large-scale virtual and live demonstration in an expanded and open access environment.
- Develop a blueprint for the future national airspace structures and ground infrastructure.
- Develop a virtual experimentation environment and digital twins to test new rules, processes, systems, technology and operating concepts rapidly at scale.
A digital twin is the virtual copy or model of any physical entity (physical twin) both of which are interconnected via exchange of data in real time [21]. Digital twin technology saw its origins in the aerospace industry and it is expected to revolutionise other industries [22]. The digital twins trend is gaining momentum thanks to rapidly evolving simulation and modelling capabilities, better interoperability and IoT sensors and more availability of tools and computing infrastructure. As a result, capabilities of digital twins are more accessible to organisations across industries [23,24]. UAV digital twin technology holds immense potential in areas like real-time infrastructure monitoring, precision agriculture, smart city construction and intelligent security [25]. The digital twin concept of UAV on-board systems consists of several subsystems, including communication, navigation, surveillance, DAA (Detect And Avoid), geofencing and the autopilot [26]. The communication subsystem enables the transmission of data to and from the Unmanned Aircraft (UA), including direct communication with the Remote Pilot Station (RPS) and, in some cases, communication with the U-space service provider [27]. Navigation involves measuring or estimating the state vector of the aircraft and is integrated into the Flight Management System (FMS) within the Remotely Piloted Air Systems (RPASs) on-board system architecture [28]. The FMS also handles waypoint management, guidance priority, envelope protection and emergency procedures. The surveillance subsystem enables the transmission of the identification and position of the UAV. Geofencing involves on-board management of constraints and utilises DAA to ensure that the specified areas are not violated [26].
Existing literature presents the advances in UAV, UTM and UAM digital twin technologies. Ref. [29] introduce a simulation environment and digital twin support for shared drone infrastructure in smart cities. This system allows comprehensive pre-deployment testing and real-time malfunction detection, addressing safety and privacy concerns. While the research offers a simulation environment and digital twin support for shared drone infrastructure, the system lacks integration with U-space services, an essential aspect for managing drone flights effectively and efficiently. Ref. [30] focus on developing an early-stage digital twin framework for ground-to-air emissions using small unmanned aircraft systems, highlighting the need for environmental sensing and efficient plume behaviour replication. Ref. [31] present a comprehensive review on recent developments in Internet of Drones (IoDs), emphasising the potential of machine learning and deep learning algorithms to enhance IoD functionalities, including navigation, battery scheduling, object tracking, collision avoidance and security. They also identify existing challenges and areas for future research. However the research falls short of providing a practical demonstration of a digital twin implementation that could have helped to validate these theoretical concepts. Ref. [32] propose the concept of a digital twin city as a transformative solution for smart cities. Their study examines characteristics, key technologies, application scenarios, theories and research directions associated with digital twin cities, aiming to tackle challenges of urban governance due to global warming, population growth and resource depletion. Nevertheless the paper does not address the complexity and practical challenges involved in creating and validating a high-fidelity digital twin of an entire city. Ref. [33] combine spatial digital twins with a convolutional neural network algorithm to investigate the airspace structure and safety performance of UAV systems. Their study indicates that this approach can improve safety performance, decrease packet loss rates and enhance network availability, providing valuable insights for future UAV applications. Nevertheless, the limited scope of this research in evaluating parameters presents a shortcoming, underscoring the need for future work to consider a wider array of parameters integral to UAV network operations. Ref. [34] develop a digital twin to analyse and optimise vertiport capacity management in electric air mobility networks, underscoring the significance of network design and maintenance policies in enhancing service provision, passenger satisfaction and asset utilisation. Despite this, the paper falls short in demonstrating how the model can interact in real-time with physical drones and other elements of a UTM system, thereby limiting its practical utility. Furthermore, the research heavily relies on an idealised simulation and lacks real-world empirical validation, thereby restricting the generalisability of the findings to actual, on-the-ground air mobility networks. Ref. [35] presents a digital twin model for designing and developing Urban Air Mobility (UAM)/UTM applications, such as vertiport location problems, airspace and air vehicle management. The paper discusses a digital twin of a case study for a 3D Urban Air Mobility Network. The authors noted that the data used for the model was limited and lacked validation, which could affect the accuracy and completeness of the model.
Building on this, our research develops an Airspace of the Future (AoF) digital twin for the National Beyond Visual Line of Sight (NBEC) Experimentation Corridor [36]. The digital twin represents the airspace realistically, incorporating elements such as terrain and buildings and facilitates drone flight simulations to identify potential issues and optimise flight plans. Additionally, the digital twin acts as a tool for comprehensive synthetic testing and Live Virtual Constructive (LVC) testing when integrated with live components, providing a secure and safe platform for UTM concept evaluation [37].
The paper highlights two main contributions. The first contribution is the detailed design and successful implementation of the Digital Twin for the Airspace of the Future (AoF) project. This digital twin not only emulates the physical characteristics of the airspace, including terrain and built environments, but it also simulates drone flights within this realistically represented environment. Through these simulations, potential issues such as collision risks, optimal flight paths and environmental factors can be proactively identified and mitigated. This comprehensive modelling and proactive problem-solving can lead to safer and more efficient flight plans, greatly improving the operational safety and efficiency of drones.
The second contribution of this research is the practical validation of the AoF Digital Twin through extensive flight trials, encompassing both simulated and real-world drone operations. These trials demonstrated the effectiveness of U-space services in securely and efficiently managing drone flights. They provided insights into the impact of increasing flight submissions on acceptance rates, the need for alternative deconfliction strategies, optimising airspace utilisation, implementing safety measures during takeoff and landing, balancing safety and efficiency and improving data management for high traffic loads. These findings highlight key areas for improvement in drone operations.
Consequently, the AoF Digital Twin serves as a reliable and effective tool for securely and efficiently managing drone flights. It provides real-time monitoring, risk detection and route optimisation, enabling users to enhance safety and maximise operational efficiency. The users can confidently manage their drone operations with improved effectiveness.
In Section 2, the concept of the AoF Digital Twin is presented. Section 3 describes the digital twin design. In Section 4, the proposed use cases are summarised. Flight trials were performed for the digital twin, some of the results are presented in Section 5 and the results are analysed. Finally some conclusions are drawn.
2. Airspace of the Future Digital Twin
The Airspace of the Future Digital Twin creates an environment that closely resembles reality, providing a reliable platform to operate a diverse range of commercial drone and air mobility vehicles [33]. The objective is to develop simulation and testing tools that can serve both fully synthetic and LVC testing, effectively combining virtual and real-world elements.
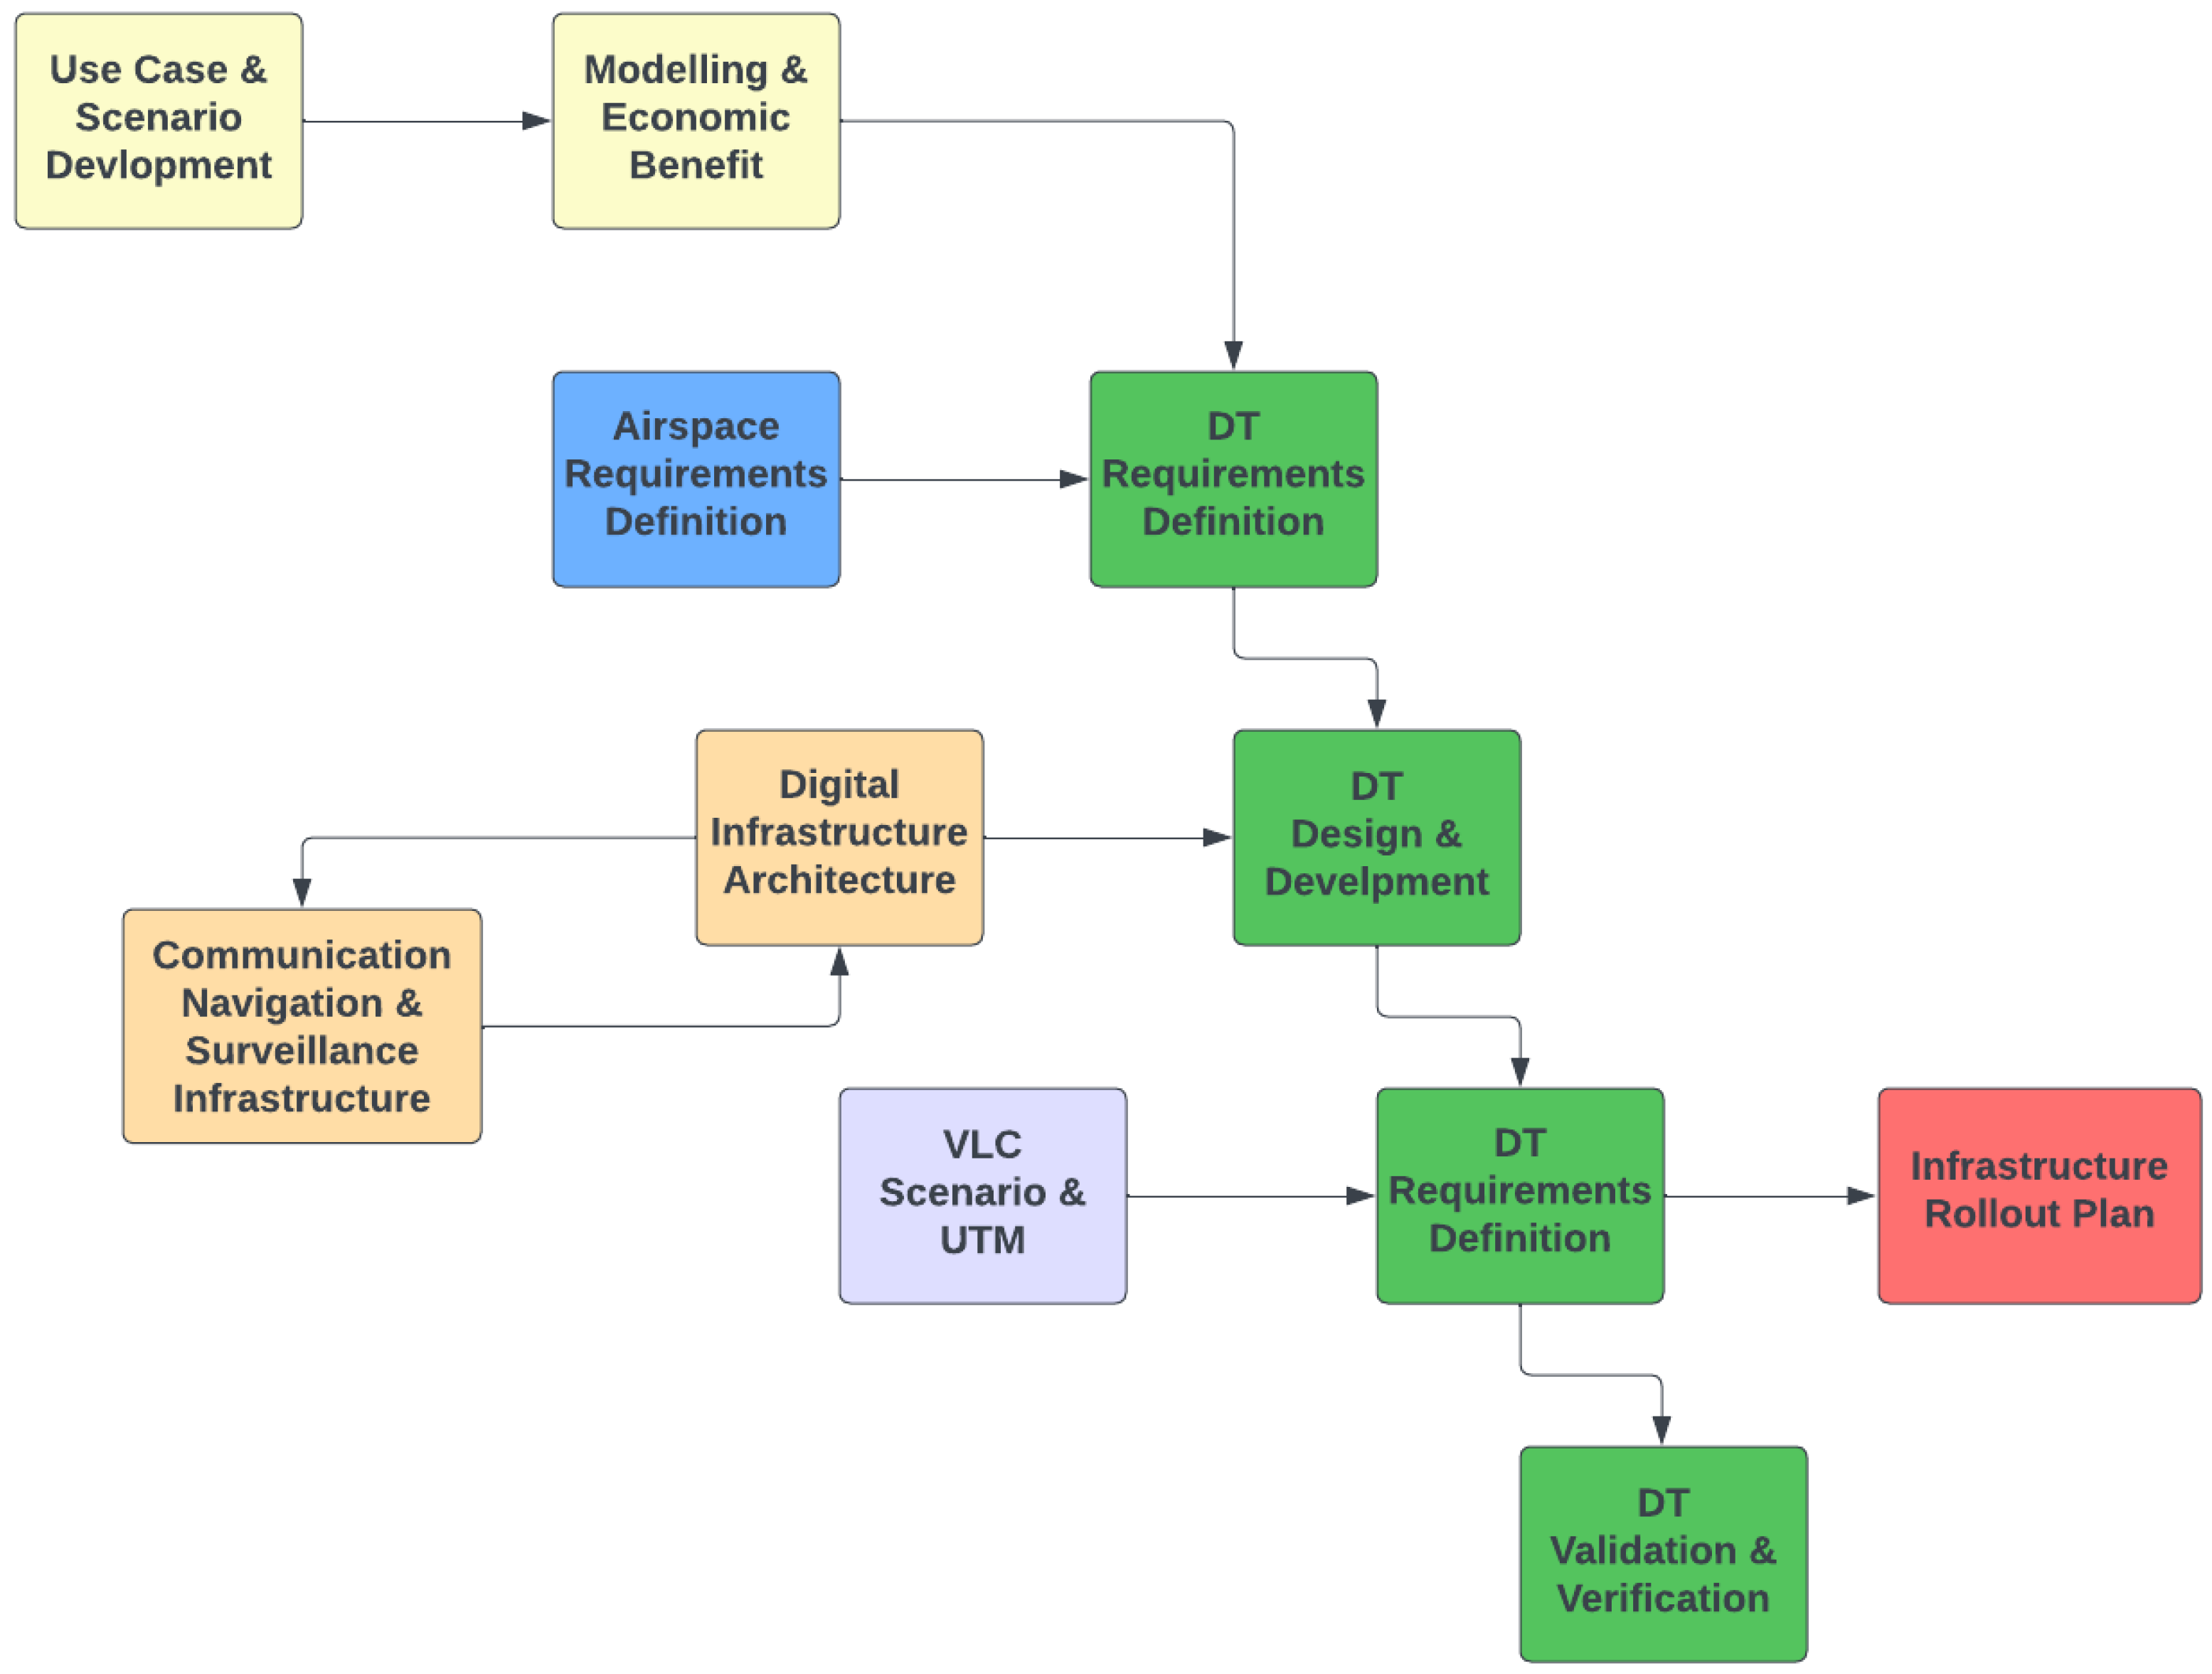
The development of the digital twin involved four steps (See Figure 1):
- Requirements definition: Requirements definition involves identifying key features, such as purpose, scope, data sources, accuracy, simulation, analysis capabilities and performance metrics, that must be captured and replicated in the digital twin.
- Design and development: Design and development of the digital twin involves creating a virtual replica of the physical object. This process requires the integration of various technologies, sensors and data analytics. The design phase focuses on identifying the key features to be replicated and selecting appropriate technologies. During the development phase, the virtual model is created and the necessary data sources are integrated.
- Use case simulation development: Use case development involves creating virtual scenarios that mimic real-world situations to evaluate systems or processes. These simulations are used to analyse performance, identify issues and improve strategies. The process involves creating a model, identifying key variables and inputs and running simulations to evaluate outcomes and measure performance.
- Verification and validation: Verification and validation are crucial steps in the development and implementation of a digital twin. Verification ensures that the digital twin accurately represents the physical system, while validation ensures that the digital twin can be used to make reliable predictions and decisions. The process involves comparing the output of the digital twin to real-world data and performance metrics to ensure that it operates correctly and produces accurate results. Verification and validation also help identify any errors or inaccuracies in the design of the digital twin, allowing for improvements to be made before it is put into use.
The focus of the Digital Twin is on the down-selected use cases. It creates an instance of the Enterprise Architecture and replicates interactions between users, such as Mission Planners, Operators, Remote Pilots, UTM Traffic Control Operators and Air Traffic Controllers and various systems that make up the drone operation ecosystem. When defining requirements for Airspace Management, it is essential to consider how RPAS integrate into the existing aviation system, future digital infrastructure and rules of the air. These considerations are crucial to ensure the safety of manned aviation operations within UK airspace [38].
The design of the digital twin consists in the development and integration of the main components of the simulation environment and digital twin [39,40]. The AoF Digital Twin includes simulated models and interfaces with real systems covering the following:
- The enterprise architecture
- The various data threads
- System analysis tools
- Interface with ground infrastructure (holographic radar, communications, UTM, mission planning)
- Representative computer-generated models (e.g., drones, manned aviation traffic)
- Representative natural environment models (e.g., extended NBEC 3D model, weather model)
- Interface with UTM systems, in order to, e.g., feed synthetic entities into UTM
- Surveillance API
- Receive data and instructions from UTM (Strategic Conflict Resolution Service and Tactical Conflict Resolution Service)
In the following is presented the design and development process of the Digital Twin.
3. Digital Twin Design and Development
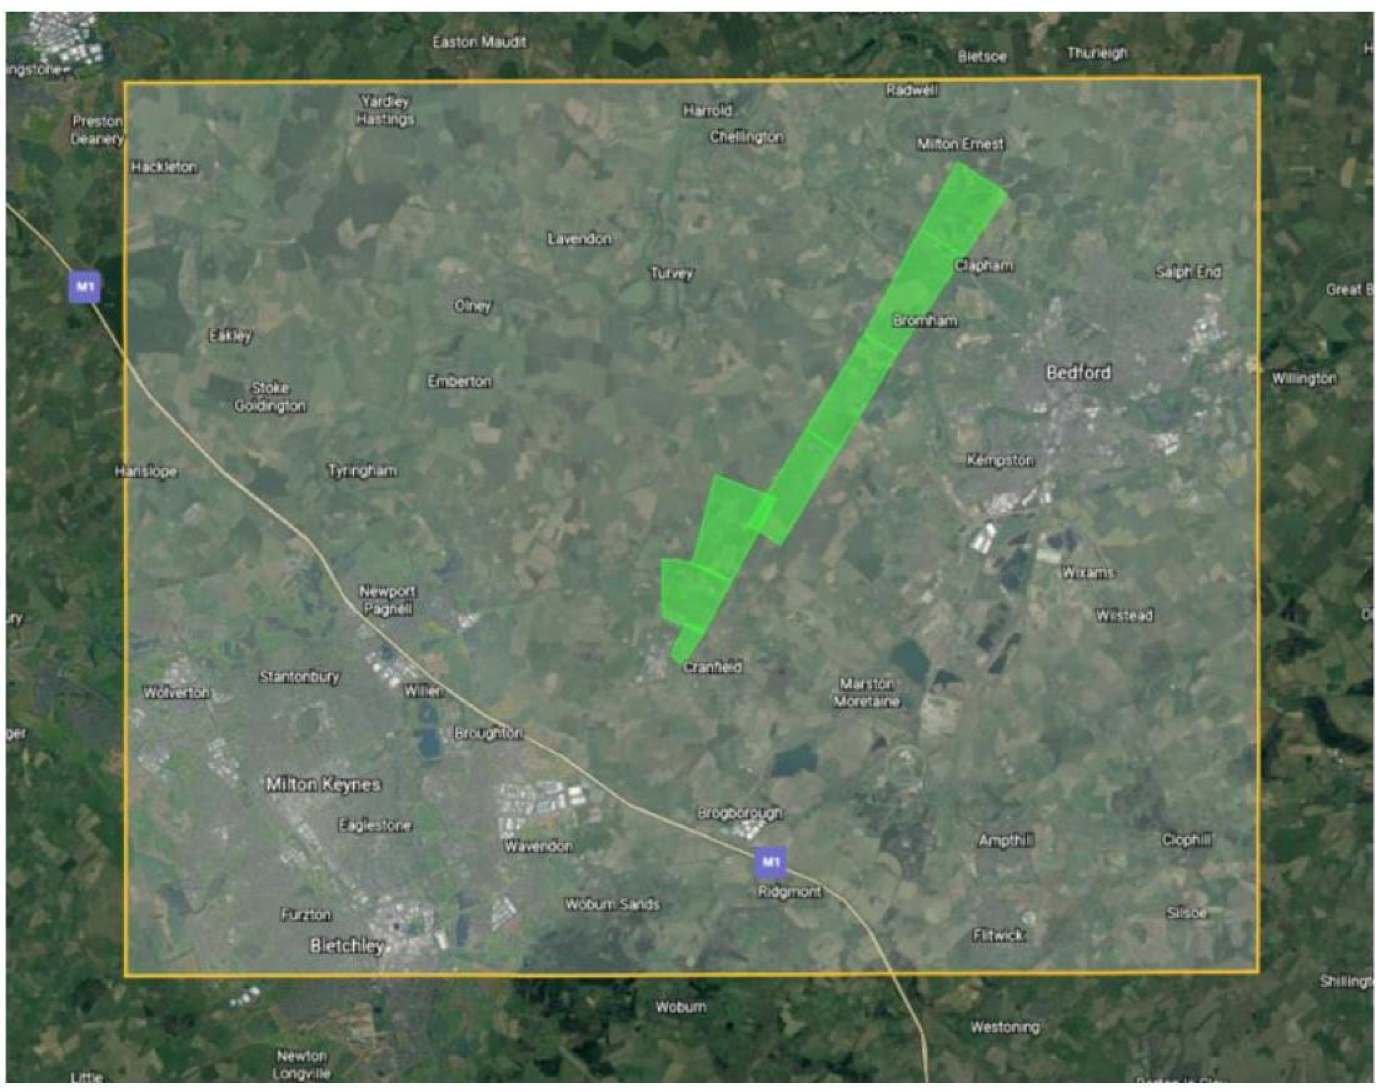
The AoF Digital Twin represents the geographical Area of Interest displayed in Figure 2. This geographical area has been selected as it offers a varied and representative range of features. It includes the UK National BVLOS Experimentation Corridor (NBEC) and large urban areas, including Milton Keynes and Bedford, with key features such as hospitals and business parks. The NBEC is shown in Figure 1 within the bordered AoI in green and is active between . and . above ground level. The area also includes large rural areas with several villages, fields, woodlands and nature reserves. Key infrastructure such as motorways, A-roads, railways and power lines are also comprised in the selected region. This geographical area is big enough (approximately ) to accommodate testing of the representative use cases in the Synthetic Environment.
In addition, as it contains the NBEC, it was possible to perform Live Virtual Constructive testing by linking a real asset to the Digital Twin.
In the following is described the design of the Digital twin.
3.1. Architecture of the Digital Twin
The Digital Twin represents the Area of Interest (AoI), alongside features relevant to the studies and research elements of this research. There are several layers involved in creating a comprehensive Digital Twin (Figure 3). These layers include the terrain, infrastructure, weather, airspace and both unmanned and manned aviation. Each of these layers plays a crucial role in replicating the real-world environment and interactions that the digital twin is designed to simulate.
3.1.1. Functional Architecture
The functional architecture diagram of the Digital Twin (Figure 4) highlights several essential components that are necessary to create a realistic representation of different environments and conditions. It is composed of the Synthetic Environment, the real world system and the data thread.
The Synthetic Environment
The Synthetic Environment is a crucial tool for simulating and testing complex scenarios in the context of drone operations [41]. It is made up of various components that work together to provide a realistic representation of different environments and conditions:
- The operation station is the central control centre of the Synthetic Environment, allowing users to manage and control the various components of the system.
- The visualisation system is another critical component that provides users with a graphical representation of the simulated environment, including terrain, objects and weather.
- The weather simulation and terrain data modules provide accurate and detailed information about different weather conditions and terrains, enabling users to test and validate the behaviour of drones under various environmental scenarios.
- The communications simulation module is also essential, allowing users to test and validate the communication capabilities of drones and other objects in different scenarios.
- The computer-generated models module enables users to create and customise drone models, which can be used for testing and validation purposes.
- The UAV, also known as a remotely piloted aircraft (RPA), is an aircraft that is controlled via remote control equipment or equipped with an autonomous flight system. It serves as the core component of an unmanned aircraft system, which is an integrated system connecting the UAV to a ground station through a communication data link [42].
Additionally, the system utilises other elements, such as related personnel and incorporates concepts like fusion airspace and isolation airspace theory, to assist in task execution and management [33].
The Real-World Systems
In addition to the Synthetic Environment, the Digital Twin also includes real-world systems and data. The real-world elements integrated into the Digital Twin include holographic radar, Automatic Dependent Surveillance-Broadcast ( ADS-B) [43], UTM, mission planning, real drones and Air Traffic Management (ATM). These components allow users to test and validate the Synthetic Environment under real-world conditions, ensuring that it behaves as expected when interacting with real-world systems.
The holographic radar system provides users with a detailed representation of the environment, allowing them to detect and avoid potential obstacles and hazards.
The Data Thread
The data thread enables the collection, transmission and storage of data from the real-world systems, which can then be used to inform and update the Synthetic Environment.
3.1.2. Logical Architecture
The Digital Twin system incorporates a set of nodes that are defined in the Airspace of the Future architecture (Figure 5). These nodes include UTM Service Providers, Drone Service Providers, Drones, Other Airspace Users and the ATM. These nodes work together to provide a holistic view of the drone and UTM ecosystem. The UTM Service Providers node is responsible for managing and coordinating the various UTM services that are required to ensure safe and efficient drone operations. This includes services such as airspace management, flight planning and traffic flow management. The Drone Service Providers node represents the various entities that provide drone-related services, including manufacturers, operators and maintenance providers. The Drones node represents the drones themselves, including their hardware, software and sensors. The Other Airspace Users node represents the other entities that may operate in the same airspace as drones, including piloted aircraft, helicopters and other aerial vehicles.
The Airspace Traffic Manager node represents the human operators who are responsible for managing and controlling manned aviation traffic in the airspace. This node is essential for ensuring that drone operations do not interfere with manned aviation and that both types of traffic can coexist safely and efficiently.
3.1.3. The Simulation Framework
The Simulation of the Digital Twin system is a comprehensive platform that aims to provide an accurate and realistic representation of the drone and UTM ecosystem.
For the various components to be integrated and exchange and share data as efficiently as possible, the Digital Twin uses existing standards including the Distributed Interactive Simulation (DIS) [44] and High-Level Architecture (HLA) [45] standards to provide interoperability between the various components. The simulation components deployed on two different sites. The one running at Cranfield are integrated into one HLA federation. The components running on the Blue Bear [46] facilities run on a DIS infrastructure. The two distinct environments are connected together. Translation of objects and attributes between the two is performed via an HLA/DIS Adapter component. In addition to the HLA and DIS simulation environments, a Kafka network [47] is used to channel real-time data feeds into the Digital Twin. This open-source event streaming platform offers a reliable and persistent storage system for streams of events through its publish/subscribe event bus called the Kafka broker. The Digital Twin leverages the Kafka network to receive weather information streams, such as those provided by MetOffice [48] and StormGlass [49]. A visual specific interface using the Common Image Generator Interface (CIGI) [50] is also used to connect the 3D Visualisation component to the HLA Simulation Framework. The CIGI is an interface designed to promote a standard way for a host device to communicate with an image generator (IG) in the simulation industry. CIGI facilitates plug-and-play integration of image generator vendors who comply with the standard, resulting in cost savings during visual system upgrades.
3.1.4. The Geographical Area of Interest
The Area of Interest is represented in different components integrated in the Digital Twin. These include 3D Visualisation and 2D Visualisation. Some existing components reuse their current representation of the terrain, often in a map format. For these existing components, there is no requirement to correlate and align the data source. It is accepted that small discrepancies might exist between the different components. Figure 6 illustrates this.
UTM System
The UTM system is composed of GuardianUTM designed by Altitude Angel [51] and Thales Topsky [52]. The Digital Twin and its components support testing of operations including pre-flight, in-flight and post-flight operations. Under this research, GuardianUTM and Thales Topsky are not part of the Digital Twin but contribute to it. The Digital Twin provides data/consumes data as such; it is treated as a normal user.
3.1.5. Digital Twin Systems
The Digital Twin systems include 3D Visualisation, Infrastructure (Communication, Navigation, Surveillance), Weather and Atmosphere, Airborne Assets, Simulated Ground Control Station, User Interface, Control Station and Operator Interface.
3D Visualisation System
The 3D Visualisation component provides a 3D view of the environment and the entities, virtual and real, that operate in this environment (Figure 7). As a user interface, the 3D Visualisation component does not include any simulation capabilities and simply provides a view of activities within the Digital Twin. The 3D Visualisation component is based on the Unity game engine [53] and employs a database, including terrain, imagery and buildings. The Unity game engine provided an interface for users to view the trial area and the UAVs in 3D. It should be mentioned that it was not used to model the simulation physics of the UAVs.
Infrastructure
The infrastructure layer of the Digital Twin is concerned with the representation of the physical and digital infrastructure elements of the drone ecosystem. The necessary infrastructure falls into three main categories: communication, navigation and surveillance.
Communication Infrastructure
The objective of the communication simulation is to accurately depict the various communication methods employed to establish connections between different systems and assets within the Digital Twin. The simulation encompasses several communication technologies such as 4G, 5G, SATCOM, Wide Area Network and C2 Link. When simulating cellular communication, it is essential to not only represent potential obstacles but also incorporate the locations of mobile base stations to ensure a realistic simulation of the communication system. The NETSIM Software is utilised to simulate the communication system [54]. The masts data were sourced from the Mastdata data base [55] and were implemented using NetSim GUI (Figure 8).
In the context of the communication simulation, 4G technology plays a vital role in representing one of the communication methods used within the Digital Twin. The 4G networks provide high-speed data transmission, enabling efficient connectivity between different systems and assets. As part of the simulation, the characteristics and capabilities of 4G technology are modeled to accurately depict its performance within the Digital Twin. This includes simulating factors such as data transfer rates, signal strength and network coverage. By incorporating 4G technology into the communication simulation, the Digital Twin can emulate real-world scenarios where 4G networks are utilised for seamless communication and data exchange between various components. This facilitates a comprehensive understanding of how the systems and assets interact and communicate with each other in a simulated environment. Through the utilisation of the NETSIM Software, the communication simulation can effectively simulate the behaviour and functionality of 4G technology, along with other communication technologies, to create a realistic representation of the communication infrastructure within the Digital Twin.
Surveillance Infrastructure
The surveillance technologies include ground-based radars and electronic conspicuity.
Radar Surveillance
The Radar Surveillance simulation (Figure 9) generates a simple simulation of a network of ground-based radars. As for the GNSS simulation, the Radar Simulation component generates radar tracks from ground truth positions from the HLA Simulation Framework. The radar tracks are transmitted to the UTM platform(s) as sensor inputs. A simulated radar server translates the radar tracks into UTM API data.
Radar Server GNSS Surveillance
The GNSS data generated by the GNSS Simulation component are used to transmit 464 surveillance data to the UTM platform(s) (Figure 10). The GNSS data are transmitted to the UTM platform(s) as sensor inputs and simulate the Remote ID and Tracking functions as part of the electronic conspicuity systems.
Weather and Atmosphere
The weather layer in the Digital Twin focuses on modeling the atmosphere and weather and their effects on the various systems. The weather and atmosphere definitions are generated from live data and transported through the HLA Simulation Framework. They are then translated into a DIS PDU (Protocol Data Unit) and transmitted to the Synthetic Environment to affect the simulated systems.
Airborne Assets
The Digital Twin represents manned and unmanned airborne assets in the AoI. The 2D and 3D asset representations are of generic aircraft models matching the aircraft type of asset, irrespective of whether the asset is unmanned (generic quadcopter, fixed-wing UAV) or manned (light aircraft, commercial jet, microlight, helicopter) with associated symbology (Figure 11).
There are two categories of simulated assets: UAVs and manned aircraft:
- UAVs are used to perform the virtual operations as part of the virtual trials.
- Manned aircraft can also be generated to simulate manned traffic in more complicated scenarios.
Simulated Ground Control Station
A simulated Ground Control Station (GCS) allows the user to play the roles of UAS Operator and UAS Pilot. The GCS consists of two main functions. First, it allows the user to define, modify and submit missions. This is the mission-planning aspect of the GCS. The GCS interfaces with a UTM platform to submit the missions and obtain approval for flights. In addition, the GCS sends command and control messages to the simulated UAS. This is the control aspect of the GCS. The main interaction with the simulation is through a map centric user interface. The simulated GCS has been built to allow the user to role play several UAS Operators and Pilots. The user can generate scenarios made of multiple independent missions. Template missions can be generated and stored and reused in various scenarios at a later date.
User Interface
The user interface permits the operation of the Synthetic Environment. It allows the user to:
- Edit and create different scenarios based on real-time and synthetic datasets via a dashboard;
- Conduct scenario analysis during a mission and after a scenario has concluded, allowing investigations of asset and environment in real-time and after the fact;
- Switch between 2D and 3D views of the AoI, allowing the different perspectives of scenarios when conducting analyses;
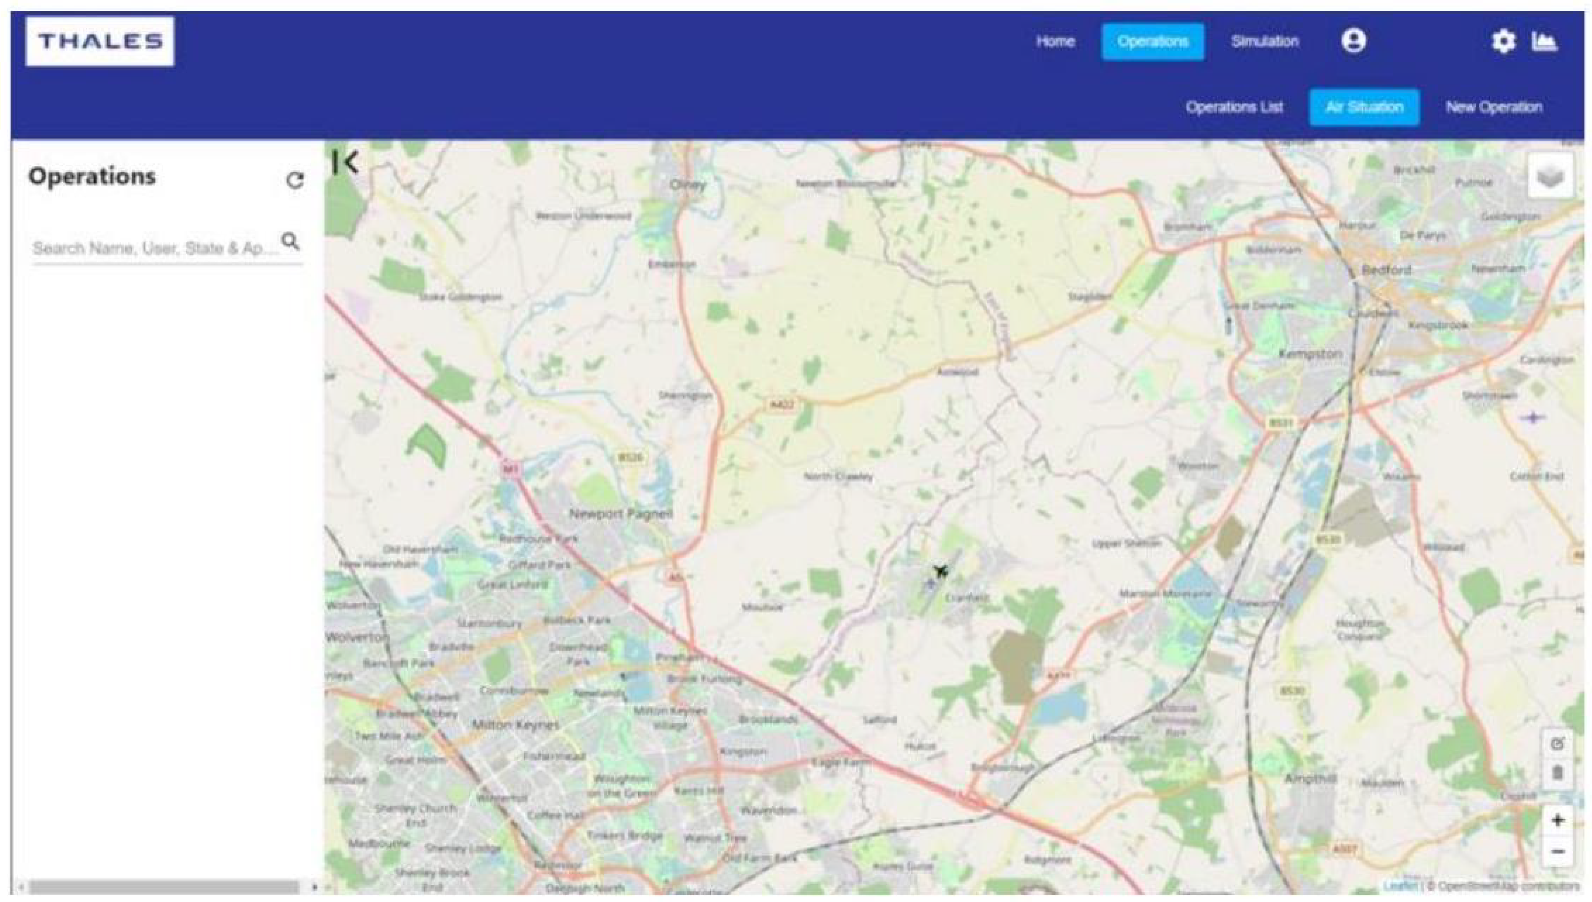
- Input synthetic assets into a scenario. The 3D Visualisation component generates a 3D view of the Digital Twin Area of Interest (Figure 12). It is used as a situational awareness tool that provides the Digital User and observers with an up-to-date view of the state of the environment, including the real and virtual entities operating in the environment.
Control Station
The Control Station allows the Operator to control and manage some of the Synthetic Environment features (Figure 13). It is accessed via an Angular Front end and offers a 2D view of the Digital Twin.
Operator Interface
The Operator Interface is a User Interface that the Digital Twin user can use to simulate the actions of a UAS Operator (Figure 14). It is accessed via an Angular Frontend and allows the user to create, modify and submit flight plans to the UTM platform(s). There is one Operator Interface per UTM platform to simulate the separate UAS Operator groups using the different UTMs. The flight plans created on the Operator Interface are used by the simulated Ground Control Station to generate and control the virtual UAS flights.
3.2. Airspace
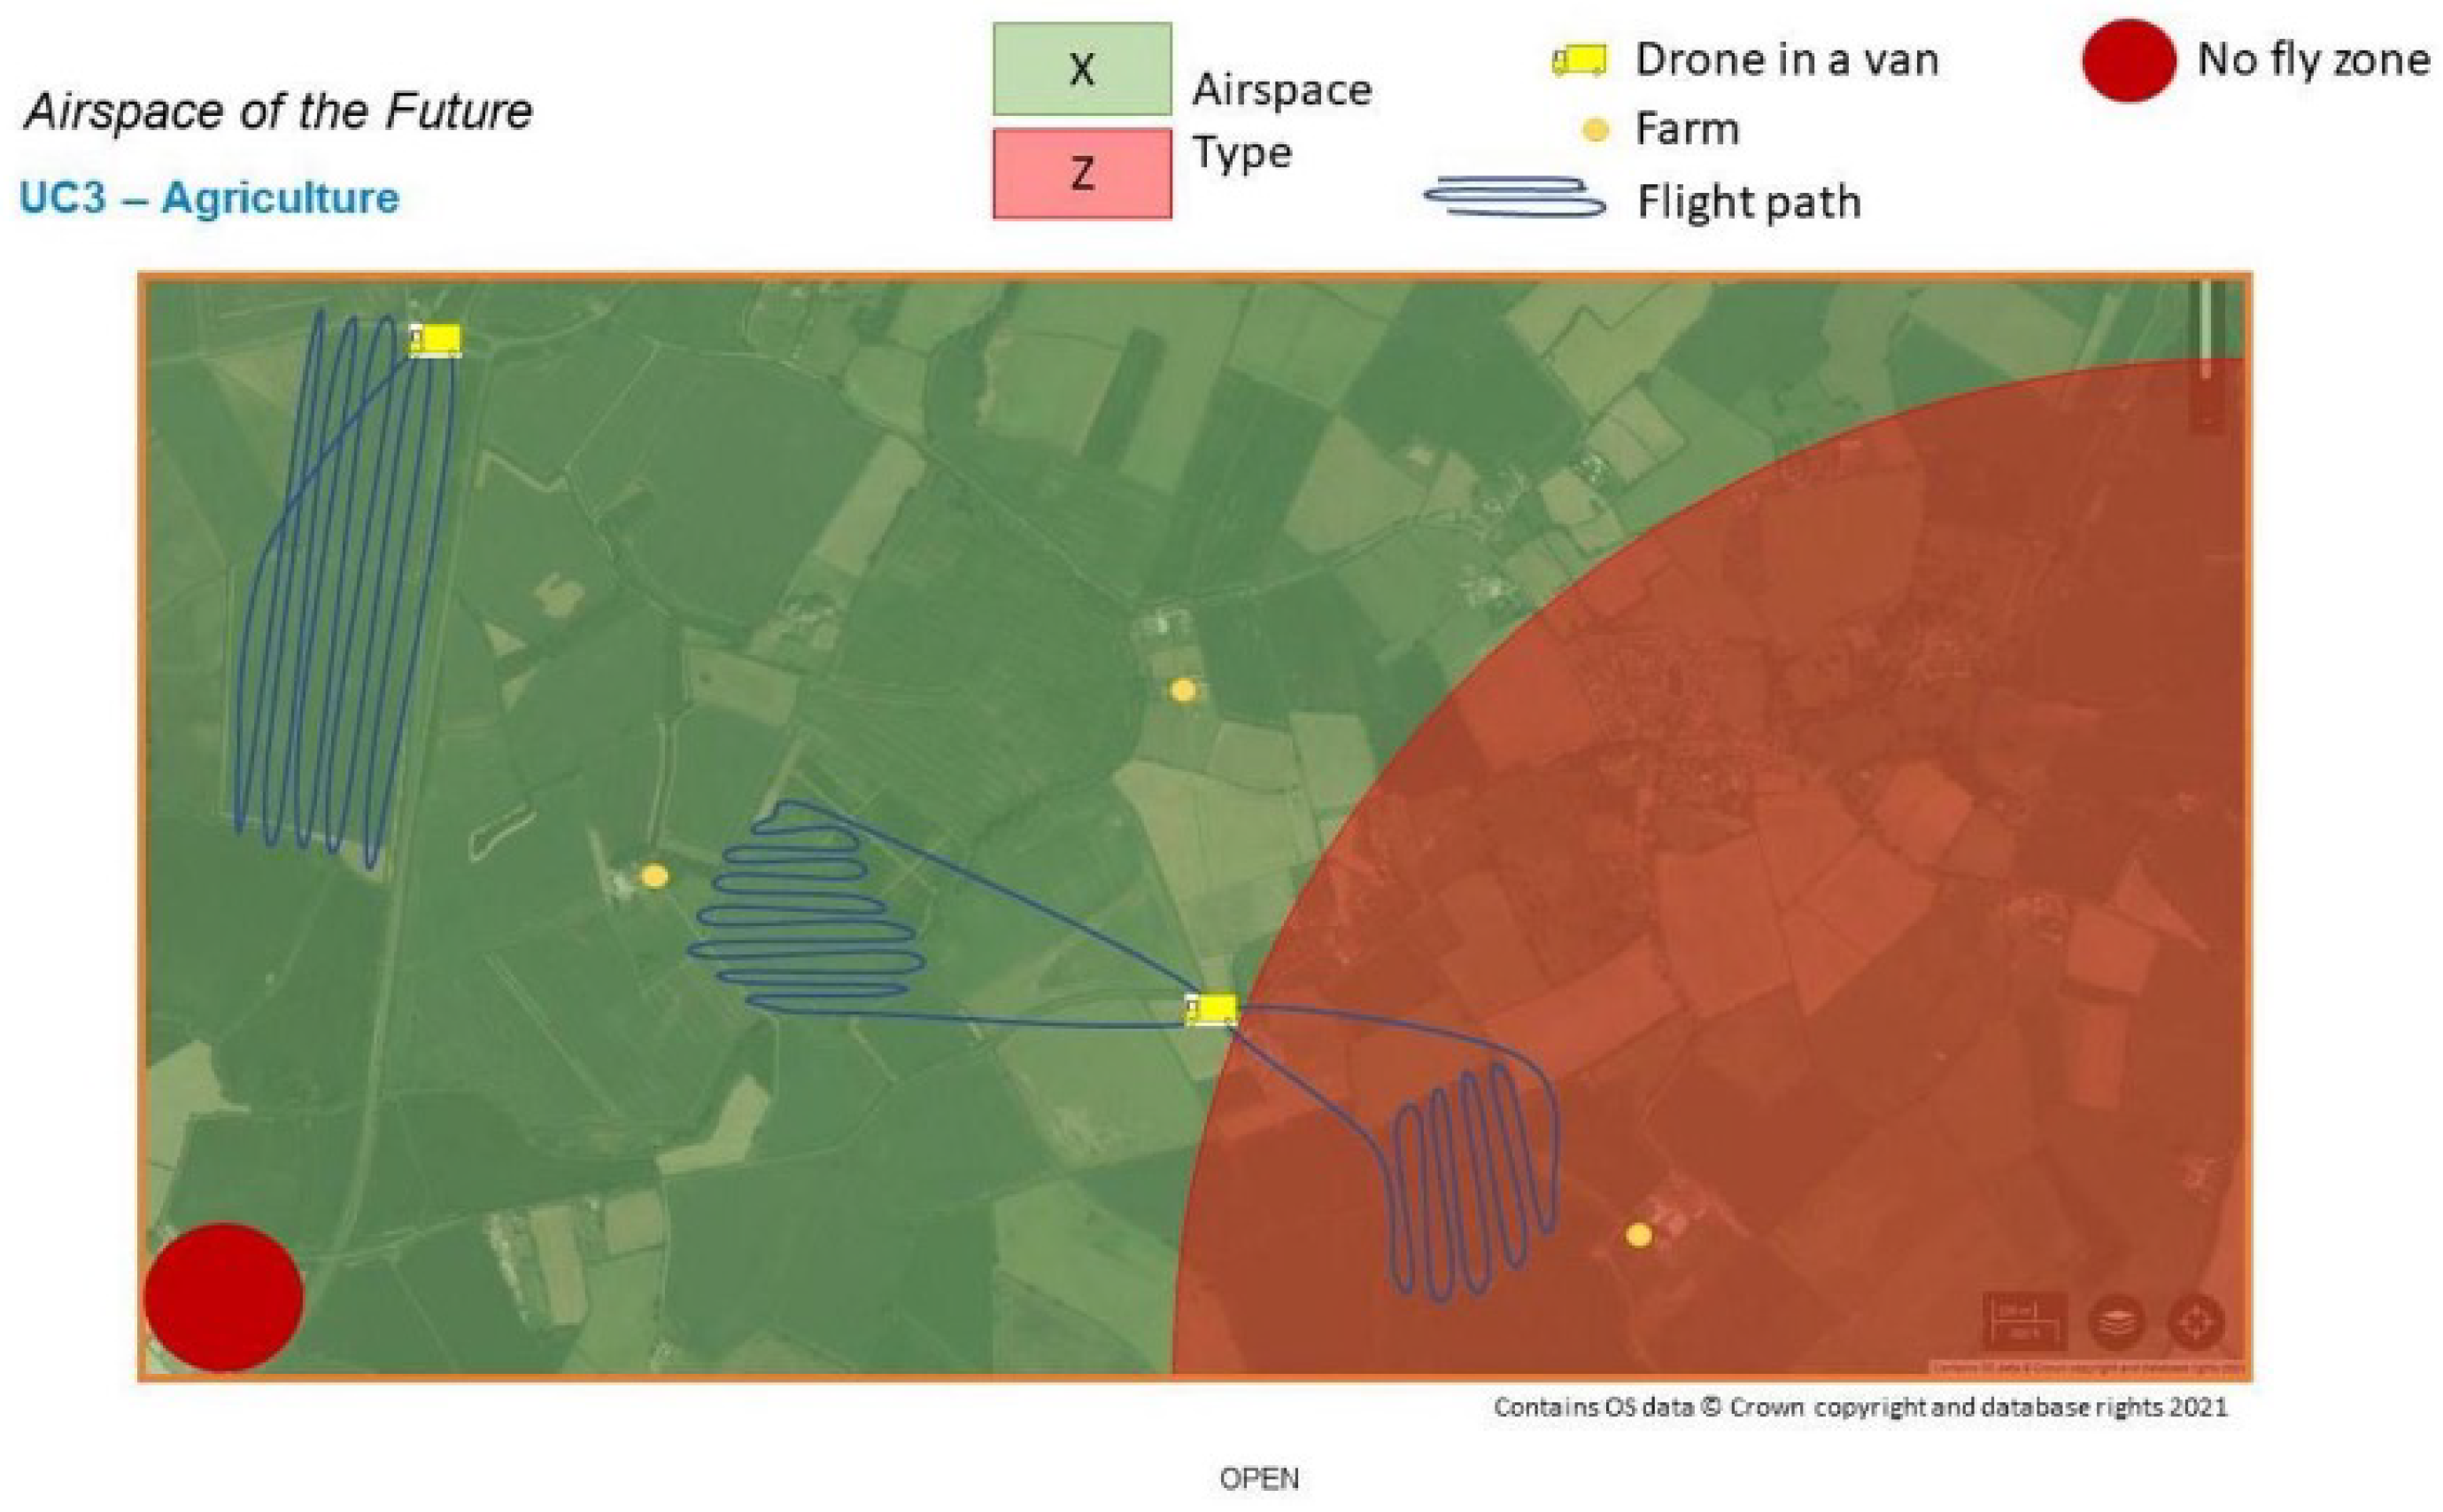
The Digital Twin visually represents both 2D and 3D airspace over the specified area, including classifications, geofencing and geocaging and areas around key infrastructures. It covers both civil and military controlled spaces and other areas with specific restrictions. While the main focus is on airspace below 400 ft, layers above this are included for integration, but not the primary focus. Specific UAS airspace types, as per the CORUS U-Space Concept of Operations [13], are also represented, including type X for open airspace, type Y for areas needing UTM involvement and type Z for strictly controlled spaces like airports and built-up areas. These types are represented in Figure 15.
The Digital Twin configures drone airspace type at the request of the user. It employs the configured drone airspace types within the Synthetic Environment and any UTMs in advance of any scenarios being undertaken. The Digital Twin represents up-to-date aviation charts with relevant Notice to Air Missions (NOTAM) information [57]. The Digital Twin has the ability to represent simulated permanent features and NOTAMs within the Synthetic Environment. Simulated features such as aerodromes/military bases have associated simulated airspace restrictions in place as if they were live features, which is represented in the UTMs and Synthetic Environment.
4. Use Case Simulation
Several use cases were identified and prioritised by the AoF. The Digital Twin supports the simulation of these use cases. This would enable scenario planning, execution and data gathering in a safe but realistic environment. The defined uses cases are summarised in Table 1.
It is shown that the uses cases cover different combinations of airspace characteristics, traffic volumes and UAS types. The scenario simulation environment supports the trials of these use cases. To enable this, the environment provides multiple U-Space services. Relevant data such as weather and geospatial data can also be loaded into the scenario environments. Specific use cases were selected for the simulation scenarios, such as agriculture, inspections and light goods delivery. For each of the use cases, the Digital Twin allows the testing of the CORUS processes and services [56].
4.1. Scenario Mapping
The use cases needed to be mapped to actual locations and airspace types; see the figure below. The Digital Twin supports the loading of real-world geospatial data for areas of interest to indicate the airspace types . The geospatial data included airspace restrictions relevant to UAS, Ordnance Survey data and NBEC centreline data. The light goods scenario (Figure 16) considers delivery of goods with low weight from warehouses to customers. As shown in the figure above, for the light goods scenario in the AOI, the airspace was divided into X and Z type airspace. Each of these types of airspace had the required set of services associated with them. The Digital Twin and LVC environment provided the functionality to both specify the airspace types and to use the associated CORUS services for each airspace. Another scenario mapping is shown in Figure 17, describing an agricultural (farm) inspection. For one of the scenarios, the whole mission was with X airspace (see top left of the figure). The Digital Twin supports the creation and execution of the mission plan for the scenario. Moreover, by using the implemented CORUS services, the mission can be visualised and recorded.
4.2. Implemented Simulation Services
To enable the simulation of scenarios, the Digital Twin implemented U-space services that have been defined in CORUS. These CORUS-based services are integral in the development and execution of flight scenarios in the Digital Twin. These services are summarised in Figure 18.
4.3. Scenario Simulation Process
The Digital Twin supports the end-to-end creation and execution of virtual flights. The process includes operation planning, UTM approval and operation execution.
In the Digital Twin, operations are planned using the simulated Mission Planning tool. The tool allows the user to act as UAS operators and create, modify and submit UAS operations to the UTM platforms. The same User Interface is also used to execute and monitor the simulated scenarios.
The Mission Planning tool is made of a frontend user interface and a backend server. The frontend interface allows the user to complete all tasks from creating, modifying, submitting and running the synthetic operations. All data are stored and managed in a local MongoDB database [58]. The backend server interfaces with the database, the Synthetic Environment through DIS, the simulated Ground Control Station and the UTM platforms (Altitude Angel GuardianUTM or Thales Topsky UAS UTM).
The operation-planning process follows the following workflow:
- Creation of operation templates;
- Creation of scenario templates;
- Instantiation of scenario templates.
5. Flight Trials
An imperative step in our research involves advancing from theoretical postulations and thrusting into the intricate practicalities of real-world operations. For this purpose, we orchestrated a series of flight trials, envisaged to serve as an instrument of practical validation for our Airspace of the Future (AoF) Digital Twin. These trials serve to challenge and affirm the robustness of our digital twin model within a range of realistic operational settings, thus enhancing the generalisability and applicability of our findings. Each trial acts as a rigorous proof-of-concept, demonstrating the capacity of U-space services to securely and efficiently manage drone flights.
The trials focused on testing the system behaviour, AoF processes, agreed and available CORUS functionality and performance measures such as air traffic load, traffic proximity etc., when the volume of Drone Operations increased from one to the maximum concurrent flights in airspaces defined during high and low peak periods.
The following trial runs were conducted during flight trials
- Trial Run#1: The purpose of this trial run was to test single drone operations in X Airspace.
- Trial Run#2: The purpose of this trial was to test three concurrent flights in X and airspace in Synthetic Environment only prior to loading the system with increased number of flight plans.
- Trial Run#3: The purpose of this trial was to test 10 concurrent flights in X and airspace in Synthetic Environment at low peak volumes.
- Trial Run#4: The purpose of this trial was to test all concurrent flights in airspace in Synthetic Environment at low peak volumes.
- Trial Run#5: The purpose of this trial was to test all concurrent flights in X and airspace in Synthetic Environment at high peak volumes.
- Trial Run#6: The purpose of this trial was to test all concurrent flights in X and airspace in hybrid environment at high peak volumes.
The analysis of the trials was conducted according to the defined performance requirements. These requirements include the total number of active flight plans, the total number of accepted flight plans, the total number of rejected flight plans, the total number of drone positions and tracks, the number of drones per airspace volume, traffic proximity and message throughput. By examining these performance metrics, we can gain a comprehensive understanding of the system capabilities and identify any areas that require improvement.
5.1. Flight Trial Observations in Synthetic Environment
Observations made only for Digital Twin Simulation and Guardian UTM. The architecture processes developed for each phase of flight were conformant and as expected.
5.1.1. Air Traffic Load for an Airspace
The analysis included trial runs with both flights requiring strategic deconfliction and those in X airspace not needing it. Trial run #1, consisting of flights solely in X airspace, was included because it had multiple concurrent flights. As shown in Figure 19, the Digital Twin system managed flight plans, providing users with approval or rejection of their submitted plans without any details of conflicts.
Table 2 presents the number of accepted and rejected flight plans for each trial run. Flights in X airspace were considered accepted. Trial runs #1 and #2 had acceptance rates of 100% because they did not require strategic deconfliction and all intended flights were flown.
During trial run #3, 90% of ten flights were accepted, although it is possible that the airspace was not fully loaded. In contrast, trial run #6 had a 24% acceptance rate, indicating that current processes were at capacity. The current deconfliction approach blocks other drones from flying through any point on the reserved path, which has a significant impact on flights from delivery hubs. Both strategic and non-strategic deconfliction flights were conducted in all trial runs. As the number of submitted flights increased, the acceptance rate decreased, with a maximum of 18 accepted flights per hour. Trial run #4 had a 70% acceptance rate, which was lower than trial run #3, due to the randomisation of drone operations and route selection.
To understand the reason for the rejections in trial run #4, a plot of the operations plan was generated, which showed rejected plans in red and accepted plans in blue (Figure 20). The plot indicated that once a flight departs a given base, no other flight can depart or arrive at the base for the duration of that flight. For example, flights that planned to depart the hub during the duration of an accepted flight were rejected. The trial used a “light goods delivery” use case, where all flight plans started and ended at a single point, the supermarket.
The UTM rejected flight plans if conflicts were identified along the planned route. Trial run #4 had a lower acceptance rate due to conflicts at the start and end points. Alternative deconfliction methods and rule sets could address these issues. Optimised trial run #5 split flights into subsections and required approval for each subsection. Further optimisation of airspace use is possible as even low-density runs had flight plan rejections. Next, safety and efficiency of airspace management will be explored.
5.1.2. Traffic Proximity/Nearest Approach
Airspace management aims to prevent drone collisions by analysing traffic proximity data. Results from post-trial analysis show how close drones come to each other, which is a safety and efficiency metric. Separation that is too great reduces the number of drones flown, potentially failing to meet user demand. Proximity data was obtained through a discrete and approximate method, resampling position data at s intervals to calculate the distance between concurrent drones. A conflict or incursion occurs if drones come within or of each other. Results for each trial run can be seen in Table 3.
The majority of trial runs showed effective separation of drones with no conflicts within defined thresholds, demonstrating the efficacy of the airspace-management processes. However, Trial Run #4 had a near miss and collision in the horizontal plane, corresponding to of operations. Vertical separation was and , respectively, despite the drones flying at the same cruising altitude, due to altitude changes during takeoff and landing. The affected drones belonged to the same operator and were synthetic without detect-and-avoid. Lack of buffer time for landing in some operation plans likely caused the conflicts. Figure 21 shows a proximity violation, with drones 1 and 2 having blue and red tracks, respectively, occurring at Base 1. Both drones were concurrent in flight time. Tactical deconfliction was not implemented in the trials.
Therefore, a drone from a previous operation may still be nearby in a location when another drone is about to takeoff. This issue was corrected in later trials by increasing the buffer time at the end of operations. This observation further stresses the need to take extra care during takeoff and landing procedures.
For most of the trial runs, the separation between the drones is large, reaching up to in Trial Run #5. This indicates there is room to optimise the airspace efficiency by exploring more ways to support more drones per unit time. This is especially the case if we consider that some flight plans were rejected even though the separation distance between any pair of the drones was large.
5.1.3. Number of Drones per Airspace Volume
A crucial measure of the efficiency of the airspace management is the number of drones that can be safely flown per airspace volume. By analysing the timestamped position reports, this measure can be obtained for each trial run. That is, for each time interval (one minute in this case), the number of drones in operation in the airspace of interest was counted. The best-case scenario is to keep the number of drones per time close to the maximum capacity that can be supported or the airspace. That way, the airspace is used more efficiently. Table 4 summarises the relevant results for each of the Phase 2 trial runs.
Trial Run #4 had the most drones, with a support of seven drones per minute, but suffered from reduced separation and a collision between two drones. The highest number of drones with good separation was five drones per airspace in Trial Run #1, which had a large minimum separation of . Therefore, the optimal number of concurrent drones for good airspace use and sufficient separation lies between Trial Run #4 and Trial Run #5. To analyse the results further, a plot of the number of active drones over time for Trial Run #5 is shown Figure 22.
The plot reveals that, for most of the time, the number of active drones was lower than the peak capacity of five drones. Ideally, the number of concurrent drones should remain at the peak capacity of the airspace throughout the trial run. Therefore, increasing the number of drones in the airspace per unit time to the peak values for a larger fraction of the trial run would be beneficial. However, this observation is based on the assumption that there was good separation during the trial. To increase the number of concurrent drones, more sophisticated airspace-management strategies could be employed. For instance, flight plans could be segmented and deconflicted, as demonstrated in the optimised Trial Run #5.
5.1.4. Total Number of Drone Positions and Tracks
For these trial runs, the number of drone tracks was equivalent to the number of flight plans submitted. This is because relatively ideal conditions were considered. This meant that most approved operations were flown and were not cancelled.
In addition, the drone positions were regularly submitted to the Altitude Angel Surveillance API. This meant that any stakeholder that has access to the API could be aware of drone traffic in their vicinity. This ensures safety and the drone position reporting service is a requirement of the CORUS-based systems used in this design.
Figure 23 shows a screenshot of the Guardian UTM dashboard displaying some tracks for planned drone operations during trial run #5. This type of information is useful to airspace users and stakeholders for informing adequate drone separations and drone awareness.
5.1.5. Message Throughput
An important interface covered in this analysis was the interface between the GCS and strategic conflict resolution interface (GCS-SCR) through which deconfliction requests are submitted. A summary of the analysis for Phase 2 runs can be seen in Table 5. The table also shows the results for the interfaces between the GCS and Surveillance API (GCS-SURV) and those between the Remote ID and surveillance API (Remote ID-SURV).
The results for the GCS-SURV interface showed that the message traffic increased as the number of concurrent drones increased. This was expected because the interface handled position reports. This was because each drone transmitted its position regularly and these reports eventually got to the GCS-SURV interface. Note message data logging was not available during run #2. A similar result was obtained for the Remote ID-SURV interface because it also handled drone position reports.
Figure 24 shows an example plot of the variation of the message rate for the GCS-SURV interface (Trial Run #5). The figure could be compared with the respective plot for number of drones in the airspace to confirm the observation that message throughput varied with number of drones in the airspace.
In contrast, the results for the GCS-SCR interface showed a small number of messages. The messages correspond to the number of flight plans submitted to the strategic deconfliction API. Therefore, this interface handled messages mostly before operations and did not experience much loading, compared to the GCS-SURV interface. Because the messages handled by the GCS-SURV and Remote ID-SURV interfaces grew with the number of drones, the interfaces were more likely to be bottlenecks in the LVC (Live Virtual Constructive) environment. This is in comparison with the GCS-SCR interface that had low message load.
5.1.6. Discussion
Based on the conducted trials, it can be concluded that a rise in flight submissions inversely affects the acceptance rate, indicating a need to explore alternative deconfliction strategies and airspace optimisation methods. The near misses and collisions witnessed in Trial Run #4 emphasise the critical need to implement rigorous safety measures during takeoff and landing, particularly with respect to ensuring sufficient buffer times.
Moreover, despite the maximum drone support in Trial Run #4, the occurrence of a collision underlines the necessity to strike a balance between safety and efficiency for optimal airspace utilisation. The robust operation of the Altitude Angel Surveillance API was demonstrated in the successful tracking of drone positions and routes.
Furthermore, the trials revealed the potential for bottlenecks in the Live Virtual Constructive (LVC) environment due to the rise in message traffic correlated with an increase in drone concurrency. These findings necessitate focused attention on improving data management techniques to sustain high traffic loads.
5.2. Flight Trials in Hybrid Environment
The conducted flight trials in a hybrid environment refer to the testing and evaluation of the system and processes in a combination of simulated and real-world operational conditions.
5.2.1. Air Traffic Load for an Airspace
During the hybrid operations at scale run, 75 target operations were conducted, some of which required submission to the strategic deconfliction service due to their flight paths passing through or airspace. Table 6 displays the traffic load results. In trial run #8, only 19 out of 75 operations were flown, resulting in an acceptance rate of 25.33%. This is similar to the acceptance rate of 24% obtained in synthetic run number #5, which also had 75 target flights. The slight difference in acceptance rate may be attributed to the variation in randomised routes between the two runs. For instance, trial run #8 included an operation at Cranfield Airport, which was not present in trial run #5.
The UTM system used in the Airspace of the Future study offered a limited range of services and did not support tactical deconfliction, resulting in the work flow mechanism not accounting for the exact location of each participating drone. Thus, when flight plans were submitted, if the plans physically or time ’overlap’ the first flight plan will be accepted and all other conflicting flight plans will be rejected until the first flight plan has ’timed out’.
5.2.2. Traffic Proximity/Nearest Approach
This analysis aimed to determine the proximity of active drones to each other during the trial run. Three proximity thresholds were used for this analysis: for collisions, for near-misses and for incursions. The results are presented in Table 7.
The table shows that all drones in the trial run remained within the defined proximity thresholds with no violations recorded. The minimum separation between drones was , indicating safe separation and a low probability of conflicts. This result is similar to that of run #7, which had the same number of drones and no proximity violations, but with a higher separation distance of . However, trial run #8 had a slightly higher number of accepted flights (19) compared to trial run #7 (18), indicating that it could support a higher number of flights without compromising safety.
Given the safe separation distances observed, there may be opportunities to optimise airspace utilisation by increasing the number of drones in the airspace. By doing so, airspace managers can enhance the efficiency of drone operations while maintaining safety.
5.2.3. Number of Drones per Airspace Volume
Figure 25 shows the number of drones per airspace volume as a function of time. it can be observed that the maximum number of drones per minute recorded during this trial run was 5.
Throughout most of the run, the number of drones in the airspace was below its peak capacity of 5. Ideally, the airspace utilisation should be kept as close to its peak as possible to support more drones per unit time, thus increasing the number of services and operations available to airspace users. For example, if the number of concurrent drones was maintained at 5 per minute at all times, the drone traffic would increase to 300 drones per hour (5 multiplied by 60).
However, while large separation distances ensured safety during the run, they may have had a negative impact on airspace efficiency. This highlights the need for more CORUS services such as dynamic deconfliction and Detect and Avoid (DAA) to improve efficiency in the future.
5.2.4. Total Number of Drone Positions and Tracks
Like previous runs, the number of drone positions and tracks was equivalent to the number of flight plans, as discussed in the Air Traffic Load for an Airspace section above. This was because only the ideal (“sunny day”) conditions were within the scope of these trials. Therefore, there were no cancellations and so on.
5.2.5. Message Throughput
Table 8 summarises the message throughput analysis for important interfaces in the Digital Twin.
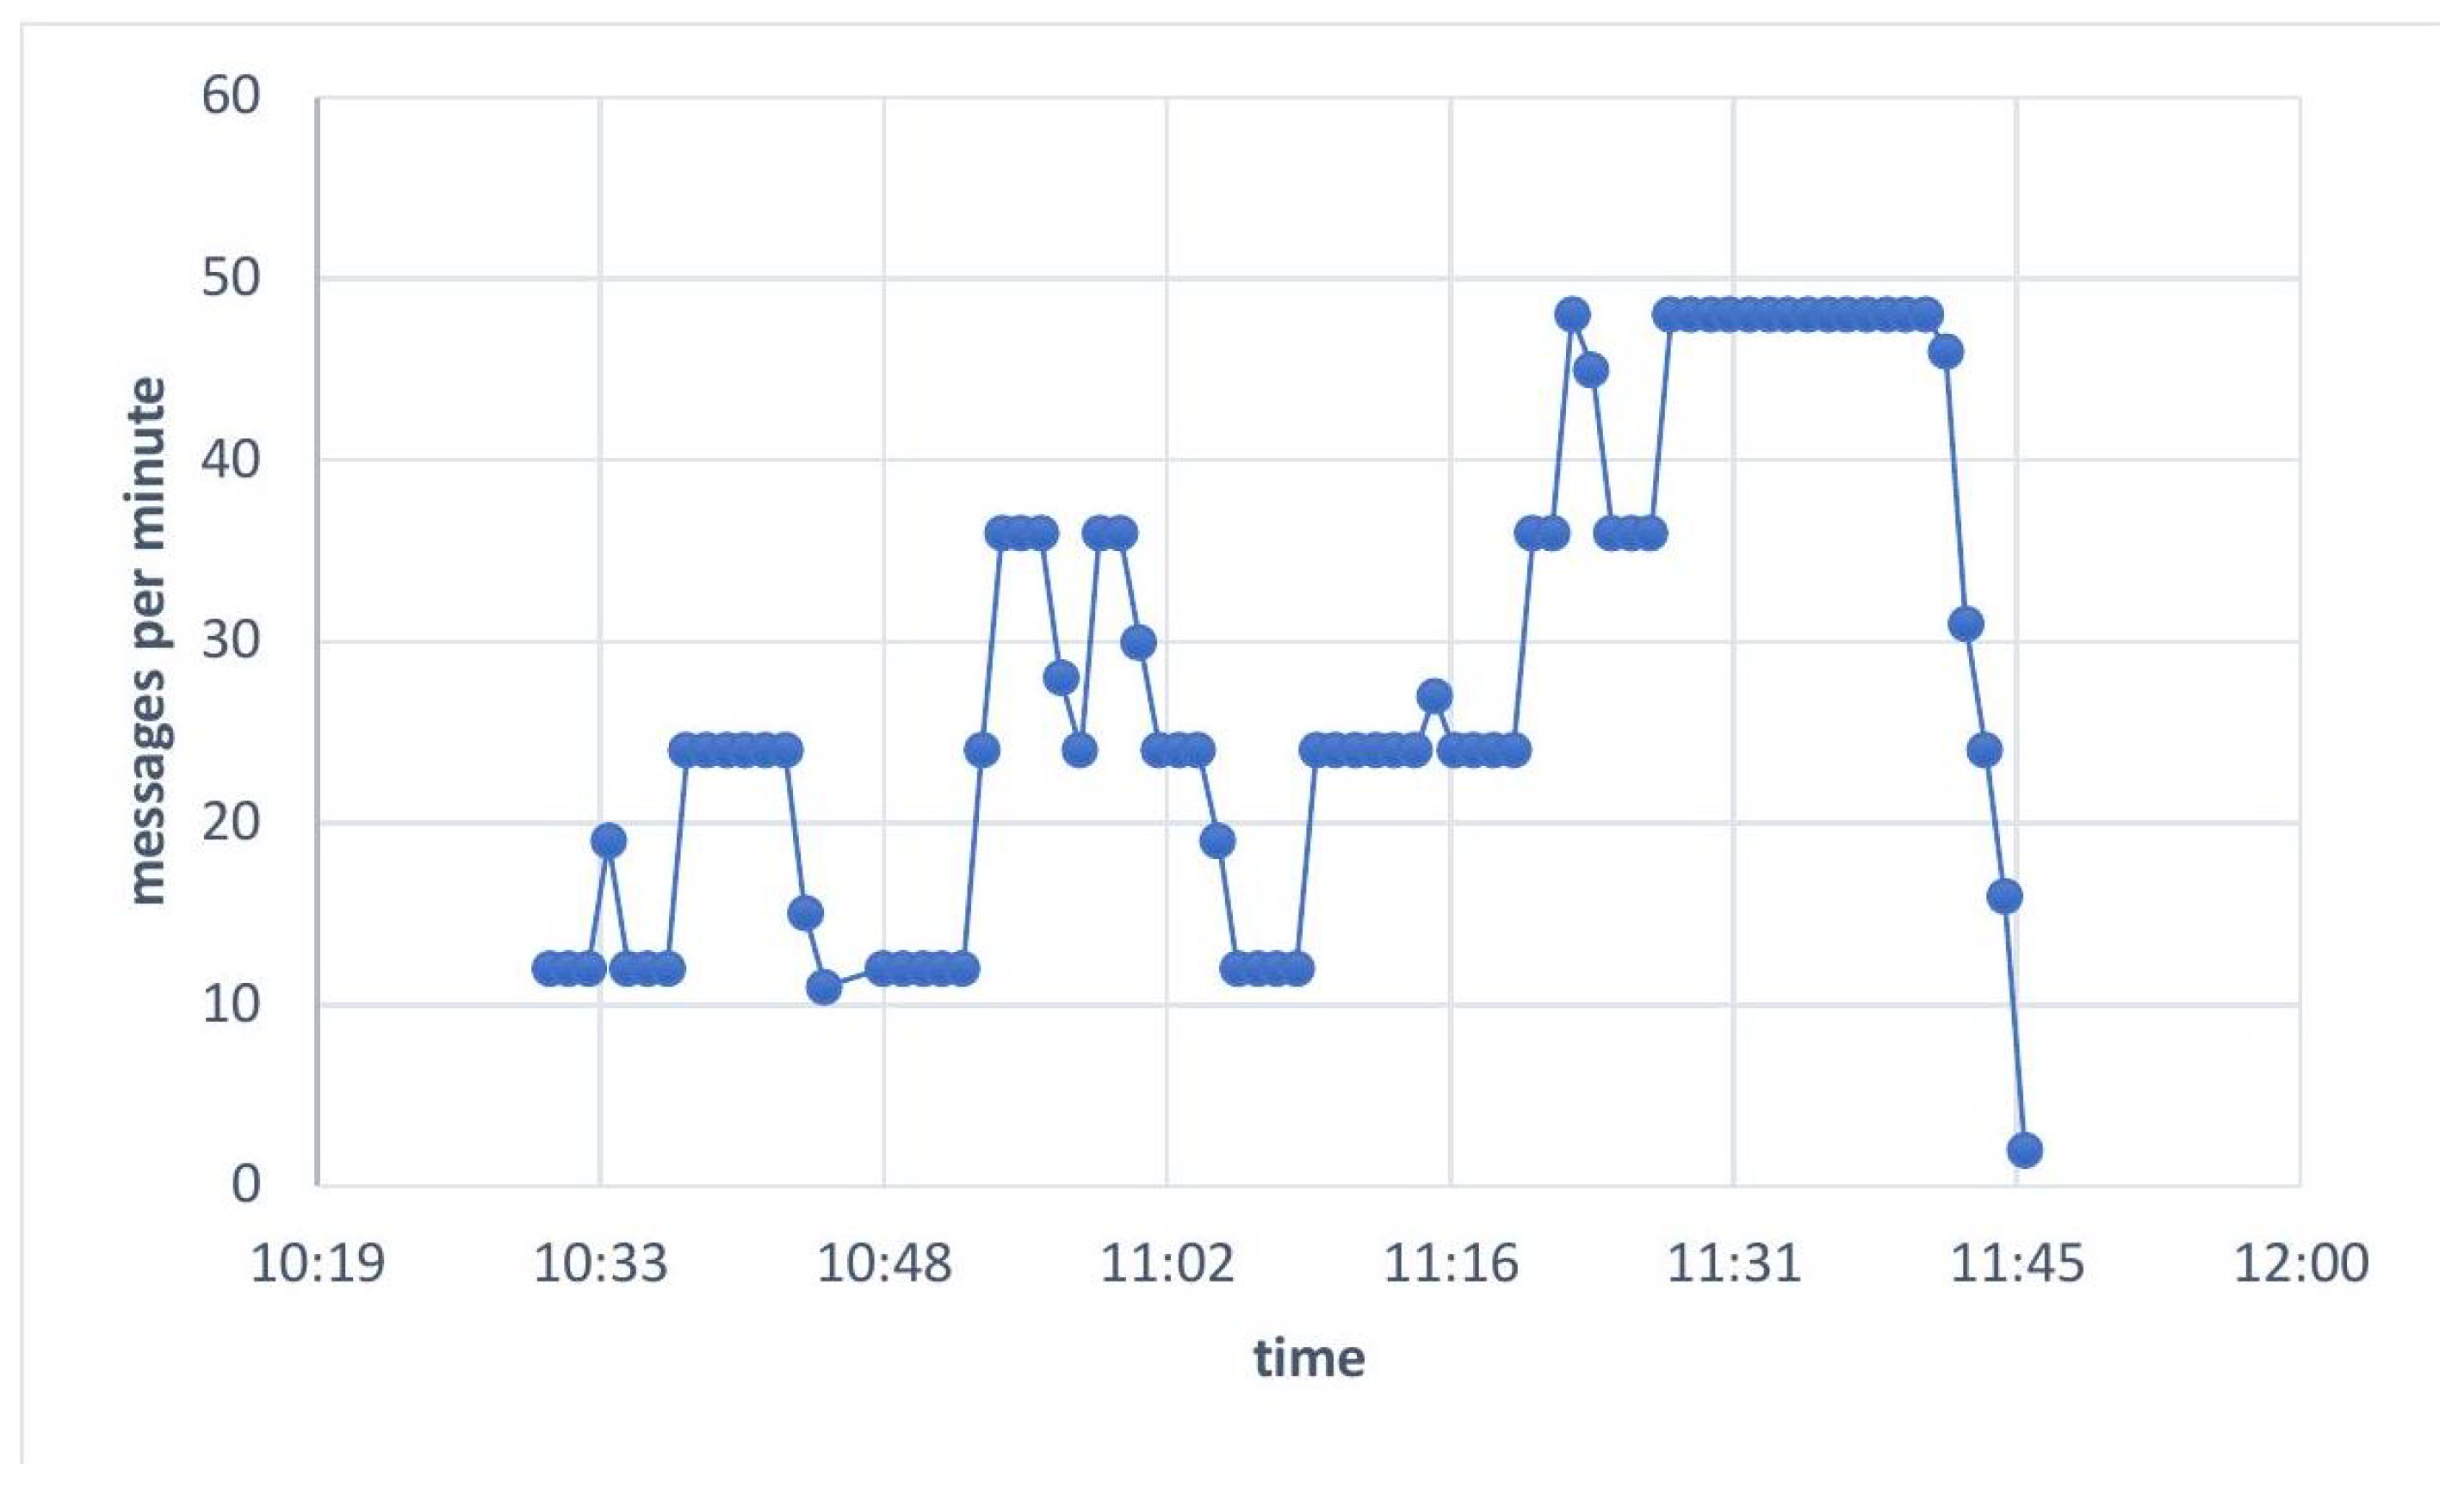
For the GCS-SCR interface, the throughput was low with just 38 messages sent per minute. This is because the interface was used to handle the few flight plans that needed strategic deconflictions. This process is usually done before operations. Thereafter, the interface was not needed. On the other hand, the GCS-SURV interface handled a larger number of messages throughout the trial run with a peak message rate of 48 messages per minute. The results indicate that the GCS-SURV interface was more likely to be a bottleneck compared with the GCS-SCR interface. The GCS-SURV interface would, therefore, require more resources and redundancy in operational deployments compared with the GCS-SCR interface. Figure 26 showed the plot of the message throughput variation with time. The message throughput for the GCS-SURV interface increased as the number of drones in the Digital Twin increased. This can be seen by comparing the figure with the number of drones in the airspace. The increase is because each drone transmits its position periodically and this data are then sent by the GCS to the SURV interface (surveillance API). Therefore, the message rate for a single drone is multiplied by the number of drones in the airspace to give the total throughput.
5.2.6. Discussion
The flight trials in a hybrid environment provided valuable insights into system functionality and efficiency. With an acceptance rate of 25.33% (19 out of 75 operations flown), the trials revealed limitations of the existing UTM system, emphasising the need for tactical deconfliction. Safe drone separations of at least suggested potential for optimising airspace utilisation. The peak capacity of five drones per minute highlighted the importance of dynamic deconfliction and Detect and Avoid (DAA) strategies for improved efficiency. Matching drone positions to flight plans indicated ideal conditions without cancellations, while message throughput analysis identified the GCS-SURV interface as a potential bottleneck compared to the GCS-SCR interface.
6. Conclusions
Digital twins are poised to revolutionise the aerospace industry by unlocking unprecedented levels of efficiency, safety and optimisation. From design and development to manufacturing, maintenance and operations, digital twins offer a comprehensive approach to enhancing every aspect of aerospace systems. As we look towards the future, embracing this transformation technology will undoubtedly shape the next generation of aircraft and spacecraft, propelling us further into the realms of exploration and innovation. The digital twin showcased in this paper has demonstrated its potential as a valuable asset for testing airspace scenarios, facilitating the development and validation of new drone infrastructure and unmanned traffic management systems within a secure and controlled environment. By integrating synthetic testing and live virtual constructive testing, the digital twin creates a realistic and immersive simulation that accurately represents the actual airspace environment. This simulation incorporates real-time weather data and flight data, enabling thorough testing and validation of new drone infrastructure and unmanned traffic management systems while ensuring safety and security. Moreover, the adaptability of the digital twin allows for customisation and application in diverse cities or scenarios, making it a versatile tool for testing and development across various contexts. Although the utilisation of digital twins for airspace testing is a relatively recent concept, it is gaining traction due to its potential to enhance the safety and efficiency of drone operations. Further research is needed to explore the full range of capabilities offered by digital twins and how they can effectively address the challenges associated with airspace testing in the rapidly evolving drone industry.
Author Contributions
Conceptualisation, A.T.; methodology, A.T., S.A.-R. and D.P.; software, S.A. and T.S.; validation, S.A., D.P. and A.T.; investigation, A.T.; data curation, S.A.; writing—original draft preparation, T.S.; writing—review and editing, T.S., S.A.-R. and A.T.; project administration, A.T. and D.P.; funding acquisition, A.T. All authors have read and agreed to the published version of the manuscript.
Funding
This research was funded by UK Research and Innovation (UKRI) grant number 72728.
Institutional Review Board Statement
Not applicable.
Informed Consent Statement
Not applicable.
Data Availability Statement
No new data were generated; instead, existing data and simulations were utilised.
Acknowledgments
The authors acknowledge the partners who contributed to the AoF project: Thales UK, Blue Bear, Altitude Angel, Inmarsat, Ocado Group, Cranfield Airport Operations, Satellite Applications Catapult, Connected Places Catapult.
Conflicts of Interest
The authors declare no conflict of interest.
References
- Fraser, B.; Al-Rubaye, S.; Aslam, S.; Tsourdos, A. Enhancing the Security of Unmanned Aerial Systems using Digital-Twin Technology and Intrusion Detection. In Proceedings of the 2021 IEEE/AIAA 40th Digital Avionics Systems Conference (DASC), San Antonio, TX, USA, 3–7 October 2021; pp. 1–10. [Google Scholar] [CrossRef]
- Jamil, S.; Rahman, M.; Fawad. A Comprehensive Survey of Digital Twins and Federated Learning for Industrial Internet of Things (IIoT), Internet of Vehicles (IoV) and Internet of Drones (IoD). Appl. Syst. Innov. 2022, 5, 56. [Google Scholar] [CrossRef]
- Almeaibed, S.; Al-Rubaye, S.; Tsourdos, A.; Avdelidis, N.P. Digital Twin Analysis to Promote Safety and Security in Autonomous Vehicles. IEEE Commun. Stand. Mag. 2021, 5, 40–46. [Google Scholar] [CrossRef]
- Straubinger, A.; Rothfeld, R.; Shamiyeh, M.; Büchter, K.D.; Kaiser, J.; Plötner, K.O. An overview of current research and developments in urban air mobility–Setting the scene for UAM introduction. J. Air Transp. Manag. 2020, 87, 101852. [Google Scholar] [CrossRef]
- Schuchardt, B.I.; Geister, D.; Lüken, T.; Knabe, F.; Metz, I.C.; Peinecke, N.; Schweiger, K. Air Traffic Management as a Vital Part of Urban Air Mobility—A Review of DLR’s Research Work from 1995 to 2022. Aerospace 2023, 10, 81. [Google Scholar] [CrossRef]
- Bharadwaj, S.; Carr, S.; Neogi, N.; Topcu, U. Decentralized Control Synthesis for Air Traffic Management in Urban Air Mobility. IEEE Trans. Control. Netw. Syst. 2021, 8, 598–608. [Google Scholar] [CrossRef]
- Ye, S.; Wan, Z.; Zeng, L.; Li, C.; Zhang, Y. A vision-based navigation method for eVTOL final approach in urban air mobility(UAM). In Proceedings of the 2020 4th CAA International Conference on Vehicular Control and Intelligence (CVCI), Hangzhou, China, 18–20 December 2020; pp. 645–649. [Google Scholar] [CrossRef]
- Wang, X.; Yang, P.P.J.; Balchanos, M.; Mavris, D. Urban Airspace Route Planning for Advanced Air Mobility Operations. In International Conference on Computers in Urban Planning and Urban Management; Springer: Cham, Switzerland, 2023; pp. 193–211. [Google Scholar]
- Gunady, N.I.; Patel, S.R.; DeLaurentis, D. A System-of-Systems Approach to Analyzing Future Advanced Air Mobility Cargo Operations. In Proceedings of the 2022 17th Annual System of Systems Engineering Conference (SOSE), Rochester, NY, USA, 7–11 June 2022; pp. 368–373. [Google Scholar]
- Maia, F.D. The state of the art and operational scenarios for urban air mobility with unmanned aircraft. Aeronaut. J. 2021, 125, 1034–1063. [Google Scholar] [CrossRef]
- Kopardekar, P.; Rios, J.; Prevot, T.; Johnson, M.; Jung, J.; Robinson, J.E. Unmanned aircraft system traffic management (UTM) concept of operations. In Proceedings of the AIAA Aviation and Aeronautics Forum (Aviation 2016), Washington, DC, USA, 13–17 June 2016. number ARC-E-DAA-TN32838. [Google Scholar]
- Pongsakornsathien, N.; Bijjahalli, S.; Gardi, A.; Symons, A.; Xi, Y.; Sabatini, R.; Kistan, T. A performance-based airspace model for unmanned aircraft systems traffic management. Aerospace 2020, 7, 154. [Google Scholar] [CrossRef]
- Hately, A.; Swalm, A.; Volkert, A.; Rushton, A.; Garcia, A.; Ronfle-Nadaud, C.; Barrado, C.; Bajiou, D.; Martin, D.; Vecchio, D.; et al. CORUS U-Space Concept of Operations; SESAR Joint Undertaking: Brussels, Belgium, 2019. [Google Scholar]
- Mercer, J.; Martin, L.H.; Wolter, C.A.; Mohlenbrink, C.P.; Homola, J.R. NASA’s UTM Research; Technical Report; United States National Aeronautics and Space Administration, NASA Technical Reports Server: NTRS; U.S. National Aeronautics and Space Administration: Washington, DC, USA, 2017. [Google Scholar]
- Mueller, E.R.; Kopardekar, P.H.; Goodrich, K.H. Enabling airspace integration for high-density on-demand mobility operations. In Proceedings of the 17th AIAA Aviation Technology, Integration and Operations Conference, Denver, CO, USA, 5–9 June 2017; p. 3086. [Google Scholar]
- Goyal, R.; Reiche, C.; Fernando, C.; Serrao, J.; Kimmel, S.; Cohen, A.; Shaheen, S. Urban Air Mobility (UAM) Market Study; Technical Report; United States National Aeronautics and Space Administration, NASA Technical Reports Server: NTRS; U.S. National Aeronautics and Space Administration: Washington, DC, USA, 2018. [Google Scholar]
- Thipphavong, D.P.; Apaza, R.; Barmore, B.; Battiste, V.; Burian, B.; Dao, Q.; Feary, M.; Go, S.; Goodrich, K.H.; Homola, J.; et al. Urban air mobility airspace integration concepts and considerations. In Proceedings of the 2018 Aviation Technology, Integration and Operations Conference, Atlanta, GA, USA, 25–29 June 2018; p. 3676. [Google Scholar]
- Decker, C.; Chiambaretto, P. Economic policy choices and trade-offs for Unmanned aircraft systems Traffic Management (UTM): Insights from Europe and the United States. Transp. Res. Part A Policy Pract. 2022, 157, 40–58. [Google Scholar] [CrossRef]
- Tuchen, S.; LaFrance-Linden, D.; Hanley, B.; Lu, J.; McGovern, S.; Litvack-Winkler, M. Urban Air Mobility (UAM) and Total Mobility Innovation Framework and Analysis Case Study: Boston Area Digital Twin and Economic Analysis. In Proceedings of the 2022 IEEE/AIAA 41st Digital Avionics Systems Conference (DASC), Portsmouth, VA, USA, 18–22 September 2022; pp. 1–14. [Google Scholar] [CrossRef]
- Airspace of the Future. Available online: https://gtr.ukri.org/projects?ref=72728 (accessed on 27 March 2023).
- Singh, M.; Fuenmayor, E.; Hinchy, E.P.; Qiao, Y.; Murray, N.; Devine, D. Digital twin: Origin to future. Appl. Syst. Innov. 2021, 4, 36. [Google Scholar] [CrossRef]
- Tao, F.; Zhang, M.; Nee, A.Y.C. Digital Twin Driven Smart Manufacturing; Academic Press: Cambridge, MA, USA, 2019. [Google Scholar]
- Leng, J.; Wang, D.; Shen, W.; Li, X.; Liu, Q.; Chen, X. Digital twins-based smart manufacturing system design in Industry 4.0: A review. J. Manuf. Syst. 2021, 60, 119–137. [Google Scholar] [CrossRef]
- Ryan, R.; Al-Rubaye, S.; Braithwaite, G. UTM Regulatory Concerns with Machine Learning and Artificial Intelligence. In Proceedings of the 2022 IEEE/AIAA 41st Digital Avionics Systems Conference (DASC), Portsmouth, VA, USA, 18–22 September 2022; pp. 1–5. [Google Scholar] [CrossRef]
- Xiong, M.; Wang, H. Digital twin applications in aviation industry: A review. Int. J. Adv. Manuf. Technol. 2022, 121, 5677–5692. [Google Scholar] [CrossRef]
- Geister, R.; Peinecke, N.; Sundqvist, B.G.; Del Core, G.; Timmerman, B.; Boer, J.F.; Zimra, D.; Steinbuch, Y.; Batzdorfer, S.; Grevtsov, N.; et al. On-Board System Concept for Drones in the European U-space. In Proceedings of the 2019 IEEE/AIAA 38th Digital Avionics Systems Conference (DASC), San Diego, CA, USA, 8–12 September 2019; pp. 1–6. [Google Scholar] [CrossRef]
- Abosata, N.; Al-Rubaye, S.; Inalhan, G.; Emmanouilidis, C. Internet of things for system integrity: A comprehensive survey on security, attacks and countermeasures for industrial applications. Sensors 2021, 21, 3654. [Google Scholar] [CrossRef]
- Valavanis, K.P.; Vachtsevanos, G.J. Handbook of Unmanned Aerial Vehicles; Springer: Dordrecht, The Netherlands, 2015; Volume 1. [Google Scholar]
- Grigoropoulos, N.; Lalis, S. Simulation and digital twin support for managed drone applications. In Proceedings of the 2020 IEEE/ACM 24th International Symposium on Distributed Simulation and Real Time Applications (DS-RT), Prague, Czech Republic, 14–16 September 2020; pp. 1–8. [Google Scholar]
- Hollenbeck, D.; Chen, Y. Characterization of ground-to-air emissions with sUAS using a digital twin framework. In Proceedings of the 2020 International Conference on Unmanned Aircraft Systems (ICUAS), Athens, Greece, 1–4 September 2020; pp. 1162–1166. [Google Scholar]
- Arora, J.; Tushir, M. Digital twin: Towards internet of drones. In Digital Twin Technology; IntechOpen: London, UK, 2021; pp. 23–45. [Google Scholar]
- Deng, T.; Zhang, K.; Shen, Z.J.M. A systematic review of a digital twin city: A new pattern of urban governance toward smart cities. J. Manag. Sci. Eng. 2021, 6, 125–134. [Google Scholar] [CrossRef]
- Wang, W.; Li, X.; Xie, L.; Lv, H.; Lv, Z. Unmanned aircraft system airspace structure and safety measures based on spatial digital twins. IEEE Trans. Intell. Transp. Syst. 2022, 23, 2809–2818. [Google Scholar] [CrossRef]
- Winkler, P.; Gallego-García, S.; Groten, M. Design and simulation of a digital twin mobility concept: An electric aviation system dynamics case study with capacity constraints. Appl. Sci. 2022, 12, 848. [Google Scholar] [CrossRef]
- Brunelli, M.; Ditta, C.C.; Postorino, M.N. A Framework to Develop Urban Aerial Networks by Using a Digital Twin Approach. Drones 2022, 6, 387. [Google Scholar] [CrossRef]
- NBEC. Available online: https://tas-security.lancs.ac.uk/wp-content/uploads/NBEC-brochure.pdf (accessed on 27 March 2023).
- Lappas, V.; Zoumponos, G.; Kostopoulos, V.; Lee, H.I.; Shin, H.S.; Tsourdos, A.; Tantardini, M.; Shomko, D.; Munoz, J.; Amoratis, E.; et al. EuroDRONE, a European unmanned traffic management testbed for U-space. Drones 2022, 6, 53. [Google Scholar] [CrossRef]
- Ramalingam, K.; Kalawsky, R.; Noonan, C. Integration of unmanned aircraft system (UAS) in non-segregated airspace: A complex system of systems problem. In Proceedings of the 2011 IEEE International Systems Conference, Montreal, QC, Canada, 4–7 April 2011; pp. 448–455. [Google Scholar]
- Schluse, M.; Rossmann, J. From simulation to experimentable digital twins: Simulation-based development and operation of complex technical systems. In Proceedings of the 2016 IEEE International Symposium on Systems Engineering (ISSE), Edinburgh, UK, 3–5 October 2016; pp. 1–6. [Google Scholar]
- Boschert, S.; Rosen, R. Digital twin—The simulation aspect. In Mechatronic Futures: Challenges and Solutions for Mechatronic Systems and Their Designers; Springer: Cham, Switzerland, 2016; pp. 59–74. [Google Scholar]
- Stevenson, J.D.; O’Young, S.; Rolland, L. Beyond line of sight control of small unmanned aerial vehicles using a Synthetic Environment to augment first person video. Procedia Manuf. 2015, 3, 960–967. [Google Scholar] [CrossRef] [Green Version]
- Bandelier, K.; Al-Rubaye, S.; Savazzi, S.; Namuduri, K. Use Cases for Vehicle-to-Vehicle (V2V) Communications for Unmanned Aircraft Systems; IEEE Standard: Rochester, MI, USA, 2023; pp. 1–24. [Google Scholar]
- Kim, Y.; Jo, J.Y.; Lee, S. ADS-B vulnerabilities and a security solution with a timestamp. IEEE Aerosp. Electron. Syst. Mag. 2017, 32, 52–61. [Google Scholar] [CrossRef]
- IEEE Std 1278.2-2015 (Revision of IEEE Std 1278.2-1995); IEEE Standard for Distributed Interactive Simulation (DIS) Communication Services and Profiles. IEEE: Piscataway, NJ, USA, 2015; pp. 1–42. [CrossRef]
- IEEE Std 1516-2010 (Revision of IEEE Std 1516-2000); IEEE Standard for Modeling and Simulation (M&S) High Level Architecture (HLA) Framework and Rules. IEEE: Piscataway, NJ, USA, 2010; pp. 1–38. [CrossRef]
- Blue Bear, Ltd. Available online: https://bbsr.co.uk/ (accessed on 27 March 2023).
- Apache Kafka. Available online: https://kafka.apache.org/ (accessed on 27 March 2023).
- MetOffice. Available online: https://www.metoffice.gov.uk/services/data/datapoint (accessed on 27 March 2023).
- StormGlass. Available online: https://stormglass.io/ (accessed on 27 March 2023).
- NATO. Development of Common Image Generator Interface (CIGI) V4. 0 Compliancy Testing Tools Final Report; NATO: Washington, DC, USA, 2018. [Google Scholar]
- Guardian UTM. Available online: https://www.altitudeangel.com/solutions/guardianutm-os (accessed on 27 March 2023).
- Thales Topsky. Available online: https://www.thalesgroup.com/en/topsky-atc (accessed on 27 March 2023).
- Unity Game Engine. Available online: https://unity.com/ (accessed on 27 March 2023).
- NETSIM Software. Available online: https://www.tetcos.com/ (accessed on 27 March 2023).
- Mast Data. Available online: ttps://www.mastdata.com/ (accessed on 27 March 2023).
- Barrado, C.; Boyero, M.; Brucculeri, L.; Ferrara, G.; Hately, A.; Hullah, P.; Martin-Marrero, D.; Pastor, E.; Rushton, A.P.; Volkert, A. U-space concept of operations: A key enabler for opening airspace to emerging low-altitude operations. Aerospace 2020, 7, 24. [Google Scholar] [CrossRef] [Green Version]
- Patel, K.K.; Desaulniers, G.; Lodi, A.; Lecue, F. Explainable prediction of Qcodes for NOTAMs using column generation. arXiv 2022, arXiv:2208.04955. [Google Scholar] [CrossRef]
- MongoDB Database. Available online: https://www.mongodb.com/ (accessed on 27 March 2023).
Figure 1.
Development process of the digital twin.

Figure 2.
Geographical Area of Interest.

Figure 3.
Architecture of the Digital Twin.

Figure 4.
Functional Architecture.

Figure 5.
The Digital Twin Logical Architecture.

Figure 6.
Map data sources.

Figure 7.
Three-dimensional Visualisation System.

Figure 8.
Communication Infrastructure.

Figure 9.
Radar communication path.

Figure 10.
Radar Server GNSS Surveillance.

Figure 11.
Airborne assets.

Figure 12.
Three-dimensional Visualisation of Cranfield airport.

Figure 13.
Control Station.

Figure 14.
Operator Interface.

Figure 15.
U-space Airspace [56].
Figure 15.
U-space Airspace [56].

Figure 16.
The light goods scenario. Copyright https://digimap.edina.ac.uk/help/copyright-and-licensing/acknowledgements/.
Figure 16.
The light goods scenario. Copyright https://digimap.edina.ac.uk/help/copyright-and-licensing/acknowledgements/.

Figure 17.
Agricultural (farm) inspection. Copyright https://digimap.edina.ac.uk/help/copyright-and-licensing/os_open_data_licence/.
Figure 17.
Agricultural (farm) inspection. Copyright https://digimap.edina.ac.uk/help/copyright-and-licensing/os_open_data_licence/.

Figure 18.
Implemented Simulation Services.

Figure 19.
Operation plan loaded on the Digital Twin Mission Planner.

Figure 20.
Planned operations for run #4 (Digital Twin flights only)—rejected flights in red.

Figure 21.
Proximity violation case.

Figure 22.
Number of drones in airspace (Run #1).

Figure 23.
Visualisation of planned drone operations.

Figure 24.
Variation of message throughput with time for Trial Run #1.

Figure 25.
Number of drones in airspace per time (run #8).

Figure 26.
Message throughput for GCS-SURV message interface.


Table 1.
Defined Use Cases.
| Use Case | Use Case | Operational Volume | Flight Conditions | CORUS Classification | Maximum Take-off Mass | Flight Scheduling | Responsibility Class |
|---|---|---|---|---|---|---|---|
| 1. Heavy Goods Delivery: Airport Cargo | Certified | Low | Nominal | X, Y, Z | 80 kg | Urgent | BVLOS |
| 2.Emergency services: Blue Light Services | Specific | Medium | Off-nominal | Z | 25 kg | Emergency service | EVLOS/BVLOS |
| 3. Agriculture | Specific | Specific | Medium | Nominal | X 25 kg | Scheduled | BVLOS |
| 4. Inspections: Linear Infrastructure | Specific | Medium | Nominal | X | 25 kg | Scheduled | BVLOS |
| 5. Security | Open/Specific | Low | Nominal | X, Y, Z | 25 kg | Scheduled (and as required) | BVLOS |
| 6. Aircraft Inspections | Specific | Low | Nominal | Z | 25 kg | Scheduled | VLOS/BVLOS |
| 7. Airport inspections | Specific | Very Low | Nominal | Z | 25 kg | Scheduled and Emergency | VLOS/BVLOS |
| 8. Urban planning: Traffic Analysis | Specific | Medium | Nominal | Z | 5 kg | Urgent | BVLOS |
| 9. Light Goods transport | Any airspace | Medium | Nominal | X, Y, Z | 25 kg | Scheduled with reduced notice | BVLOS |
| 10. Telecommunications | Open/Specific | Low | Off-Nominal | Z | 25 kg | Scheduled plus Urgent | VLOS/BVLOS |
Table 2.
Number of accepted and rejected flight plan.
| Run | Total Submitted Flights | Rejected Flight Plans | Accepted Flight Plans | % Acceptance |
|---|---|---|---|---|
| 1 | 8 | 0 | 8 | 100.00 |
| 2 | 3 | 0 | 3 | 100.00 |
| 3 | 10 | 1 | 9 | 90.00 |
| 4 | 10 | 3 | 7 | 70.00 |
| 5 | 22 | 5 | 17 | 77.27 |
| 6 | 75 | 57 | 18 | 24.00 |
Table 3.
Proximity results.
| Run | Collision (Proximity at 10 m) | Near Miss (Proximity at 30 m) | Incursion (Proximity at 60 m) | Min. Separation Distance (m) |
|---|---|---|---|---|
| 1 | 0 | 0 | 0 | 810.80 |
| 2 | 0 | 0 | 0 | No overlap |
| 3 | 0 | 0 | 0 | 369.53 |
| 4 | 0 | 1 | 0 | 22.98 |
| 5 | 1 | 0 | 0 | 0.26 |
| 6 | 0 | 0 | 0 | 2256.37 |
Table 4.
Number of drones per airspace.
| Run | Concurrent Drones in Operation | Accepted Flight Plans | Minimum Separation ( m) |
|---|---|---|---|
| 1 | 4 | 8 | 810.80 |
| 2 | 1 | 3 | No overlap |
| 3 | 3 | 9 | 369.53 |
| 4 | 4 | 7 | 22.98 |
| 5 | 7 | 17 | 0.26 |
| 6 | 5 | 18 | 2256.37 |
Table 5.
Message throughput results for selected interfaces.
| Run | Max Message throughput (GCS-SCR API) in msg/minute | Accepted Flight Plans | Max Message throughput (GCS-SURV API) in msg/minute | Max Message throughput (RemotelD-SURV API) in msg/minute |
|---|---|---|---|---|
| 1 | Not Applicable for X Airspace | 8 | 48 | 48 |
| 2 | 1 | 3 | 12 | 12 |
| 3 | 5 | 3 | 36 | 36 |
| 4 | 6 | 9 | 24 | 24 |
| 5 | 13 | 7 | 72 | 72 |
| 6 | 34 | 17 | 48 | 48 |
Table 6.
The traffic load for trial run #8.
| Run | Total Submitted Flights | Rejected Flight Plans | Accepted Flight Plans | % Acceptance |
|---|---|---|---|---|
| 8 | 75 | 56 | 19 | 25.33 |
Table 7.
Proximity analysis for trial runs.
| Run | Collision (Proximity at 10 m) | Near Miss (Proximity at 30 m) | Incursion (Proximity at 60 m) | Min. Separation Distance (m) |
|---|---|---|---|---|
| 7 | No | No | No | 2256.37 |
| 8 | No | No | No | 1646.28 |
Table 8.
Message throughput for run #8.
| Run | Max Message throughput (GCS-SCR API) in msg/minute | Accepted Flight Plans | Max Message throughput (GCS-SURV API) in msg/minute | Max Message throughput (RemotelD-SURV API) in msg/minute |
|---|---|---|---|---|
| 8 | 38 | 19 | 48 | Not available |
Disclaimer/Publisher’s Note: The statements, opinions and data contained in all publications are solely those of the individual author(s) and contributor(s) and not of MDPI and/or the editor(s). MDPI and/or the editor(s) disclaim responsibility for any injury to people or property resulting from any ideas, methods, instructions or products referred to in the content. |
© 2023 by the authors. Licensee MDPI, Basel, Switzerland. This article is an open access article distributed under the terms and conditions of the Creative Commons Attribution (CC BY) license (https://creativecommons.org/licenses/by/4.0/).
Share and Cite
MDPI and ACS Style
Souanef, T.; Al-Rubaye, S.; Tsourdos, A.; Ayo, S.; Panagiotakopoulos, D. Digital Twin Development for the Airspace of the Future. Drones 2023, 7, 484. https://doi.org/10.3390/drones7070484
AMA Style
Souanef T, Al-Rubaye S, Tsourdos A, Ayo S, Panagiotakopoulos D. Digital Twin Development for the Airspace of the Future. Drones. 2023; 7(7):484. https://doi.org/10.3390/drones7070484
Chicago/Turabian StyleSouanef, Toufik, Saba Al-Rubaye, Antonios Tsourdos, Samuel Ayo, and Dimitrios Panagiotakopoulos. 2023. "Digital Twin Development for the Airspace of the Future" Drones 7, no. 7: 484. https://doi.org/10.3390/drones7070484