
Impacts of Drone Flight Altitude on Behaviors and Species Identification of Marsh Birds in Florida

Fish and Wildlife Research Institute, Florida Fish and Wildlife Conservation Commission, Gainesville, FL 32601, USA
*
Author to whom correspondence should be addressed.
Drones 2023, 7(9), 584; https://doi.org/10.3390/drones7090584
Submission received: 23 August 2023
/
Revised: 13 September 2023
/
Accepted: 15 September 2023
/
Published: 16 September 2023
(This article belongs to the Special Issue Drone-Based Wildlife Protection, Monitoring, and Conservation Management)
Abstract
:Unmanned aerial vehicles (hereafter drones) are rapidly replacing manned aircraft as the preferred tool used for aerial wildlife surveys, but questions remain about which survey protocols are most effective and least impactful on wildlife behaviors. We evaluated the effects of drone overflights on nontarget species to inform the development of a Florida mottled duck (MODU; Anas fulvigula fulvigula) survey. Our objectives were to (1) evaluate the effect of flight altitude on the behavior of marsh birds, (2) evaluate the effect of altitude on a surveyor’s ability to identify the species of detected birds, and (3) test protocols for upcoming MODU surveys. We flew 120 continuously moving transects at altitudes ranging from 12 to 91 m and modeled variables that influenced detection, species identification, and behavior of nontarget species. Few marsh birds were disturbed during drone flights, but we were unable to confidently detect birds at the two highest altitudes, and we experienced difficulties identifying the species of birds detected in video collected at 30 m. Our findings indicate that MODUs could be surveyed at altitudes as low as 12–30 m with minimal impact to adjacent marsh birds and that larger-bodied nontarget marsh species can be identified from videos collected during MODU drone surveys.
1. Introduction
Manned aircraft (helicopters or fixed-wing aircraft) have been used for decades to conduct wildlife research, especially in hard-to-access locations. However, conducting research efforts using manned aircraft is the most dangerous workplace activity for wildlife biologists [1] because aircrafts generally need to be flown slowly and at low altitudes (i.e., 30 to 61 m above ground level [AGL]) when conducting wildlife research, which carries the risk of stalls, collisions with obstacles (e.g., powerlines and radio towers), and unpredictable turbulence [1]. Additionally, the high expense of surveys using manned aircraft can make it difficult to sustain the level of survey effort required to develop robust, long-term population trends. The recent advent and rapid development of affordable unmanned aerial vehicles (UAVs, hereafter drones) is transforming the wildlife research field because it eliminates the risks to biologists that are inherent to manned aircraft and provides substantial cost savings. Population surveys are benefiting tremendously from the implementation of drones, and drones are being used to study an ever-growing number of wildlife species [2,3,4,5,6]. One of the key advantages of drone-based surveys for population studies is that, unlike real-time tabular data commonly collected during traditional aerial or ground-based surveys, imagery and video obtained using a drone can be reviewed following a survey. Nevertheless, because the use of drones is in its infancy, careful consideration of study design is needed when developing drone survey protocols [7,8].
The accuracy of drone surveys may be affected by flight speed, altitude, camera type (thermal infrared vs. standard), camera settings (e.g., camera gimbal angle, frame rate, resolution), lens characteristics, weather conditions during a flight, the number and experience of observers reviewing footage, and numerous other factors [9,10]. Specifically, the altitude at which a drone flies when collecting video can significantly impact a researcher’s ability to detect and identify wildlife species in drone video, and optimal flight altitudes can vary significantly depending on the camera specifications. For example, during a study testing multiple drone camera systems, the flight altitude recommended to identify small waterbird species, such as ducks and grebes, varied from 45 m to below 30 m, depending on the specifications of the drone’s camera [11]. Flying transects at lower altitudes enables researchers to record wildlife in finer detail, but it comes with the trade-offs of reducing the cameras’ field of view (FOV) and increasing the likelihood of disturbing wildlife.
The behavioral responses of wildlife to drone overflights have been shown to be species-specific [5,12], habitat specific [13], seasonally dependent (e.g., breeding vs. non-breeding [14,15]), and impacted by a wide range of factors. Flight speed, altitude, drone shape, and the ascent (takeoff) and descent (landing) characteristics of a flight are the factors that may have the largest impact on wildlife behaviors. From an avian perspective, drone overflights can impact bird behaviors because some species may perceive drones as raptors, especially ones that are preyed upon by avian predators [2,16,17]. For example, drone shape and wing profile has been shown to influence waterfowl responses, with shapes that resemble the profile of a raptor having the greatest disturbance on wildlife [17]. Further, disturbance has been observed more frequently when drone banking maneuvers, takeoff, or landing occurred over or near a flock or individuals, and it has been postulated that birds may perceive these maneuvers as the swooping of a raptor [17]. For example, lekking prairie chickens (Tympanuchus spp.) are highly sensitive to drone overflights at altitudes between 25–100 m, and it was suggested that this is due to the fact that displaying birds are vulnerable to hawks [18]. When studying the escape responses of 22 avian species to drone flights, Weston et al. [5] observed that birds infrequently responded to drone takeoffs more than 40 m away from them. Vas et al. [19] reported that drones could be flown within 4 m of waterfowl (mallards [Anas platyrhynchos], wild flamingos [Phoenicopterus roseus], and common greenshanks [Tringa nebularia]) with minimal disturbance as long as the drone did not approach the bird from directly above [19]. When studying waterfowls, it was observed that when drones were flown at a speed of 20–25 km/h, birds were minimally impacted because the drone would pass the individual before it observed the drone [9]. Wildlife responses to overflights are not limited to evasive behaviors, and some bird species have been documented harassing, mobbing, or attacking drones mid-flight [20,21]. Drones are quieter than manned aircraft, but they may have a relatively greater impact on wildlife behaviors because they are commonly flown at lower altitudes, and their size and profile may more closely resemble avian predators.
Surveying marsh bird species has always been problematic due to logistical constraints such as access to wetland sites, the secretive nature of wetland bird species, and difficulties counting birds in large and complex water bodies [22]. However, the conservation challenges (e.g., habitat loss, water quality issues, and invasive species) facing many of Florida’s marsh bird species necessitate the development of accurate, repeatable, and cost-effective survey protocols to monitor populations in the long term [23]. One such species, the endemic Florida mottled duck (hereafter MODU; Anas fulvigula fulvigula), will be the target of an upcoming aerial population survey, where drone video will be collected at hundreds of wetland sites across peninsular Florida. The conservation challenges (i.e., loss of wetland habitats and hybridization with feral mallards [Anas platyrhynchos]) facing the MODU population and its popularity as a hunted species necessitate that this species be monitored regularly. In the past (1985–2009), the status of the MODU population was assessed annually during helicopter surveys, but because of the inability to differentiate between mottled ducks and the rapidly increasing populations of feral mallards (female) and hybrids (mallard X mottled duck) during aerial surveys, MODU populations have not been fully assessed since 2009. In 2020, state waterfowl biologists decided that a drone survey would be conducted to determine the MODU population status. Survey protocols were developed after a thorough literature review and tested during a small number of pilot flights. Before large-scale drone surveys can be implemented, it is important to determine if tentative MODU survey protocols are appropriate for the collection of high-quality data while also minimizing disturbance to vulnerable marsh bird species. When designing drone surveys, wildlife researchers have an obligation to identify methods that have minimal impacts on both the target species and nearby nontarget species [6]. Thus, the primary objectives of this study were to (1) evaluate the effect of flight altitude on the behavior of marsh bird species, (2) evaluate the effect of altitude on a reviewer’s ability to identify the species of detected birds in drone video, and (3) test and recommend survey protocols for upcoming MODU population surveys. MODUs will be surveyed every 3–4 years in the future, and the simultaneous collection of data for nontarget bird species could help to fill knowledge gaps for less studied marsh bird species.
2. Materials and Methods
We conducted this study at 10 wetland sites within four adjoining state-managed properties in east central Florida (Figure 1). Four wetland sites were in three properties owned and managed by the St. Johns River Water Management District (SJRWMD): the Fellsmere Water Management Area (n = 2), Blue Cypress Conservation Area (Kenansville Lake; n = 1) and Three Forks Conservation Area (n = 1). The remaining 6 wetland sites were in the T. M. Goodwin Waterfowl Management Area (TMGWMA), which is owned by the SJRWMD but managed by the Florida Fish and Wildlife Conservation Commission (FFWCC). The 2537-ha TMGWMA is Florida’s only waterfowl management area, and it is managed with a primary goal of providing high-quality habitat for waterfowl species. All four state-managed properties are floodplain restoration features and consist of wetlands that had been ditched and drained for cattle grazing or agricultural (citrus) production in the early 1900s and subsequently acquired by the SJRWMD and restored as palustrine wetlands in the 1980s. This land management history has led to high-quality wetland sites with accessible levees and roads and was a primary reason that these study areas were chosen.
At each property we first identified wetland sites that were accessible via roadways, dikes, or spillways and had about 1.5–2 km of shoreline access so that 12 flight transects, spaced > 160 m apart, could be flown perpendicularly from the road into the adjacent wetland. Most of the roadways in the study area ran in cardinal directions and starting points were spaced evenly across a 1.76 km segment of roadway. We conducted 120 flights in May 2020 with 12 transects flown at each of the 10 wetland sites. Three transects at each of 4 altitudes (12 m, 30 m, 61 m, and 91 m AGL) were flown at each site. A random number generator was used to determine the order in which the 12 transects were flown. Transects were flown in order of decreasing altitude starting with the three transects flown at the highest altitude and then continuing with the three transects at the next lowest altitude until all 12 transects were completed. The starting location for some transects was offset to the nearest suitable location if there was tall vegetation that significantly reduced the observer’s ability to monitor the drone. Flight transects were 400 m long and conducted at a continuous speed of 3.5 m/s. We chose a 400 m transect length because it was the near maximum distance at which the drone could be flown while remaining in the drone observer’s visual line of sight. Transects were only flown when wind speeds were less than 24.1 km/h (6.7 m/s).
Drone flight protocols (i.e., speed, morning flight times, and launching protocols) and camera settings (i.e., gimbal pitch angle, video frame rate, aperture, shutter speed, and video resolution) used for this study followed protocols that have been tentatively identified for an upcoming MODU survey and are described below. We used a DaJiang Innovations Mavic 2 Zoom (DJI, Nanshan District, Shenzhen, China) for all flights. This quadcopter has a 1/2.3-inch 12 MP camera sensor with a 2× optical zoom (24–48 mm) enabling it to take high-quality photos and videos. The camera can record video at 4 K (3840 × 2160 pixels; 24–30 frames per second [fps]), 2.7 K (2688 × 1512 pixels; 24–60 fps), and full high-definition (FHD; 1920 × 1080 pixels; 24–120 fps) resolution. Additionally, the Mavic 2 Zoom has low-noise propellers and is one of the more commonly used drones in the wildlife research field. We used the Litchi flight-planning application to preplan and implement autonomous flights. Preplanning flights in the office reduced the amount of time that the flight crew was at transect starting points, thereby limiting the possibility that flight crews would disturb birds. Transects were flown at a continuous speed and altitude so that the drone’s flight characteristics did not resemble the flight pattern of a raptor. Flight crews consisted of two people: one drone operator and one observer. When each flight started, the field crew measured and recorded the wind speed and percent of cloud cover.
The drone camera was set to a frame rate of 60 fps, −45° gimbal pitch angle, aperture F8, 24 mm focal length, and FHD video resolution. Camera exposure values (EV) and shutter speeds for each flight varied depending on lighting conditions, but a negative EV of −1.0 was often used. We collected video and not still imagery so that observers could slow or pause videos when bird features were unclear. A −45° downward gimbal pitch angle was chosen because this angle provides the best views of waterfowl from the side and above [9]. Additionally, pitching the camera at a −45° angle, instead of straight downward, increases the amount of time that a bird can be observed in video. We recorded videos at a high frame rate (60 fps) so that observers could view detected birds in numerous frames, if needed. We flew transects only between 1 h after official sunrise and 11:00 a.m. to limit the glare caused by sunlight reflecting off the water at mid-day.
For the video review, we used a double observer approach, where two observers independently reviewed flight video to identify species and classify reactions. Both observers were highly experienced avian biologists, and they have each worked with wetland bird species for more than 10 years. When a bird was detected in the video, it was closely observed to determine if it reacted to the drone overhead and its behavioral response was classified into one of five behaviors: no reaction, alert, walks/swims slowly, runs/swims quickly, and flies/flushes. Some birds flew through or flew into the camera’s FOV when a drone passed over, and they were recorded as thus. Examples of single frames from drone video collected at 12 m and 30 m AGL have been included in Figure 2.
Observers attempted to identify the species of all birds detected. If the species of a bird could not be identified, it was classified into one of six guild-specific unknown classes (Unknown Passerine, Unknown Rail, Unknown Shorebird, Unknown Wading Bird [Large], Unknown Wading Bird [Small], and Unknown Waterfowl and Diving Bird), if possible. Bird species were grouped into these 6 guilds based on ecological similarities and these guilds have been used in similar marsh bird studies [24,25]. If both the species and guild of a bird could not be identified, then it was classified into a general unknown category (Unknown [General]). Preliminary viewing of the two higher flight altitudes (61 m and 91 m) indicated a lack of resolution necessary to detect and identify birds’ species or to score their behaviors, so we discarded these data and considered the altitudes too high to be useful for our objectives.
We fit a mixed effects logistic regression model to determine if observer identity, altitude, and bird guild impacted behavioral reactions. The 5 behavioral reactions were reclassified as a binomial response where a one indicated that a bird reacted (alert, walk swims slowly, runs swims quickly, flies/flushes) and a zero indicated that a bird did not react to the drone. Birds that flew through or flew into the cameras field during sampling were removed from this analysis because these individuals did not have a classified behavioral reaction. Altitude was categorized as two groups (12 m and 30 m) and guild included six categories: Passerine, Rail, Shorebird, General Unknown, Small Wading Bird, Large Wading Bird, and Waterfowl and Diving Bird. Observer (Observer 1 or 2) was also included as a fixed effect in the models to evaluate differences in observer detections and account for pseudo-replication as most birds would have been detected by both observers. Flight transect identity was added as a random intercept in the model to describe repeated observations and variation in conditions of each flight.
Two additional mixed effects logistic regression models were fit to determine if altitude influenced the probability of classifying a bird into the general unknown category (guild and species unknown) and an overall unknown category (birds detected during a flight that could not be identified as to species). Probabilities were considered the outcome of multiple binomial trials within each transect. We accounted for variability within sites by including a random intercept of wetland site identity.
All analyses were completed using the ‘lme4’ package [26] in R v4.3.0 [27] and fit for each model was confirmed through residual diagnostics on scaled residuals using a simulation approach with the DHARMa package [28]. All statistical models fit the data well. Collinearity among predictors were calculated using generalized variance inflation factors (GVIFs), which indicated no collinearity among predictors [29]. We used ANOVA from the “car” package [30] to determine significance of predictors for each model. If differences existed between the means of categorical predictors, we proceeded with post hoc pair-wise comparisons using the emmeans package [31] with a false discovery rate adjustment [32].
3. Results
Both observers independently reviewed drone video from 60 flights, 30 at the 12 m altitude and 30 at the 30 m altitude. At least one bird was detected in 22 (73.3%) of the transects flown at 12 m and 20 (66.7%) of the transects flown at 30 m. At the 12 m altitude, Observer 1 detected 127 birds and Observer 2 detected 118 birds, a difference of 7.3%. At the 30 m altitude, Observer 1 detected 111 birds and Observer 2 detected 93 birds, differing by 17.6% (Table 1).
Of 449 total detections by the two observers, 82 (18.3%) detections were of birds flying into or through the drones’ FOV during a flight and, thus, were not classified into a behavioral category. Overall, birds were observed reacting to drones during 49 (13.4%) of the 367 detections with a classified reaction. Birds were observed reacting to drones during 29 (12.8%) detections at the 12 m altitude and 20 (14.3%) detections at the 30-m-altitude (Table 2). Of the 49 total detections where a behavioral reaction was observed during an overflight, 1 bird became alert, 43 flew or flushed, 1 ran or swam quickly away, and 4 walked or swam slowly away.
There was no difference in recorded bird behavioral reactions between observers ( = 0.11, p = 0.75; βobserver = −0.12 ± 0.38), and altitude did not influence bird behavioral reactions ( = 0.12, p = 0.73; βaltitude = 0.37 ± 1.05). Significant differences existed in bird behavioral reactions across guilds ( = 17.18, p = 0.01), where passerines reactional responses differed significantly from rails (z = −3.30; p = 0.02), small wading birds (z = −2.51; p = 0.04), large wading birds (z = −2.69; p = 0.04), and general unknowns (z= −2.98; p = 0.03). Differences in reactional responses also existed between shorebirds and rails (z = 2.68; p = 0.04) and shorebirds and general unknowns (z = −2.61; p = 0.04; Figure 3).
Most detected birds were identified to species or guild, but general unknowns were common, especially at the 30 m altitude. The sum of the six guild unknown categories and 1 general unknown category constituted 74 (30.2%) of 245 total detections at the 12 m altitude and 120 (58.8%) of 204 total detections at the 30 m altitude. Flight altitude significantly impacted the proportion of birds detected during a transect that were classified into the general unknown category (guild and species unknown; = 32.12, p < 0.001; βaltitude = 1.91 ± 0.34; Figure 4A) and the proportion of birds detected during a flight that could not be identified (sum of all seven unknown categories; = 37.55; p < 0.001; βaltitude = 1.19 ± 0.20; Figure 4B). For transects with one or more total bird detections, the proportion of total observations where observers could not identify the species but could identify the species guild was greater at 30 m (sample mean: 0.24 [±0.06 SE]; n = 20) than at 12 m (sample mean: 0.11 [±0.06 SE]; n = 22). Similarly, for transects with one or more total bird detections, the proportion of birds observed during a flight that could not be identified as to species (sum of all seven unknown categories) was greater at 30 m (sample mean: 0.44 [±0.07 SE]; n = 20) than at 12 m (sample mean: 0.26 [±0.06 SE]; n = 22).
4. Discussion
We observed that few marsh birds were disturbed during preprogrammed autonomous drone overflights flown at a continuous speed and altitude, even at flight altitudes as low as 12 m. We were unable to detect or identify the species of birds observed at the two higher flight altitudes (61 m and 91 m), and we experienced difficulties identifying bird species at the 30 m altitude. At the lowest altitude (12 m), we were able to identify most birds according to species, or at least guild, and there was only a small (7.3%) difference in the total number of birds detected between observers. Our results indicate that upcoming MODU survey flights can be flown at an altitude as low as 12 m and still have minimal impacts on marsh bird behaviors. An important caveat to this flight altitude is that we did not fly near active nests, wading bird colonies, or birds caring for young, consistent with the State of Florida’s prohibition of unpermitted operation of drones within 61 m of active nests of state-threatened wading bird species [33]. The rule is based on the extensive literature describing the risk of disturbance to nesting birds and we strongly recommend that surveyors conduct sufficient pre-flight scouting to avoid flying near known nests of any species, especially of colonial nesters. Finally, video collected during upcoming MODU surveys may also provide valuable presence–absence data for some nontarget marsh bird species, especially larger-bodied ones.
Overall, few marsh birds were disturbed by drone overflights, and we did not detect a significant difference in behavioral reactions between the two lower altitudes, which indicates that drone overflights can be flown at 12 m, as long as the drone is flown at a continuous speed and altitude. In a similar study of 16 waterbird species in Australia, it was reported that birds infrequently responded to overhead drone flights at altitudes between 20 and 80 m, and if a behavioral response was detected, they primarily responded through increased vigilance and not by flying, flushing, or swimming away from the drone [34]. As state wildlife biologists, we have an obligation to minimize negative impacts to target and nontarget wildlife and our findings justify the use of drones in wetland habitats. Interestingly, we did observe some differences in behavioral reactions between the bird guilds. This trend has been reported in similar drone studies, with some species of birds reacting more strongly to drone overflights than others. For example, when studying waterbirds, ducks were less likely to react negatively to drones than gulls that were inhabiting the same habitat [12]. In our study, smaller-bodied species in the passerine and shorebird guilds were more likely to exhibit behavioral reactions to drone overflights. It is possible that smaller bird species are more likely to react to drone overflights because they have a higher risk of being preyed upon by raptors than the larger-bodied bird species. It could have also been possible that we were more likely to detect passerines when they were moving or fleeing from the drones versus when they were immobile and that this skewed our results.
We were able to identify the species of most of the birds detected at the 12 m altitude, but at 30 m we were able to identify the species for only 41.2% of the birds detected. This indicates that little usable data on target and nontarget marsh bird species can be obtained from video collected at altitudes of 30 m and above, and upcoming mottled duck surveys can be flown at an altitude as low as 12 m to increase the probability that a bird is detected and identified. However, a 12 m flight altitude should only be considered when surveying in open wetland habitats with few trees taller than 12 m. Some tree species, especially oaks (Quercus spp.) and pine trees (bald cypress [Taxodium distichum] and longleaf pine [Pinus palustris]) are found at the edge of wetlands in Florida and these species commonly exceed 12 m in height. Most modern drones are equipped with obstacle avoidance systems, but these systems can be unreliable, and drones will often return home if an alternative route cannot be identified around an obstacle. An altitude of 20 m may be more feasible when surveying wetland sites that cannot be scouted to identify tall obstacles (i.e., trees and power lines) before planning and conducting flight transects. Surprisingly, we did not detect any MODUs even though individuals of this species are commonly observed in the wetland sites we sampled, and our study area is one of the primary sites where MODUs are captured and banded annually by state biologists.
When trying to detect and identify birds in drone imagery at an altitude of 30 m, we experienced similar difficulties documented in other avian studies. For example, in Kansas rangelands, researchers, using drones to study lekking prairie-chickens at three altitudes (25, 60, and 100 m), found that only 40% of the birds seen in person from ground blinds were detected when reviewing drone video, on average [18]. When using decoys of four waterbird species to study factors that may impact bird detection within mosaicked drone imagery, it was observed that species with dark plumage (i.e., black skimmers [Rynchops niger]) were difficult to detect and it was postulated that they may have been mistaken as shadows [35]. Similarly, Chabot and Bird [36] observed that it was harder to detect Canada Geese (Branta canadensis) than Snow Geese (Chen caerulescens) because their plumage did not contrast as well with the ground, making it more difficult to detect them in drone imagery. In our study, we anecdotally observed a similar trend where smaller or more heavily camouflaged bird species were harder to detect and identify at both altitudes, especially when they were immobile. For example, we were unable to identify the species of many of the small passerines and shorebirds that we detected, but we were able identify the large and brightly colored wading bird species. We postulate that MODU survey video would not provide reliable presence–absence data for small-bodied passerines or shorebirds, but it may offer high-quality data for large-bodied marsh bird species, especially large wading birds.
It is possible that we would have been able to identify the species of a larger proportion of the birds detected in video collected at the three higher altitudes if we had set the camera focal length to 48 mm (full zoom) instead of 24 mm or collected video at a higher resolution (i.e., 2.7 K or 4 K). By adjusting the focal length and video resolution, we would have decreased the ground sampling distance (GSD), the distance between adjacent pixel centers measured on the ground, by over half and increased the spatial resolution of the video, making it sharper and more finely detailed. When developing the survey protocols that we tested in this study, we followed camera system guidelines recommended in similar studies. For example, when studying waterfowl, researchers tested four drone camera systems and found that only the two cameras with a GSD of 0.55 cm/pixel (80 mm lens; 50-megapixel sensor) or 0.72 cm/pixel (50–70 mm lens; 36-megapixel sensor) provided images where waterfowl could be accurately identified at a 50–60 m flight altitude [17]. Similarly, Drever et al. [12] stated that a GSD of ~1 cm/pixel was needed to identify waterfowl and waterbirds. Although it is difficult to calculate the exact GSD for our study because the drone cameras were pitched at an angle of −45°; if the drone camera had been pointed straight downwards (nadir), the GSD would have been 0.21 cm/pixel at 12 m and 0.54 cm/pixel at 30 m. Even with a lower GSD than what has proven successful in similar studies, we were unable to identify the species of most of the birds detected at the 30 m altitude. By increasing the lens focal length (zooming) from 24 mm to 48 mm (full zoom), we could have significantly increased the spatial resolution of our video; however, the camera’s FOV would have decreased from 83° to 48° and the width of the survey transect would have been reduced by nearly half. With a smaller FOV, we would have to increase the number of transects needed to fully survey a wetland.
For future MODU surveys, we suggest adjusting current survey protocols to record video at 2.7 K or 4 K resolution instead of FHD, which would decrease the GSD and thus increase the spatial resolution of the collected video. We would recommend always collecting video at a 4 K resolution, but most drones’ cameras are capable of collecting 4 K video at a frame rate of only 30 fps while it can collect 2.7 K video at 60 fps. Researchers surveying marsh birds should collect video at the highest possible resolution while preserving a frame rate high enough to meet their objectives. Additionally, our camera shutter speeds varied based on the ambient light conditions during a flight. When researching MODU and other marsh birds, camera shutter speeds should be set as fast as ambient light conditions will allow. Although a fast shutter speed makes a video appear choppier when viewing, when compared to a slower shutter speed, each frame within the video will be sharper. When a camera is set to collect video at slower shutter speeds, a single frame will be blurred when the video is paused, which makes it harder to identify birds according to species. Finally, if researchers are specifically surveying a smaller-bodied marsh bird species at an altitude of 12 m, then they would likely need to increase the camera’s focal length (zoom) to increase detection probability.
One limitation of our study was that transects were flown at a single speed (3.5 m/s) and with a constant camera pitch angle (−45°) and focal length (24 mm). We decided to conduct the flights at only one speed and with limited camera settings to minimize the complex and confounding effects that flight characteristics and camera settings may have on species disturbance and detection. Instead, we investigated varying flight altitudes, which have been shown in other studies to have the greatest impact on disturbance because investigating the effects of drones on marsh bird disturbance was the primary objective of this study. Further, the flight speed and camera gimbal angle settings used in this study have been used in similar studies [9]. A final limitation of our study was that our sample sizes were relatively small, and we recommend expanding this research in the future, especially if researchers wish to use drone video from MODU surveys to answer ecological questions about other nontarget species. We recommend expanding this survey to include other wetland types (e.g., lacustrine, riverine, estuarine, and marine) found throughout Florida as slight differences in the wetland vegetation structure could impact bird behavioral responses and detection. Finally, we advise testing different drone camera settings (e.g., focal length, video resolution, and frame rate) that may improve the identification of smaller and harder to detect bird species.
The drone flights in our study were preprogrammed, autonomous, and flown at a continuous speed and altitude, and our results are applicable only to this flight pattern. Our drones would have likely had a greater impact on behaviors if we had hovered over or dropped to lower altitudes to better count or identify detected marsh birds during flights. By flying at a constant speed and altitude, our drone’s flight pattern did not resemble the flight behaviors of a raptor. Additionally, we conducted drone flights during spring (May) when birds, especially waterfowl, would be more commonly found in breeding pairs or with broods than in large groups. Birds may be more likely to flush when in large groups, and researchers should be careful when surveying large congregations of birds, especially during seasons when birds are nesting.
5. Conclusions
Our findings indicate that future MODU drone surveys could be flown at altitudes as low as 12 m with minimal impact to adjacent marsh birds. Further, larger-bodied nontarget marsh species can be identified in video collected during MODU drone surveys, and this data could be used to answer questions related to understudied wetland bird species. Finally, we recommend that researchers who wish to use drones to survey smaller-bodied marsh birds first conduct pilot surveys to test flight protocols and camera settings that would enable accurate detection and identification.
Author Contributions
Conceptualization, R.R.B. and W.A.C.; methodology, R.R.B., W.A.C., A.L.S. and J.P.O.; software, R.R.B. and W.A.C.; validation, J.P.O., W.A.C. and R.R.B.; formal analysis, A.L.S. and J.P.O.; investigation, J.P.O., W.A.C. and R.R.B.; resources, R.R.B.; data curation, R.R.B., W.A.C., A.L.S. and J.P.O.; writing—original draft preparation, J.P.O.; writing—review and editing, W.A.C., R.R.B. and A.L.S.; visualization, J.P.O. and A.L.S.; supervision, W.A.C.; project administration, R.R.B. and W.A.C.; funding acquisition, R.R.B. and W.A.C. All authors have read and agreed to the published version of the manuscript.
Funding
This research was funded by Florida’s State Game Trust Fund.
Institutional Review Board Statement
Survey protocols were reviewed and approved by the Florida Fish and Wildlife Conservation Commission.
Informed Consent Statement
Not applicable.
Data Availability Statement
The data presented here are available upon reasonable request to the corresponding author.
Acknowledgments
We would like to thank B. Bankovich for assisting with GIS efforts. Additionally, we would like to thank the land managing agencies and property managers that permitted us access to wetland sites. Finally, we would like to thank A. Fanning and M. McBride for their assistance with funding acquisition, project development, and field efforts.
Conflicts of Interest
The authors declare no conflict of interest.
References
- Sasse, D.B. Job-Related Mortality of Wildlife Workers in the United States, 1937–2000. Wildl. Soc. Bull. 2003, 31, 1015–1020. [Google Scholar]
- Christie, K.S.; Gilbert, S.L.; Brown, C.L.; Hatfield, M.; Hanson, L. Unmanned Aircraft Systems in Wildlife Research: Current and Future Applications of a Transformative Technology. Front. Ecol. Environ. 2016, 14, 241–251. [Google Scholar] [CrossRef]
- Bushaw, J.D.; Ringelman, K.M.; Rohwer, F.C. Applications of Unmanned Aerial Vehicles to Survey Mesocarnivores. Drones 2019, 3, 28. [Google Scholar] [CrossRef]
- Hodgson, J.C.; Mott, R.; Baylis, S.M.; Pham, T.T.; Wotherspoon, S.; Kilpatrick, A.D.; Raja Segaran, R.; Reid, I.; Terauds, A.; Koh, L.P. Drones Count Wildlife More Accurately and Precisely than Humans. Methods Ecol. Evol. 2018, 9, 1160–1167. [Google Scholar] [CrossRef]
- Weston, M.A.; O’Brien, C.; Kostoglou, K.N.; Symonds, M.R.E. Escape Responses of Terrestrial and Aquatic Birds to Drones: Towards a Code of Practice to Minimize Disturbance. J. Appl. Ecol. 2020, 57, 777–785. [Google Scholar] [CrossRef]
- Borrelle, S.B.; Fletcher, A.T. Will Drones Reduce Investigator Disturbance to Surface-Nesting Seabirds? Mar. Ornithol. 2017, 45, 89–94. [Google Scholar]
- Brack, I.V.; Kindel, A.; Oliveira, L.F.B. Detection Errors in Wildlife Abundance Estimates from Unmanned Aerial Systems (UAS) Surveys: Synthesis, Solutions, and Challenges. Methods Ecol. Evol. 2018, 9, 1864–1873. [Google Scholar] [CrossRef]
- Brack, I.V.; Kindel, A.; de Oliveira, L.F.B.; Lahoz-Monfort, J.J. Optimally Designing Drone-Based Surveys for Wildlife Abundance Estimation with N-Mixture Models. Methods Ecol. Evol. 2023, 13, 898–910. [Google Scholar] [CrossRef]
- Dundas, S.J.; Vardanega, M.; O’Brien, P.; McLeod, S.R. Quantifying Waterfowl Numbers: Comparison of Drone and Ground-Based Survey Methods for Surveying Waterfowl on Artificial Waterbodies. Drones 2021, 5, 5. [Google Scholar] [CrossRef]
- Whitworth, A.; Pinto, C.; Ortiz, J.; Flatt, E.; Silman, M. Flight Speed and Time of Day Heavily Influence Rainforest Canopy Wildlife Counts from Drone-Mounted Thermal Camera Surveys. Biodivers Conserv. 2022, 31, 3179–3195. [Google Scholar] [CrossRef]
- Dulava, S.; Bean, W.T.; Richmond, O.M.W. Environmental Reviews and Case Studies: Applications of Unmanned Aircraft Systems (UAS) for Waterbird Surveys. Environ. Pract. 2015, 17, 201–210. [Google Scholar] [CrossRef]
- Drever, M.C.; Chabot, D.; O’Hara, P.D.; Thomas, J.D.; Breault, A.; Millikin, R.L. Evaluation of an Unmanned Rotorcraft to Monitor Wintering Waterbirds and Coastal Habitats in British Columbia, Canada. J. Unmanned Veh. Sys. 2015, 3, 256–267. [Google Scholar] [CrossRef]
- Jarrett, D.; Calladine, J.; Cotton, A.; Wilson, M.W.; Humphreys, E. Behavioural Responses of Non-Breeding Waterbirds to Drone Approach Are Associated with Flock Size and Habitat. Bird Study 2020, 67, 190–196. [Google Scholar] [CrossRef]
- Mulero-Pázmány, M.; Jenni-Eiermann, S.; Strebel, N.; Sattler, T.; Negro, J.J.; Tablado, Z. Unmanned Aircraft Systems as a New Source of Disturbance for Wildlife: A Systematic Review. PLoS ONE 2017, 12, e0178448. [Google Scholar] [CrossRef]
- de Leija, A.C.; Mirzadi, R.E.; Randall, J.M.; Portmann, M.D.; Mueller, E.J.; Gawlik, D.E. A Meta-Analysis of Disturbance Caused by Drones on Nesting Birds. J. Field Ornithol. 2023, 94, 1–16. [Google Scholar] [CrossRef]
- Jones, G.P.; Pearlstine, L.G.; Percival, H.F. An Assessment of Small Unmanned Aerial Vehicles for Wildlife Research. Wildl. Soc. Bull. 2006, 34, 750–758. [Google Scholar] [CrossRef]
- McEvoy, J.F.; Hall, G.P.; McDonald, P.G. Evaluation of Unmanned Aerial Vehicle Shape, Flight Path and Camera Type for Waterfowl Surveys: Disturbance Effects and Species Recognition. PeerJ 2016, 4, e1831. [Google Scholar] [CrossRef]
- Augustine, J.K.; Burchfield, D. Evaluation of Unmanned Aerial Vehicles for Surveys of Lek-Mating Grouse. Wildl. Soc. Bull. 2022, 46, e1333. [Google Scholar] [CrossRef]
- Vas, E.; Lescroël, A.; Duriez, O.; Boguszewski, G.; Grémillet, D. Approaching Birds with Drones: First Experiments and Ethical Guidelines. Biol. Lett. 2015, 11, 20140754. [Google Scholar] [CrossRef]
- Mesquita, G.P.; Rodríguez-Teijeiro, J.D.; Wich, S.A.; Mulero-Pázmány, M. Measuring Disturbance at Swift Breeding Colonies Due to the Visual Aspects of a Drone: A Quasi-Experiment Study. Curr. Zool. 2021, 67, 157–163. [Google Scholar] [CrossRef]
- Brisson-Curadeau, É.; Bird, D.; Burke, C.; Fifield, D.A.; Pace, P.; Sherley, R.B.; Elliott, K.H. Seabird Species Vary in Behavioural Response to Drone Census. Sci. Rep. 2017, 7, 17884. [Google Scholar] [CrossRef] [PubMed]
- Conway, C.J.; Gibbs, J.P. Summary of Intrinsic and Extrinsic Factors Affecting Detection Probability of Marsh Birds. Wetlands 2011, 31, 403–411. [Google Scholar] [CrossRef]
- Ogden, J.C.; Baldwin, J.D.; Bass, O.L.; Browder, J.A.; Cook, M.I.; Frederick, P.C.; Frezza, P.E.; Galvez, R.A.; Hodgson, A.B.; Meyer, K.D.; et al. Waterbirds as Indicators of Ecosystem Health in the Coastal Marine Habitats of Southern Florida: 1. Selection and Justification for a Suite of Indicator Species. Ecol. Indic. 2014, 44, 148–163. [Google Scholar] [CrossRef]
- Epstein, M.B. Waterbird Use of a Coastal Beach at Merritt Island National Wildlife Refuge, Florida. Fla. Sci. 2016, 79, 28–38. [Google Scholar]
- Epstein, M.; Joyner, R. Waterbird Use of Brackish Wetlands Managed for Waterfowl. In Proceedings of the Southeastern Association of Fish and Wildlife Agencies, Hilton Head Island, SC, USA, 6–9 November 1988; Volume 42, pp. 476–490. [Google Scholar]
- Bates, D.; Maechler, M.; Bolker, B.; Walker, S.; Christensen, R.H.B.; Singmann, H.; Dai, B.; Scheipl, F.; Grothendieck, G.; Green, P.; et al. Lme4: Linear Mixed-Effects Models Using “Eigen” and S4 2022. Available online: https://cran.r-project.org/web/packages/lme4/index.html (accessed on 10 May 2023).
- R Core Team R: A Language and Environment for Statistical Computing. 2023. Available online: https://www.r-project.org/ (accessed on 1 May 2023).
- Hartig, F.; Lohse, L. DHARMa: Residual Diagnostics for Hierarchical (Multi-Level/Mixed) Regression Models 2022. Available online: https://cran.r-project.org/web/packages/DHARMa/index.html (accessed on 5 May 2023).
- Fox, J.; Weisberg, S. An R Companion to Applied Regression, 3rd ed.; Sage Publications Ltd.: Thousand Oaks, CA, USA, 2019. [Google Scholar]
- Fox, J.; Weisberg, S.; Price, B.; Adler, D.; Bates, D.; Baud-Bovy, G.; Bolker, B.; Ellison, S.; Firth, D.; Friendly, M.; et al. Car: Companion to Applied Regression 2023. Available online: https://cran.r-project.org/web/packages/car/index.html (accessed on 6 May 2023).
- Lenth, R.V.; Buerkner, P.; Giné-Vázquez, I.; Herve, M.; Jung, M.; Love, J.; Miguez, F.; Riebl, H.; Singmann, H. Emmeans: Estimated Marginal Means, Aka Least-Squares Means 2023. Available online: https://cran.r-project.org/web/packages/emmeans/index.html (accessed on 20 August 2023).
- Pike, N. Using False Discovery Rates for Multiple Comparisons in Ecology and Evolution. Methods Ecol. Evol. 2011, 2, 278–282. [Google Scholar] [CrossRef]
- Florida Fish and Wildlife Conservation Commission Species Conservation Measures and Permitting Guidelines: Little Blue Heron, Reddish Egret, Roseate Spoonbill, Tricolored Heron; Florida Fish and Wildlife Conservation Commission. 2018, p. 35. Available online: https://myfwc.com/wildlifehabitats/wildlife/species-guidelines/ (accessed on 15 April 2023).
- Howell, L.; Allan, B.; Driscoll, D.; Doran, T.; Weston, M. Attenuation of Responses of Waterbirds to Repeat Drone Surveys Involving a Sequence of Altitudes and Drone Types: A Case Study. Drones 2023, 7, 497. [Google Scholar] [CrossRef]
- Barr, J.R.; Green, M.C.; DeMaso, S.J.; Hardy, T.B. Detectability and Visibility Biases Associated with Using a Consumer-Grade Unmanned Aircraft to Survey Nesting Colonial Waterbirds. J. Field Ornithol. 2018, 89, 242–257. [Google Scholar] [CrossRef]
- Chabot, D.; Bird, D.M. Evaluation of an Off-the-Shelf Unmanned Aircraft System for Surveying Flocks of Geese. Waterbirds 2012, 35, 170–174. [Google Scholar] [CrossRef]
Figure 1.
Map of the study area in Florida showing the wetlands sites, managed by the St. Johns River Water Management District (SJRWMD) and the Florida Fish and Wildlife Conservation Commission (FFWCC), where 120 drone transects were flown at 10 wetland sites in 2020.
Figure 1.
Map of the study area in Florida showing the wetlands sites, managed by the St. Johns River Water Management District (SJRWMD) and the Florida Fish and Wildlife Conservation Commission (FFWCC), where 120 drone transects were flown at 10 wetland sites in 2020.

Figure 2.
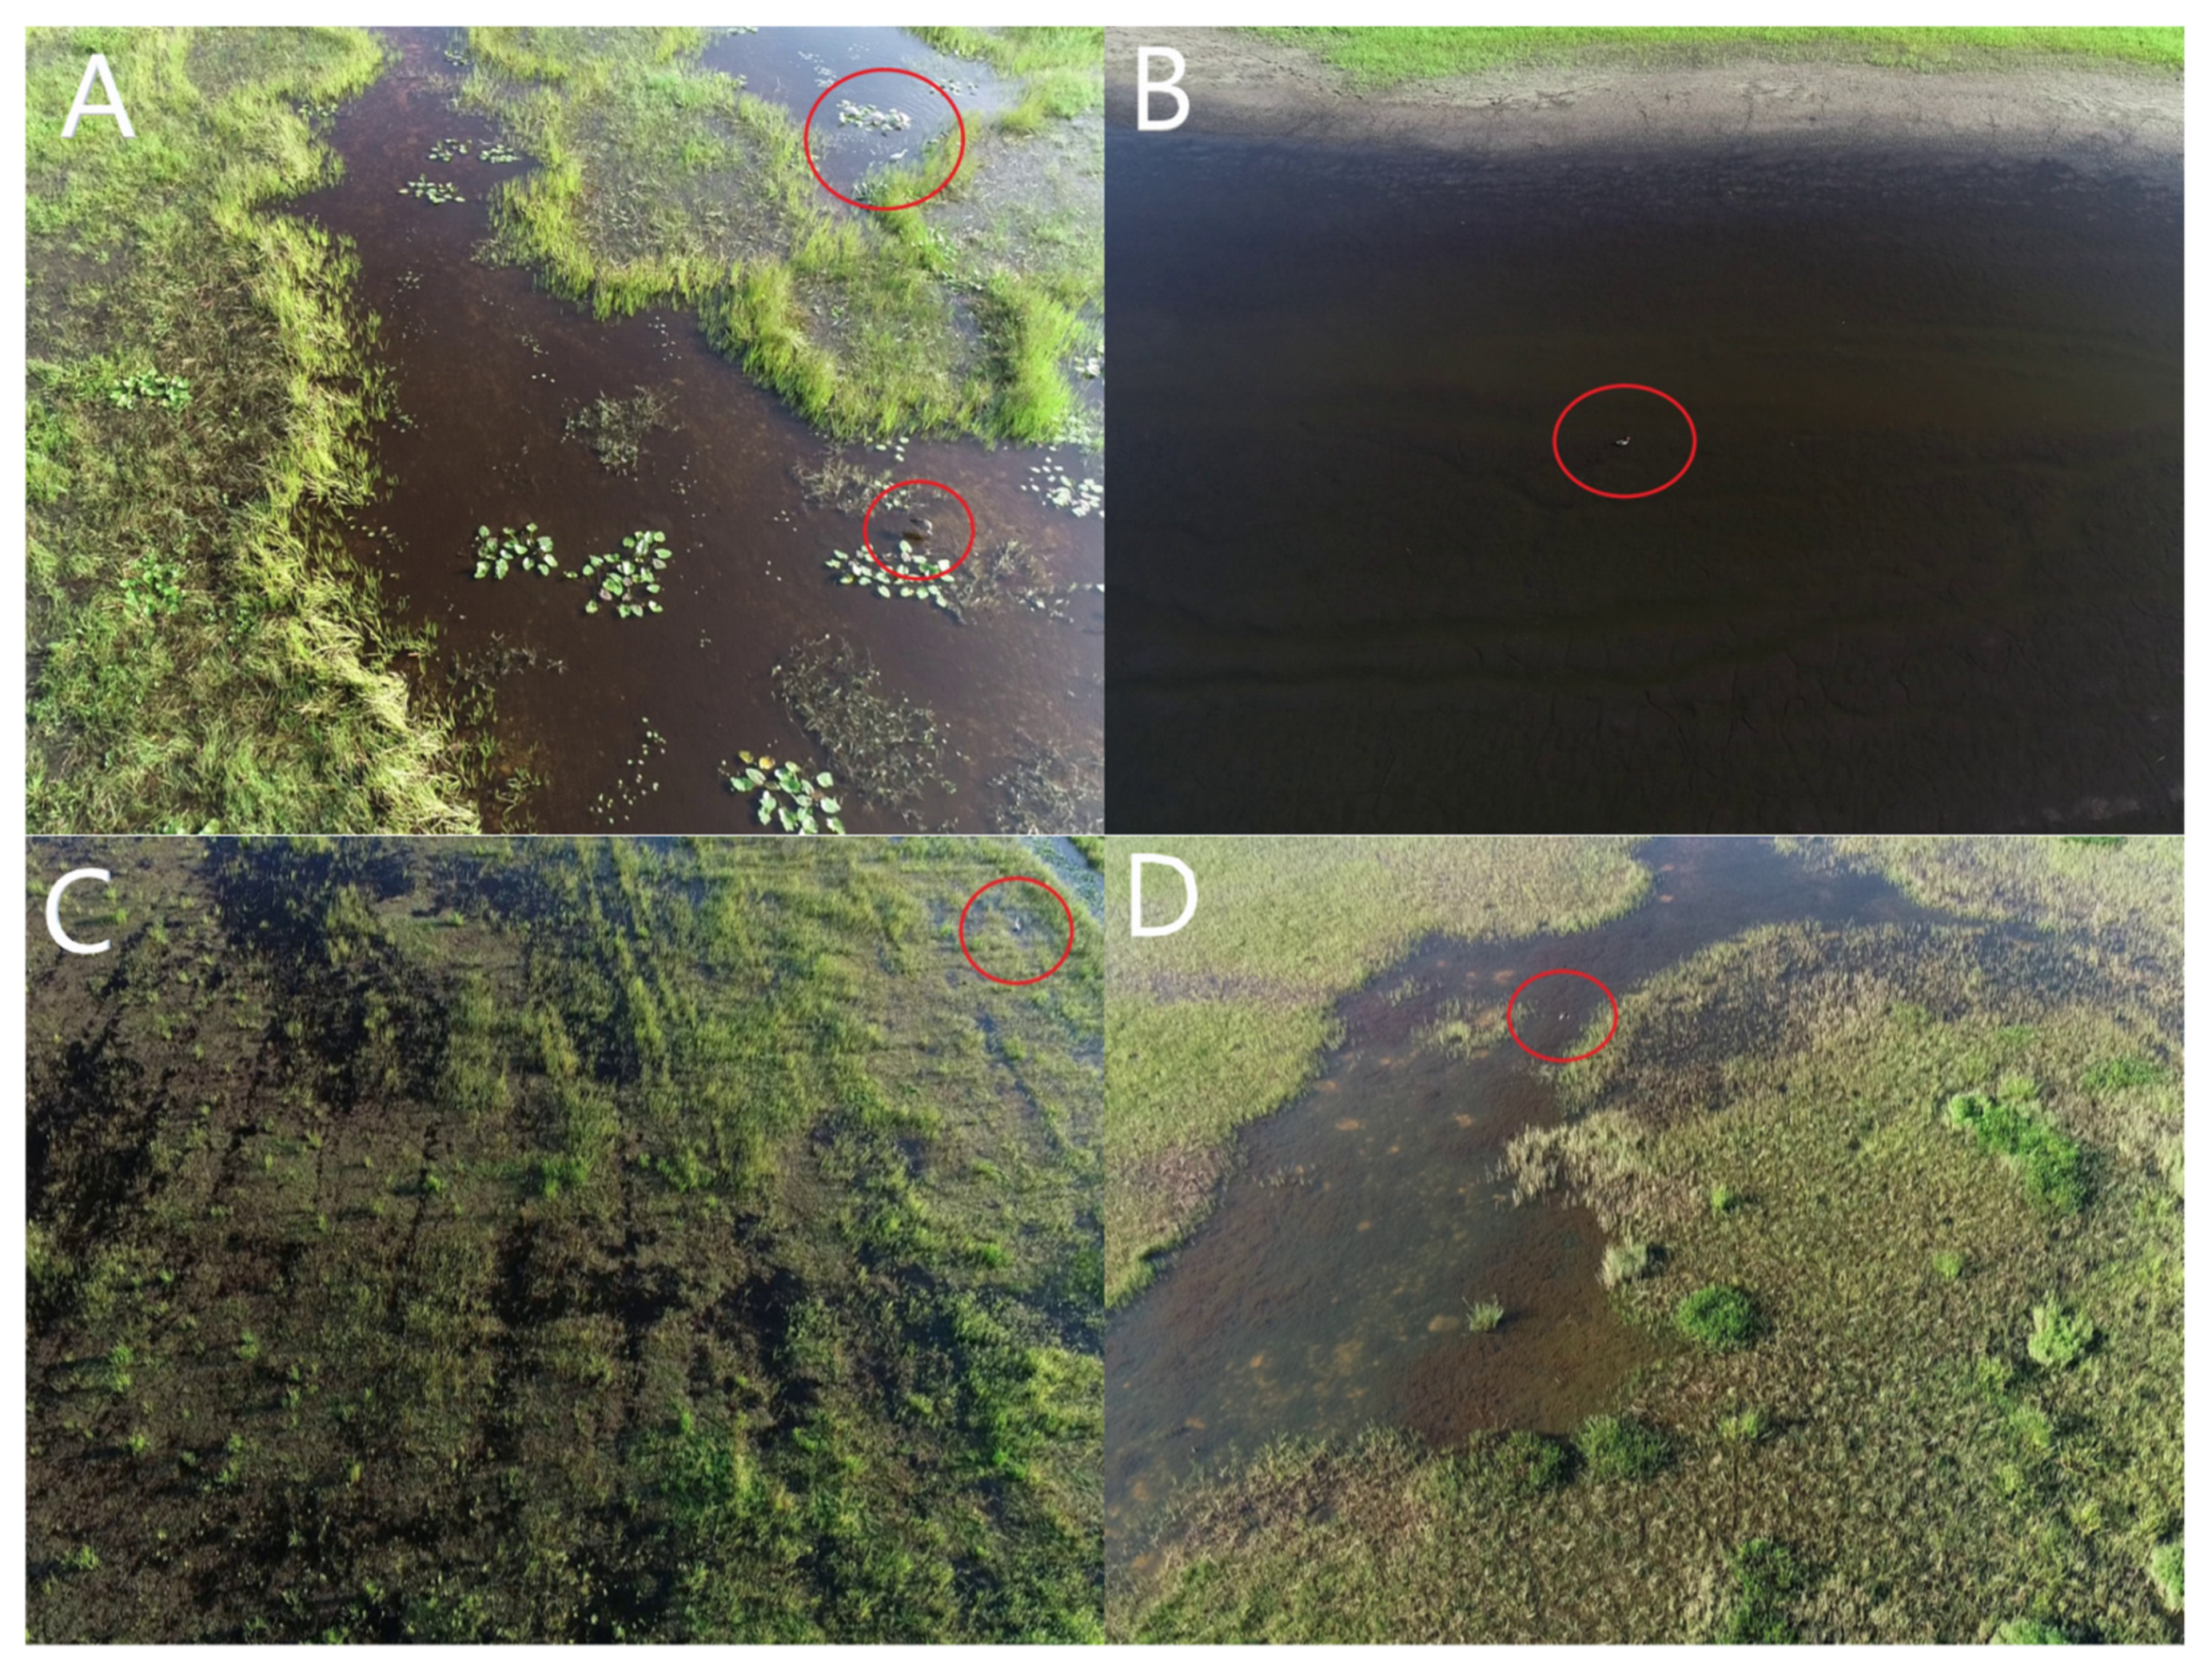
Individual frames taken from videos collected with a drone flying at 12 m (A,B) and 30 m (C,D) above ground level. Images are fully zoomed out and detected birds are enclosed within a red circle. Common marsh bird species observed in video included: Roseate Spoonbill (A), American Coot (B), Great Egret (C), and Glossy Ibis (D).
Figure 2.
Individual frames taken from videos collected with a drone flying at 12 m (A,B) and 30 m (C,D) above ground level. Images are fully zoomed out and detected birds are enclosed within a red circle. Common marsh bird species observed in video included: Roseate Spoonbill (A), American Coot (B), Great Egret (C), and Glossy Ibis (D).

Figure 3.
Predicted probabilities estimated from mixed effects logistic regression model evaluating the behavioral reaction of different bird guild groups (diving waterfowl, large wading birds, passerines, rails, shorebirds, small wading birds, and guild-specific unknown) and altitudes (30 m [black]; 12 m [grey]) to drone flights in Florida, USA. Points represent the mean predictions for each guild and altitude and error bars represent 95% confidence intervals conditioned on the fixed effects. Significant differences for pairwise comparisons of guilds are denoted by non-matching letters (a, b, and c; α = 0.05). Additional predictors in the model were held constant at observer one.

Figure 4.
Predicted probabilities estimated from mixed effects logistic regression models evaluating the proportion of general unknown birds (A) and proportion of overall unknown birds (B) during drone flights in Florida, USA. Points represent the mean predictions and error bars represent 95% confidence intervals conditioned on the fixed effects. General unknowns were birds whose guild and species were unknown and overall unknowns were birds, across all guilds, that could not be identified according to species.


Table 1.
The sum of bird species detected by two observers and two flight altitudes (12 m and 30 m). Each of the 20 observed bird species was classified into one of six bird guilds. If the observer could identify the guild but not the species of a detected bird, then it was classified into one of the six guild-specific unknown classes. If both the species and guild of a bird could not be identified, then the detection was classified into the general unknown guild category (Unknown [General]).
| Common Name | Scientific Name | Detections (12 m) | Detections (30 m) |
|---|---|---|---|
| Passerine | 14 | 26 | |
| Boat-tailed Grackle | Quiscalus major | 6 | 13 |
| Red-winged Blackbird | Agelaius phoeniceus | 2 | 1 |
| Unk. Passerine (Species Unk.) | 6 (42.9%) | 12 (46.2%) | |
| Rail | 56 | 34 | |
| American Coot | Fulica americana | 1 | 1 |
| Common Moorhen | Gallinula chloropus | 45 | 33 |
| Grey-headed Swamp Hen | Porphyrio poliocephalus | 3 | 0 |
| Unk. Rail (Species Unk.) | 7 (12.5%) | 0 (0%) | |
| Shorebird | 33 | 31 | |
| Black-necked Stilt | Himantopus mexicanus | 6 | 12 |
| Unk. Shorebird (Species Unk.) | 27 (81.8%) | 19 (61.3%) | |
| Large Wading | 82 | 10 | |
| Great Blue Heron | Ardea herodias | 3 | 0 |
| Great Egret | Ardea alba | 12 | 10 |
| Limpkin | Aramus guarauna | 9 | 0 |
| Roseate Spoonbill | Platalea ajaja | 56 | 0 |
| Wood Stork | Mycteria americana | 2 | 0 |
| Unk. Large Wading (Species Unk.) | 0 (0%) | 0 (0%) | |
| Small Wading | 32 | 21 | |
| Black-crowned Night Heron | Nycticorax nycticorax | 0 | 1 |
| Glossy Ibis | Plegadis falcinellus | 11 | 3 |
| Little Blue Heron | Egretta caerulea | 1 | 2 |
| Snowy Egret | Egretta thula | 1 | 2 |
| Unk. Small Wading (Species Unk.) | 19 (59.4%) | 13 (61.9%) | |
| Waterfowl and Diving | 14 | 9 | |
| Anhinga | Anhinga anhinga | 6 | 6 |
| Black-bellied Whistling Duck | Dendrocygna autumnalis | 5 | 0 |
| Double-crested Cormorant | Phalacrocorax auritus | 2 | 0 |
| Unknown Waterfowl and Diving (Species Unk.) | 1 (7.1%) | 3 (33.3%) | |
| General Unknown (Unk. Guild and Species) | 14 (5.7%) | 73 (35.8%) | |
| Detections Where Bird Guild is Known | 231 (94.3%) | 131 (64.2%) | |
| Detections Where Bird Species is Known | 171 (69.8%) | 84 (41.2%) | |
| Number of Birds Detected by Observer 1 | 127 | 111 | |
| Number of Birds Detected by Observer 2 | 118 | 93 | |
| Total Number of Detections (Observers 1 and 2) | 245 | 204 | |
Table 2.
The count of marsh bird behavioral reactions by guild and observer at the 12 m and 30 m flight altitudes. Detections of birds that flew into or through the drones FOV were not included in this summary.
Table 2.
The count of marsh bird behavioral reactions by guild and observer at the 12 m and 30 m flight altitudes. Detections of birds that flew into or through the drones FOV were not included in this summary.
| 12 m Altitude | 30 m Altitude | |||
|---|---|---|---|---|
| Observer | No Reaction | Reacted (%) | No Reaction | Reacted (%) |
| Passerine | Passerine | |||
| 1 | 2 | 5 (71.4%) | 3 | 3 (50.0%) |
| 2 | 1 | 1 (50.0%) | 0 | 0 (0%) |
| Rail | Rail | |||
| 1 | 23 | 3 (11.5%) | 12 | 0 (0%) |
| 2 | 29 | 1 (3.3%) | 22 | 0 (0%) |
| Shorebird | Shorebird | |||
| 1 | 13 | 3 (18.8%) | 10 | 4 (28.6%) |
| 2 | 15 | 0 (0%) | 11 | 3 (21.4%) |
| Unknown (General) | Unknown (General) | |||
| 1 | 5 | 0 (0%) | 32 | 0 (0%) |
| 2 | 3 | 0 (0%) | 14 | 5 (26.3%) |
| Wading (Large) | Wading (Large) | |||
| 1 | 35 | 4 (10.3%) | 5 | 1 (16.7%) |
| 2 | 33 | 5 (13.2%) | 2 | 0 (0%) |
| Wading (Small) | Wading (Small) | |||
| 1 | 15 | 4 (21.1%) | 1 | 2 (66.7%) |
| 2 | 12 | 1 (7.7%) | 4 | 1 (20.0%) |
| Waterfowl and Diving | Waterfowl and Diving | |||
| 1 | 6 | 1 (14.3%) | 0 | 0 (0%) |
| 2 | 6 | 1 (14.3%) | 4 | 1 (20.0%) |
Disclaimer/Publisher’s Note: The statements, opinions and data contained in all publications are solely those of the individual author(s) and contributor(s) and not of MDPI and/or the editor(s). MDPI and/or the editor(s) disclaim responsibility for any injury to people or property resulting from any ideas, methods, instructions or products referred to in the content. |
© 2023 by the authors. Licensee MDPI, Basel, Switzerland. This article is an open access article distributed under the terms and conditions of the Creative Commons Attribution (CC BY) license (https://creativecommons.org/licenses/by/4.0/).
Share and Cite
MDPI and ACS Style
Orange, J.P.; Bielefeld, R.R.; Cox, W.A.; Sylvia, A.L. Impacts of Drone Flight Altitude on Behaviors and Species Identification of Marsh Birds in Florida. Drones 2023, 7, 584. https://doi.org/10.3390/drones7090584
AMA Style
Orange JP, Bielefeld RR, Cox WA, Sylvia AL. Impacts of Drone Flight Altitude on Behaviors and Species Identification of Marsh Birds in Florida. Drones. 2023; 7(9):584. https://doi.org/10.3390/drones7090584
Chicago/Turabian StyleOrange, Jeremy P., Ronald R. Bielefeld, William A. Cox, and Andrea L. Sylvia. 2023. "Impacts of Drone Flight Altitude on Behaviors and Species Identification of Marsh Birds in Florida" Drones 7, no. 9: 584. https://doi.org/10.3390/drones7090584