Article

Prediction and Optimization of Drilling Parameters in Drilling of AISI 304 and AISI 2205 Steels with PVD Monolayer and Multilayer Coated Drills

1
Department of Mechanical Engineering, McMaster University, Hamilton, ON L8S 4L7, Canada
2
Production Engineering Department, Alexandria University, Alexandria, 21544, Egypt
3
Egypt-Japan University of Science and Technology, Alexandria, 21934, Egypt
*
Author to whom correspondence should be addressed.
J. Manuf. Mater. Process. 2018, 2(1), 16; https://doi.org/10.3390/jmmp2010016
Submission received: 6 February 2018 / Revised: 26 February 2018 / Accepted: 27 February 2018 / Published: 2 March 2018
(This article belongs to the Special Issue Smart Manufacturing Processes in the Context of Industry 4.0)

Abstract

:
Due to their high ductility, high durability, and excellent corrosion resistance, stainless steels are attractive materials for a variety of applications. However, high work hardening, low thermal conductivity, and high built-up edge (BUE) formation make these materials difficult to machine. Rapid tool wear and high cutting forces are the common problems encountered while machining these materials. In the present work, the application of Taguchi optimization methodology has been used to optimize the cutting parameters of the drilling process for machining two stainless steels: austenitic AISI 304 and duplex AISI 2205 under dry conditions. The machining parameters which were chosen to be evaluated in this study are the tool material, cutting speed, and feed rate, while, the response factors to be measured are the tool life (T), cutting force (Fc), and specific cutting energy (ks). Additionally, empirical models were created for predicting the T, Fc and ks using linear regression analysis. The results of this study show that AISI 2205 stainless steel has a shorter tool life, a higher cutting force, and a higher specific cutting energy than AISI 304 stainless steel. In addition, the Taguchi method determined that A3B1C1 and A3B3C1 (A3 = TiN-coated twist drill, B1 = 13 m/min, B3 = 34 m/min, C1 = 0.12 mm/rev) are the optimized combination of levels for the best tool life and the lowest cutting force, respectively. Meanwhile, the optimized combination of levels for all three control factors from the analysis, which provides the lowest specific cutting energy, was found to be A3B1C3 (A3 = TiN-coated twist drill, B1 = 13 m/min, C3 = 0.32 mm/rev) for both stainless steels.

1. Introduction

Stainless steels are widely used in the chemical, petrochemical, food, and pharmaceutical industries, as well as nuclear energy plants and in stainless appliances [1]. However, the machining of these steels is very difficult due to their higher ductility, strength, work hardening rate and low thermal conductivity [2], resulting in short tool life, limited metal removal rate, high cutting forces, and power consumption. Stainless steels are divided into five families: austenitic, ferrite, martensitic, duplex, and precipitation hardening alloys [3]. Duplex stainless steels are a specific type of stainless steel that have a biphasic microstructure consisting of approximately 50% ferrite and 50% austenite in volume. Due to their microstructure, duplex stainless steels present a good combination of ferritic and austenitic steel properties, including increased toughness, high mechanical strength, and high corrosion resistance in several environments [2]. However, the tools employed to machine them have a shorter life than those used in the machining of austenitic alloys due to the high work hardening rate and ductility of duplex stainless-steel alloys. The work hardening of duplex stainless steels increases the friction forces during the contact between the work piece and cutting tool edge, which increases the temperature, causing oxidation [4]. In addition, the high ductility of the stainless steel leads to the formation of long continuous chips and to intensive sticking of the workpiece material to the cutting tool surface, which results in enhanced adhesive wear [5]. These conditions promote built-up edge (BUE) formation and tearing off during cutting, which results in cutting edge chipping and cutting force instability. This response to the machining process results in severe surface damage to the machined part and chipping of the tool cutting edge [6,7] Nomani et al. [8] compared the machinability behavior of super duplex 2507, duplex SAF 2205 and austenite 316L stainless steels in the drilling process. The results showed that austenite 316 had better machinability compared to duplex stainless steels. Ran et al. [9] showed the mechanical properties and corrosion resistance of the duplex stainless steel designed alloys with lower production cost are better than those of AISI 316L austenitic stainless steel. Xavior [10] reported that high work-hardening rate, high BUE tendency, and low thermal conductivity of AISI 304 stainless steel are responsible for poor surface finish and high tool wear. Korkut et al. [11] used turning tests to determine optimum machining parameters for machining of AISI 304. Tool flank wear increased with increasing cutting speed. The poor performance of the tool was caused by thermal softening of the tool due to the high influence of the heat on the cutting tool and less efficient heat dissipation at higher cutting speeds. Ciftci [12] performed dry turning experiments on AISI 304 and AISI 316 austenitic stainless steels and the results showed TiC/TiCN/TiN-coated cutting tools produced lower cutting forces than TiCN/TiC/Al2O3-coated tools, because of the lower coefficient of friction of the TiN top coating layer.
The tool life and cutting forces are important quality indicators in machining processes and the various properties of machined parts, such as friction and heat transmission are also influenced by these indicators [13]. Most of the process parameters, such as tool material, cutting speed, and feed rate, affect the tool life and machine energy consumption, and therefore, it is very difficult to develop a proper analytical model of the tool life, cutting force, and power consumption [14]. Many methods, including artificial neural networks, regression and finite element analysis have been developed for the modelling and prediction of tool life and cutting forces [15]. The Taguchi-based optimization technique has produced a unique and powerful optimization tool that differs from traditional practices [16]. The optimum parameters for tool life and power consumption depend on several parameters, such as cutting speed, feed rate, cutting condition, and workpiece material [15]. The poor selection of process parameters may cause excessive tool wear. Analyzing the influence of machining parameters has helped reduce power consumption [17]. Therefore, appropriate selection of machining parameters reduces machining costs, increases tool life, and reduces power consumption [18]. The optimization of cutting parameters is usually difficult and requires knowledge of machining and empirical equations related to tool life, force, and power [19]. Selvaraj et al. [20] utilized the Taguchi method to define the optimal cutting parameters in the turning of two different grades of duplex stainless steel. The effects of cutting speed and feed rate on the cutting force and tool wear were analyzed and the results showed that feed rate was the most significant parameter influencing the cutting force. The cutting speed was identified as the most significant parameter influencing the tool wear. Krolczyk et al. [21] concluded that a combination of high cutting speed with low feed rate are the optimum machining conditions which lead to minimizing the specific cutting energy during machining AISI 2205 stainless steel under dry conditions. Nayak et al. [22] investigated the influence of cutting speed, feed rate and depth of cut on cutting force during turning of AISI 304 steel using L27 orthogonal array to design the experiments. Suresh and Basavarajappa [23] summarized that the feed rate is the most significant parameter of influence, followed by depth of cut and cutting speed during their investigation into the effect of cutting parameters on tool wear of austenitic stainless steel.
From the literature mentioned above, it can be seen that the Taguchi method has been successfully used in the optimization of machining parameters. On the other hand, because of their wide usage and hard machinability characteristics, the machinability of stainless steels remains a subject of ongoing investigation. However, notably, studies on the optimization of the drilling process during machining different types of stainless steels are lacking. In addition, there are very few studies on the machinability of AISI 304 austenitic and AISI 2205 duplex stainless steel. Consequently, in this study, the aim is to optimize the process parameters in the drilling of AISI 304 and AISI 2205 stainless steels using Taguchi method design, and to find the significance of each process parameter using ANOVA. Therefore, an experimental investigation of tool life (T), cutting forces (Fc), and specific cutting energy (ks) after machining two selected stainless steels is presented. The influence of tool material, cutting speed, and feed rate on T, Fc, and ks were examined. This research substantially reduces the number of complex, expensive and time-consuming experiments conducted in machining centers, by determining the optimal drilling parameters needed to obtain better T, Fc, and ks in the drilling of austenitic and duplex stainless steels. It is possible to apply this optimization technique to various applications in the manufacturing industry to obtain optimal process parameters such as: cutting materials, coating materials, and cutting conditions, to reduce manufacturing costs and processing time and to promote higher productivity. Therefore, this study will be useful for future applications in both the manufacturing industry and the academic environment.

2. Experimental Methods

2.1. Drilling Experiments and Cutting Tools

In this study, AISI 304 austenitic and AISI 2205 duplex stainless steel blocks were used as the workpiece materials. The dimensions of the workpiece were 150 × 150 × 10 mm. Chemical compositions of stainless steel materials are given Table 1 and Table 2. Blind holes were then drilled in the stainless-steel blocks. To maintain the initial conditions for each test, a new drill was used for each experiment. The drilling tests were performed by using a Z5050 drilling machine (Anhui Chizhou Household Machine Tool Co., Ltd., Anhui, China), equipped with a maximum spindle speed of 3000 rpm and a 1.5 kW drive motor. They were performed at three different cutting speeds (13, 21, and 34 m/min) and feed rates (0.12, 0.2, and 0.32 mm/rev) whilst hole depth was kept constant at 7 mm. All drilling experiments were conducted under dry cutting conditions. The twist drills used in the experiments were: monolayer-TiN, multilayer-TiN/TiAlN coated and uncoated twist drills of 6 mm diameter. Technical specifications of the cutting tools and coating materials are given in Table 3.

2.2. Experimental Machine Techniques

The flank wear was measured using a MU-214B universal measuring machine (AUCTO, Buffalo, NY, USA). The tool life criterion was set to a flank wear of 0.3 mm (the period of cutting time until the average flank wear reached 0.3 mm) following the recommendation of the ISO 3685 Standard [24]. In the drilling experiments, a Kistler dynamometer 9271A with data acquisition system was used for measurement of the feed force and torque. The signals of feed force and torque from the dynamometer were transmitted to a Kistler 5017B type 8-channel amplifier (Kistler Instrument Corp., Amherst, NY, USA), and then recorded on a computer using LABVIEW software (National Instruments, Austin, TX, USA). In this study, feed force and drilling torque were measured, but only drilling torque values were evaluated. From the values of drilling torque, both main cutting force (Fc) and specific cutting energy (ks) were calculated using Equations (1) and (2).
F c = 2 T c D
k s = F c f × D 4 =   4 F c f D = 2 T c f D 2

3. Taguchi Experimental Design and Optimization

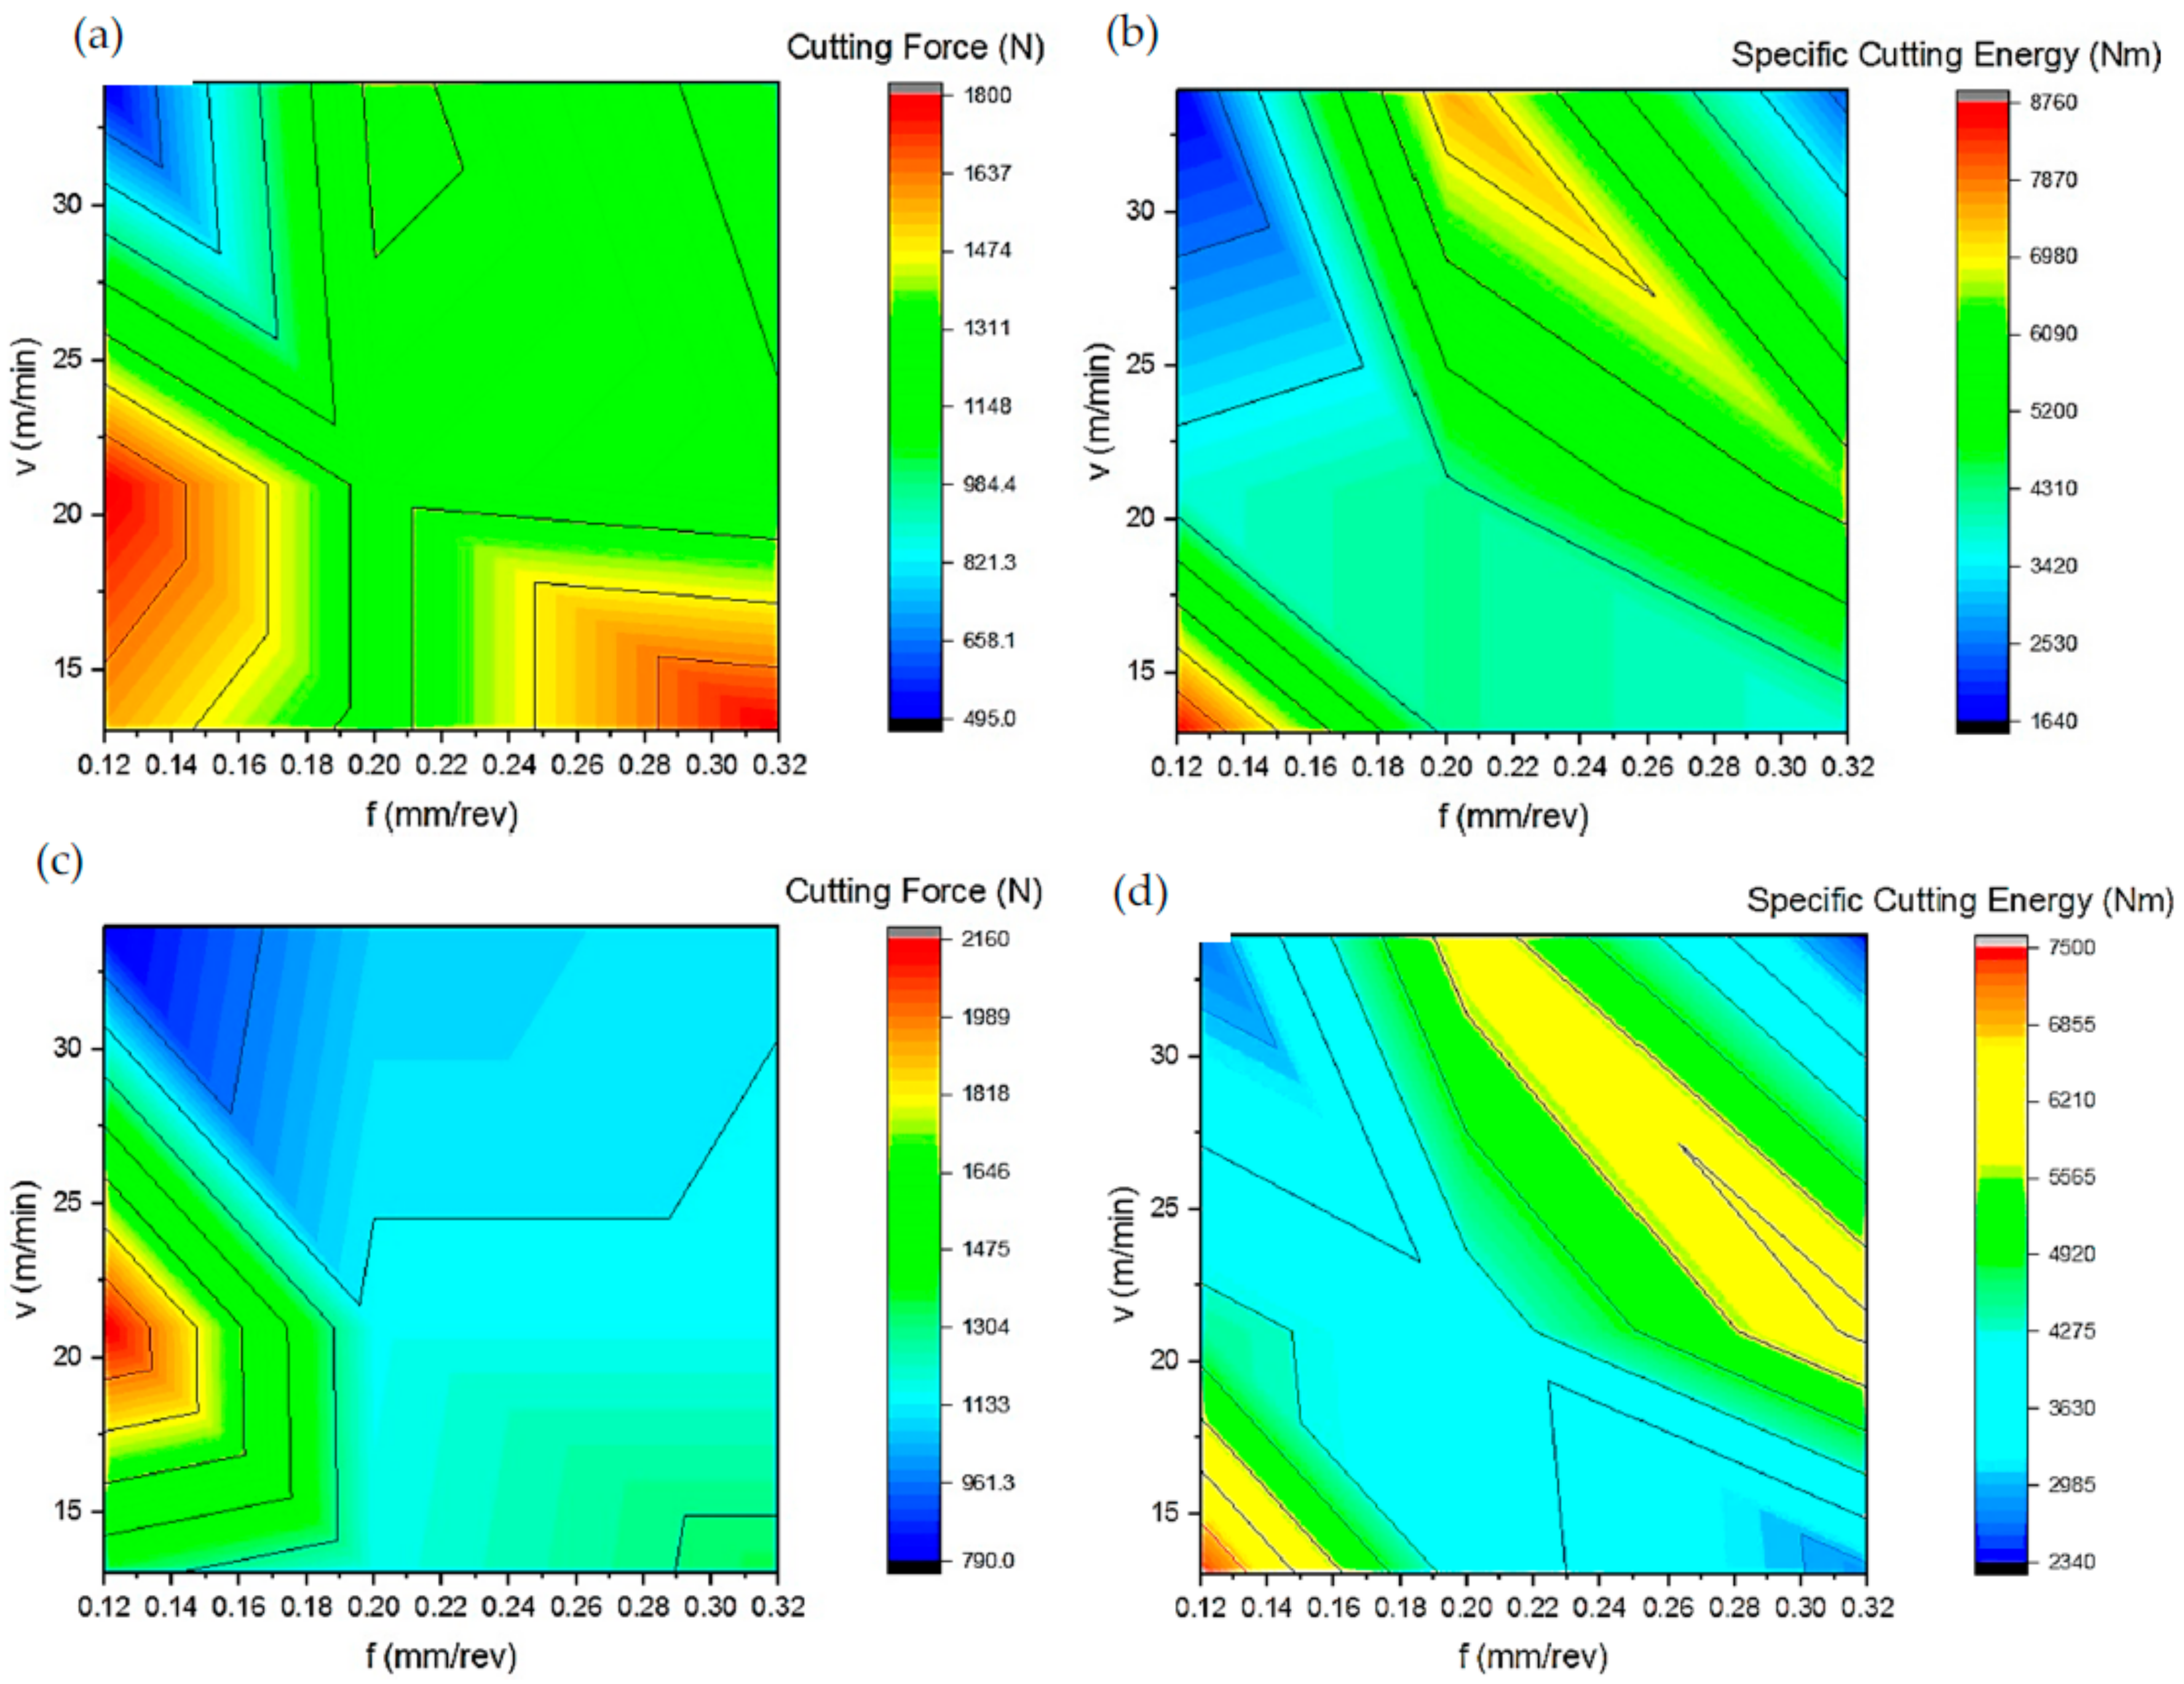
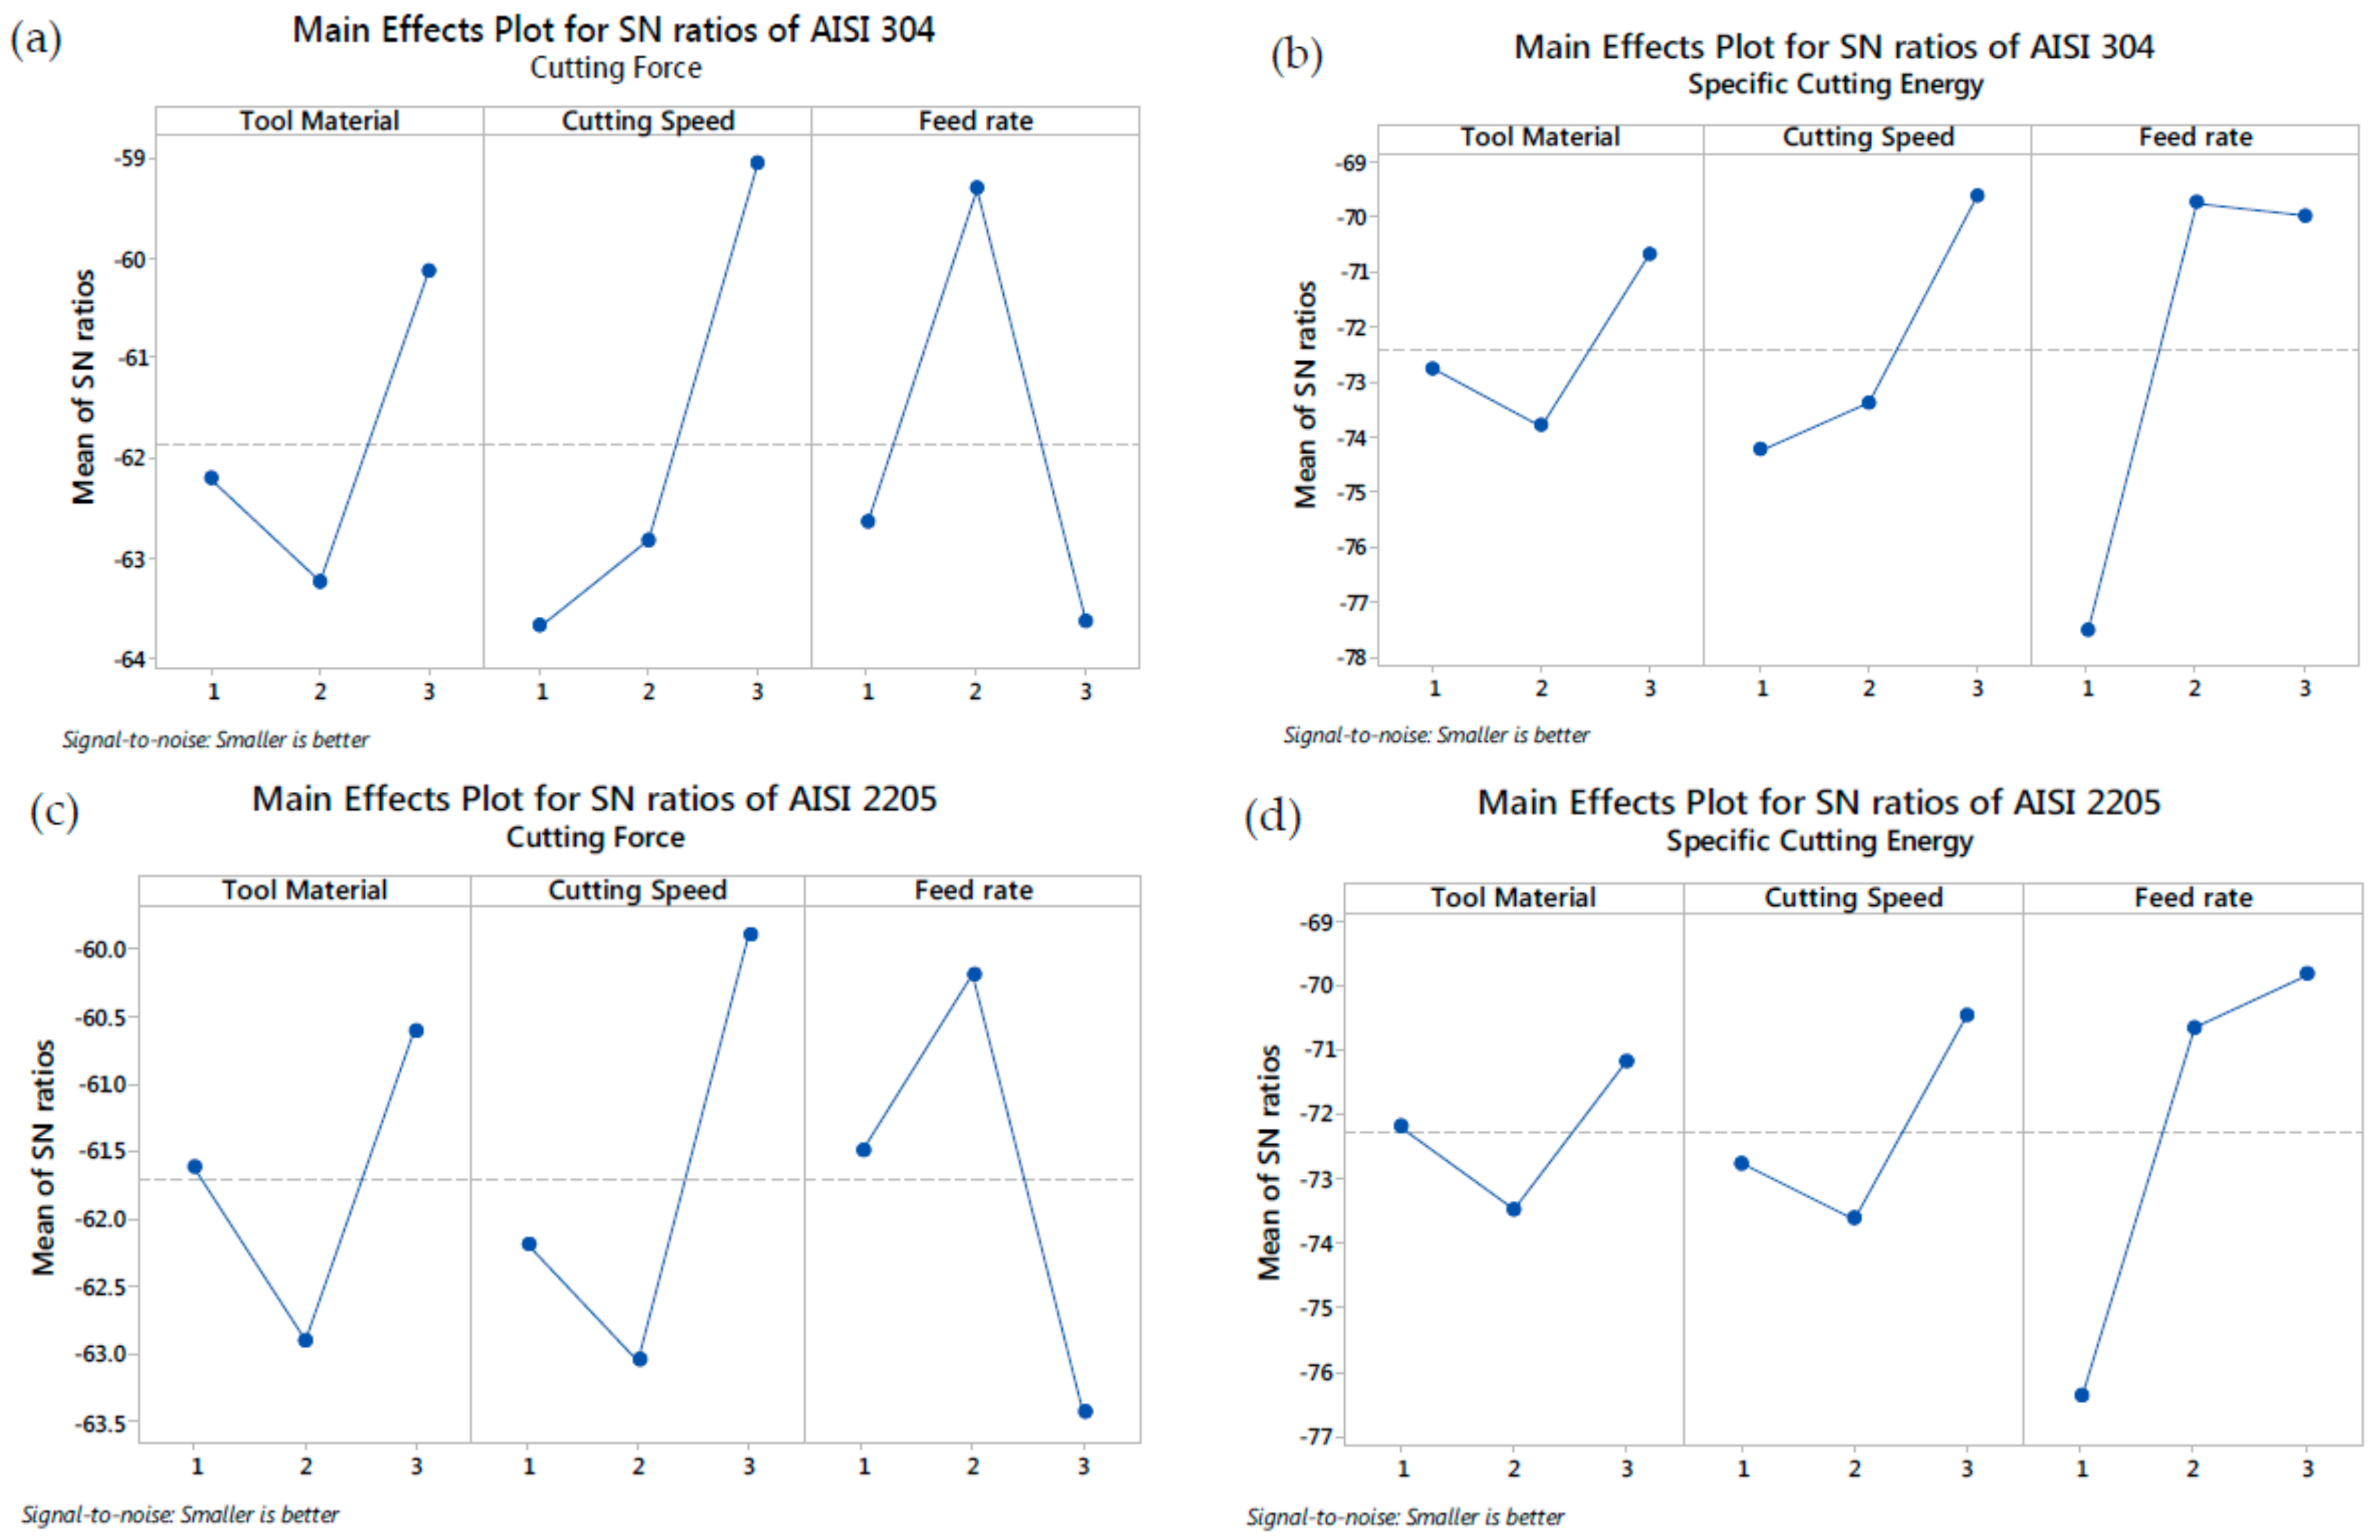
The Taguchi experimental design provides an efficient and systematic approach for determining the optimum machining parameters in the manufacturing process. The Taguchi method significantly decreases the number of tests needed and increases the machining performance by using orthogonal arrays [26]. A loss function (S/N ratio) is then defined to calculate the deviations between the experimental value and the desired value. There are three S/N ratios available, depending on the type of characteristic; the lower-the-better (LB), the higher-the-better (HB), and the nominal-the-better (NB) [27]. In drilling, higher tool life (T), lower cutting forces (Fc), and specific cutting energy (ks) are indications of better performance. Therefore, for obtaining optimum machining performance, the HB was selected for T and LB ratios were selected for Fc and ks. The S/N ratios for each type of characteristic can be calculated as follows:
S / N HB = 10 log   [ 1 n i = 1 n y i 2 ]
S / N NB = 10 l o g [ y s 2 ]
S / N LB = 10 log   [ 1 n i = 1 n 1 y 2 ]
where y′ is the average of the observed data, s2 is the variance of y, n is the number of observations, and y is the observed data. Regardless of the category of the performance characteristics, a greater S/N ratio corresponds to the better performance characteristics. Therefore, the optimal level of the process parameters is the level with the highest S/N ratio [28].
In this study, the cutting tools (A), cutting speed (B), and feed rate (C), were selected as control factors for T, Fc, and ks values, and their levels were determined as shown in Table 4. To select an appropriate orthogonal array for the experiments, the total degrees of freedom (DOF) need to be computed. The DOF for the orthogonal array should be greater than or at least equal to those for the design parameters [29]. In this study, the most appropriate orthogonal array is determined as L9, in order to obtain the optimal cutting parameters and to analyze their effects. This array has eight DOF and it can handle three level design parameters. The tool life and cutting force, drilling torque and specific cutting energy results were subject to the analysis of variance (ANOVA). ANOVA establishes the relative significance of factors in terms of their percentage contribution to the response. It estimates the variance of error for the effects and the confidence interval of the error prediction [30]. It is based on the test results of Minitab software while each value is the average of two replications for each condition. The experimental plan undertaken was evaluated at a confidence level of 95%. The significance of control factors in ANOVA is determined by comparing P-values of each control factor [29]. The P-value is a statistical index used in the analysis of variance. In regard to statistical significance, the lower the P-value, the more significant is the tested parameter. Finally, regression analysis is applied to derive the predictive equations of the response variables.

4. Experimental Results, Analysis, and Discussions

4.1. Taguchi Analysis for Tool Life

The estimated response surfaces of tool life, as a function of tool material and cutting speed for AISI 304 and AISI 2205, are shown in Figure 1 and summarized in Table 5. The tool life based on the wear value of VB max = 0.3 mm for all the experiments is drawn. As shown in Figure 1, monolayer-TiN coated twist drill has the highest tool life compared to multilayer-TiN/TiAlN coated and uncoated twist drills when drilling both AISI 304 and AISI 2205 stainless steels. This can be attributed to the low residual stresses of mono-layer TiN coated tool, see Table 3. The measured value of average residual stress on a new insert of TiN/TiAlN is 550 MPa which is double the value of the average residual stresses of TiN (280 MPa), resulting in reduced mechanical load during drilling and increased tool life. This was also observed by Dhanabalakrishnan et al. [25]. Also, it was observed that the longest tool life for a monolayer-TiN coated twist drill was obtained when drilling AISI 304, which indicates that AISI 304 has better machinability than AISI 2205; Nomani et al. [8] reported the same observation. Furthermore, it is noted that the tool life decreases with increasing cutting speed which can be explained by thermal softening of the tool by conduction of heat from chips to the tool [31]. In addition, at higher temperatures, stainless steel is work hardened due to the excessive rubbing action that takes place between chip and tool, hence, wear progresses on the flank surface [32].

4.1.1. Signal to Noise (S/N) Response Analysis for Tool Life

The signal term in the Taguchi method, represents the wanted value (mean) for the output attribute and noise represents unwanted square deviation value for the output attribute [15]. Thus, S/N ratio is the ratio of the mean to the square deviation. The S/N ratio is used by Taguchi to measure the quality attribute or characteristic from the wanted value. The methods for calculating the S/N ratio are classified into three main categories, depending on whether the machining outcomes are smaller-the-better, larger-the-better or nominal-the-better [32]. In order to maximize tool life, higher values are always preferred. Thus, the larger-the-better (Equation (3)) ratio was selected for maximizing tool life.
The drilling parameters were divided by considering different levels and possible effects, according to the selected orthogonal array. The effects of input parameters on the responses can be analyzed with help of S/N ratios. These effects are defined and evaluated according to the total mean values of the experimental trial results or S/N ratios [33]. The maximum tool life values can be calculated from the total mean values of the experimental trial results for the tool life. An important requirement when calculating the optimum points is to identify the optimum levels for the machining parameters [29]. These were defined by assessing different levels of the input parameters, based on the results from combinations produced by the orthogonal array [34]. The S/N ratios for the tool life for the nine combinations L9 are presented in Table 6, and shown in Figure 2. Figure 2 graphically illustrates the S/N ratios that were calculated for the tool life and shows that the optimum combination for the tool life was determined as A3B1C1 (A3 = monolayer-TiN, B1 =13 m/min, C1 = 0.12 mm/rev).

4.1.2. Analysis of Variance (ANOVA) for Tool Life

The goal of the analysis of variance is to determine which design parameters meaningfully affect the tool life. This is achieved by splitting the variability of the S/N ratios, which is measured by the sum of the squared deviations from the total mean S/N ratio, in the contributions of each cutting parameter and the error [22]. The variance of each cutting parameter is shown in Table 7. The F-ratio test is a statistical tool used to verify which design parameters significantly affect the quality being investigated (tool life). This is defined as the ratio of the mean squared deviations to the mean squared error. This analysis was performed with a confidence level of 95% [19]. The importance of the input parameters in ANOVA analysis was identified by comparing the F-values of each input parameters. The F-value determined in the ANOVA table was compared with the value according to standard F-tables for a given statistical level of importance [35]. The last column of Table 7 indicates the percentage contribution of each factor on the total variation, indicating their degree of influence on the results. The greater the percentage contribution, the greater the influence a factor has on the performance [36]. According to Table 7, it was found that the tool material is the most significant cutting parameter affecting tool life with 76.86% for AISI 304 and 77.12% for AISI 2205, followed by cutting speed with 17.16% for AISI 304 and 10.22% for AISI 2205. The feed rate had an insignificant effect on tool life with 3.77% for AISI 304 and 5.79% for AISI 2205.

4.2. Taguchi Analysis for Cutting Forces and Specific Cutting Energy

The cutting forces (Fc) and specific cutting energy (ks) were calculated using Equations (1) and (2) and summarized in Table 5. Figure 3 depicts the contour maps for cutting forces and specific cutting energy for AISI 304 and AISI 2205 stainless steels as a function of feed rate and cutting speed. As described, the highest cutting forces were obtained during drilling of AISI 2205, which highlights that duplex stainless steel is more difficult to cut than AISI 304 [8]. In addition, the highest cutting forces were achieved when drilling with a low cutting speed and high feed rate and the highest specific cutting energy was achieved with low feed rate and low speed [21]. Following the experimental runs, the results were analyzed to optimize the parameters and to identify which process parameters are statistically significant. Data analysis was conducted using S/N ratio response analysis and ANOVA.

4.2.1. Signal to Noise (S/N) Response Analysis for Cutting Effects

With the Taguchi method, we used the S/N ratio as the quality characteristic of choice. In drilling operations, a smaller Fc and ks are indications of better performance [37]. Therefore, in order to obtain the optimum machining performance, the S/N ratio (Equation (5)) was selected for the minimized Fc and ks. The S/N ratio functioned as a performance measurement to develop processes insensitive to noise factors. The degree of predictable performance of a product or process in the presence of noise factors can be defined from S/N ratio values. For each type of machining output, the higher the S/N ratio, the better the result [19]. In this study, lower Fc and ks values are important from the point of view of energy consumption. Therefore, the desired “smaller-the-better” criteria implies that the lowest specific cutting energy would be the ideal result, while the largest S/N ratio response would reflect the best response which results in the lowest noise. This is the criteria employed in this study to determine the optimal machining parameters [38].
The distribution of the means of S/N ratios calculated for Fc and ks was determined and the results for the nine combinations L9 are presented in Table 8, and shown in Figure 4. As smaller-the-better was selected for Fc and ks, the lowest values at all levels were evaluated to determine the optimal combination of cutting tool, cutting speed and feed rate. Therefore, the optimum combination for cutting force was determined as A3B3C1 (A3 = TiN, B3 = 34 m/min, C1 = 0.12 mm/rev). Similarly, for specific cutting energy, the lowest values at all levels were evaluated to determine the optimal combination, which was determined as A3B3C3 (A3 = TiN, B3 = 34 m/min, C3 = 0.32 mm/rev). Therefore, the lowest Fc was achieved when drilling with the highest cutting speed (34 m/min) and smallest feed rate (0.12 mm/rev) and the lowest specific cutting energy was achieved with the highest cutting speed (34 m/min) and highest feed rate (0.32 mm/rev). This can be explained as due to the higher temperatures generated in the tool chip contact area as a function of increased cutting speed [39]. The thermal softening which takes place in the cutting zone due to this temperature increase causes the cutting force to decrease [40]. In addition, the increase in the feed rate causes an increase in the chip section, leading to an increase in the cutting force and decrease in specific cutting energy (see Equations (1) and (2)) [39]. Also, the lowest cutting force and specific cutting energy values were obtained with the mono-layer TiN twist drill. The TiN coating provides more hardness and a very low coefficient of friction (Table 3), which results in increased resistance to wear and lower cutting forces and specific cutting energy [37].

4.2.2. Analysis of Variance (ANOVA) for Cutting Effects

In this study, ANOVA and column effect methods were used to analyze the effects of cutting with the analysis undertaken at a confidence level of 95%. ANOVA values of experimental results for the Fc and ks for the two selected stainless steels are shown in Table 9 and Table 10. As a result of the assessment of Fc, the percentage contributions of tool material (A), cutting speed (B) and feed rate (C) were found to be: 5.92%, 84.19% and 9.87%, respectively, in the case of AISI 304, and 5.76%, and 38.46%, and 55.76%, respectively, for AISI 2205.
Furthermore, the percentage contributions of factors A, B and C for the specific cutting energy are 5.23%, 13.52%, and 81.23%, respectively, for AISI 304, and 2.82%, 8.80%, and 88.57%, respectively, for AISI 2205. In this case, the most effective parameter for the specific cutting energy is feed rate. In drilling operations, the feed rate is one of the most effective process parameters in the growth of specific cutting energy, because increasing feed rate increases the chip volume removed per unit time [32], as described in Equation (2).

4.3. Evaluation of the Experimental Results

In this study, two techniques for data analysis of the results for the tool life, cutting force, and specific cutting energy have been used. Both techniques delivered similar results. The cutting speed is found to be the most prominent factor influencing tool life and cutting force [5,28,37]. As can be seen from Figure 1 and Figure 3, the tool life and cutting forces decrease with increasing cutting speed, while higher values for the feed rate are recommended for lower specific cutting energy.
The variation in the tool life obtained during machining the two selected stainless steels under different cutting condition is shown in Figure 1. For a specific range of parameters, the experimental results from the Taguchi method and ANOVA analysis, show that the tool life decreases with increasing cutting speed. This phenomenon can be attributed to the low thermal conductivity of stainless steels, which leads to heat concentration in the cutting zone that results in high localized temperatures [24]. In addition, their high work hardening leads to high adhesion of the workpiece material to the cutting tool, resulting in unstable chip and BUE formation [4]. The stability of a BUE as a structure is low and its breakage can cause cracks and damages on the tool surface.
The variations in the cutting forces (Fc) obtained during the experimental study for the two selected stainless steels at different cutting conditions are given in the graphs of Figure 4. The cutting force exhibited a decrease with the increasing cutting speed. It is thought that the increasing cutting speed caused a decrease in the tool-chip contact area, resulting in a decrease in Fc [41,42]. Furthermore, the ductility of stainless steel produces long tool–chip contact length on the rake face. Increasing tool–chip contact length reduces the shear plane angle and this leads to increased shear stress [14]. In addition, high spindle speed associated with high cutting temperature, leads to workpiece softening and then reduces the cutting forces [2].
The variations in specific cutting energy (ks) obtained in the experimental study for different stainless steels are given in the graphs of Figure 4. As illustrated, among the parameters tested, feed rate had the most effect on ks. Since ks is a function of the feed rate (Equation (2)), the increased feed rate values decreased the ks significantly. Moreover, the results of variance analysis verified that feed rate was the most effective parameter on ks [21]. In addition, when the cutting speed increased in parallel with the cutting forces, this caused a decrease in the ks values. This would explain why feed rate and cutting speed play a key role in obtaining the lowest Fc and ks [43]. Also, as was the case with the cutting forces, with the ks, the TiN-coated twist drill also displayed some advantage over the other twist drills. This can be explained by the lower frictional coefficient of the TiN coating, see Table 3 [25].

4.4. Empirical Models and Prediction Performance

For the purpose of defining the relationship between one dependent variable and one or more independent variables, regression analysis was used. In this study, dependent variables were defined as T, Fc, and ks, whereas the independent variables were specified as the cutting tool, cutting speed, and feed rate. Estimation equations for T, Fc, and ks were established for linear regression models. The estimation equations obtained for the linear regression model of T, Fc, and ks are given in Equations (6)–(11). The coefficient of determination (R2) of the equations obtained with the linear regression model for T, Fc, and ks were calculated as 89.93%, 88.07%, and 87.04%, respectively, for AISI 304 and 89.93%, 88.59%, and 87.04%, respectively, for AISI 2205. R2 is the statistical measure of how well the regression line approximates the real data points and its value should be between 0.8 and 1 [44]. Figure 5 shows normal probability plots of the residuals and this reveals that almost all the residuals follow a straight-line pattern which confirms that the regression model obtained from T, Fc, and ks for drilling the two selected stainless steels matches very well with the experimental data (R2 > 0.8). Thus, it is possible to apply the linear regression model successfully for the estimation of T, Fc, and ks. This work could be useful for industries for the selection of process parameters in the drilling of stainless steels, and it would be helpful for manufacturing engineers for predicting the machining outcomes of the investigated types of stainless steels.
For AISI 304 stainless steel:
T = 86.2 + 98.7   T o o l   M a t e r i a l 48.7   C u t t i n g   S p e e d 19.7   F e e d   R a t e
F c = 1835 75   T o o l   M a t e r i a l 285   C u t t i n g   S p e e d + 97   F e e d   R a t e
k s = 11928 550   T o o l   M a t e r i a l 883   C u t t i n g   S p e d 2167   F e e d   R a t e
For AISI 2205 stainless steel:
T = 26 + 152.2   T o o l   M a t e r i a l 56.3   C u t t i n g   S p e e d 9.8   F e e d   R a t e
F c = 1310 56   T o o l   M a t e r i a l 146   C u t t i n g   S p e e d + 176   F e e d   R a t e
k s = 9538 305   T o o l   M a t e r i a l 538   C u t t i n g   S p e d 1707   F e e d   R a t e

4.5. Confirmation Tests

The purpose of the confirmation test is to validate the conclusions drawn during the analysis phase [13]. Once the optimal level of the process parameters is selected, the final step is to predict and verify the improvement of the performance characteristics using the optimal level of the process parameters. The predicted S/N ratio using the optimal level of the process parameters can be calculated using Equation (12), as [7,9]
η = η m + i = 1 q ( η i η m )
where ηm is the mean of the S/N ratio, η i is the mean of the S/N ratio at the optimal level, and q is the number of process parameters that significantly affect the performance characteristics. Table 11 shows the results of the confirmation experiments using the optimal machining parameters for tool life. The increase in S/N ratio from the initial machining parameters to the level of optimal machining parameters for AISI 304 and AISI 2205 are 70.45 dB and 21.1 dB, and the tool life is increased by 6.24 and 14 times, respectively. Thus, the tool life is greatly improved by using the approach adopted in this paper. Table 12 also shows the results of the confirmation experiments using the optimal machining parameters for Fc. The improvement in the S/N ratio from the initial machining parameters to the optimal machining parameters are 5.28 dB for AISI 304 and 2.62 dB for AISI 2205, and the cutting force is decreased by 3.63 for AISI 304 and 1.70 times for AISI 2205. Table 13 reports the results of the confirmation experiments using the optimal machining parameters for ks. The improvement in S/N ratio from the initial machining parameters to the optimal machining parameters are 9.02 dB for AISI 304 and 7.5 dB for AISI 2205, and the ks is decreased by 1.11 and 1.09 times for AISI 304 and AISI 2205, respectively.
From the confirmation tests, good agreement between the predicted machining performance and the actual machining performance was observed. Additionally, the experimental results confirmed the validity of the applied Taguchi method for enhancing the machining performance and the optimizing the drilling parameters. The tool life, cutting force, and specific cutting energy are greatly improved by using the approach.

5. Conclusions

In this study, an investigation on the tool life, cutting forces, and specific cutting energy, based on the parameter design of the Taguchi method, in the optimization of turning operations of austenitic AISI 304 and duplex AISI 2205 stainless steels has been carried out and the results are presented. Summarizing the main experimental results of this study, the following generalized conclusions can be drawn:
1.
The lowest tool life, and highest cutting forces and specific cutting energy are generated during machining duplex AISI 2205 stainless steel which indicates that austenite AISI 304 shows better machinability compare to AISI 2205. The poor machinability of duplex stainless steel compared to other grades of stainless steels results primarily from the high strength of the alloy but is exacerbated by a lack of non-metallic inclusions and the low carbon content.
2.
Based on the analysis of variance (ANOVA) results, the most effective parameters on tool life were determined. Namely, the tool material is the main factor that has the highest impact on tool life. This factor is about 1.7 and 2.62 times for AISI 304 and AISI 2205, respectively, which is more important than the second ranking factor (cutting speed). The feed rate does not seem to have much influence on the tool life.
3.
The ANOVA analysis revealed that the cutting speed was the most dominant parameter on cutting force with a contribution ratio of 41.15%, and 58% for AISI 304 and AISI 2205, respectively, and that the feed rate was the most dominant parameter on specific cutting energy with a contribution ratio of 81.42% and 81.98% for AISI 304 and AISI 2205, respectively.
4.
Based on the signal-to-noise ratio results in Table 6 and Table 8, we can conclude that for both AISI 304 and AISI 2205, A3B1C1 (A3 = TiN, B1 = 13 m/min, C1 = 0.12 mm/rev) are the optimal machining parameters for tool life, and A3B3C1 (A3 = TiN, B1 = 34 m/min, C1 = 0.12 mm/rev) are the optimal machining parameters for cutting force, whereas A3B3C3 (A3 = TiN, B3 = 34 m/min, C3 = 0.32 mm/rev) are the optimal machining parameters for specific cutting energy.
5.
The improvement in the tool life from the initial machining parameters to the optimal machining parameters for AISI 304 and AISI 2205 is about 6.24 and 14 times, whereas the cutting force is improved by 3.63 and 1.70 times, and specific cutting energy is improved by 1.11 and 1.09 times, respectively.
6.
The regression results showed that the deviations between the actual and predicted S/N ratios for tool life, cutting force, and specific cutting energy are small for each parameter.
7.
In conclusion, the Taguchi optimization method is an efficient and effective method for optimizing energy consumption and enhancing tool life during drilling of AISI 304 and AISI 2205 stainless steels.

Acknowledgments

The authors would like to thank Helmi Attia (NRC, Canada) for providing the tools and materials used for carrying out the experiments. Also, we would like to thank Mohammed El-Hofy for providing the drilling dynamometer used for measuring feed force and torque.

Author Contributions

Yassmin Seid Ahmed performed the cutting experiments, performed analysis studies, and wrote the paper, Helmi Youssef conceived and designed cutting experiments, Hassan El-Hofy designed cutting experiments and reviewed the paper, and Mahmoud Ahmed discussed the results.

Conflicts of Interest

The authors declare no conflict of interest.

References

  1. Selvaraj, D.P.; Chandramohan, P. Optimization of Surface Roughness of AISI 304 Austenitic Stainless Steel in Dry Turning Operation using Taguchi Design Method. J. Eng. Sci. Technol. 2010, 5, 293–301. [Google Scholar]
  2. Seid Ahmed, Y.; Paiva, J.; Covelli, D.; Veldhuis, S. Investigation of Coated Cutting Tool Performance during Machining of Super Duplex Stainless Steels through 3D Wear Evaluations. Coatings 2017, 7, 127. [Google Scholar] [CrossRef]
  3. Basmaci, G.; Ay, M.; Kirbaş, İ. Optimisation of Machining Parameters ın Turning 17-4 Ph Stainless Steel Using the Grey-Based Taguchi Method. 17-4 Ph Paslanmaz Çeliğin Tornalama İşleminde Taguchi Metodu İle Grey-Based Optimizasyonu. Erzinc. Univ. J. Sci. Technol. 2017, 10, 243–254. [Google Scholar]
  4. Krolczyk, G.; Nieslony, P.; Legutko, S. Microhardness and surface integrity in turning process of duplex stainless steel (DSS) for different cutting conditions. J. Mater. Eng. Perform. 2014, 23, 859–866. [Google Scholar] [CrossRef]
  5. Krolczyk, G.M.; Nieslony, P.; Legutko, S. Determination of tool life and research wear during duplex stainless steel turning. Arch. Civ. Mech. Eng. 2014, 15, 347–354. [Google Scholar] [CrossRef]
  6. Krolczyk, G.M.; Maruda, R.W.; Nieslony, P.; Wieczorowski, M. Surface morphology analysis of Duplex Stainless Steel (DSS) in Clean Production using the Power Spectral Density. Measurement 2016, 94, 464–470. [Google Scholar] [CrossRef]
  7. Krolczyk, G.; Legutko, S. Investigations into Surface Integrity in the Turning Process of Duplex Stainless Steel. Trans. FAMENA 2014, 38, 77–82. [Google Scholar]
  8. Nomani, J.; Pramanik, A.; Hilditch, T.; Littlefair, G. Machinability study of first generation duplex (2205), second generation duplex (2507) and austenite stainless steel during drilling process. Wear 2013, 304, 20–28. [Google Scholar] [CrossRef]
  9. Ran, Q.; Li, J.; Xu, Y.; Xiao, X.; Yu, H.; Jiang, L. Novel Cu-bearing economical 21Cr duplex stainless steels. Mater. Des. 2013, 46, 758–765. [Google Scholar] [CrossRef]
  10. Xavior, M.A. Evaluating the machinability of AISI 304 stainless steel using alumina inserts. J. Achiev. Mater. Manuf. Eng. 2012, 55, 841–847. [Google Scholar]
  11. Korkut, I.; Kasap, M.; Ciftci, I.; Seker, U. Determination of optimum cutting parameters during machining of AISI 304 austenitic stainless steel. Mater. Des. 2004, 25, 303–305. [Google Scholar] [CrossRef]
  12. Ciftci, I. Machining of austenitic stainless steels using CVD multi-layer coated cemented carbide tools. Tribol. Int. 2006, 39, 565–569. [Google Scholar] [CrossRef]
  13. Das, N.S.; Chawla, B.S.; Biswas, C.K. An Analysis of Strain in Chip Breaking Using Slip-Line Field Theory with Adhesion Friction at Chip/Tool Interface. J. Mater. Process. Technol. 2005, 170, 509–515. [Google Scholar] [CrossRef]
  14. Natasha, A.R.; Othman, H.; Ghani, J.A.; Haron, C.H.C.; Syarif, J. Chip formation and coefficient of friction in turning S45C medium carbon steel. Int. J. Mech. Mechatron. Eng. 2014, 14, 89–92. [Google Scholar]
  15. Ahmed, M. Optimisation of Tool Wear and Cutting Forces on the basis of different Cutting Parameters. Int. J. Adv. Res. Innov. Ideas Educ. 2017, 3, 613–626. [Google Scholar]
  16. Zhou, L.; Rong, Y.; Li, Z.; Yang, J.A. Development of web-based machining chip breaking prediction systems. Int. J. Adv. Manuf. Technol. 2003, 22, 336–343. [Google Scholar] [CrossRef]
  17. Bagaber, S.A.; Yusoff, A.R. Multi-objective optimization of cutting parameters to minimize power consumption in dry turning of stainless steel 316. J. Clean. Prod. 2017, 157, 30–46. [Google Scholar] [CrossRef]
  18. Machado, A.R.; Wallbank, J.; Pashby, I.R.; Ezugwu, E.O. Tool performance and chip control when machining Ti6A14V and inconel 901 using high pressure coolant supply. Mach. Sci. Technol. 1998, 2, 1–12. [Google Scholar] [CrossRef]
  19. Nur, R.; Kurniawan, D.; Noordin, M.Y.; Izman, S. Optimizing Power Consumption for Sustainable Dry Turning of Treated Aluminum Alloy. Procedia Manuf. 2015, 2, 558–562. [Google Scholar] [CrossRef]
  20. Ezugwu, E.O.; Bonney, J. Evaluation of the machinability of Ti-6Al-4V alloy with (SiCw) whisker reinforced alumina ceramic cutting tool. In Proceedings of the COBEM 2005: 18th International Congress of Mechanical Engineering, Ouro Preto, MG, Brazil, 6–11 November 2003. No. 1967. [Google Scholar]
  21. Krolczyk, G.M.; Nieslony, P.; Maruda, R.W.; Wojciechowski, S. Dry cutting effect in turning of a duplex stainless steel as a key factor in clean production. J. Clean. Prod. 2017, 142, 3343–3354. [Google Scholar] [CrossRef]
  22. Bhatnagar, N.; Nayak, D.; Singh, I.; Chouhan, H.; Mahajan, P. Determination of machining-induced damage characteristics of fiber reinforced plastic composite laminates. Mater. Manuf. Process. 2004, 19, 1009–1023. [Google Scholar] [CrossRef]
  23. Suresh, R.; Basavarajappa, S. Effect of Process Parameters on Tool Wear and Surface Roughness during Turning of Hardened Steel with Coated Ceramic Tool. Procedia Mater. Sci. 2014, 5, 1450–1459. [Google Scholar] [CrossRef]
  24. Ahmed, Y.S.; Fox-Rabinovich, G.; Paiva, J.M.; Wagg, T.; Veldhuis, S.C. Effect of built-up edge formation during stable state of wear in AISI 304 stainless steel on machining performance and surface integrity of the machined part. Materials 2017, 10, 1230. [Google Scholar] [CrossRef] [PubMed]
  25. Dhanabalakrishnan, K.P.; Ganeshkumar, S.; Thirunavukkarasu, V. Analysis of tool wear patterns in finishing turning of inconel 718 with zirconium coated tool insert. Int. J. Appl. Eng. Res. 2015, 10, 18560–18569. [Google Scholar]
  26. Pang, J.S.; Ansari, M.N.M.; Zaroog, O.S.; Ali, M.H.; Sapuan, S.M. Taguchi design optimization of machining parameters on the CNC end milling process of halloysite nanotube with aluminium reinforced epoxy matrix (HNT/Al/Ep) hybrid composite. HBRC J. 2014, 10, 138–144. [Google Scholar] [CrossRef]
  27. Kumar, V.; Ganta, V. Optimization of process parameters in drilling of GFRP composite using Taguchi method. J. Mater. Res. Technol. 2014, 3, 35–41. [Google Scholar]
  28. Balakumaran, V.; Parthasarathy, C.; Chandradass, J. Optimization of Drilling Parameters on EN31 Steel with Chromium Coated Drill Bit by Using TAGUCHI Method. Asian Rev. Mech. Eng. 2015, 4, 18–22. [Google Scholar]
  29. Ahmadkhaniha, D.; Heydarzadeh Sohi, M.; Zarei-Hanzaki, A.; Bayazid, S.M.; Saba, M. Taguchi optimization of process parameters in friction stir processing of pure Mg. J. Magnes. Alloys 2015, 3, 168–172. [Google Scholar] [CrossRef]
  30. Kamruzzaman, M.; Rahman, S.S.; Ashraf, M.Z.I.; Dhar, N.R. Modeling of chip–tool interface temperature using response surface methodology and artificial neural network in HPC-assisted turning and tool life investigation. Int. J. Adv. Manuf. Technol. 2017, 90, 1547–1568. [Google Scholar] [CrossRef]
  31. Wright, P.K.; Bagchi, A. Wear mechanisms that dominate tool-life in machining. J. Appl. Metalwork. 1981, 1, 15–23. [Google Scholar] [CrossRef]
  32. Hamdan, A.; Sarhan, A.A.D.; Hamdi, M. An optimization method of the machining parameters in high-speed machining of stainless steel using coated carbide tool for best surface finish. Int. J. Adv. Manuf. Technol. 2012, 58, 81–91. [Google Scholar] [CrossRef]
  33. Kuram, E.; Ozcelik, B.; Demirbas, E. Green Manufacturing Processes and Systems; Springer: Berlin/Heidelberg, Germany, 2013. [Google Scholar]
  34. Kaynak, Y.; Gharibi, A.; Ozkutuk, M. Experimental and numerical study of chip formation in orthogonal cutting of Ti-5553 alloy: The influence of cryogenic, MQL, and high pressure coolant supply. Int. J. Adv. Manuf. Technol. 2018, 94, 1411–1428. [Google Scholar] [CrossRef]
  35. Razavykia, A.; Yusof, N.M.; Yavari, M.R. Determining the Effects of Machining Parameters and Modifier on Surface Roughness in Dry Turning of Al-20%Mg2Si-PMMC using Design of Experiments (DOE). Procedia Manuf. 2015, 2, 280–285. [Google Scholar] [CrossRef]
  36. Patil, R.A.; Shinde, V.D. Performance of High Pressure Coolant on Tool Wear. Int. J. Res. Eng. Technol. 2013, 2, 61–65. [Google Scholar]
  37. Balaji, M.; Murthy, B.S.N.; Rao, N.M. Optimization of Cutting Parameters in Drilling of AISI 304 Stainless Steel Using Taguchi and ANOVA. Procedia Technol. 2016, 25, 1106–1113. [Google Scholar] [CrossRef]
  38. Jomaa, W.; Songmene, V.; Bocher, P. Surface finish and residual stresses induced by orthogonal dry machining of AA7075-T651. Materials 2014, 7, 1603–1624. [Google Scholar] [CrossRef] [PubMed]
  39. Ezugwu, E.O.; Bonney, J. Effect of high-pressure coolant supplies when machining nickel-base, Inconel 718, alloy with ceramic tools. Tribol. Trans. 2003, 46, 580–584. [Google Scholar] [CrossRef]
  40. Pramanik, A.; Islam, M.N.; Basak, A.; Littlefair, G. Machining and Tool Wear Mechanisms during Machining Titanium Alloys. Adv. Mater. Res. 2013, 651, 338–343. [Google Scholar] [CrossRef]
  41. Sarıkaya, M.; Dilipak, H.; Gezgin, A. Optimization of the Process Parameters for Surface Roughness and Tool Life in Face Milling Using the Taguchi Analysis. Mater. Technol. 2015, 49, 139–147. [Google Scholar]
  42. Abukhshim, N.A.; Mativenga, P.T.; Sheikh, M.A. An investigation of the tool-chip contact length and wear in high-speed turning of EN19 steel. Proc. Inst. Mech. Eng. Part B J. Eng. Manuf. 2004, 218, 889–903. [Google Scholar] [CrossRef]
  43. Rahman, M.; Senthil Kumar, A.; Choudhury, M.R. Identification of effective zones for high pressure coolant in milling. CIRP Ann. Manuf. Technol. 2000, 49, 47–52. [Google Scholar] [CrossRef]
  44. Prasanna, J.; Karunamoorthy, L.; Venkat Raman, M.; Prashanth, S.; Raj Chordia, D. Optimization of process parameters of small hole dry drilling in Ti-6Al-4V using Taguchi and grey relational analysis. Meas. J. Int. Meas. Confed. 2014, 48, 346–354. [Google Scholar] [CrossRef]
Figure 1. Estimated response surface of tool life versus tool material and cutting speed for (a) AISI 304 and (b) AISI 2205 stainless steels.
Jmmp 02 00016 g001
Figure 2. Mean signal to noise (S/N) ratio graph for tool life of (a) AISI 304 and (b) AISI 2205 stainless steels.
Jmmp 02 00016 g002
Figure 3. Contour maps of cutting force and specific cutting energy versus feed rate and cutting speed for (a,b) AISI 304 and (c,d) AISI 2205 stainless steels.
Jmmp 02 00016 g003
Figure 4. Mean signal to noise (S/N) ratio graph for (a,c) cutting force and (b,d) specific cutting energy of (a,b) AISI 304 and (c,d) AISI 2205 stainless steels.
Jmmp 02 00016 g004
Figure 5. Normal probability plots of the residuals for (Left) AISI 304 and (Right) AISI 2205 stainless steels.
Jmmp 02 00016 g005aJmmp 02 00016 g005b
Table 1. Chemical composition and mechanical properties of AISI 304 [24].
ElementsChemical Composition %Proof Strength (0.2% Yield) MPaTensile Strength MPaElongation %Hardness HRC
C0.082155057070
Si0.75
Mn2.0
P0.045
S0.03
Cr20.0
Ni0.50
N0.10
Table 2. Chemical composition and mechanical properties of AISI 2205 [8].
ElementsChemical Composition %Proof Strength (0.2% Yield) MPaTensile Strength MPaElongation %Hardness HRC
C0.034486212531
Si1.00
Mn2.00
P0.03
S0.02
Cr23.00
Ni6.50
N0.20
Table 3. Characteristics of coating systems.
CoatingProcessLayerStructureResidual Stresses (MPa)Hardness (GPa)Thickness (µm)Coefficient of Friction
TiNPVDMonolayerColumnar nano-crystalline280 ± 2032 [25]2.50.35 [25]
TiN/TiAlNPVDMultilayerColumnar micro-crystalline550 ± 8030 [25]40.3 [25]
Table 4. Design factors and their levels for drilling tests.
ParameterCodingLevel
123
Tool materialAUncoatedTiN/TiAlNTiN
Cutting speed, m/minB132134
Feed rate, mm/revC0.120.20.32
Table 5. Experimental design using the L9 orthogonal array and experimental results.
MaterialExp.Cutting Parameter LevelT (s)Fc (N)Tc (N·m)ks (N/mm2)
Tool Materialv (m/min)f (mm/rev)
AISI 3041Uncoated130.1212015754.78750
2210.26012603.84200
3340.321810803.22250
4TiN/TiAlN130.216012603.84200
5210.328418005.43750
6340.129013504.17500
7TiN130.3242018005.43750
8210.1243011703.56500
9340.21804951.51650
AISI 22051Uncoated130.125513504.057500
2210.23011523.4563840
3340.321211253.3752344
4TiN/TiAlN130.29511703.513900
5210.325421606.484500
6340.126010803.246000
7TiN130.3231013504.052813
8210.1230011523.4566400
9340.21607922.3762640
Table 6. Response table mean S/N ratio for tool life factor and significant interaction.
MaterialPredictorLevelsMax-MinRank
123
AISI 304Cutting tool34.0840.5549.74 a15.661
Cutting speed45.0741.2936.438.642
Feed rate43.5041.587.715.793
AISI 2205Cutting tool28.6436.5948.16 a19.521
Cutting speed42.2838.9533.748.532
Feed rate41.0137.7336.234.783
a Optimum level.
Table 7. Results of analysis of variance (ANOVA) for tool life.
MaterialMachining ParametersDegrees of FreedomSum of SquaresMean SquareFPContribution %
AISI 304Tool Material258,41158,41134.560.00276.86
Cutting Speed214,21114,2118.410.03417.16
Feed rate2232123211340.2943.77
Error284511960---
Total883,393----
AISI 2205Tool Material2138,928138,9284.760.06377.21
Cutting Speed219,04119,04112.510.01710.22
Feed rate25805801.710.2475.79
Error255,53311070.050.828-
Total8214,082----
Table 8. Response table mean S/N ratio for cutting force and specific cutting energy factors and significant interaction.
MaterialResponsePredictorLevelsMax-MinRank
123
AISI 304Cutting ForceCutting tool−62.21−63.24−60.123.123
Cutting speed−63.69−62.83−59.09 a4.631
Feed rate−62.64−59.30−63.634.322
Specific Cutting EnergyCutting tool−72.78−73.82−70.703.123
Cutting speed−75.26−73.40−70.634.632
Feed rate−77.53−70.76−70.00 a7.771
AISI 2205Cutting ForceCutting tool−61.62−62.91−60.602.303
Cutting speed−62.19−63.05−59.89 a3.161
Feed rate−61.50−60.19−63.443.252
Specific Cutting EnergyCutting tool−72.20−73.48−71.182.303
Cutting speed−72.77−73.62−70.463.162
Feed rate−76.40−70.65−69.82 a6.581
a Optimum level.
Table 9. Results of analysis of variance (ANOVA) for cutting force.
MaterialMachining ParametersDegrees of FreedomSum of SquaresMean SquareFPContribution %
AISI 304Tool Material233,75033,7500.240.6485.92
Cutting Speed2487,350487,3503.410.12484.19
Feed rate257,03757,0370.400.5569.87
Error2715,613143,123---
Total8-----
AISI 2205Tool Material218,48218,4820.120.7475.76
Cutting Speed2127,022127,0220.800.41338.46
Feed rate2184,802184,8021.160.33155.76
Error2796,963159,393---
Total81,127,268----
Table 10. Results of analysis of variance (ANOVA) for specific cutting energy.
MaterialMachining ParametersDegrees of FreedomSum of SquaresMean SquareFPContribution %
AISI 304Tool Material21,815,0001,815,0000.870.3945.23
Cutting Speed24,681,6674,681,6672.250.19413.52
Feed rate228,166,66728,166,66713.510.01481.23
Error210,422,2222,084,444---
Total845,085,556----
AISI 2205Tool Material2588,760588,7600.410.5502.82
Cutting Speed21,737,7401,737,7401.280.3098.80
Feed rate217,486,50817,486,50812.870.01688.57
Error2679,1271,358,256---
Total826,574,286----
Table 11. Results of the confirmation experiment for tool life.
MaterialInitial ParametersOptimum Conditions
PredictExperiment
AISI 304LevelA2B2C2A3B1C1A3B1C1
Tool Life (s)60-310
S/N ratio (dB)7.7151.08648.16
Improvement of S/N ratio-70.45-
AISI 2205LevelA2B2C2A3B1C1A3B1C1
Tool Life (s)30-420
S/N ratio (dB)28.6453.057549.74
Improvement of S/N ratio-21.1-
Table 12. Results of the confirmation experiment for cutting force.
MaterialInitial ParametersOptimum Conditions
PredictExperiment
AISI 304LevelA2B2C2A3B1C1A3B1C1
Fc (N)1800-495
S/N ratio (dB)−69.63−54.76−64.33
Improvement of S/N ratio-5.28-
AISI 2205LevelA2B2C2A3B1C1A3B1C1
Fc (N)1350-792
S/N ratio (dB)−67.93−57.26−65.30
Improvement of S/N ratio-2.62-
Table 13. Results of the confirmation experiment for specific cutting energy.
MaterialInitial ParametersOptimum Conditions
PredictExperiment
AISI 304LevelA2B2C2A3B1C3A3B1C3
ks (N/mm2)8450-1650
S/N ratio (dB)−85.42−62.22−76.40
Improvement of S/N ratio-9.02-
AISI 2205LevelA2B2C2A3B1C3A3B1C3
ks (N/mm2)7500-2344
S/N ratio (dB)−84.12−67.72−76.62
Improvement of S/N ratio-7.5-

