Processing Parameter DOE for 316L Using Directed Energy Deposition

Advanced Research of Materials and Manufacturing Laboratory, College of Engineering & Engineering Technology, Northern Illinois University, DeKalb, IL 60115, USA
*
Author to whom correspondence should be addressed.
J. Manuf. Mater. Process. 2018, 2(3), 61; https://doi.org/10.3390/jmmp2030061
Submission received: 18 July 2018
/
Revised: 3 September 2018
/
Accepted: 5 September 2018
/
Published: 7 September 2018
(This article belongs to the Special Issue Additive Manufacturing)
Abstract
:The ability to produce consistent material properties across a single or series of platforms, particularly over time, is the major objective in metal additive manufacturing (MAM) research. If this can be achieved, it will result in widespread adoption of the technology for industry and place it into mainstream manufacturing. However, before this can happen, it is critical to develop an understanding of how processing parameters influence the thermal conditions which dictate the mechanical properties of MAM builds. Research work reported in the literature of MAM is generally based on a set of parameters and/or the review of a few parameter changes, and observing the effects that these changes (i.e., microstructure, mechanical properties) have. While these articles provide results with some insight, there lacks a standard approach that can be used to allow meaningful comparisons and conclusions to be made concerning the optimization of the processing variables. This study provides a template which can be used for making comparisons across DED platforms. The tests are performed with a design of experiments (DOE) philosophy directed to evaluate the effect of selected parameters on the measured properties of the DED builds. Specifically, a laser engineering net shaping system (LENS) is used to build multilayered 316L coupons and analyze how build parameters such as laser power, travel speed, and powder feed rate influence the thermal conditions that will define both microstructure and microhardness. A fundamental conclusion of this research is that it is possible to repeatedly obtain a consistent microstructure that contains a fine cellular substructure with a low level of porosity (less than 1.1%) and with microhardness that is equal to or better than wrought 316L. This is mainly achieved by maintaining an associated powder flow to travel speed ratio at the power level, ensuring an appropriate net heat input for the build process.
1. Introduction
The past few decades have provided great improvement in metal additive manufacturing (MAM) [1,2,3,4,5], but the consistency of the fabricated components’ properties continues to be a matter of concern. MAM components undergo thermal cycles that are unique from other fabrication options. Large thermal gradients can occur, where the temperature can vary between 40 °C and 1000 °C within a short distance (mm’s) in the build, and it can also experience rapid solidification (~103–108 K/s) [6,7]. To evaluate the effect of these unique thermal cycles seen in MAM, empirical methods are often used to correlate thermal cycles to a set of processing parameters, without grasping the complexity of the essential foundations of these effects (i.e., what role does the heat input have on solidification). This kind of approach in the evaluation of observed results is further compounded by the variety of MAM systems available, with each system having particular nomenclatures and frameworks for operational use. In addition to this, there is the issue of selecting the appropriate material and knowing what the influences of composition and or/the physical characteristics of the powders (powder shape, powder distribution, average powder size, oxide content, etc.) can have on processing parameters. Recently, several articles [4,5] have captured the latest information on the challenges facing directed energy deposition (DED). The main challenge remains having appropriate measurement tools and calibrated processes to better define a common nomenclature in which all interested parties can work from. Again, efforts have been made and are assisting in the advancement, but without a comprehensive look at the fundamental aspects, it is difficult to make significant improvements that can lead to widespread adoption.
This study provides a better understanding of the processing parameters as they relate to their influence on the thermal conditions that correlate to microstructure and microhardness. What is not really known is the minimum energy required to produce an “acceptable” build. Here, we define “acceptable” as a sample that has mechanical properties which are good or better than wrought with minimal porosity. Approaching it from an energy standpoint rather than processing parameters enables a standardization process that moves beyond systems and looks at the total outcome. This paper is a first step in understanding how the processing parameters and the associated energy are interrelated.
Recently, the authors in [8] developed an approach to create normalized energy processing diagrams for MAM that can provide a priori knowledge of the microstructure. The process maps contain isopleths of normalized equivalent energy density () that show the ranges of acceptable microstructures. The concept of normalized equivalent energy comes from the ratio of dimensionless volumetric heat input per scan line to the dimensionless hatch spacing [8]. This tool is a great starting point as it enables comparisons across system platforms. As such, this concept is used in this study to develop a design of experiments that is traceable to an energy metric.
With this energy metric in mind, it is important to define what the critical processing parameters are and see what process control mechanisms can help yield the necessary property outcomes. To avoid creating a new nomenclature and causing further confusion, it is important to look at previous work. In 2006, the authors of [9] demonstrated that process control could be achieved for DED by monitoring the IR-temperature signal during the process. In their study, three groups of thin walls of 316L were deposited under three different processing conditions: (1) different laser powers, (2) constant set-values, and (3) path-dependent set-values. The process control with a path-dependent set-value ensures a nearly constant melt pool size and solidification conditions, resulting in a homogeneous microstructure, hardness, and a high dimensional accuracy of the deposited sample. While this study was limited to thin walls, it demonstrated that with the appropriate cooling conditions, it is possible to obtain consistent microstructures so long as it is possible to control the heat input. In 2007, the authors of [10] studied the ratio of optimal parameters of layer thickness and power input (Pin) per unit travel speed (Ts) for selective laser melting (SLM). It was shown that the greater the ratio of Pin:Ts is, the larger the re-melted line (called “vector”) is. This work experimentally showed that there is a limit to the amount of energy one would like to deposit per unit layer so as to minimize the re-melting during subsequent layers. This is the powder bed fusion (PBF) approach used to understand the importance of energy balance when creating layers. They studied the Pin:Ts ratio as a fundamental metric and it appears to be an effective linear strategy to optimize thin wall features. The work carried out in this present study provides the same insight, but with respect to DED and large multilayer deposited samples.
In 2010, the authors of [11] showed that optimal scanning parameters (laser scan speed, laser power, and capillary instability of segmental cylinders) in the PBF process are a function of the thickness of the deposited powder. They also demonstrated that at higher laser powers, the range for optimal scanning speed that can be utilized is larger, but that the range narrows as the thermal conductivity of the metal increases. They later looked at the Pin:Ts ratio as a function of the layer thickness and determined an experimental limit for this relationship. They found a strong negative correlation between the thermal conductivity of bulk material and the range of optimal scanning speed (the speed in which a continuous track with penetration to substrate can be achieved). This gives a guideline for understanding the impact of the powder flow rate, since in LENS, this parameter plays an important role in determining the optimal scanning speed for the DED process.
In [12], the authors claimed that laser output power and laser travel speed played significant roles in determining the final dimensions of the deposited components. In [13], the authors, through a semi-empirical model, demonstrated that in order to eliminate porosity in LENS builds, the linear mass density (i.e., the optimal mass deposition per unit time) should not exceed a maximum level. The maximum level of linear mass density that should not be exceeded is the ratio of the powder flow rate (dm/dt) to laser velocity (dl/dt), which is defined as the optimal linear mass density. In this paper, there is a limit not to be exceeded, which is the ratio of the powder feed rate to travel speed [Pf:Ts], and this ratio represents the maximum amount of powder which can be deposited per unit length of laser travel at a given laser power setting.
In 2015, the authors of [14] studied the microstructure and mechanical properties of DED for 316L stainless steel (SS) and their dependence on thermal history. They observed that finer microstructures are achieved when there are longer local time intervals, enabling higher cooling rates. This paper shows that for the geometries built, a consistent fine cellular substructure was achieved in part by having cooling at the base of the plate in addition to the controlled powder feed to travel speed ratios, limiting the heat input. The results obtained in this paper agree with what was found in [7,15] and confirm that the mechanical properties would be similar to those reported. Now, the main focus is to highlight the design of experiments and the necessary steps that are required to achieve these repeatable results for the large samples built over a period time (in this study, it was over two years). This way, others can review this material, repeat the process, and share their results and provide feedback on the process established in this article.
2. Design of Experiment for Repeatable Results
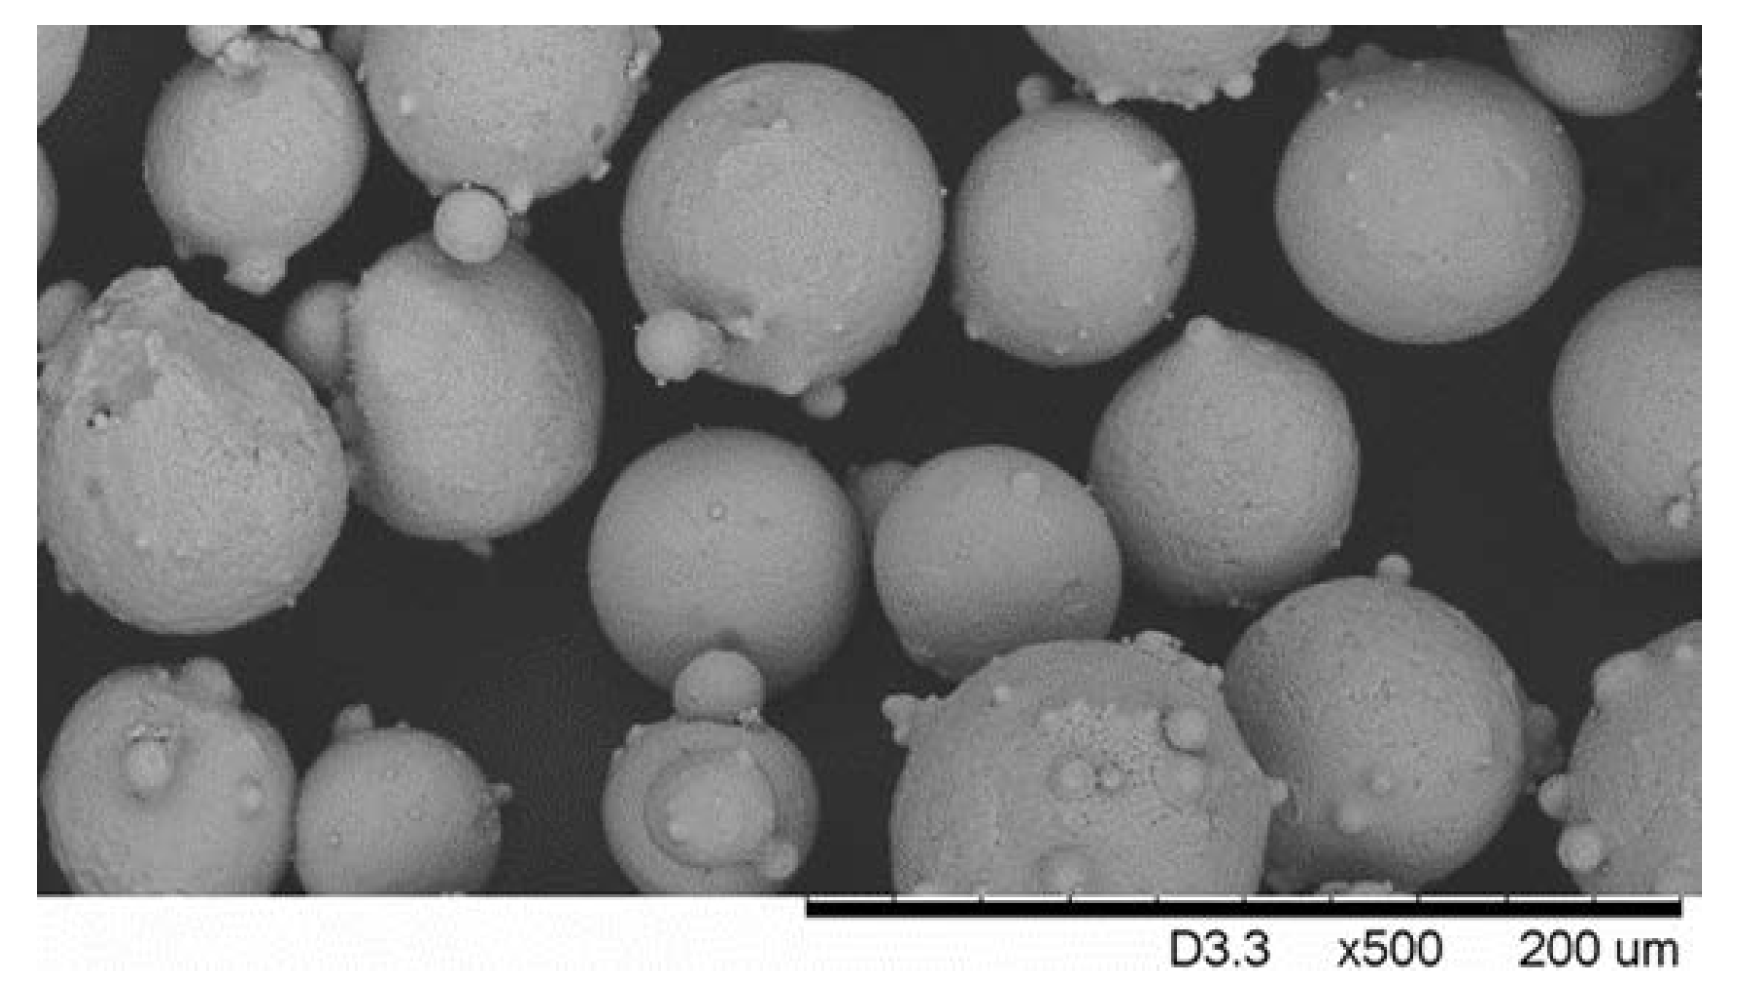
As described in [16], one of the first issues that must be dealt with prior to making any builds is the quality of powder. They concluded that if your initial powder contains porosity or large void/particle size ratios, then your final builds will also have similar porosity issues. As such, to perform this work over a long period of time (~two years), a large quantity of gas atomized stainless steel micro-melt 316L (17.9% chromium, 70.5% Iron, 9.3% Nickel, 0.3% Silicon, 0.3 Sulfur, 1.8% Manganese) was purchased. This powder (−140 + 325 mesh; log-normal size distribution) is used in all the reported experimental data unless noted otherwise. Figure 1 shows a sample taken with our HITACHI TM-1000 scanning electron microscopy (SEM), illustrating that the particles are generally spherical with smaller satellite particles attached (i.e., cohesion of particles during the solidification in the atomization process).
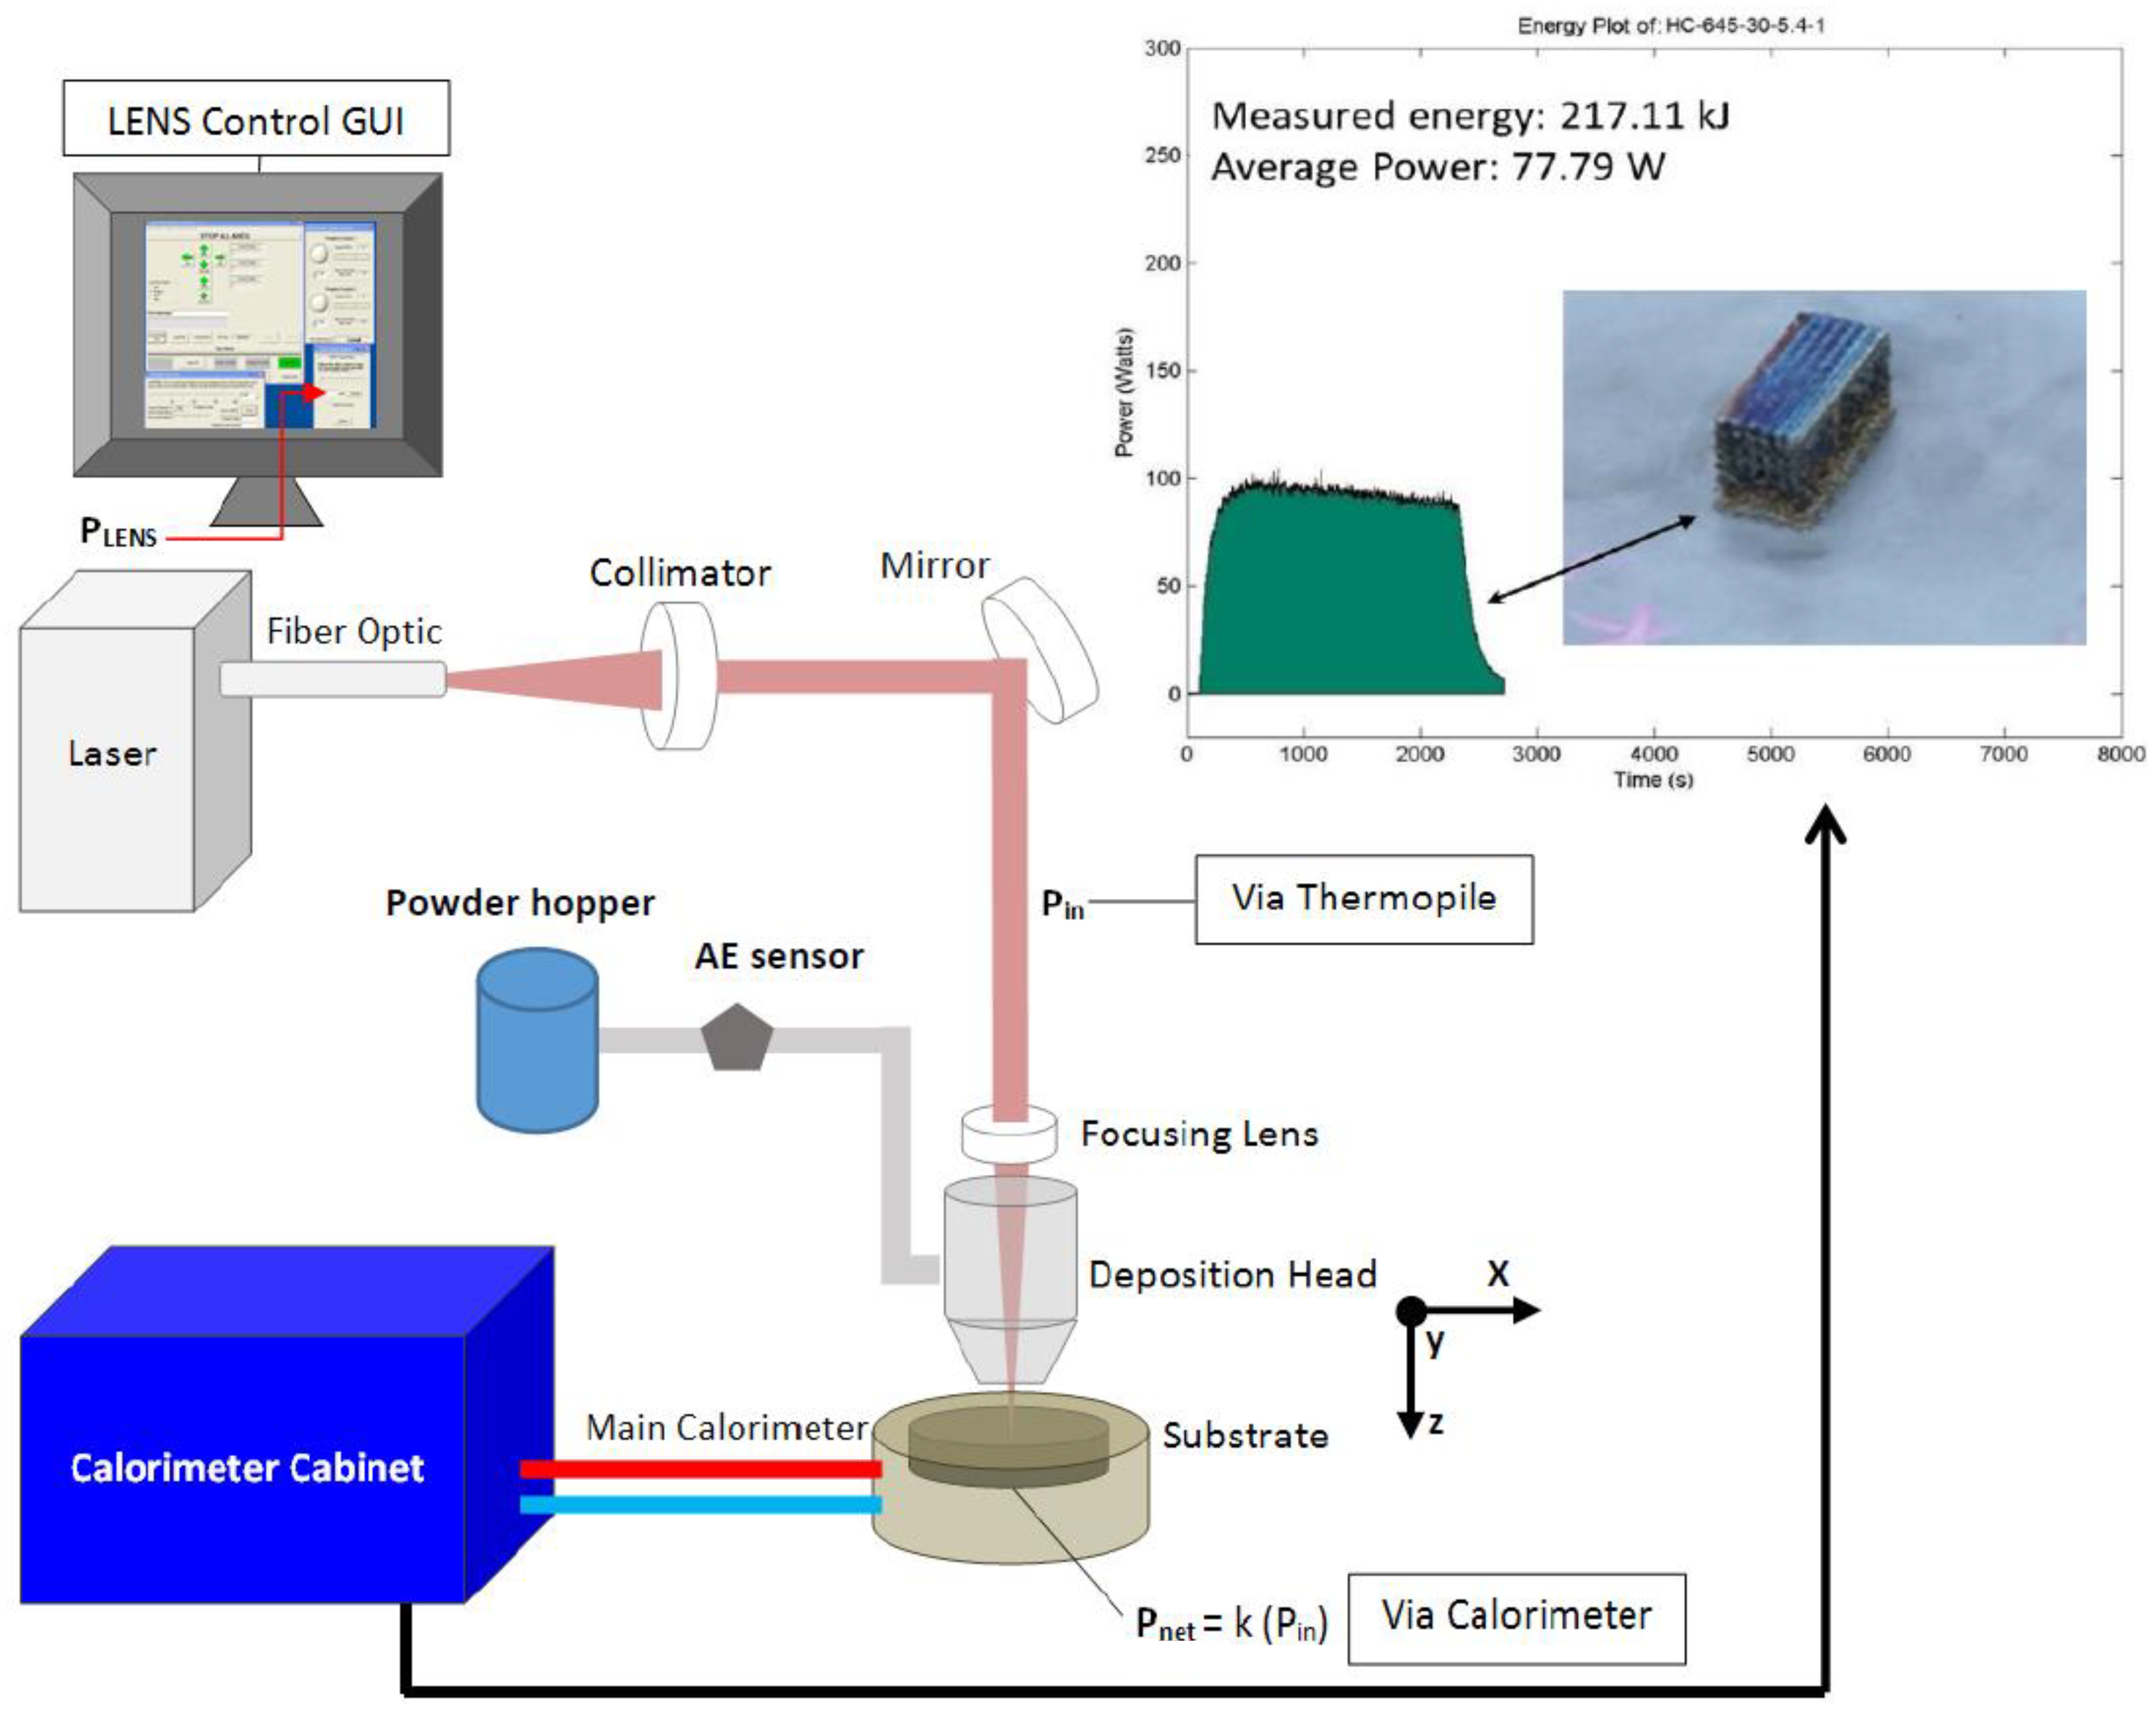
All the builds were performed on a LENS 850 M system in which the deposition head moves in x and y directions and the build plate moves in the z direction (see Figure 2). Two custom built, in-situ process monitoring devices were utilized for this work: one has the capability to measure powder flow in real time [17], and the other can monitor the energy density during builds [18]. These devices were part of a larger study taking place at NIU’s Advanced Research of Materials and Manufacturing (ARMM) Lab on process monitoring and property control for MAM [19], which was sponsored by NIST MSAM. An in-situ acoustic emission sensor in the LENS monitored the powder flow as a function of time (Figure 2), and in this way, the mass flow rate could be independently tracked during the build [17]. The presence of the sensor is critical to determining the appropriate powder flow since the powder flow has a strong influence on the balance of the available energy.
As described in [18], the power measurement calorimetric system (PMCS) has the ability to measure things like net heat input and the energy transferred during MAM processing, which allows for a very accurate calculation of energy of the build process (see top right corner of Figure 2). Furthermore, efficiencies of the MAM processes can be calculated as in [19], which can contribute to a greater understanding of the resultant metallurgical properties of various build parameters. Previous studies [9,20,21] show the importance of controlling and utilizing net heat input for additive manufacturing, particularly for modeling and simulation. Heat input is known as the amount of energy that is transferred to the base metal by a source of energy per unit of weld length. It can be expressed as:
and so net power Pnet is defined as:
where Pin is the input power generated by the energy source in Watts (i.e., laser) and Pnet is the net power transferred to the substrate in Watts. Another important parameter that is often estimated is the thermal efficiency ‘k’, which defines the percentage of Pin transferred to the substrate, and finally Ts is the travel speed of the energy source.
H = Pnet/Ts (J/cm)
Pnet = k Pin
With this definition, we can now see the importance of measuring Pnet. In addition to its measurement, it is also shows how important the thermal efficiency is in determining net power. Therefore, the influence of Pnet is difficult to overlook, at a constant travel speed, and Pnet (rather than Pin) is directly responsible for all physical and metallurgical changes in metal being deposited, including bead shape, bead integrity (i.e., porosity), metallurgical characteristics (i.e., microstructure), and mechanical properties (i.e., hardness). With respect to modeling and simulation, Pnet is a critical variable that can help in the prediction of thermal conditions; weld pool characteristics; weld geometry, integrity, and properties; and distortion.
The ability to directly measure and know Pnet is therefore necessary to improve the overall capabilities of metal additive manufacturing. Finally, although not the main focus of this paper, it now creates a direct connection to the concept introduced in [8], which is to use something like the normalized equivalent energy density () to help define a priori the outcomes of the build. In this work, measured energy density and net heat input from the calorimeter are used to qualify DOE results. As such, it is important to note that all the tests carried out in this study had an energy measurement associated with it and provided another metric that helps define the repeatability of our DOE.
The aim was to develop a universal procedure that any powder delivered DED user could follow, and the concept was to create a matrix of powder feed to travel speed ratios. This matrix was modified as needed; however, literature has shown that studies have been performed between 300 W–1000 W, so the idea was to start at a power level in the median range of approximately 645 W.
Table 1 shows the experimental matrix set up for this study. Column three shows a range of travel speeds from 127 to 1143 mm/min. Column four then shows the adjusted powder flow rate in g/min for each travel speed so that a consistent powder flow to travel speed ratio can be achieved with each bead. It is important to note that with the in-situ powder flow monitoring, we can detect any deviations from the intended powder flow and as such, all values measured were within the intended scope of these ratios. Intuitively, one can recognize that there will be a potential optimized region within this matrix at a given power level. Our aim was to find out what this optimized parameter set was for an input power (nominal) of 645 W. This means that on the LENS machine, the power level was set to 645 W. This nominal power was utilized since this is the common practice within the literature; here, it is defined as PLENS. As such, a total of 90 beads were built by producing 10 beads at each travel speed with the adjusted linear mass density (ratio of powder feed rate Pf to travel speed Ts) ranging from 0.007 to 0.025 g/mm. It should be noted that all beads were 20 mm in length and all measurements were done at the midway point taking that as a steady state for equal comparison.
A 3 kW IPG Nd:YAG fiber laser was utilized with an initial LENSpower of 645 W (Listed in Table 1). A series of laser power measurements (using a Molectron PM5 power meter) were taken before and after builds to determine the actual input power, which for at PLENS = 645 W, the actual power measured was ~470 W (Pin), and these are shown in Table 2. Knowing the actual absorbed laser power is important so that when we perform our energy analysis, we can account for the amount of energy actually absorbed during the build.
Once the 90 beads were built, it was then necessary to characterize the quality of the individual beads to determine which parameter setting(s) yielded the best result. The determination of what was considered as the best result yielding an “ideal” bead is described below.
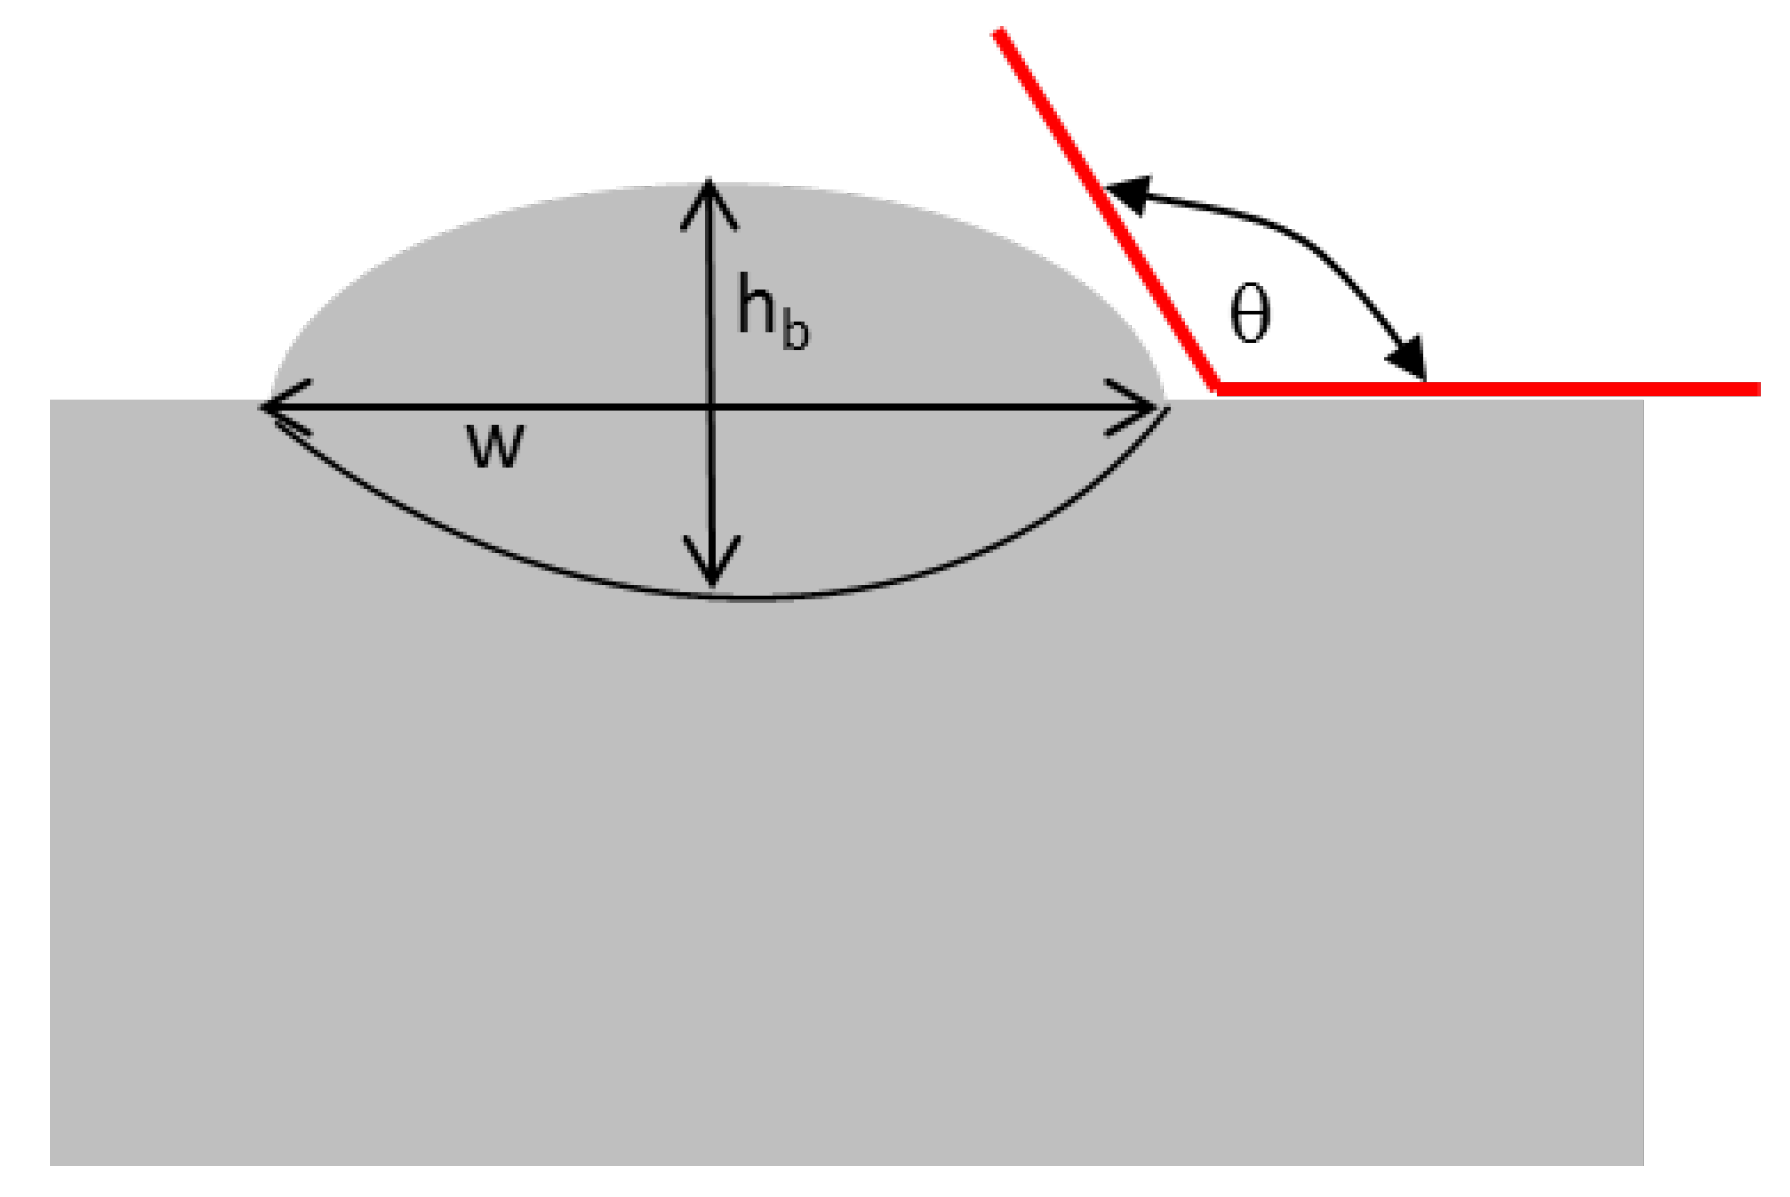
From a historical context, it is possible to utilize the welding industries perspective to define the shape of the bead since it is well known that it will determine the quality of the weld. The LENS process creates a melt pool while delivering powder to the substrate at this melt pool, which solidifies in a very short period of time. As such, utilizing the contact angle relationship described below is applicable. A contact angle of less than 90° causes the bead to spread over the surface. Spreading over the surface will fill the gaps between two neighboring beads, which helps decrease the porosity between beads. One can argue that this is also true in AM, but not much work has been done to define what is required. For this study, we define the idealized shape of beads by calculating the contact angle using (3) (see Figure 3):
where hb is the total height of the bead, w is the width of the bead, and is the contact angle [13]. The contact angle is an important parameter for controlling porosity. This definition is used because there is no porosity at an optimal linear mass density [13]. It was also observed that this optimal linear mass density increases with an increase in the laser travel speed. Experimentally, the observations in this study showed that at a specific linear mass density (Pf/Ts ratio), porosity was at a minimum (less than 1.1%). However, by increasing the powder feed rate, the contact angle increases, which results in an improper bead geometry, causing gas entrapment between the beads and increasing the porosity. Vickers hardness was also selected as another criteria for bead selection. Maintaining a uniform hardness is critical to the process selection for MAM. As described in both [6,7], there is a fine cellular substructure that is seen when 316L is used in MAM; as such, our beads should have this fine cellular substructure which has been shown to provide a higher than normal microhardness when compared to wrought 316L [7]. As we move to the larger builds, the goal is to control the size of the grains and ensure that we can generate a predominant formation of this fine cellular substructure in our builds.
Experimental work started with the single bead analysis. To summarize the physical characteristics considered, the cross-sectional area (see Figure 3) of each bead was analyzed for the following conditions: (a) contact angle that is no larger than 110°; (b) Vickers hardness (>220 HVN); (c) distribution of fine cellular substructure; and (d) porosity. With these criteria in mind, when possible, an “ideal” bead was selected from each travel speed within the 90-bead experiment.
In addition to the process parameters and Pf/Ts ratio, with this experimental design, the aim is to have another metric based on the energy of the process to provide a complete picture. As mentioned in [8], they introduced the concept of a normalized equivalent energy density that shows ranges of acceptable microstructures. Essentially, at higher values of , this means that the process parameters utilized will lead to an excessive heat input which will lead to things like cracking and or swelling. The opposite is true at lower values of , meaning there is not enough energy to melt and or fuse the powder, which will generate porosity. Looking at the work done in [8], it shows that for PBF, there is a range for an acceptable microstructure in 316L between = 2 to 4.
While this normalized equivalent energy density will be confirmed for this study, it should be noted that one of the metrics utilized in this study can be measured in-situ and that is the associated measured energy (that is total energy measured during build of sample, Figure 2). In [18], the concept of net heat input and the measured energy were described and the results are given in [19]. During builds, the results from the calorimeter were recorded and several outputs were analyzed and are discussed later. They are laser energy transfer efficiency (%), net heat input (J/m), and measured energy (kJ); this last value is measured directly from the calorimeter (see top right corner of Figure 2), while the others are calculated based on this data and help bring another perspective to the processing parameters. While further work needs to be done in this area, and is not the main scope of this article, it can be said that experimentally, there appears to be significance in the data obtained from the calorimeter and that it could provide a better understanding of processing parameters for MAM.
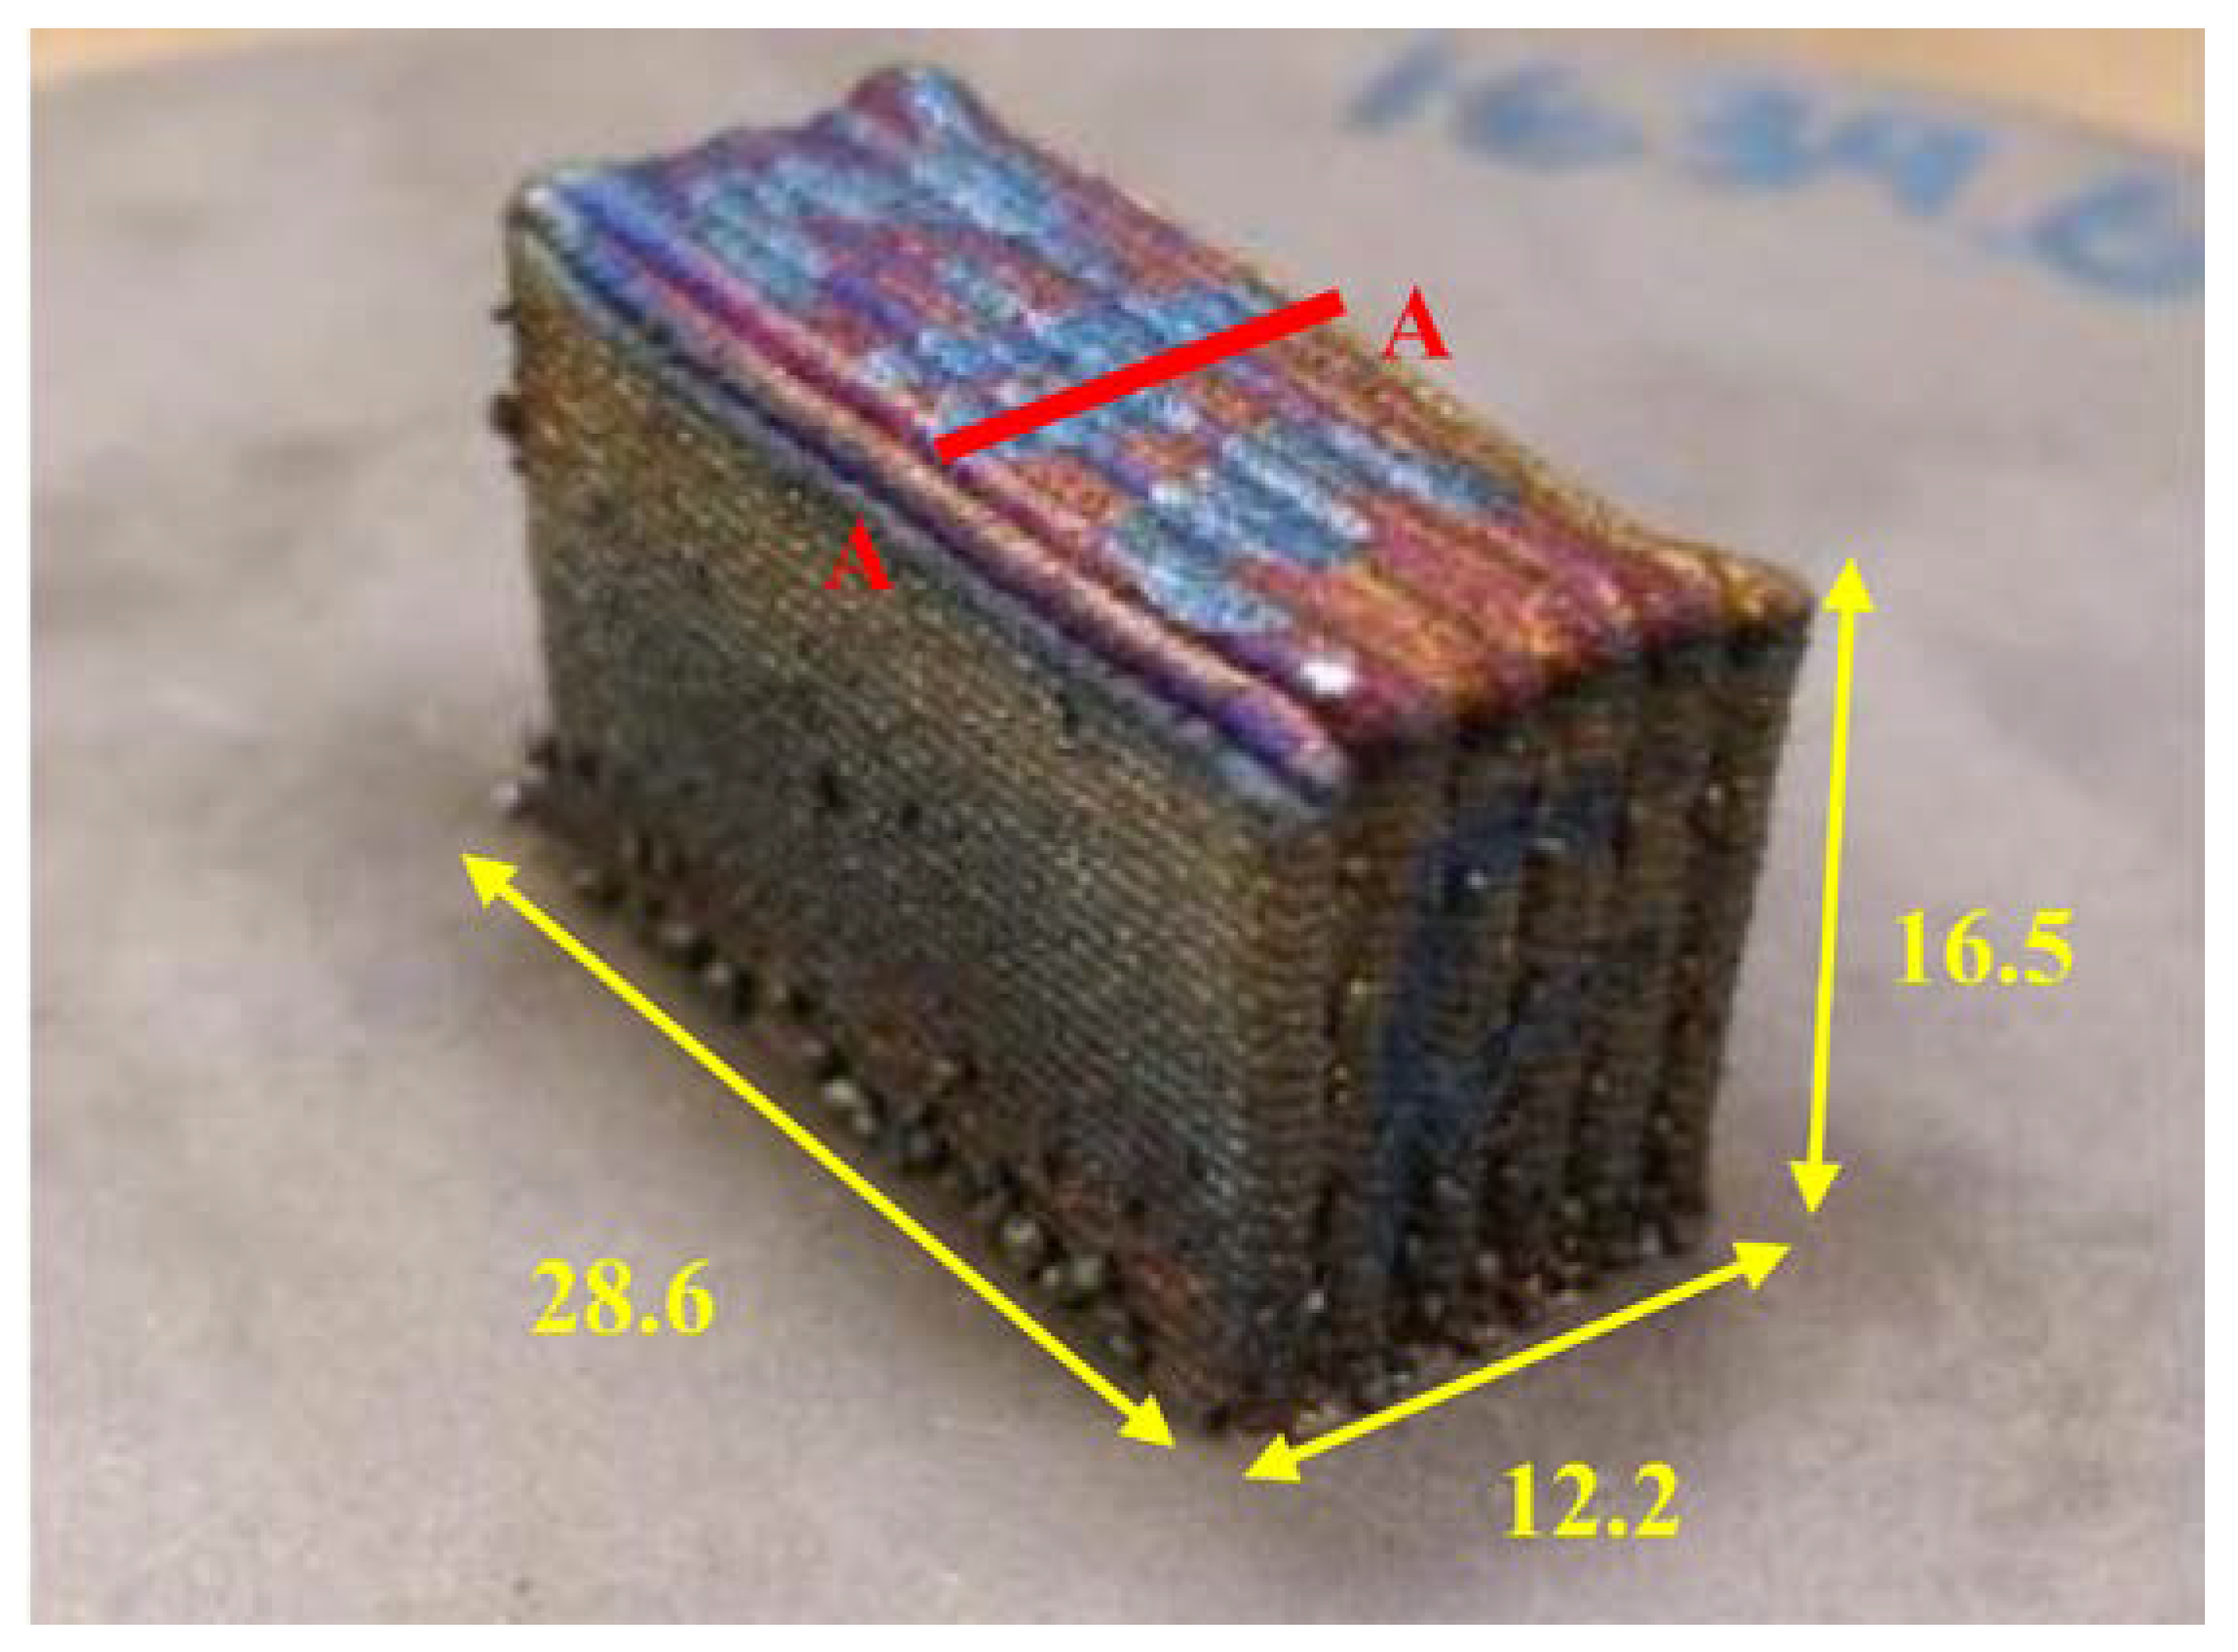
Once the single beads were carefully vetted and selected based on all these parameters described above, the aim was to see if this relationship would remain for larger multilayered builds. This is another point of departure from the literature that typically looks at single wall builds. An example of a multilayer sample using the selected Pf:Ts ratio is shown in Figure 4. For each build number, a set of three samples of the size 12.2 × 16.5 × 28.6 (W × H × L) cubic mm’s was built and these samples were then analyzed with the same criteria.
3. Results and Discussion
Table 2 shows the processing parameters that were chosen for the selected beads from the 90-bead DOE for this study. These beads were chosen to represent a range of powder feed to travel speed ratio across (Pf:Ts Ratio) the PLENS 645 W power setting. Based on the criteria described above, the optimized bead at each travel speed had a linear mass density (Pf:Ts Ratio) between 0.011–0.013 g/mm (see column 5, Table 2). Based on this observation, two beads were selected with a linear mass density at 0.011 and 0.013 g/mm (the selected beads are identified as builds #36 & 55, respectively). In order to confirm the performance of the Pf:Ts Ratio concept, three more build numbers were chosen: Two samples that had a higher than ideal Pf:Ts Ratio (builds #7 & 10) and one that had a lower than ideal Pf:Ts Ratio (build #81). Only one from the lower than ideal ratio was possible to build for comparison. This was mainly due to the fact that porosity was hard to control at the higher travel speeds. It would be expected that the higher and lower ratios from the “ideal” condition would not yield good results. Let us recall that identifying and maintaining a proper Pf:Ts Ratio (i.e., linear mass density) is critical to producing repeatable structures. The concept of not exceeding a linear mass density to avoid porosity was introduced and discussed in [13], but there was no clear direction as how to clearly define what the “ideal” conditions are to ensure a repeatable build beyond what was achieved. In this work, by intentionally choosing parameter conditions that were perceived outside the “ideal” setting, it is possible to confirm if this Pf:Ts Ratio concept can provide a metric that can be utilized for future work. With this in mind, the samples shown in Figure 4 were built as mentioned and sets of three samples were built for each build number.
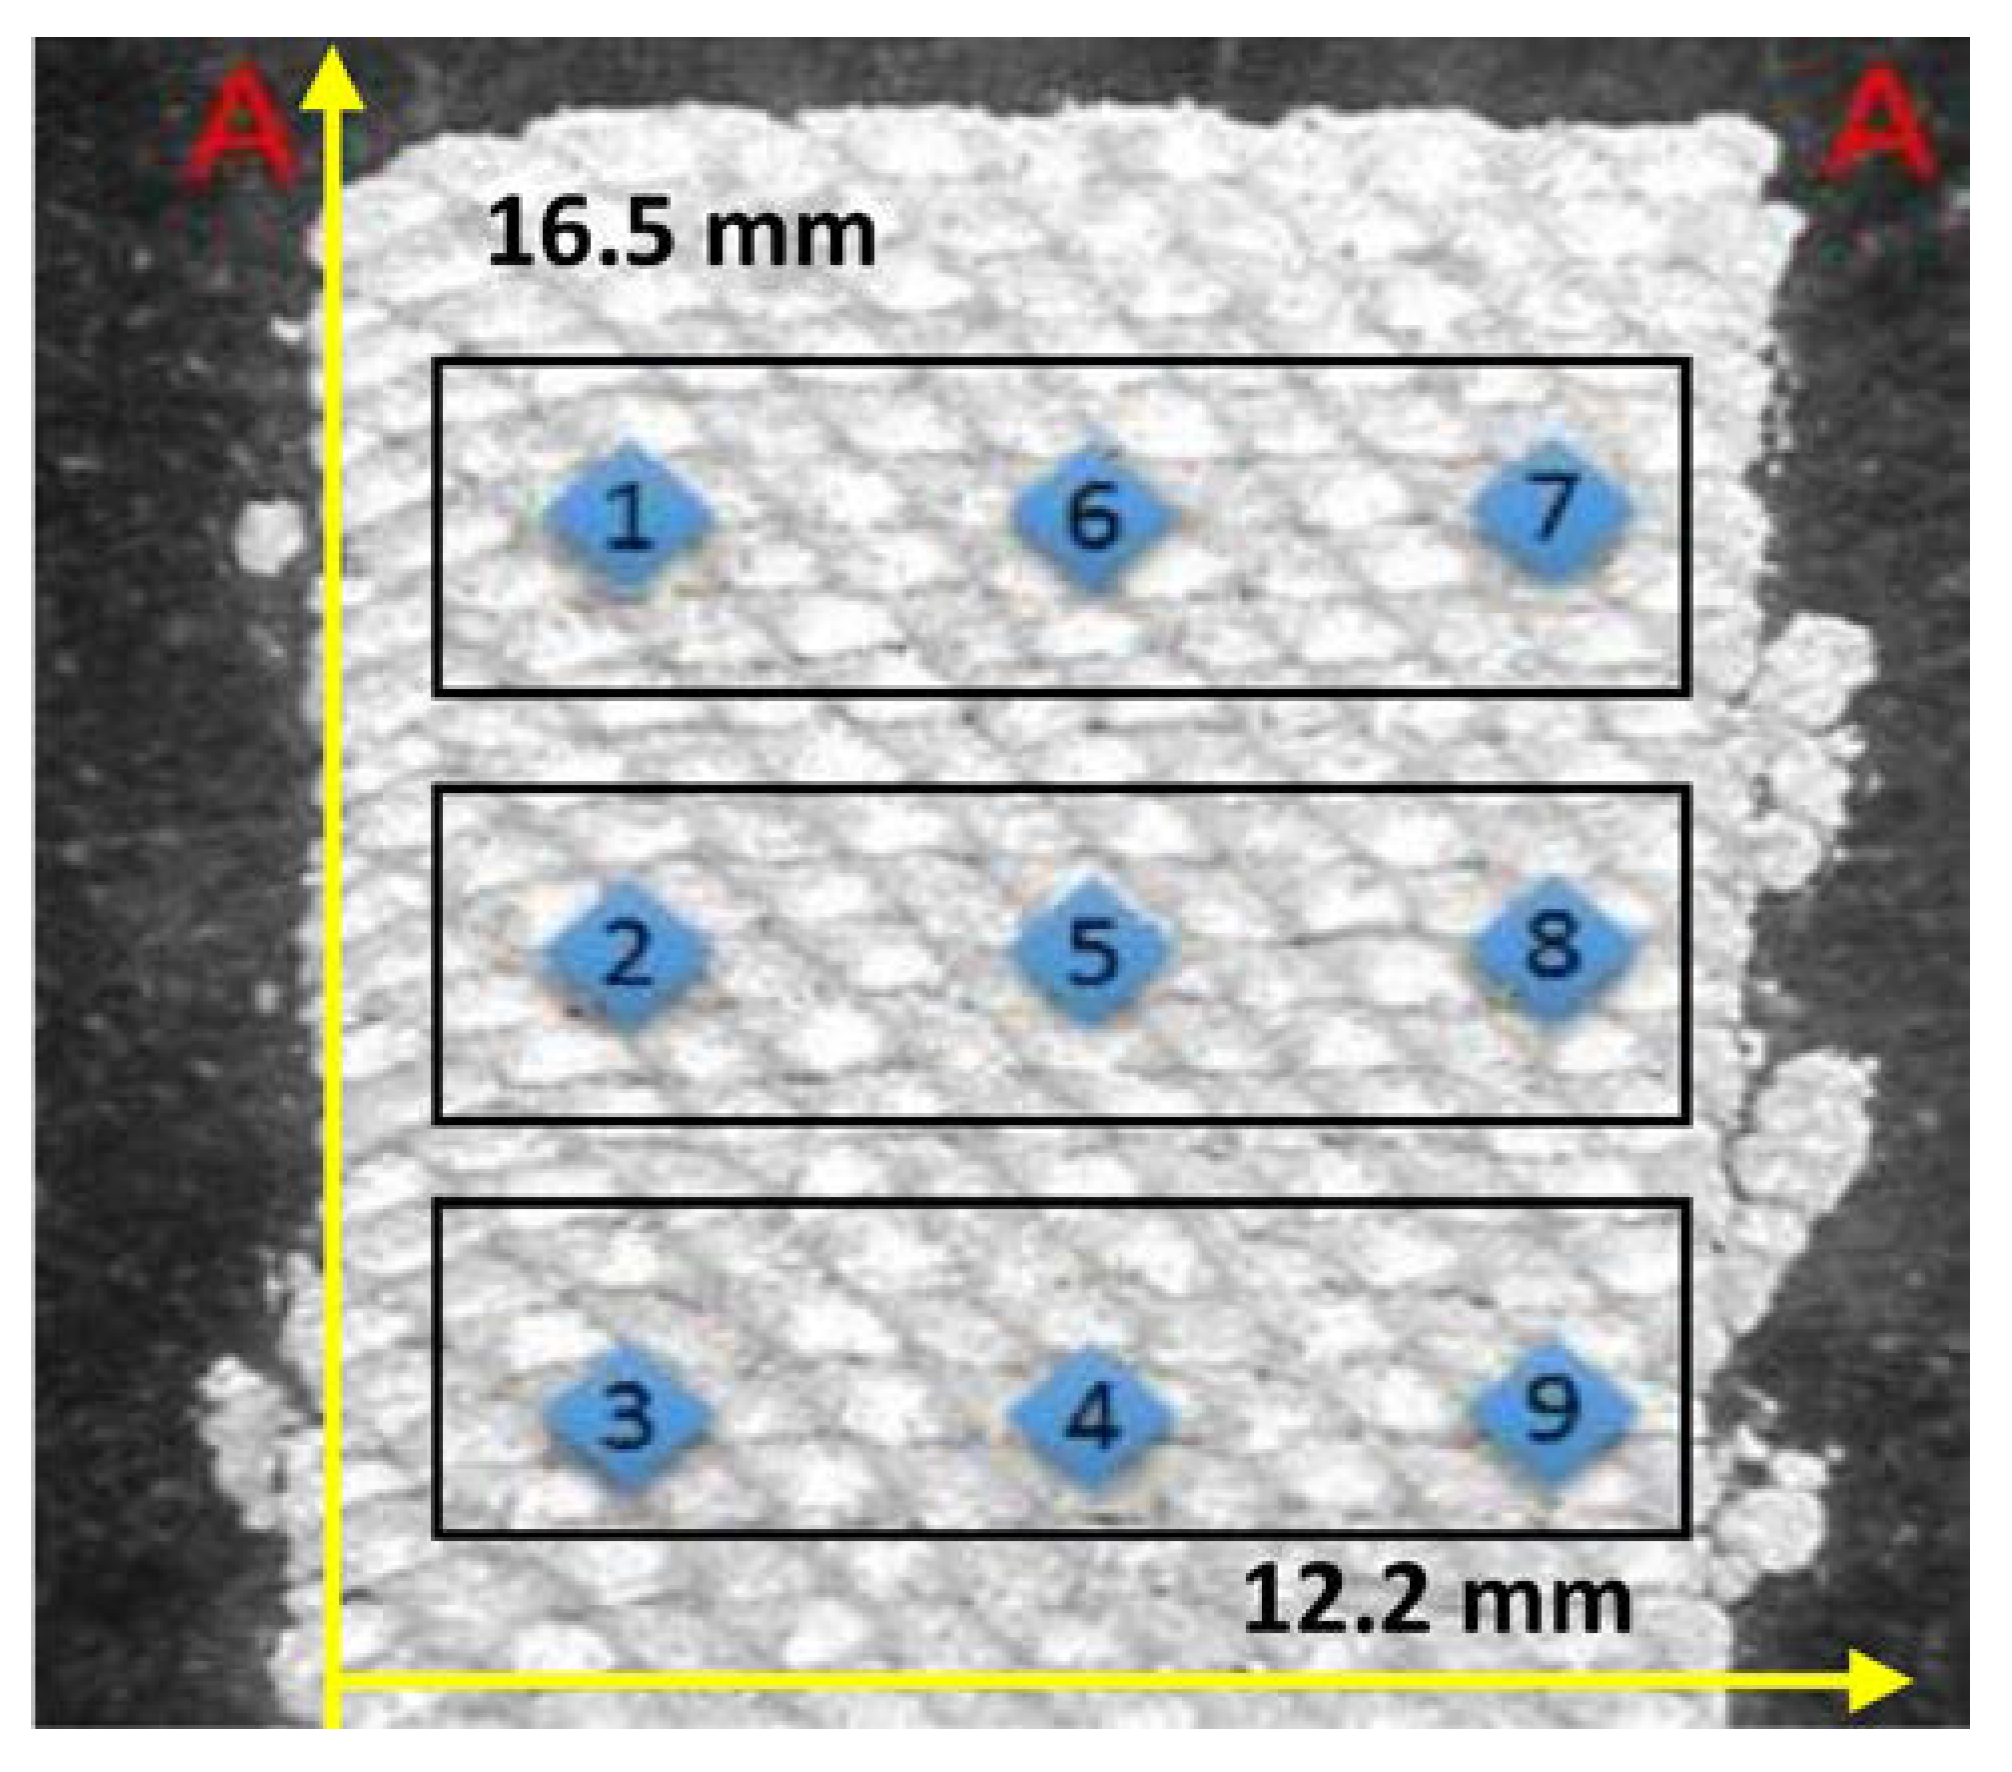
In order to observe the microstructure, the three samples built (shown in Figure 4) per build number were cut at the midsection (see Figure 4 section A-A) so as to represent a steady state during the build process. The microstructure was characterized using our SEM and a Moticam 2000 CCD connected to an Olympus PMG3 microscope. The standard method for microscopy observation that was used is based on the ASTM standards for samples. The samples were mounted and polished to 1 micron and etched with a 10% Oxalic acid compound using an electrolysis technique at 6 volts from 10 to 15 s [22]. The microhardness was measured with a Mitutoyo hardness testing machine with a force of 0.2 Kgf and a 10 s dwell time. It should be noted that measurements were taken at other locations along the build direction as part of our larger study, and the results were the same as those presented here in the midsection A-A (see Figure 4). Afterwards, the cross sections of the samples were mounted, grinded, and etched (see Figure 5). Vickers hardness measurements were carried out on the cross-sectional area of each of the three samples built per build number. As shown below (see Figure 5), nine independent microhardness measurements (three in each section—top, middle, and bottom) were taken on the cross section of the as built samples.
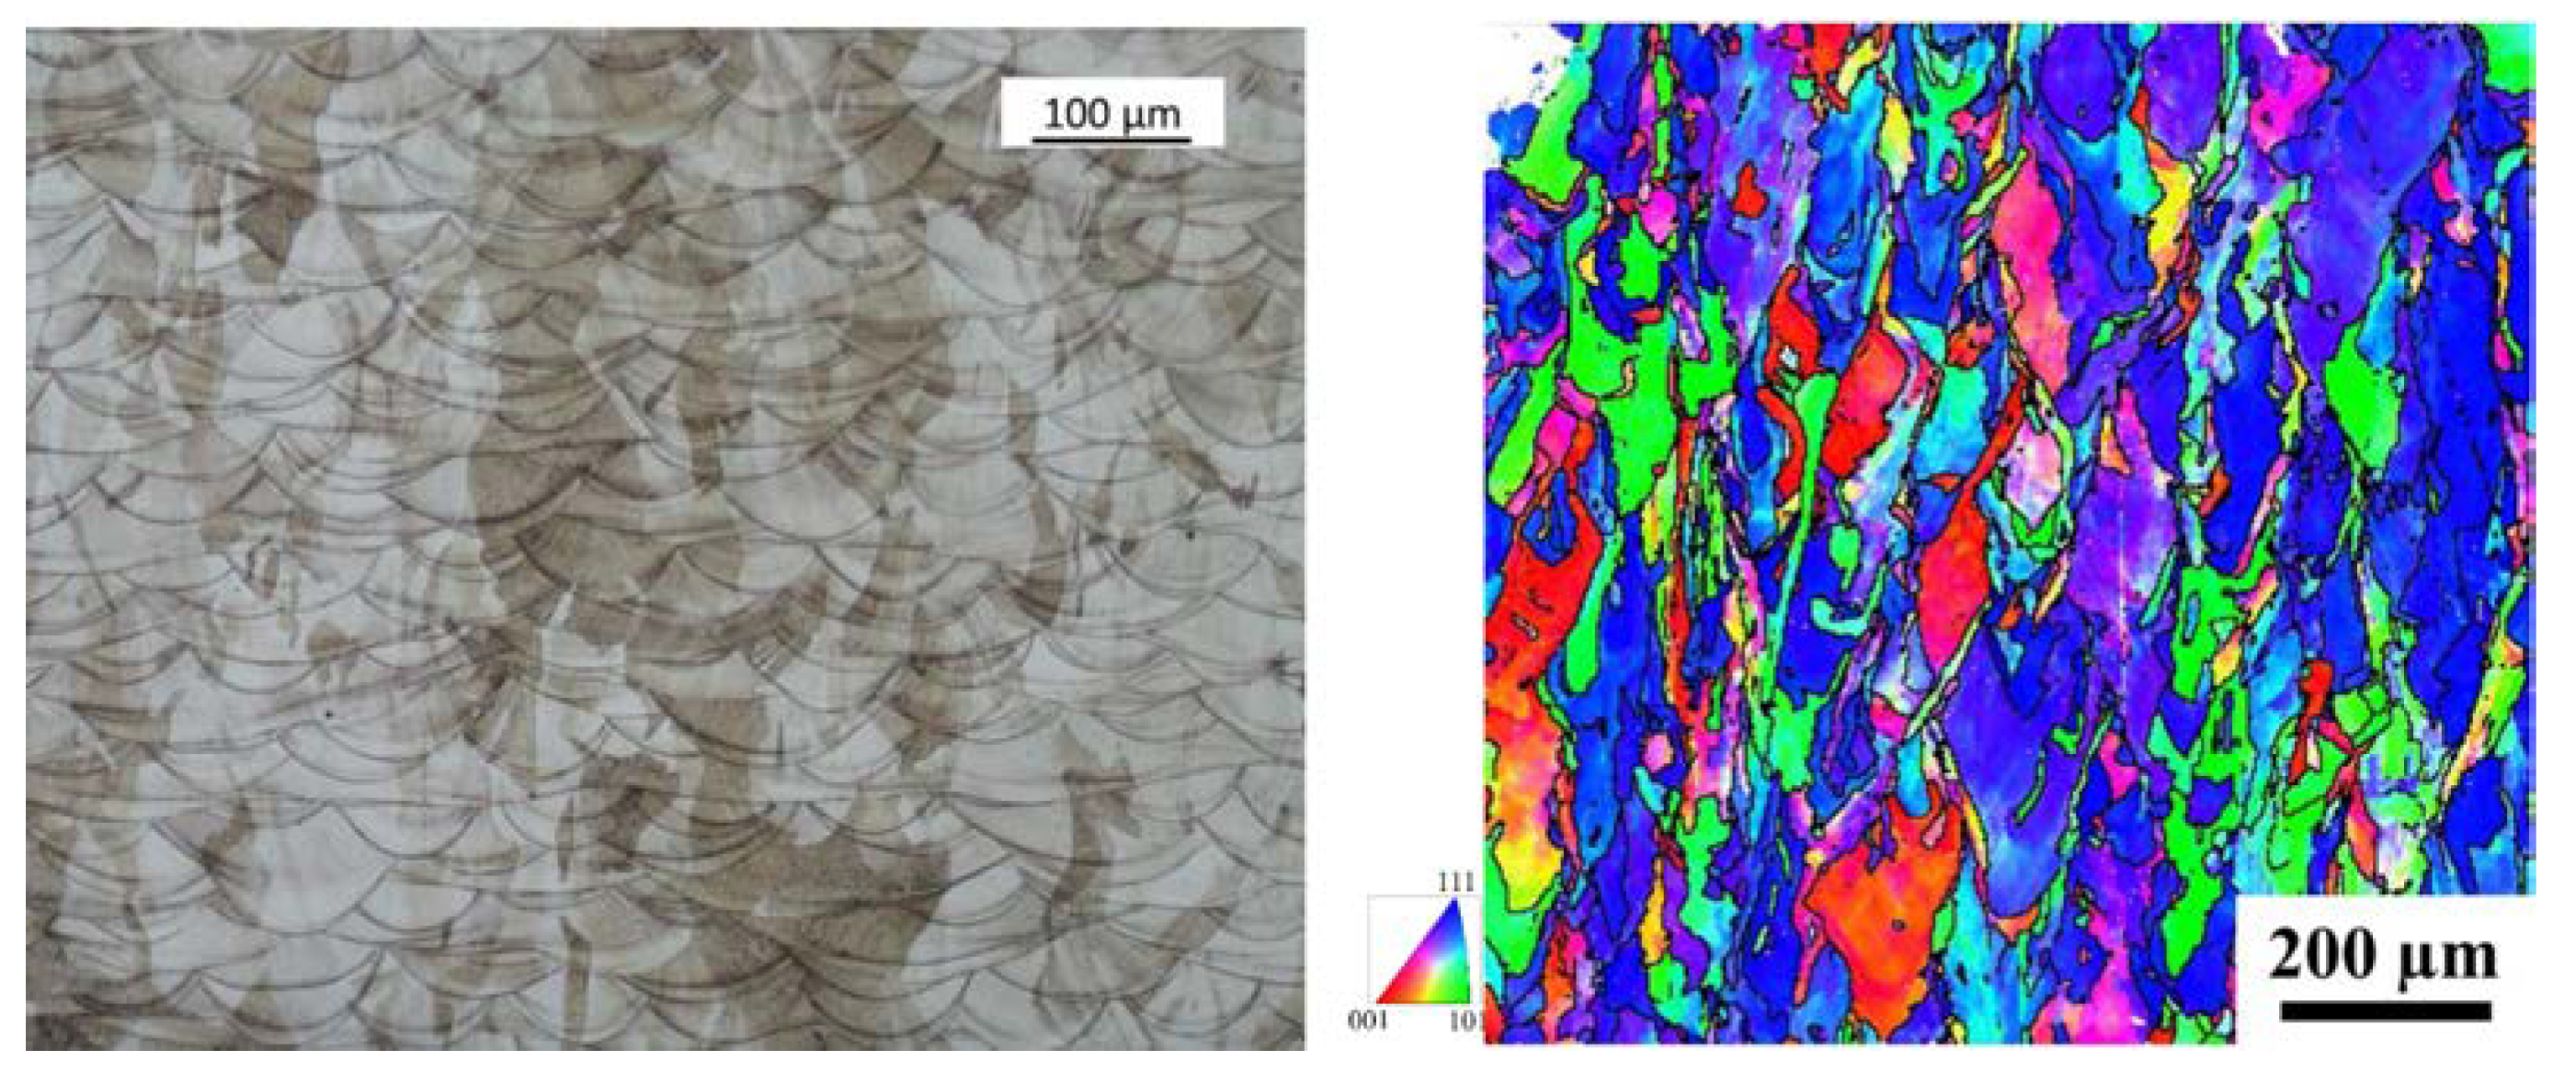
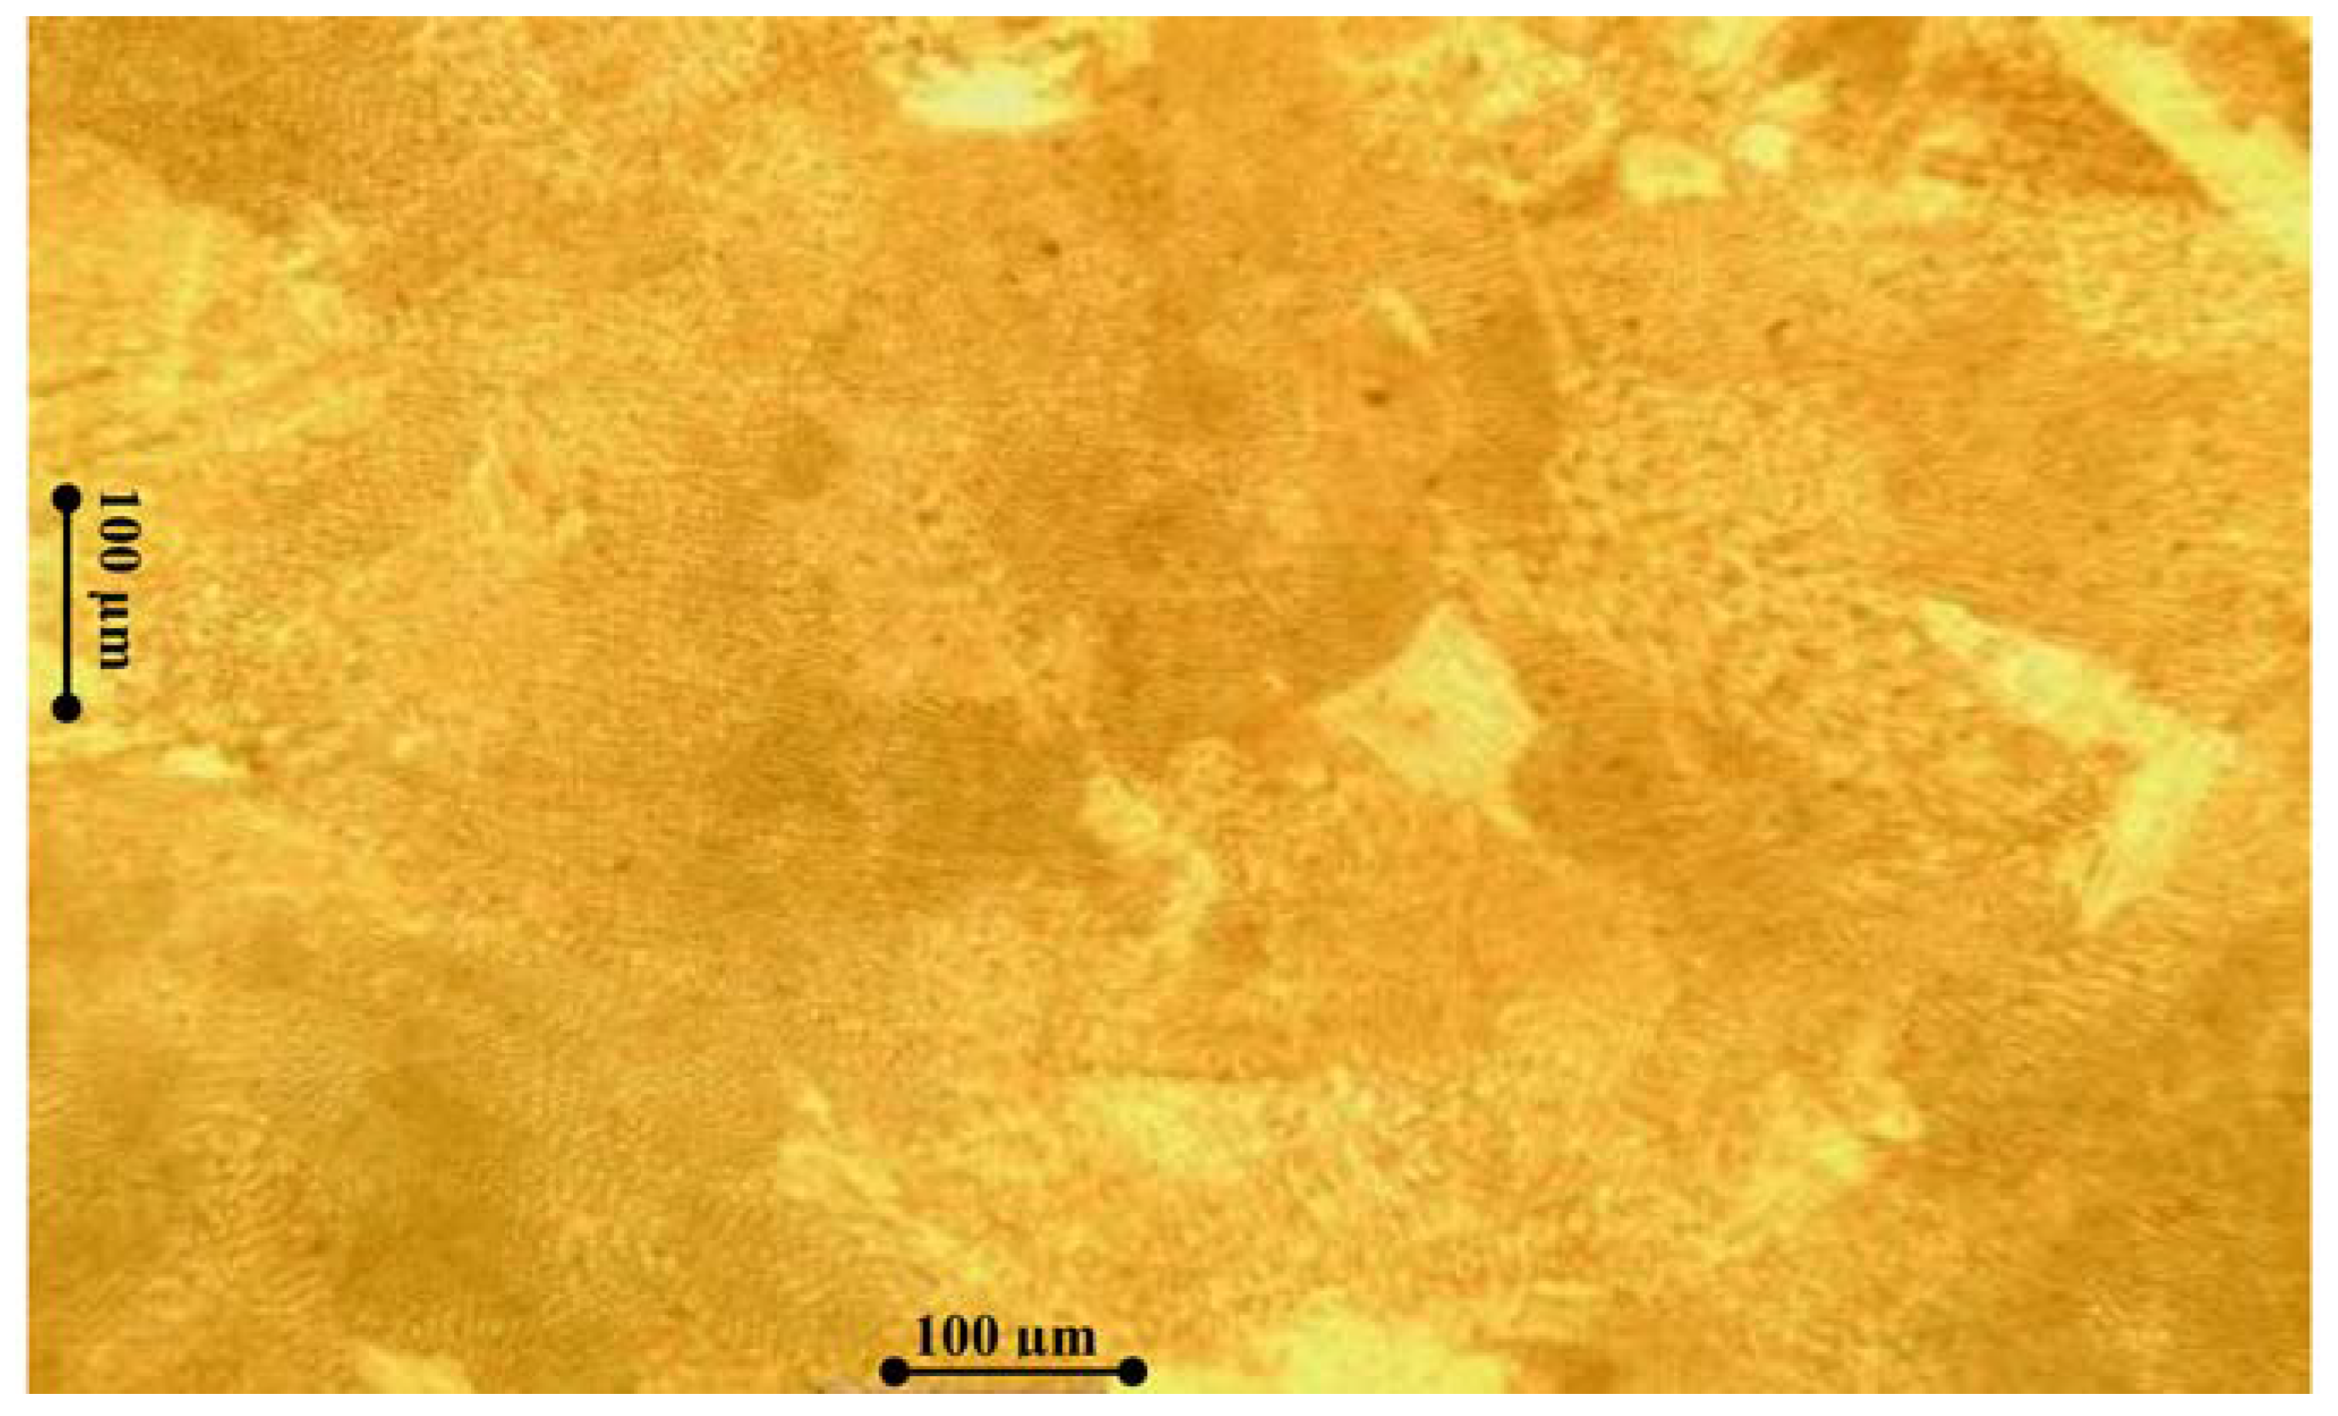
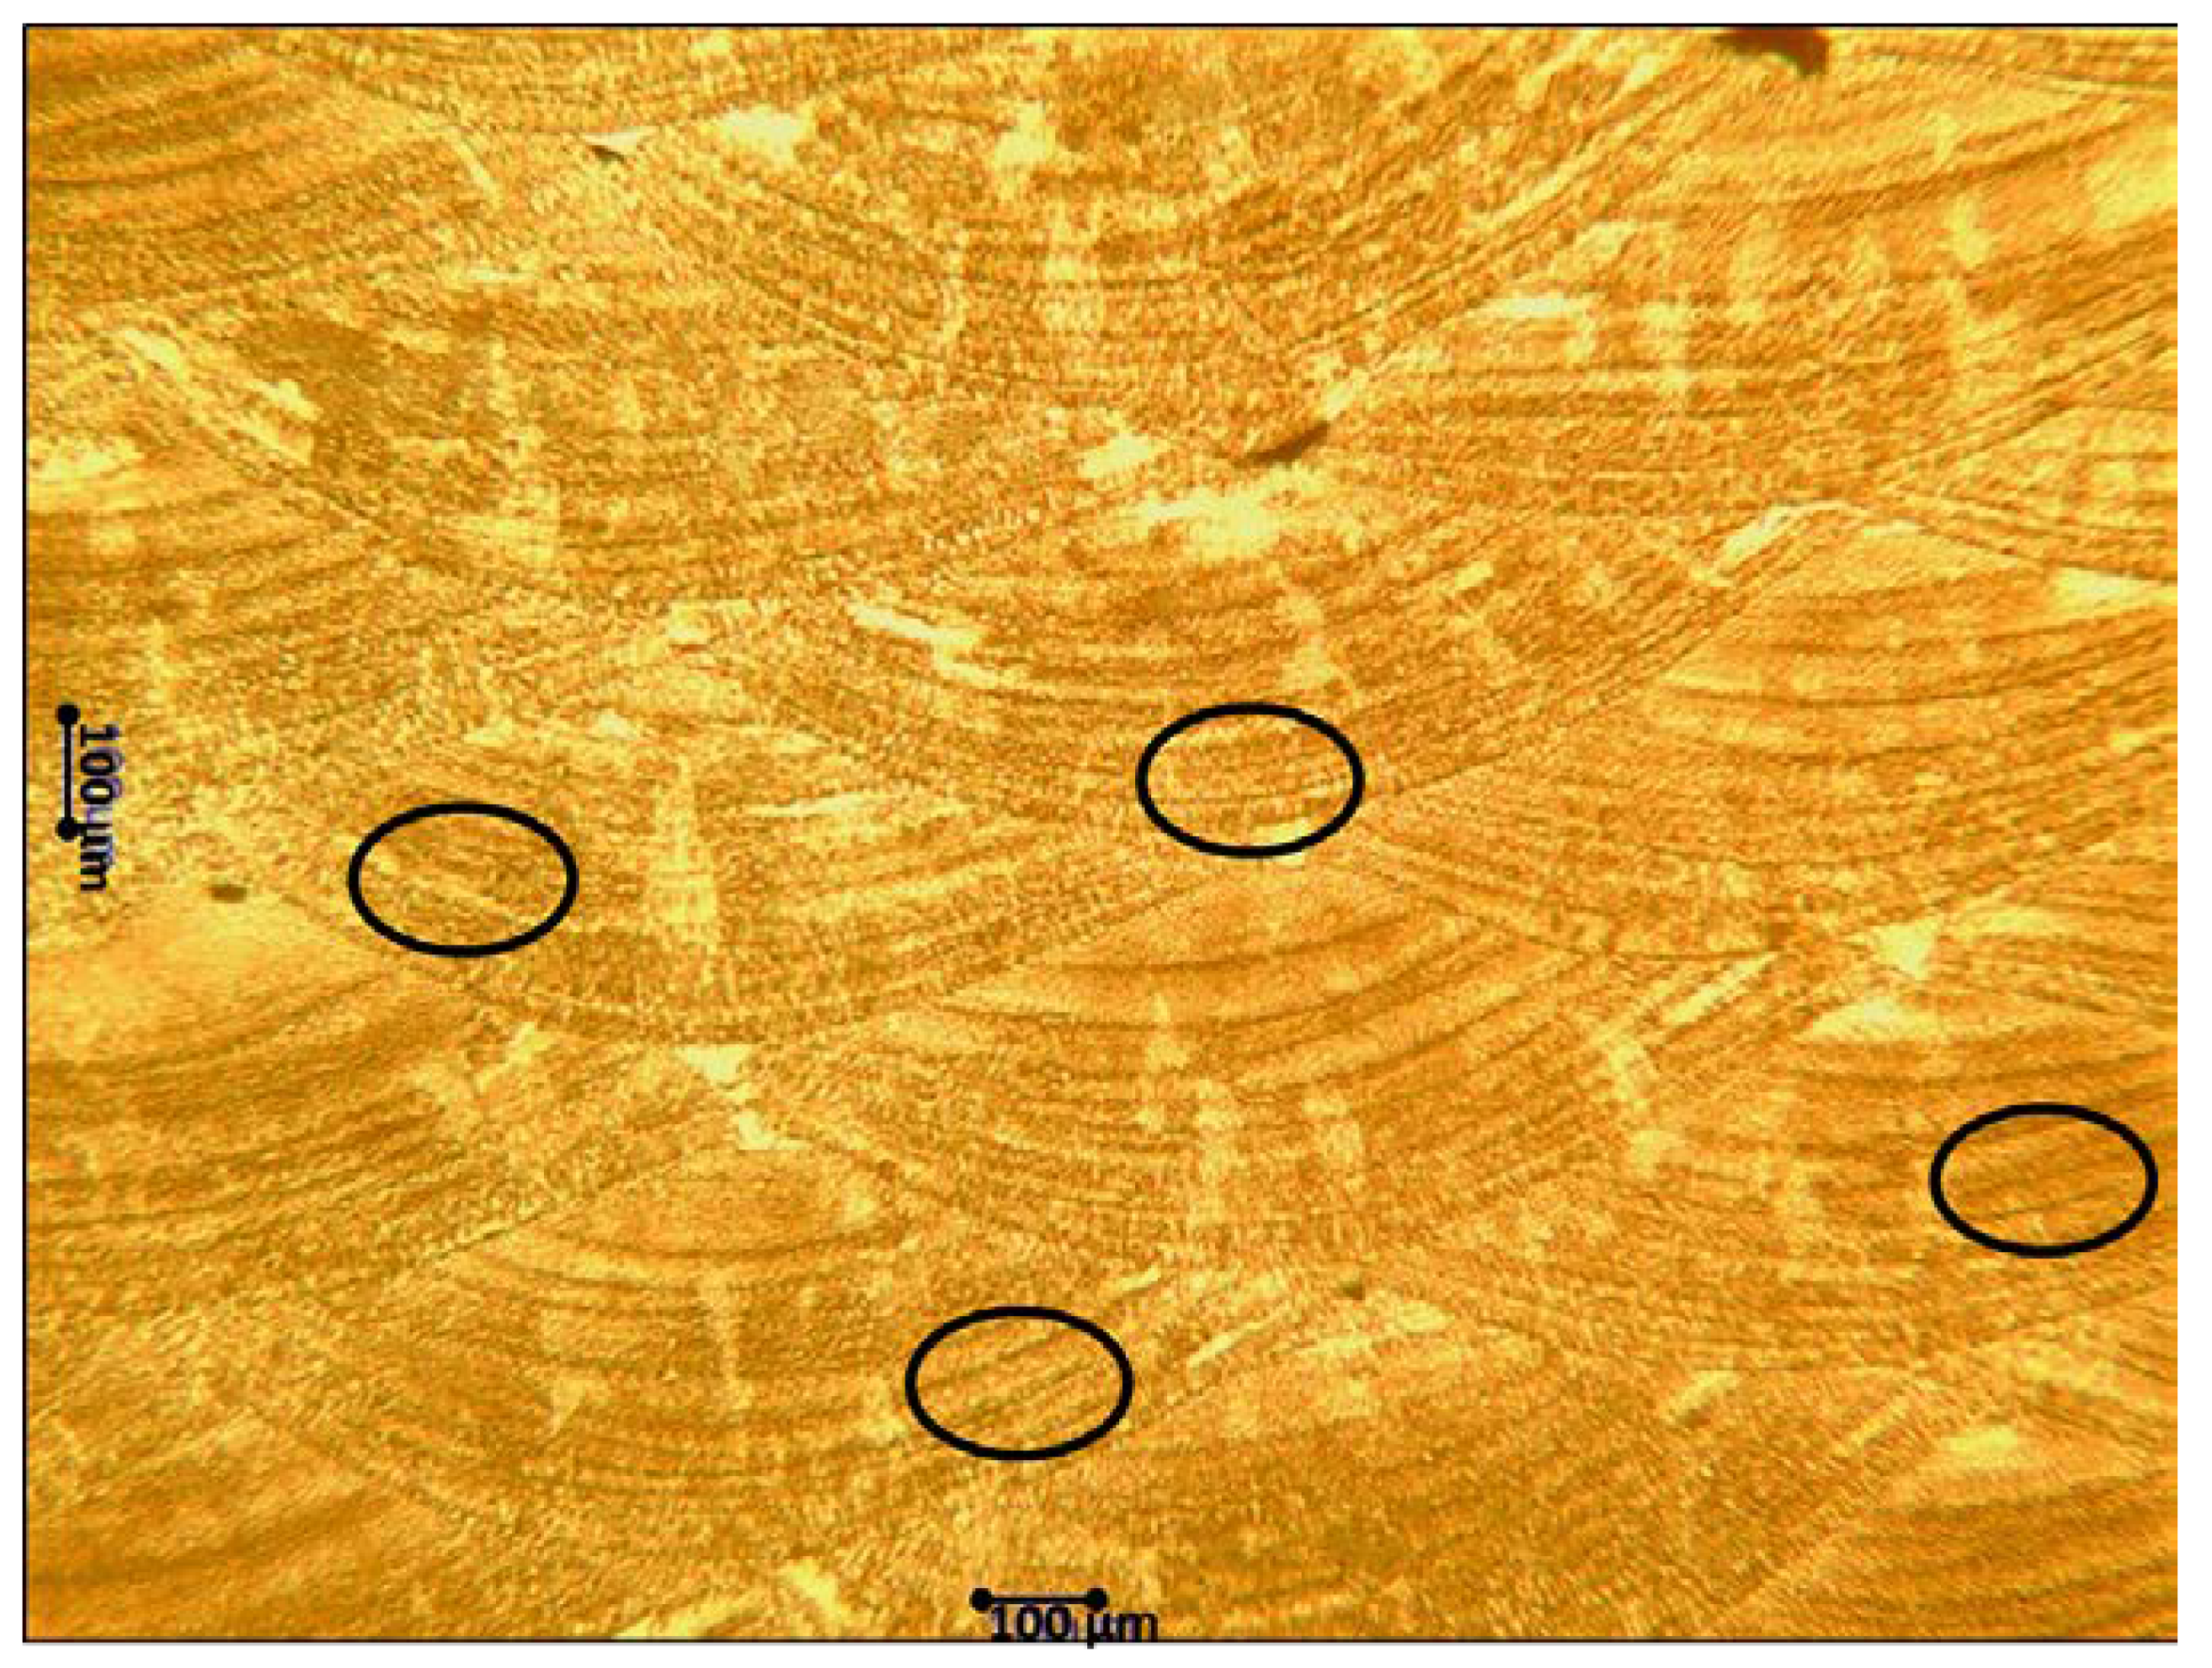
The general conditions of the multilayered builds for the selected beads are described below and representative microstructures are shown later. All the multilayered samples are left in the as-built conditions. As described in [15], it is possible to see that our samples have elongated grains in the direction of thermocapillary convection from the melt pool and heat dissipation (see Figure 6). Additionally, the EBSD performed on the as built 316L shows there is no preferred orientation. These grains range from 100–400 µm, which are made up of the fine cellular subgrains that are between 2–5 µm in size, which is in agreement with observations made in [7]. The microstructures of the representative Pf:Ts ratios are shown in Figure 7, Figure 8 and Figure 9. These clearly show the importance of controlling this ratio and how it has an influence on the final microstructure. Looking at the 508 mm/min travel speed (build #36, Figure 7), it is possible to see a mixture of the fine cellular subgrain structure and elongated grains, giving an average microhardness of 227 + 9 (see column 6, Table 3). With an increase in travel speed to 762 mm/min and at a Pf:Ts Ratio of 0.011 g/mm, a similar structure is seen and also yields an average Vickers hardness of 229 + 11 (see column 6, Table 3). Recalling that our target range for Pf/Ts was between 0.011–0.013 g/mm, both the builds #36 & 55 yield a similar microstructure, which shows the uniform distribution of energy. At the higher Pf:Ts ratios (builds #7 & 10, see Figure 8), an average Vickers hardness of 215 + 11 (see Table 3) was observed. Microsegregation, which is a result of re-melting and re-solidification, was also detected at these higher ratios. Microsegregation is a result of excess energy going into the sample, which then leads to a low hardness value that is caused by re-solidification of material. At lower Pf:Ts ratios (build #81, see Figure 9), porosity tends to increase, due to the lack of energy for depositing and melting powder. The hardness value 221 + 11 is slightly lower than that of ideal conditions shown above. It should be noted that all these microhardness values obtained from the multilayered builds are higher than wrought 316L obtained in the cold rolled condition (220 HV). Looking at the literature, the micro hardness values obtained in this study are within the range found in [9,15,23,24].
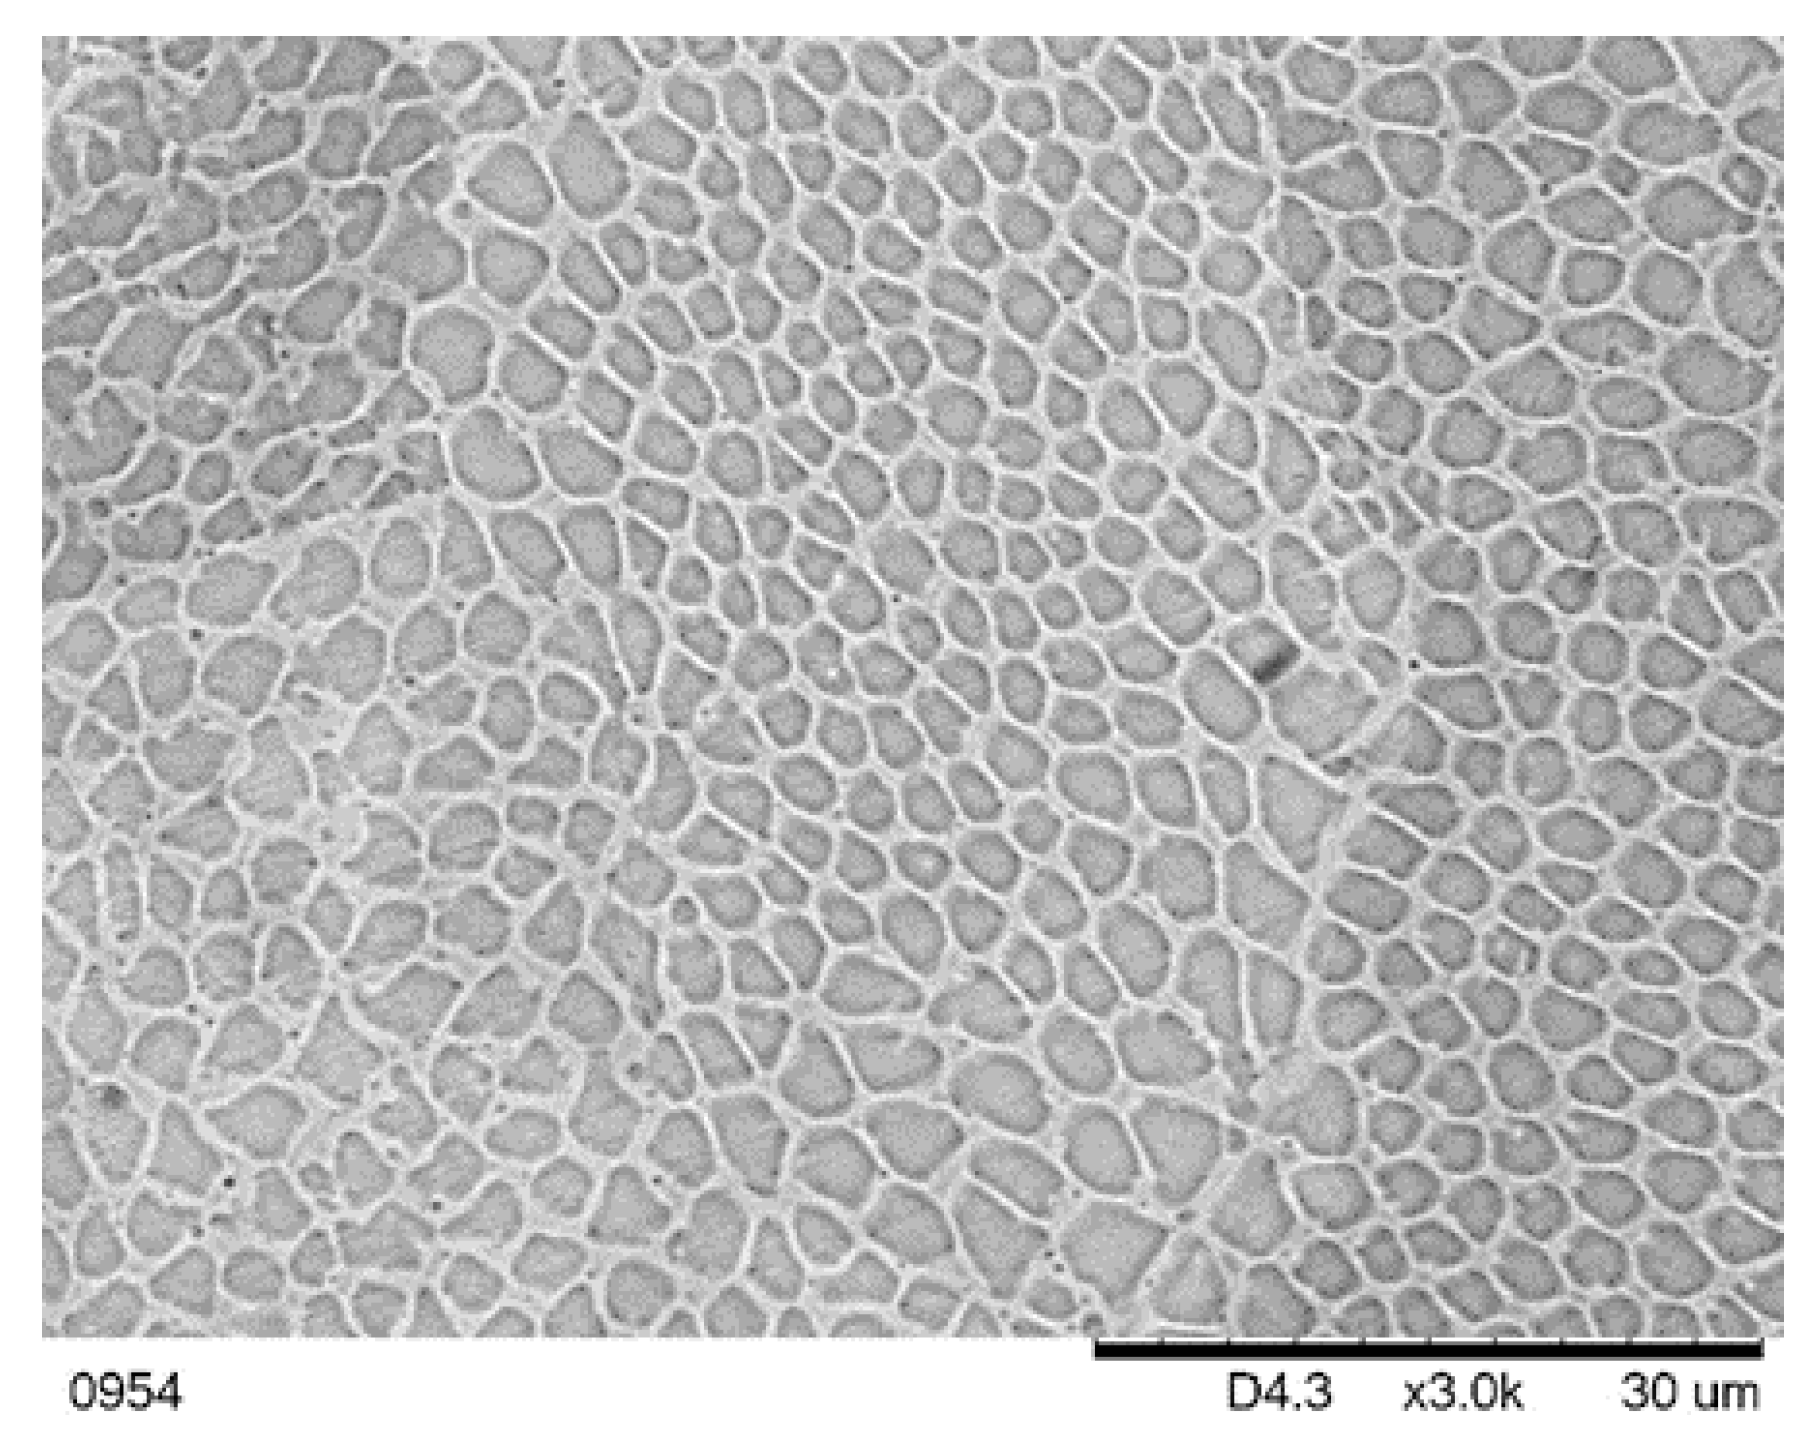
Figure 10 shows the fine cellular subgrain structure that was found in almost all the builds, but that was most predominant in the ideal Pf/Ts range of 0.011–0.013 g/mm. It was observed that at 1143 mm/min, the contact angle became too large and insufficient melting at those interfaces caused porosity. In general, it seemed that the high grain size number as per ASTM standard is only achievable with the very high solidification rates and an appropriate energy balance. As such, this fine cellular sub grain size yields a consistent hardness, which was experimentally observed (220 to 240 HV) within the experimentally determined optimal Pf/Ts range of 0.011–0.013 g/mm, as described in this article. It is possible that further optimization to increase the hardness could occur, but was beyond the scope of this current project.
One important component of this work is looking at the energy of the build process both as calculated in [8] and that of the results obtained from our power measurement calorimetric system (PMCS) (see top right corner of Figure 2) to see if the energy metrics have a correlation to the results obtained through this experimental design. Looking first at the normalized equivalent energy density for the DED builds in this study, the following results were obtained: for the high Pf/Ts ratio (0.026–0.031 g/mm) (builds #7 & 10), was above 9, which agrees with the notion of excessive heat input as described in [8] and thus yields an unfavorable microstructure; looking at the ideal Pf/Ts ratio (0.011–0.013 g/mm) (builds #36 & 55), was between 3.02–3.69, which is within the range reported in [8], where an acceptable microstructure for 316L was between : 2–4; finally, for the lower Pf/Ts ratio (0.007), was 2.7, which would appear to be within the acceptable range and thus further analysis is required.
With respect to the calorimeter results, the measured energy presented in column seven of Table 3 shows a similar trend to that of the results of the normalized equivalent energy density that was just presented. That is for the high Pf/Ts ratio (0.026–0.031 g/mm) (builds #7 & 10) measured energy above 300 kJ, which yields an unfavorable microstructure and lower hardness. Looking at the ideal Pf/Ts ratio (0.011–0.013 g/mm) (builds #36 & 55), the measured energy seems to be within the range of 217–244 kJ, which yields an acceptable microstructure and microhardness with a minimum porosity of 1.1%. Looking at the lower Pf/Ts ratio (0.007), it would appear that this measured energy of 233 kJ would also be acceptable (as it falls between 217–244 kJ); however, we did see the large pores (Figure 8) even though hardness and overall porosity (pore size 100–200 µm) were within an acceptable range.
It appears that an additional component to the energy analysis is required. As such, referring back to [20], where the importance of net heat input was discussed and how small variations can have an impact on cooling rates and thus microstructures, might provide a better understanding. The net heat input values, as defined in Equation (2), are presented in column 9 of Table 3. After analysis, it would appear from these results that there is a minimum net heat input required to obtain satisfactory results, which is 9 J/mm. As such, looking back at build #81, it has a net heat input of 5.46 J/mm, which would fall below that minimum criteria and therefore would explain the large pores shown in Figure 8.
Finally, if it appears that build #36 and build #55 yield the best results, how does one select which processing parameter to use? It is now possible with the results from the calorimeter to calculate the laser energy transfer efficiency (column 8 in Table 3). The laser energy transfer efficiency is a parameter that describes the fraction of energy that is absorbed by the workpiece from the total laser output energy [25]. In this work, the laser energy transfer efficiency is nothing more than a percentage of what was actually measured in terms of energy; in this case provided directly from the calorimeter to what was delivered by the laser. As such, this is an additional criteria that can be utilized to define which processing parameter yields the most efficient process in terms of energy consumption. This of great interest to industry. Looking at the values, it would appear that build #55 is the most efficient set of processing parameters.
4. Conclusions
The research conducted in this study demonstrates an experimental approach that defines the powder flow to travel speed ratio Pf:Ts (i.e., linear mass density) at a given power level which provides a consistent microstructure and microhardness for metallic DED, regardless of travel speed (above certain Ts). This was seen both in build #36 and build #55, where the range of the Pf/Ts ratio (0.011–0.013 g/mm) yielded a consistent microstructure with fine cellular subgrains in the order of 2–5 µm, with a microhardness above 227 HVN and porosity under 1.1%. Furthermore, the experimental results show that it is possible to maintain and control the fine cellular subgrains when following the appropriate ratio of powder feed to travel speed ratio and maintaining a net heat input above 9 J/mm. This work also shows that by maintaining the appropriate ratio, the microhardness values are consistent in each build, which is something that is critical for the future of MAM. This type of ratio is a metric that could potentially be utilized to help define standards of quality, but further investigations at other power levels and materials are required. The authors provide a simple design of an experiment that can quickly determine the ideal beads based on these ratios and then yield the consistent results when making larger samples. Finally, through the use of the calorimeter, an in-situ process could be utilized to define the minimum heat input and provide insight into the laser energy transfer efficiency. The work concluded here on DED has also found that the single bead methodology provides the possibility to calibrate both incoming materials and DED machines as a systems approach prior to any production perturbations, such as different lots of incoming materials. Future work will be carried out for 316L at additional power levels to validate this approach.
Author Contributions
F.M.S and B.S.N conceived and designed the experiments; F.M.S. and B.S.N analyzed the data; B.S.N. wrote the first draft of the manuscript; F.M.S supervised the experimental works, reviewing and editing the manuscript; and the final version of the manuscript was read and approved by F.M.S.
Funding
This research was funded by U.S. Department of Commerce, National Institute of Standards and Technology grant number [70NANB 13Hl 94].
Acknowledgments
The authors would like to express their gratitude to all the students who have worked in the ARMM Lab and have made this research possible. In addition, the authors express their gratitude to the NIST MSAM program for the opportunity to perform this research. The views expressed in this article do not necessarily reflect the official policies of NIST; nor does mention by trade names, commercial practices, or organizations imply endorsement of the U.S. Government.
Conflicts of Interest
The authors declare no conflict of interest.
References
- Boddu, M.R.; Landers, R.G.; Liou, F.W. Control of Laser Cladding for Rapid Prototyping—A Review. In Proceedings of the Solid Freeform Fabrication Symposium, Austin, TX, USA, 6–8 August 2001; pp. 6–8. [Google Scholar]
- Hopkinson, N.; Dicknes, P. Analysis of Rapid Manufacturing Using Layer Manufacturing Processes for Production. Proc. Inst. Mech. Eng. Part C 2003, 217, 31–39. [Google Scholar] [CrossRef]
- Bourell, D.L.; Leu, M.C.; Rosen, D.W. Roadmap for Additive Manufacturing: Identifying the Future of Freeform Processing. 2009. Available online: http://wohlersassociates.com/roadmap2009.pdf (accessed on 18 July 2018).
- Thompson, S.M.; Bian, L.; Shamsaei, N.; Yadollahi, A. An Overview of Direct Laser Deposition for Additive Manufacturing; Part I: Transport Phenomena, Modeling and Diagnostics. Addit. Manuf. 2015, 8, 36–62. [Google Scholar] [CrossRef]
- Shamsaei, N.; Yadollahi, A.; Bian, L.; Thompson, S.M. An Overview of Direct Laser Deposition for Additive Manufacturing; Part II: Mechanical Behavior, Process Parameter Optimization and Control. Addit. Manuf. 2015, 8, 12–35. [Google Scholar] [CrossRef]
- Casati, R.; Lemke, J.; Vedani, M. Microstructure and Fracture Behavior of 316: Austenitic Stainless Steel Producde by Selective Laser Melting. J. Mater. Sci. Technol. 2016, 32, 738–744. [Google Scholar] [CrossRef]
- Wang, Y.M.; Voisin, T.; McKeown, J.T.; Ye, J.; Calta, N.P.; Li, Z.; Zeng, Z.; Zhang, Y.; Chen, W.; Roehling, T.T.; et al. Additively manufactured hierarchical stainless steels with high strength ductility. Nat. Mater. 2017. [Google Scholar] [CrossRef] [PubMed]
- Thomas, M.; Baxter, G.J.; Todd, I. Normalised model-based processing diagrams for additive layer manufacturing of engineering alloys. Acta Mater. 2016, 108, 26–35. [Google Scholar] [CrossRef]
- Bi, G.; Gasser, A.; Wissenbach, K.; Drenker, A.; Poprawe, R. Characterization of the Process Control for the Direct Laser Metallic Powder Deposition. Surf. Coat. Technol. 2006, 201, 2676–2683. [Google Scholar] [CrossRef]
- Yadroitsev, I.; Bertrand, P.; Smurov, I. Parametric Analysis of the Selective Laser Melting Process. Appl. Surf. Sci. 2007, 253, 8064–8069. [Google Scholar] [CrossRef]
- Yadroitsev, I.; Gusarov, A.; Yadroitsava, I.; Smurov, I. Single Tracking Formation in Selective Laser Melting of Metal Powders. J. Mater. Process. Technol. 2010, 210, 1624–1631. [Google Scholar] [CrossRef]
- Zheng, B.; Zhou, Y.; Smugeresky, J.E.; Schoenung, J.M.; Lavernia, E.J. Thermal Behavior and Microstructure Evolution during Laser Deposition with Laser-Engineered Net Shaping: Part II. Metall. Mater. Trans. A 2008, 39, 2237–2245. [Google Scholar] [CrossRef]
- Ferguson, J.B.; Schultz, B.F.; Moghadam, A.D.; Rohatgi, P.K. Semi-empirical model of deposit size and porosity in 420 stainless steel and 4140 steel using laser engineered net shaping. J. Manuf. Process. 2015, 19, 163–170. [Google Scholar] [CrossRef] [Green Version]
- Yadollahi, A.; Shamsaei, N.; Thompson, S.M.; Seely, D.W. Effects of Process Time Interval and Heat Treatment on the Mechanical and Microstructural Properties of Direct Laser Deposited 316L Stainless Steel. Mater. Sci. Eng. A 2015, 644, 171–183. [Google Scholar] [CrossRef]
- Ziętala, M.; Durejko, T.; Polański, M.; Kunce, I.; Płociński, T.; Zieliński, W.; Łazińska, M.; Stępniowski, W.; Czujko, T.; Kurzydłowski, K.J.; et al. The microstructure, mechanical properties and corrosion resistance of 316L stainless steel fabricated using laser engineered net shaping. Mater. Sci. Eng. A 2016, 577, 1–10. [Google Scholar] [CrossRef]
- Susan, D.F.; Puskar, J.D.; Brooks, J.A.; Robino, C.V. Quantitative characterization of porosity in stainless steel LENS powders and deposits. Mater. Charact. 2006, 57, 36–43. [Google Scholar] [CrossRef]
- Whiting, J.; Springer, A.; Sciammarella, F.M. Real-Time Acoustic Emission Monitoring of Powder Mass Flow Rate for Direct Energy Deposition. Addit. Manuf. 2018, 23, 312–318. [Google Scholar] [CrossRef]
- Malin, V.; Sciammarella, F.M. Controlling Heat Input by Measuring Net Power. Weld. J. 2006, 85, 44–50. [Google Scholar]
- Sciammarella, F.M. Development and Validation of Physics-Based AM Models for Process Control and Quality Assurance; Final Report for National Institute of Standards, COA 70NANB13H194; Northern Illinois University: DeKalb, IL, USA, 2016. [Google Scholar]
- Raghavan, A.; Wei, H.L.; Palmer, T.A.; DebRoy, T. Heat transfer and fluid flow in additive manufacturing. J. Laser Appl. 2013, 25, 052006. [Google Scholar] [CrossRef]
- Liberini, M.; Astarita, A.; Campatelli, G.; Scippa, A.; Montevecchi, F.; Venturini, G.; Durante, M.; Boccarusso, L.; Minutolo, F.M.C.; Squillace, A. Selection of optimal process parameters for wire arc additive manufacturing. Procedia CIRP 2017, 62, 470–474. [Google Scholar] [CrossRef]
- ASTM Standards: E407-99, Standard Practice for Microetching Metals and Alloys, Designation; ASTM International: West Conshohocken, PA, USA, 1999.
- Yusuf, S.M.; Chen, Y.; Boardman, R.; Yang, S.; Gao, N. Investigation on Porosity and Microhardness of 316L Stainless Steel Fabricated by Selective Laser Melting. Metals 2017, 7, 64. [Google Scholar] [CrossRef]
- Yang, N.; Yee, J.; Zheng, B.; Gaiser, K.; Reynolds, T.; Clemon, L.; Lu, W.Y.; Schoenung, J.M.; Lavernia, E.J. Process-structure-property relationships for 316L stainless steel fabricated by additive manufacturing and its implications for component engineering. J. Therm. Spray Technol. 2017, 26, 610–626. [Google Scholar] [CrossRef]
- Unocic, R.R.R. A Fundamental Investigation of Process Efficiencies in the Laser Engineered Net Shaping (LENS) Solid Freeform Fabrication Process. Master’s Thesis, Lehigh University, Bethlehem, PA, USA, 2002; p. 754. [Google Scholar]
Figure 1.
SEM micrograph of virgin 316L stainless steel powder.

Figure 2.
Schematic of LENS set-up with AE sensor for powder flow and power measurement calorimetric system (PMCS) utilized to monitor net heat input, among other things. Deposition head moves in x and y directoins and build plate moves in z direction. Top right is the output data from the power measurement calorimetric system (PMCS), which provides the integrated energy (kJ) as the sample is being built. This information provides a metric for future process control.

Figure 3.
Schematic of single bead analysis to determine optimal bead shape as defined by and the depth to height ratio.
Figure 3.
Schematic of single bead analysis to determine optimal bead shape as defined by and the depth to height ratio.

Figure 4.
Multilayer builds (measurements in mm).

Figure 5.
View of cross-sectional area (A-A from Figure 4) of samples in which three regions for measurements were selected (top, middle, and bottom) and the locations of each individual reading.
Figure 5.
View of cross-sectional area (A-A from Figure 4) of samples in which three regions for measurements were selected (top, middle, and bottom) and the locations of each individual reading.

Figure 6.
(Left) Micrograph of a region in Figure 5, showing the larger grains resulting from thermocapillary convection from the melt pool and heat dissipation; (Right) EBSD of as received 316L [19].

Figure 7.
Multilayered build #36 (ideal Pf:Ts), Vickers: 227 ± 9.

Figure 8.
Multilayered build #7 (low Pf:Ts), considerable re-melting which leads to microsegregation (black circles), and larger grains, Vickers: 213 ± 14.
Figure 8.
Multilayered build #7 (low Pf:Ts), considerable re-melting which leads to microsegregation (black circles), and larger grains, Vickers: 213 ± 14.

Figure 9.
Multilayered build #81 (High Pf:Ts) large porosity due to the lack of energy available from increased travel speed, Vickers: 221 ± 11.
Figure 9.
Multilayered build #81 (High Pf:Ts) large porosity due to the lack of energy available from increased travel speed, Vickers: 221 ± 11.

Figure 10.
Fine cellular subgrain structure (~2 µm) of multilayered sample from builds #36 & 55, in the as-built condition, which had Vickers values of 227 + 9 and 229 + 11, respectively.
Figure 10.
Fine cellular subgrain structure (~2 µm) of multilayered sample from builds #36 & 55, in the as-built condition, which had Vickers values of 227 + 9 and 229 + 11, respectively.


Table 1.
Distribution of basic parameters in the 90-bead experiment.
| Build Number | PLENS (W) | Ts (mm/min) | Pf (g/min) | Pf/Ts (g/mm) |
|---|---|---|---|---|
| 1–10 | 645 | 127 | 0.9–3.2 | 0.007–0.025 |
| 11–20 | 645 | 254 | 1.8–6.4 | 0.007–0.025 |
| 21–30 | 645 | 381 | 2.7–9.6 | 0.007–0.025 |
| 31–40 | 645 | 508 | 3.6–12.8 | 0.007–0.025 |
| 41–50 | 645 | 635 | 4.5–16 | 0.007–0.025 |
| 51–60 | 645 | 762 | 5.4–19.2 | 0.007–0.025 |
| 61–70 | 645 | 889 | 6.3–22.4 | 0.007–0.025 |
| 71–80 | 645 | 1016 | 7.2–25.6 | 0.007–0.025 |
| 81–90 | 645 | 1143 | 8.1–28.8 | 0.007–0.025 |
Table 2.
Measured parameters of selected beads for building the multilayered samples.
| Build Number | Pin (W) | Ts (mm/min) | Pf (g/min) | Pf/Ts (g/mm) |
|---|---|---|---|---|
| 7 | 478 | 127 | 3.34 | 0.026 |
| 10 | 478 | 127 | 3.96 | 0.031 |
| 36 | 470 | 508 | 6.57 | 0.013 |
| 55 | 470 | 762 | 8.16 | 0.011 |
| 81 | 470 | 1143 | 7.5 | 0.007 |
Table 3.
Measured parameters of multilayered sample builds.
| Build Number | Pin (W) | Ts (mm/min) | Pf (g/min) | Pf/Ts (g/mm) | Average Hardness (HVN) | Measured Energy (kJ) | Laser Energy Transfer Efficency (%) | Net Heat Input (J/mm) |
|---|---|---|---|---|---|---|---|---|
| 7 | 478 | 127 | 3.34 | 0.026 | 213 ± 14 | 566.80 | 25.89 | 58.47 |
| 10 | 478 | 127 | 3.96 | 0.031 | 217 ± 7 | 354.12 | 24.32 | 31.45 |
| 36 | 470 | 508 | 6.57 | 0.013 | 227 ± 9 | 244.60 | 22.16 | 12.30 |
| 55 | 470 | 762 | 8.16 | 0.011 | 229 ± 11 | 217.11 | 24.51 | 9.07 |
| 81 | 470 | 1143 | 7.5 | 0.007 | 221 ± 11 | 233.42 | 22.15 | 5.46 |
© 2018 by the authors. Licensee MDPI, Basel, Switzerland. This article is an open access article distributed under the terms and conditions of the Creative Commons Attribution (CC BY) license (http://creativecommons.org/licenses/by/4.0/).
Share and Cite
MDPI and ACS Style
Sciammarella, F.M.; Salehi Najafabadi, B. Processing Parameter DOE for 316L Using Directed Energy Deposition. J. Manuf. Mater. Process. 2018, 2, 61. https://doi.org/10.3390/jmmp2030061
AMA Style
Sciammarella FM, Salehi Najafabadi B. Processing Parameter DOE for 316L Using Directed Energy Deposition. Journal of Manufacturing and Materials Processing. 2018; 2(3):61. https://doi.org/10.3390/jmmp2030061
Chicago/Turabian StyleSciammarella, Federico M., and Benyamin Salehi Najafabadi. 2018. "Processing Parameter DOE for 316L Using Directed Energy Deposition" Journal of Manufacturing and Materials Processing 2, no. 3: 61. https://doi.org/10.3390/jmmp2030061