Effect of Build Orientation on the Microstructure and Mechanical Properties of Selective Laser-Melted Ti-6Al-4V Alloy


Department of Mechanical Engineering, California State University, Los Angeles, CA 90032, USA
*
Author to whom correspondence should be addressed.
J. Manuf. Mater. Process. 2018, 2(4), 69; https://doi.org/10.3390/jmmp2040069
Submission received: 9 September 2018
/
Revised: 10 October 2018
/
Accepted: 10 October 2018
/
Published: 12 October 2018
(This article belongs to the Special Issue Selective Laser Melting: Materials and Applications)
Abstract
:One of the challenges of additive manufacturing (AM) technology is the inability to generate repeatable microstructure and mechanical properties in different orientations. In this work, the effect of build orientation on the microstructure and mechanical properties of Ti–6Al–4V specimens manufactured by selective laser melting (SLM) was studied. The samples built in the Z orientation showed weaker tensile strength compared to the samples built in X, and Y orientations. Samples built in X and Y orientations exhibited brittle fracture features in areas close to the substrate and ductile fracture features in the area farther from the substrate. Defects including pores, cracks, and unmelted/partially-melted powder particles contributed to lower tensile and fracture toughness properties in different orientations.
1. Introduction
Additive manufacturing (AM) is defined as a process of “joining materials to make objects from 3D model data, usually layer upon layer, as opposed to subtractive manufacturing methodologies” [1]. AM is suitable for small- and medium-part production and enables design flexibility and freedom in comparison with conventional manufacturing processes where complex geometries and net shape products are desired. However, some challenges still exist, such as limitations in part size, production number, and repeatability of material properties [2]. One of the challenges facing AM technology is the ability to achieve identical microstructure and mechanical properties in different build orientations. Numerous studies have been conducted to improve the quality of the additively manufactured parts and ensure repeatable material properties.
The effect of altered process parameters on AM-fabricated Ti–6Al–4V alloys was investigated by Gong et al. [1]. It was found that energy density has a significant effect on defects and porosity of the samples generated by powder bed fusion (PBF) [1]. The microstructure and mechanical properties of Ti–6Al–4V tensile specimen fabricated by selective laser melting (SLM) and electron beam melting (EBM) were studied by Rafi et al. [3]. The α’ martensitic phase was the microstructure of SLM specimen due to processing parameters and cooling rate. The microstructure of EBM-processed samples consisted of primary α and a small amount of β phase due to elevated temperature in the build chamber [3]. The main types of microstructure for titanium alloys were reported as lamellar α within large β grain, which forms during slow cooling rates and can be characterized by low ductility, moderate fatigue properties along with good creep and crack resistance. The second type is equiaxed two phase α + β for fast cooling processes with better balance of strength and ductility along with fatigue properties [4]. The formation of α and β microstructure in as-fabricated SLM Ti–6Al–4V was simulated by variation of process parameters, but the typical SLM microstructure was martensitic α’ based on scanning speed and rapid cooling [5]. Heat treatment can decompose α’ into α and β phases. SLM intrinsic heat treatment converts α’ martensitic phase into α + β microstructure during sintering. The intensified treatment employs tight hatch spacing along with high energy density and elevated temperature of the platform. However, high energy density and elevated temperature may result in void defects [6]. Rapid heat transfer, melt pool flow and geometry influence the grain size and microstructure of the printed material [7,8,9,10]. The way in which an increase in the current and frequency of the laser elevates the density and thickness of the specimen was studied by Fatemi et al. Higher scanning speed has the opposite effect on layer thickness. Maximum density was obtained with high current, frequency and decreasing scanning speed [11]. Intrinsic heat treatment during SLM facilitates transformation of the α’ martensitic phase into α and β microstructures. The intensified treatment employs tight hatch distance along with high energy density and elevated temperature to reduce the cooling rate [6]. The Marangoni convection in the melt pool may also make the pool unsteady, despite constant scanning velocity [7,12]. Melt pool geometry is influenced by scanning speed, and laser power among other factors. The rapid solidification behavior is due to large thermal gradients and high thermal conductivity of metallic alloys. As a result, fine grains with refined microstructure are generated. Also, the solubility of a solid may be extended and chemical homogeneity may increase along with crystalline, quasicrystalline, and amorphous metastable phases [13,14].
One of the common defects resulted from SLM processes is porosity. Formation of defects such as porosity is directly related to the laser beam and powder interactions during the process. Interaction of the energy source in SLM and EBM processes with powder particles results in extreme temperature and massive liquid formation. During solidification gaseous bubbles float over the liquid by Marangoni flow. Trapped bubbles in the solidified region form pores. Porosity can be reduced by optimizing the hatch spacing, laser power and scan speed [15,16]. Porosity can be powder-induced or process-induced. Powder-induced defects include spherical gaseous voids inside the powder. The powder is held in place by gravitational force and is under the influence of a powder distribution mechanism, rapid temperature change, and capillary forces. There is no pressure source to compact the powder particles or hold them closer. Porosity may also consist of large irregular unmelted powder zones, shrinkage pores due to lack of enough powder in the interdendritic zones, and spherical pores due to gas entrapped in the part [7]. Process-induced porosity is due to insufficient energy to melt the powder completely. Lack of fusion can be recognized where unmelted powder particles are observable near the pores and shrinkage porosity is due to lack of powder in the melt pool. Spatter ejection is another phenomenon induced by high beam power, where the melt pool boils and drives the molten material out of melt pool via a convection process [17]. Balling is another defect that results from inability of the molten material to connect effectively with previous layers. Therefore, the surface of the material becomes rough and porous with bead-shaped tracks. Material properties and processing parameters are to be blamed for the problem [7]. Low scanning speed and high energy density lead to higher melting pool temperature and viscosity of the liquid. The splashing of liquid droplets on the solidified surface is another reason for balling [18]. The excessive thermal gradient between melt pool and its surroundings is also a source of cracks on the surface and core [7]. Cracking may occur during solidification and depends on the material’s dendritic, cellular or planar solidification nature [17]. The orientation-dependent microstructure, defects, and texture influence the tensile properties, but it is more critical in fracture properties. Post-processing can mitigate the process-dependent defects [16]. High laser power and low scan speed stabilizes the melt pool geometry significantly [18]. The effect of build orientation on the mechanical properties of Ti–6Al–4V alloy processed by SLM was studied by Simonelli et al. [19]. The directionality of prior β grain boundaries to the external axial loading affected the fracture mechanism and crack growth in the parts [19]. Another study found that the fracture toughness was comparably higher when build layers were perpendicular to crack growth direction [20]. Recently, Barriobero-Vila et al. [21] developed a new Ti alloy by exploiting metastability around peritectic and peritectoid reactions. Their findings promise a decrease in anisotropy of as-built and heat-treated Ti alloys for AM [21].
The purpose of this research is to investigate the effect of build orientation on the mechanical properties and microstructure of the titanium Ti–6Al–4V alloy manufactured by selective laser melting. The research involved tensile, and fracture toughness tests of samples printed in three different orientations. Metallography, hardness, and surface roughness analysis were also performed. The microstructure and fracture surfaces of the samples were studied using optical and scanning electron microscopy techniques.
2. Materials and Methods
To characterize orientation-based microstructure and mechanic properties of SLM Ti–6Al–4V alloy, rectangular samples were printed by Renishaw plc. AM250 200 W platform with 70 µm spot size. The system uses high stability ytterbium fiber lasers, guided through an optical module to deliver a positioning accuracy of ±25 μm across the working area. The power is delivered via a point-by-point exposure methodology.
The process parameters used for printing samples are listed in Table 1. General print settings include layer thickness, point distance, exposure time, power, focus and hatch distance.
Samples were fabricated in three perpendicular orientations without any support. To prevent porosity, the melt pool was overlapped by sufficient distance. The powder used for printing samples was Ti–6Al–4V ELI-0406 alloy produced by Renishaw plc. with particle sizes ranging between 15 µm and 45 µm [22]. The powder bed orientation and setup for printed samples are shown in Figure 1.
The tensile and fracture toughness build orientations are designated according to nomenclature in Figure 1 by X, Y, and Z. The first letter in the sample ID, T or F, represents tensile and fracture toughness samples, respectively. The orientation nomenclature of the tensile and fracture toughness samples are represented in Table 2.
All samples were heat treated after the SLM process. The heat treatment of the samples was performed under an argon gas environment with an initial ramp to 850 °C over 110 min, held at that constant temperature for 60 min, then furnace-cooled to 350 °C before turning off argon flow.
The tensile samples were generated in two sets of oversized rectangular shape in three Cartesian build directions. The samples were considered 0.0625″ (1.58 mm) larger to comply with the dimensions shown in Figure 2 after machining process. Tensile samples were machined per ASTM E8 standard. The rough dimensions of samples were about 4.062 × 0.400 × 0.187 inches (102 × 10.2 × 4.8 mm).
The build orientations comply with ASTM nomenclature. The tensile test was performed using a universal tensile test machine. The tensile test was conducted per ASTM E8 standard [23]. The fracture toughness samples were fabricated in two sets of rectangular shape, in three Cartesian build orientations. The fracture toughness samples were tested in as-built condition. However, notches were machined in accordance with ASTM E399 standard [24], as displayed in Figure 3.
In order to investigate as-built and fractured surfaces, scanning electron microscopy (SEM) was undertaken using Zeiss Ultra 55 FESEM. In addition, electron dispersive spectroscopy (EDS) was performed by Oxford EDAX/EBSD equipment on samples in order to verify the consistency of chemical composition in all build orientations. Instron Wilson 2000 hardness tester was used for hardness measurements, and optical microscopy was performed using Nikon Epiphot 300 microscope to analyze the microstructure. Furthermore, Wyco NT9100 optical surface profilometery was employed to analyze the surface roughness of the as-built samples.
3. Results
EDS analysis was performed on the finished surface of one set of the tensile samples, in two random locations. Measured compositions by EDS were in compliance with Renishaw Ti–6Al–4V ELI-0406 stated composition. The stated composition was up to 90% titanium mass fraction alloyed with up to 6.75% aluminum and up to 4.5% vanadium and other minor elements [22]. The results reflect no major differences in chemical composition at different orientations after the SLM process. No dilution, diffusion or evaporation was observable in the results.
3.1. Tensile Test
Table 3 shows the average tensile properties, which include yield strength, ultimate tensile strength, strain percentage, and modulus of elasticity.
The strain % in Z orientation is considerably lower than X and Y orientations. TZ samples failed shortly after reaching ultimate strength, showing minimal plastic deformation. The comparable low strain % and relatively close yield and ultimate tensile strength values can be associated with the brittle fracture in the Z orientation, as shown in the SEM micrographs presented below.
The fractured surfaces of tensile samples were investigated by SEM. The TZ orientation, Figure 4a, shows a brittle planar fracture perpendicular to the building orientation, with smoother texture compared to other build orientations. The planar fracture indicates possible interlayer failure due to lack of strong bonding between successively deposited layers. This may have happened due to insufficient laser exposure or high scan speed that was unable to melt the deeper layers. The presence of partially melted and unmelted powder particles also suggests the interlayer fracture. A ductile fracture with representative dimples is also observable in certain areas as shown in Figure 4b. The fracture surface includes cleavage, dimples from ductile failure, voids and unmelted powder particles as depicted in Figure 4b,c.
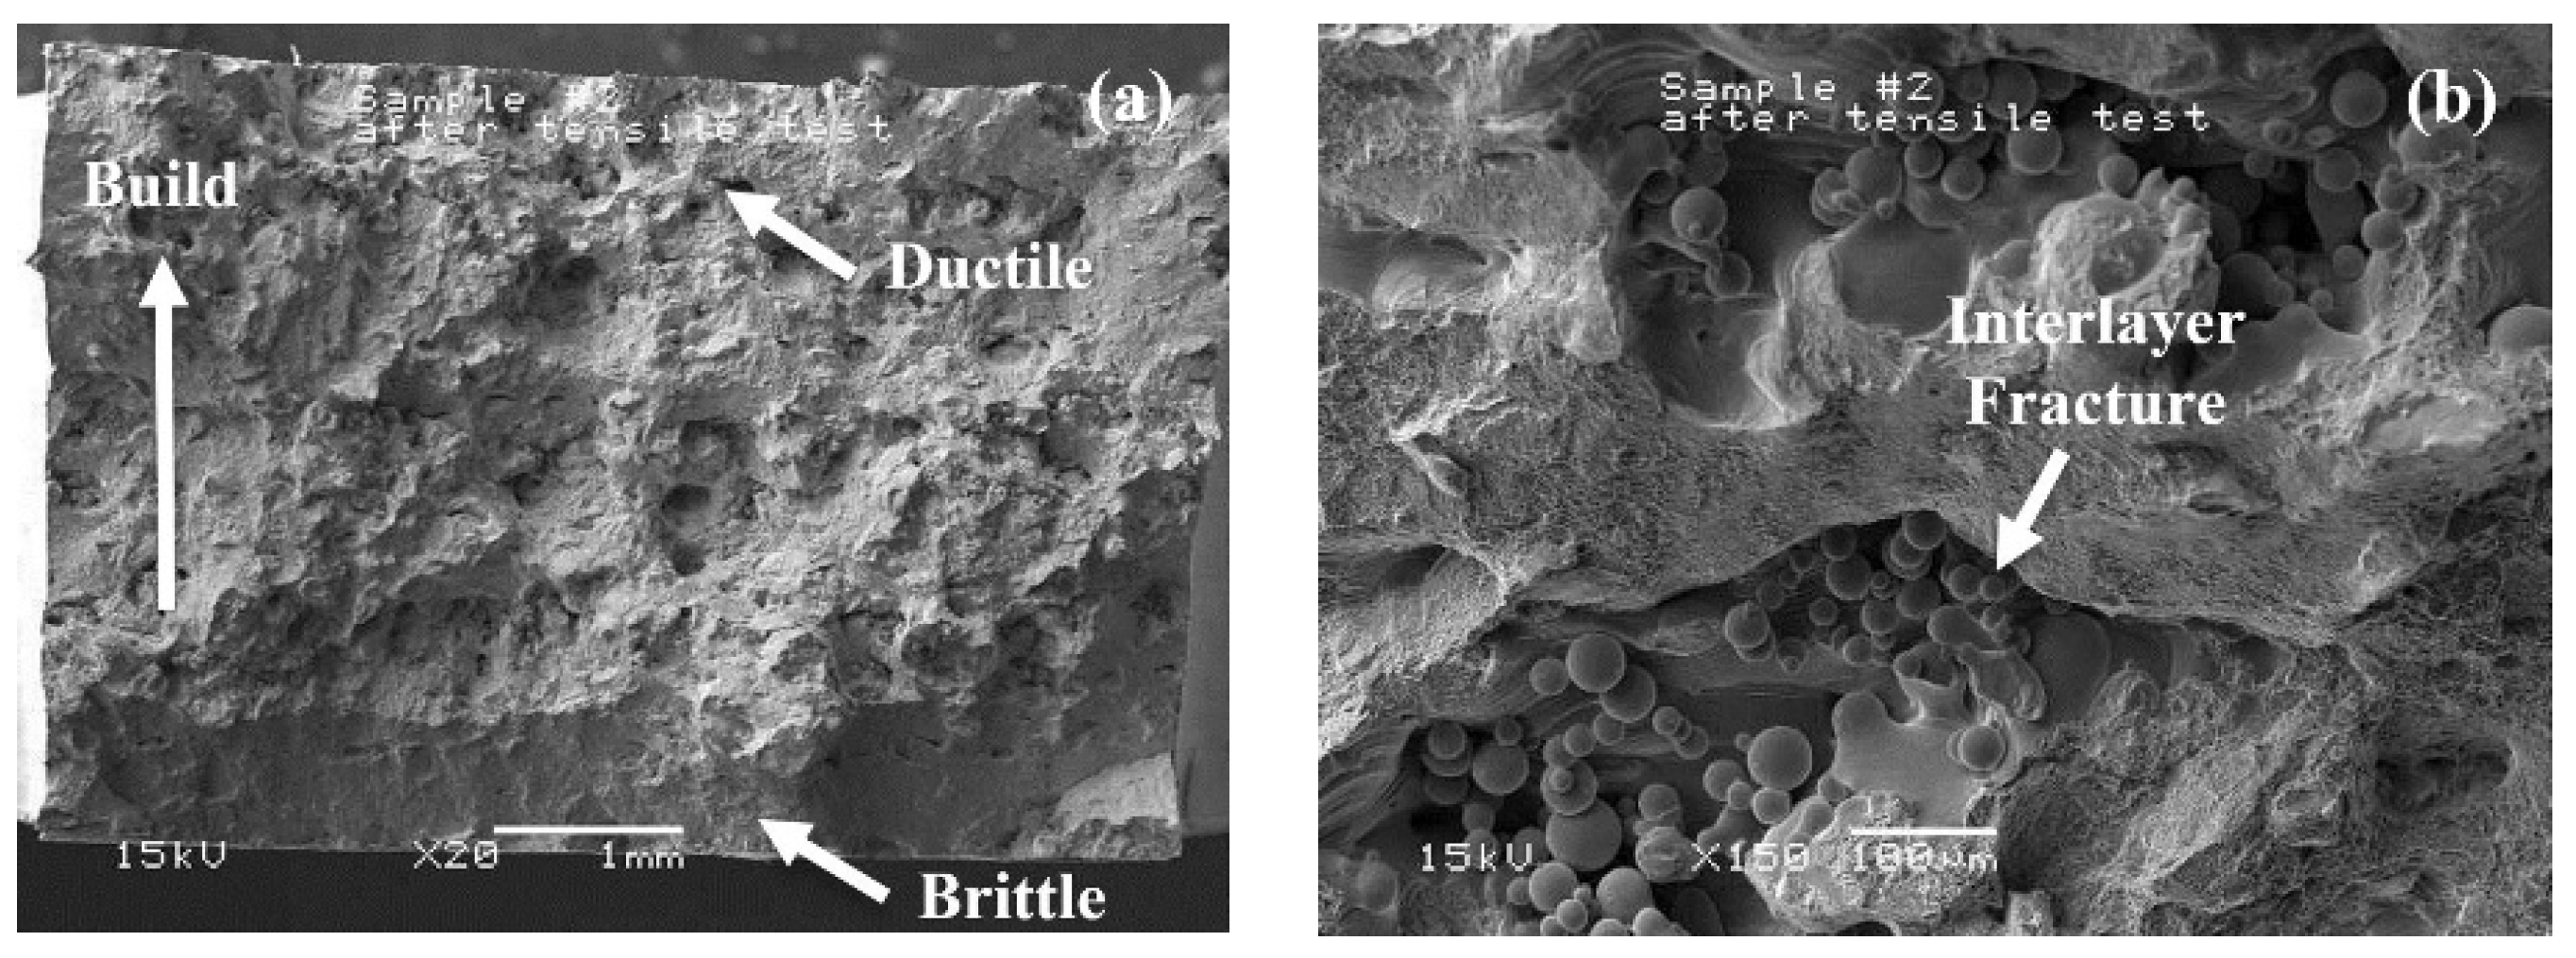
The TY sample surfaces demonstrated a combination of brittle and ductile fracture. As shown in Figure 5, the areas closer to substrate show a brittle fracture, while ductile fracture characteristics can be identified in the other areas. This can be justified by cooling rate behavior during the process. The initial layers go through a faster cooling due to the proximity to the cold substrate. The cooling rate decreases as subsequent layers are deposited on top of hot printed layers.
The TX fracture surfaces also display a mixed brittle and ductile behavior. Similar to the TY sample, but in a perpendicular orientation, the starting layers above the substrate in the TX sample, Figure 6a, exhibited a brittle fracture due to a high cooling rate while the remaining section shows a ductile fracture. Partially melted and unmelted powders along with voids are also visible in all samples as shown in Figure 6b.
Figure 6b illustrates the accumulation of unmelted particles in the TX sample. The powder size is consistent with the initial powder size. The unmelted powder collection near the smooth surface may be due to a Marangoni flow that rejected powder particles from the molten pool. The variation of temperature in different melt pool locations creates a flow of molten material from the center of the melt pool to the surrounding area. The molten material at the edge moves to the bottom of the pool while the dislocated fluid moves to the top due to buoyancy force and variation of density between hot and cold regions, causing a Marangoni convection [25].
3.2. Fracture Toughness
Fracture toughness measures a material’s resistance to the extension of a crack. Orientation-dependent differences in the microstructure, texture, and defects contribute to differences in mechanical properties. Defects, pores, and unmelted powder particles contributed to inconsistent fracture toughness results. The average fracture toughness properties are reported in Table 4.
The FY orientation shows the highest fracture toughness (Kq) values. In the FY samples, additively manufactured layers and interlayer cracks are perpendicular to the notch orientation, preventing the notch crack from propagation. Since the interlayer cracks in the FZ samples are parallel to the notch, FZ orientation is expected to have the lowest fracture toughness properties. However, FX orientation shows the lowest values. Relatively higher hardness values in the Z orientation may have contributed to better fracture toughness properties. Fracture surfaces exhibited a mixed mode of brittle cleavage and ductile fracture, as shown in Figure 7. The schematics on the lower right corner of Figure 7 show the print orientation and arrangement of the layers. Areas of perfect solidification were characterized as transgranular ductile dimple fractures from the coalescence of microvoids. Fine dimples at the tensile fracture surface were indications of plastic deformation. Defects were observed on the surfaces of fracture toughness samples, which consisted of isolated porosities, voids, cracks, and unmelted regions. Lack of laser power, pulse frequency along with high scanning speed may contribute to large areas of voids and unmeted powder [26].
Areas of unmelted powder on top of smooth solidified material might be generated by Marangoni flow during the melting process. Marangoni flow can move the molten material away from the center of the melt pool (Figure 8). Optimization of the processing parameters can potentially eliminate some of these defects [26]. Similar pores were observed in samples printed by EONSINT M270 [27] as compared in Figure 8. Both SEM micrographs show ductile fracture with pores and unmelted powders.
Table 5 provides Kq toughness values of PBF Ti–6Al–4V samples for as-built, stress-relieved, hot isostatic pressing (HIP), and heat-treated conditions as reviewed by Lewandowski and Seifi [16]. The orientations listed in the table comply with ASTM standard number 52921 [28]. ASTM standard 59921 explains the terminology for AM coordinate systems and test methodologies. Z designates the build direction. X is parallel to the machine front and perpendicular to Z. Y is perpendicular to the Z and X axes, with a right-hand positive coordinate definition. The first letter is the axis parallel to the peak dimension. The second letter determines the second larger dimension [29].
It should be noted that the properties of the EOS M280 samples were significantly different in as-built and HIP PBF cases [16]. The EOS M280 samples heat treatment and HIP were rather complicated. The heat treatment performed was the recrystallization anneal at 950 °C for an hour twice, furnace-cooled, and air-cooled for the first and second processes, respectively. It was then heated to 700 °C for an hour and air-cooled followed by heating to 1030 °C for one hour, air-cooled and heated to 630 °C and air-cooled. For HIP, the samples were heated to 915 °C at 1000 bar isostatic pressure, two-hour holding period, and furnace-cooled at 11 °C/min [32]. The fracture toughness results for AM250 samples were comparable with EOS M280 HIP samples, but the fracture toughness properties were lower than heat-treated EOS M280 samples.
3.3. Metallography
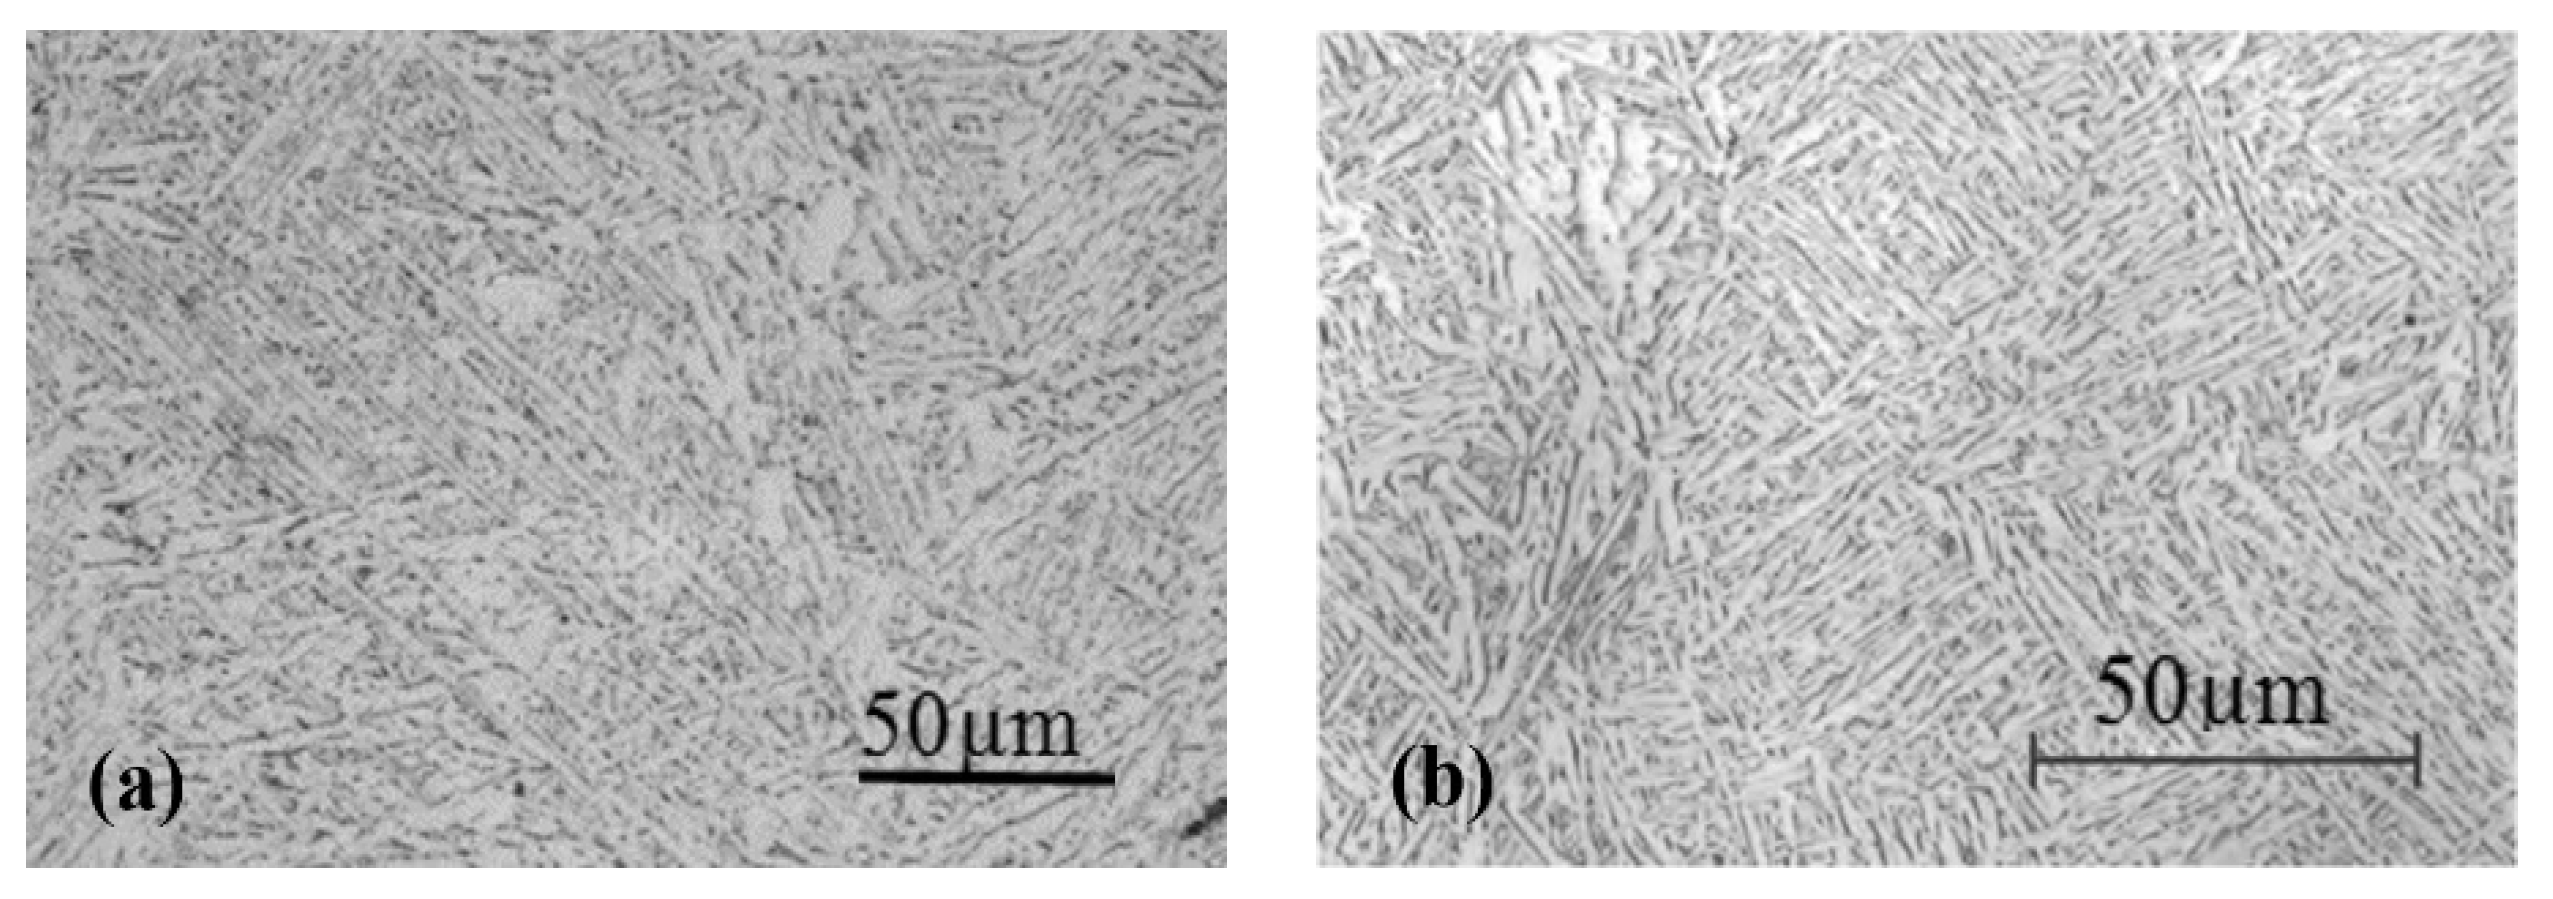
The tensile samples were prepared for metallography to observe the microstructures in all three build orientations at different locations. The polished sample surfaces were swabbed with Keller etchant for about 6 s, and then neutralized and studied by optical microscopy. At the temperatures lower than β transus the alloy is a mixture of α and β phases. At high cooling rates the β transforms into martensitic α’ phase. The α’ phase might completely dominate the microstructure based on the cooling rate in the SLM process. However, the heat-treatment process transforms the martensitic α’ phase into α and β phases. The metallography in all surfaces revealed α + β microstructure with no major differences in different orientations and magnifications. The microstructure in all build orientation was almost similar due to the heat treatment performed on the samples. Heat treatment above 600 °C coarsens partial martensitic α’ plates into the laminar α + β structure. At β transus temperature, around 1000 °C, the coarsening is comparably higher. The coarse martensitic α’ improves the mechanical properties, especially the ductility. The optimal heat treatment ranges from 850 °C to 950 °C meet standard specifications. In this study, heat treatment was performed under an argon gas environment with an initial ramp to 850 °C over 110 min, then held at 850 °C for 60 min, and finally furnace cooled to 350 °C before turning off the argon flow. Comparison of the microstructure in Figure 9 revealed that AM250 sample microstructure was similar to Vrancken et al. [33] samples heat-treated at 850 °C for two hours followed by air-cooling.
3.4. Hardness Test
Hardness test was performed on all of the tensile samples. Hardness values varied between 29 to 38.6 Rockwell C scale (HRC), which were equal or superior to the fully annealed material, and comparable or lower than wrought coarse α and equiaxed α/β material [26]. Poonda et al. [34] performed hardness test on fully annealed Ti–6Al–4V AM samples. The hardness values for AM samples ranged from 25 to 30 HRC with an average of 26.675 HRC [34]. Table 6 compares the average hardness on bottom and top layers of the tensile samples. A declining trend was observed in hardness measurements from the bottom to the top. While the average hardness at the bottom of TZ samples was 37.67 HRC, the average hardness at the top layers was measured to be 30.10 HRC. A similar trend is observed for TX and TY samples. Higher hardness values were expected on starting layers compared to the remaining layers due to high cooling rates at the areas closer to the substrate. The hardness decreases as the distance from the substrate increases. However, the TZ sample shows a comparably higher hardness even at the top. The reason may be that when printing the top layers of TZ sample, the samples in X and Y orientations are already printed and the small cross section of TZ sample is surrounded by plenty of cold unmelted powder, which provides a high cooling rate. The defects present on the surface may have contributed to the variable hardness values as well [16]. The lower hardness results may be due to the presence of voids, unmelted powder particles and cracks. Optical microscopy of the samples revealed surface defects. For example, Figure 10 shows the interlayer defects perpendicular to build orientation in a TZ sample. The arrow shows the build direction. Also, Figure 11 displays collection of surface defects at different locations of the tensile sample built in X orientation. The defects such as porosity and unmelted powder result in lower hardness measurements.
3.5. Surface Roughness
One of the characteristics of the SLM process is the rough surface finish. Optical profilometry was used to investigate the surface roughness. The surface properties of as-built fracture toughness samples were studied. Although the results were not all consistent, the side walls exhibited rougher surfaces compared to the top surfaces. A common surface roughness parameter is Ra which is the arithmetic mean of absolute value for linear profiling. The Ra value was about 8 µm at the top surface, while it was about 18 µm at the lateral surfaces. It should be noted that lateral surfaces represent multiple additively manufactured layers, while top surfaces represent a single layer with multiple raster lines. Figure 12 shows the surface roughness map and SEM micrograph for the lateral surface of the TZ sample which represents a relatively rough surface. The crack line in Figure 12 formed due to insufficient interlayer bonding perpendicular to the build orientation. The areas of insufficient fusion can be identified by valleys (dark areas) in the optical surface profile presented in Figure 12 and Figure 13. Figure 13 shows the optical surface profile and SEM micrograph for the top surface of the TX sample. The top surface is clearly smoother than the side surfaces.
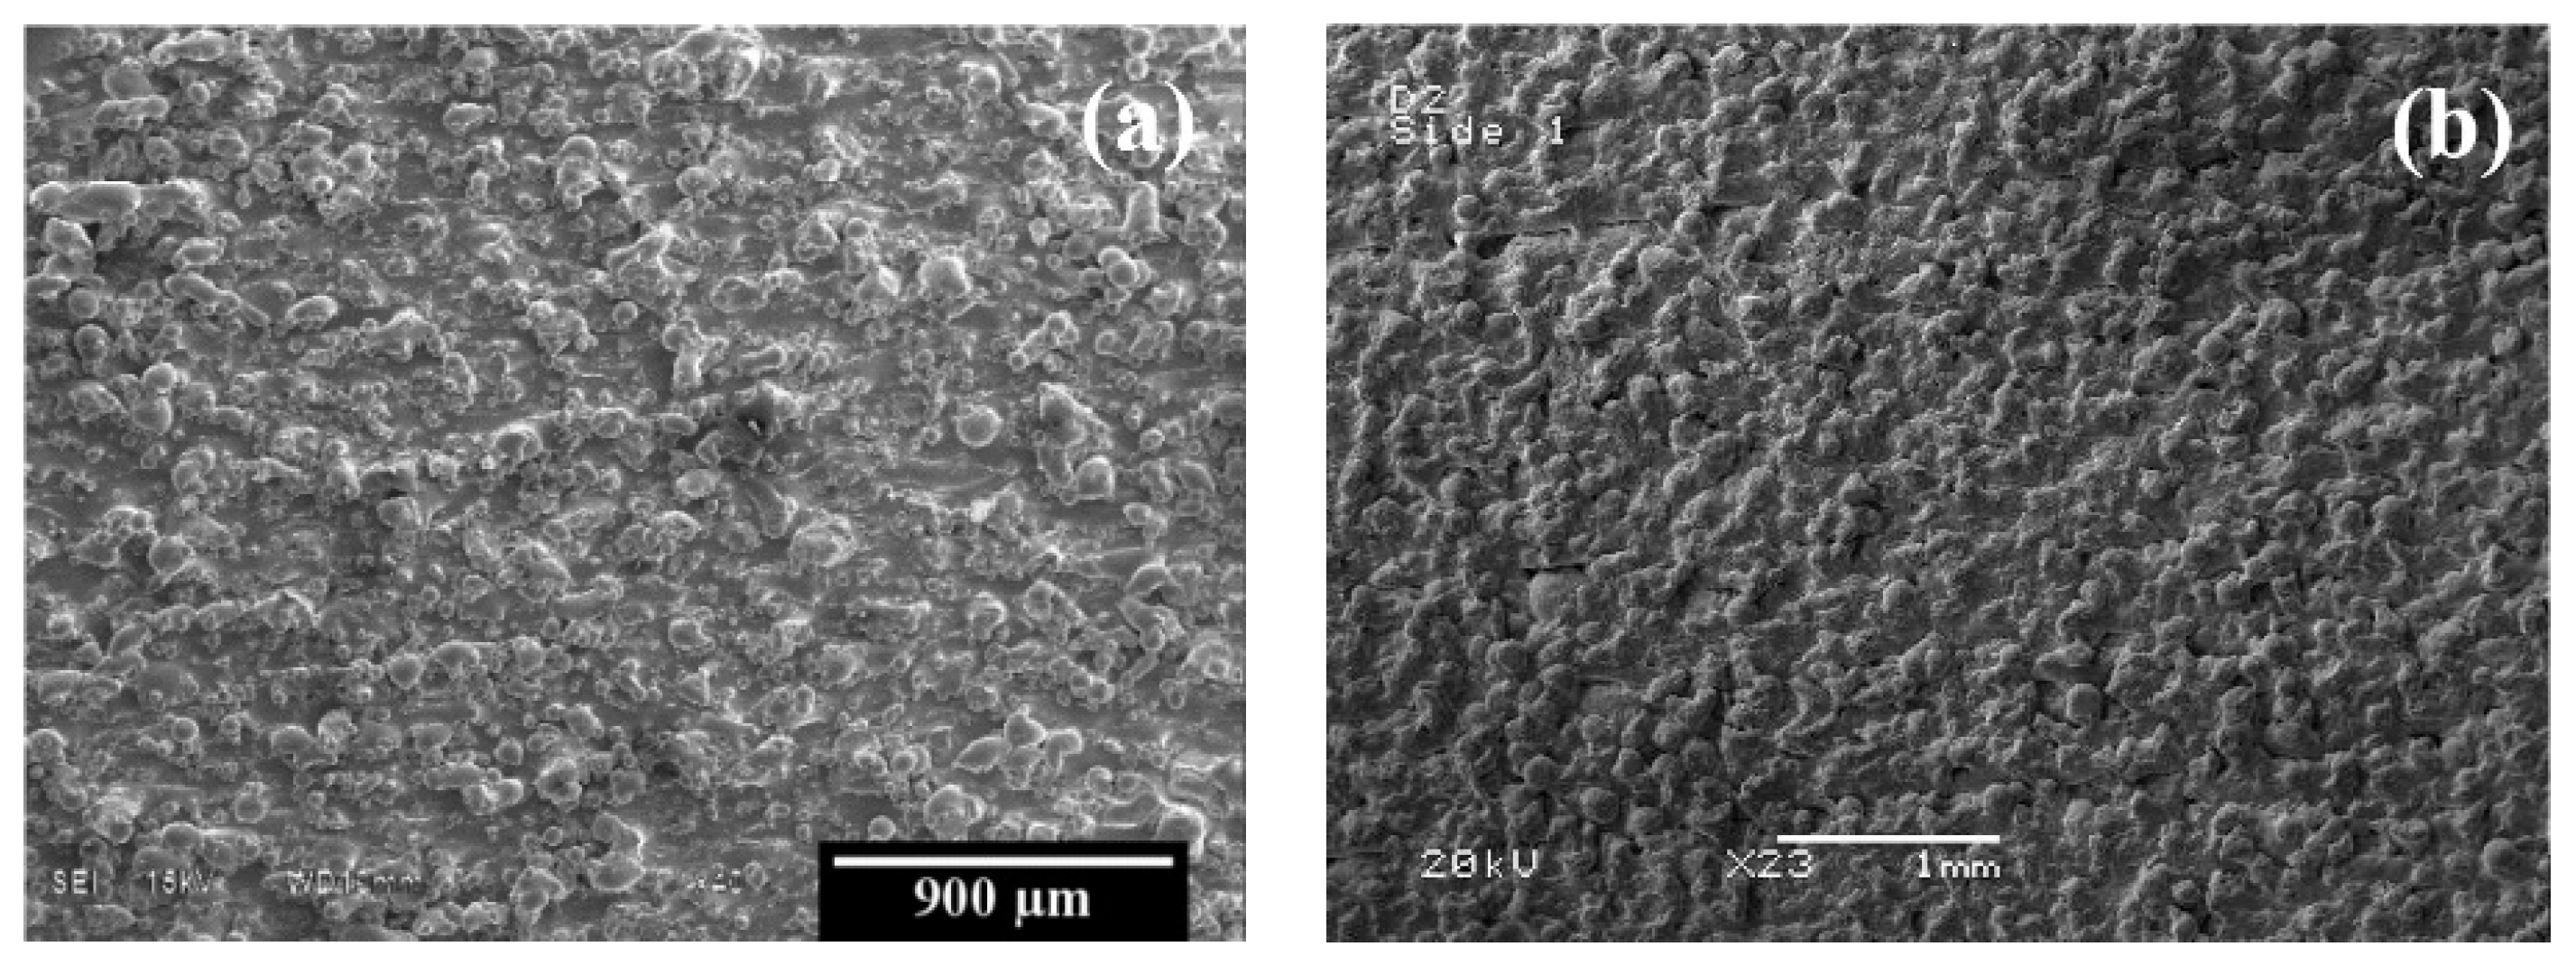
EONSINT M270 DMLS generated samples by Chauke et al. [27] exhibited a similar surface morphology. Their samples also showed unmelted and half-melted powder globules, as evident in Figure 14 [27]. The inability of layers to completely join might be due to the absence of sufficient power exposure to melt the previously deposited layers. Cracks and lack of fusion were observable in the remaining samples with different orientations as well.
Todd et al. [35] measured the surface roughness of a number of samples using optical profilometry. The reported values varied between 5 and 15 µm [35]. The surface roughness values in the present study ranged from 6 to 20 µm, but the average surface roughness was comparable with other reported results, as shown in Table 7.
4. Conclusions
In this research, the effect of build orientation on the microstructure, mechanical and surface properties of selective laser-melted Ti–6Al–4V alloy was studied. The as-built surfaces along with fracture surfaces were studied by SEM. The tensile test revealed lower yield and ultimate tensile strength in the samples printed in the Z orientation with brittle planar fracture features perpendicular to the build direction. Tensile samples built in the X and Y orientations exhibited brittle fracture features in areas close to the substrate and ductile fracture features in the area farther from the substrate. The SEM images of as-built and fracture surfaces revealed defects including pores, cracks, and unmelted/partially-melted powder particles. The mechanical test results were clearly influenced by the defects. However, the tensile and fracture toughness test results were consistent with previously reported data. Metallography showed identical α + β microstructure in all build orientations, as the samples were all heat treated. The bottom layers close to the substrate showed lower hardness values as compared to the top layers, due to the change in cooling rate. Defects revealed from metallography observations on the surfaces influenced the hardness results. The surface analysis showed variable roughness data on different surfaces. While lateral surfaces showed higher roughness values, the top surface exhibited smoother features. Despite orientation factors and build defects, the surface roughness values were comparable with other studies. It was concluded that microstructure and properties were affected by build orientation in Ti–6Al–4V alloys processed by SLM. Defects influenced the results significantly. Optimization of process parameters may improve the overall quality of AM samples and provide more uniform properties in different build orientations.
Author Contributions
M.E. conceived and designed the experiments; P.H. performed the experiments; P.H. and M.E. analyzed the data and wrote the paper.
Funding
This research received no external funding.
Acknowledgments
The authors would like to thank Behzad Bavarian from California State University, Northridge for his assistance with mechanical testing and scanning electron microscopy. The authors also acknowledge California State University, Los Angeles and National Science Foundation through Grant PREM-1523588 for their support.
Conflicts of Interest
The Authors declare no conflict of interest.
References
- Gong, H.; Rafi, K.; Gu, H.; Starr, T.; Stucker, B. Analysis of defect generation in Ti-6Al-4V parts made using powder bed fusion additive manufacturing processes. Addit. Manuf. 2014, 1, 87–98. [Google Scholar] [CrossRef]
- Introduction to Additive Manufacturing Technology; European Powder Metallurgy Association: Shrewsbury, UK, 2013; p. 6.
- Rafi, H.K.; Karthik, N.V.; Gong, H.; Starr, T.L.; Stucker, B.E. Microstructures and mechanical properties of Ti6Al4V parts fabricated by selective laser melting and electron beam melting. J. Mater. Eng. Perform. 2013, 22, 3872–3883. [Google Scholar] [CrossRef]
- Sieniawski, J.; Ziaja, W.; Kubiak, K.; Motyka, M. Microstructure and Mechanical Properties of High Strength Two-Phase Titanium Alloys. In Titanium Alloys-Advances in Properties Control; Sieniawski, J., Ziaja, W., Eds.; InTech: Gdańsk, Poland, 2013; pp. 69–80. [Google Scholar]
- Simonelli, M.; Tse, Y.Y.; Tuck, C. The formation of α + β microstructure in as-fabricated selective laser melting of Ti-6Al-4V. J. Mater. Res. 2014, 29, 2028–2035. [Google Scholar] [CrossRef]
- Barriobero-Vila, P.; Gussone, J.; Haubrich, J.; Sandlöbes, S.; da Silva, J.C.; Cloetens, P.; Schell, N.; Requena, G. Inducing stable α + β microstructures during selective laser melting of Ti-6Al-4V using intensified intrinsic heat treatments. Materials 2017, 10, 268. [Google Scholar] [CrossRef] [PubMed]
- Dadbakhsh, B.V.J.-P.K.S.; Vleugels, J.V.H.K.K.J. Additive Manufacturing of Metals via Selective Laser Melting: Process Aspects and Material Developments. In Additive Manufacturing; Sudarshan, T.S.S.T.S., Ed.; CRC Group, Taylor & Francis Group: Boca Raton, NJ, USA, 2015; pp. 69–99. [Google Scholar]
- Kruth, J.P.; Levy, G.; Klocke, F.; Childs, T.H.C. Consolidation phenomena in laser and powder-bed based layered manufacturing. CIRP Ann. Manuf. Technol. 2007, 56, 730–759. [Google Scholar] [CrossRef]
- Childs, T. Selective laser sintering (melting) of stainless and tool steel powders: Experiments and modelling. Proc. Inst. Mech. Eng. Part B 2005, 219, 339–357. [Google Scholar] [CrossRef]
- Das, S. Physical Aspects of Process Control in Selective Laser Sintering of Metals. Adv. Eng. Mater. 2003, 5, 701–711. [Google Scholar] [CrossRef]
- Fatemi, S.A.; Ashany, J.Z.; Aghchai, A.J.; Abolghasemi, A. Experimental investigation of process parameters on layer thickness and density in direct metal laser sintering: A response surface methodology approach. Virtual Phys. Prototyp. 2017, 12, 133–140. [Google Scholar] [CrossRef]
- Mohanty, P.S.; Mazumder, J. Solidification behavior and microstructural evolution during laser beam—Material interaction. Metall. Mater. Trans. B 1998, 29, 1269–1279. [Google Scholar] [CrossRef]
- Lavernia, E.J.; Srivatsan, T.S. The rapid solidification processing of materials: Science, principles, technology, advances, and applications. J. Mater. Sci. 2010, 45, 287–325. [Google Scholar] [CrossRef]
- Birol, Y. Microstructural characterization of a rapidly-solidified AI-12 wt% Si alloy. J. Mater. Sci. 1996, 31, 2139–2143. [Google Scholar] [CrossRef]
- Sing, S.L.; An, J.; Yeong, W.Y.; Wiria, F.E. Laser and electron-beam powder-bed additive manufacturing of metallic implants: A review on processes, materials and designs. J. Orthop. Res. 2016, 34, 369–385. [Google Scholar] [CrossRef] [PubMed]
- Lewandowski, J.J.; Seifi, M. Metal Additive Manufacturing: A Review of Mechanical Properties. Annu. Rev. Mater. Res. 2016, 46, 151–186. [Google Scholar] [CrossRef]
- Sames, W.J.; List, F.A.; Pannala, S.; Dehoff, R.R.; Babu, S.S. The metallurgy and processing science of metal additive manufacturing. Int. Mater. Rev. 2016, 61, 315–360. [Google Scholar] [CrossRef]
- Sing, S.L.; Wiria, F.E.; Yeong, W.Y. Selective laser melting of titanium alloy with 50wt% tantalum: Effect of laser process parameters on part quality. Int. J. Refract. Met. Hard Mater. 2018, 77, 120–127. [Google Scholar] [CrossRef]
- Simonelli, M.; Tse, Y.Y.; Tuck, C. Effect of the build orientation on the mechanical properties and fracture modes of SLM Ti-6Al-4V. Mater. Sci. Eng. A 2014, 616, 1–11. [Google Scholar] [CrossRef]
- Edwards, P.; Ramulu, M. Effect of build direction on the fracture toughness and fatigue crack growth in selective laser melted Ti-6Al-4-‰V. Fatigue Fract. Eng. Mater. Struct. 2015, 38, 1228–1236. [Google Scholar] [CrossRef]
- Barriobero-Vila, P.; Gussone, J.; Stark, A.; Schell, N.; Haubrich, J.; Requena, G. Peritectic titanium alloys for 3D printing. Nat. Commun. 2018, 9, 3426. [Google Scholar] [CrossRef] [PubMed]
- Ti6Al4V ELI-0406 Powder for Additive Manufacturing; Renishaw plc: Staffordshire, UK, 2017.
- ASTM. E8/E8M standard test methods for tension testing of metallic materials 1. In Annu. B. ASTM Stand. 4; ASTM International: West Conshohocken, PA, USA, 2010; Volume I, pp. 1–27. [Google Scholar]
- E08-Committee. ASTM E399-97—Standard Test Method for Plane-Strain Fracture Toughness of Metallic Materials 1; ASTM International: West Conshohocken, PA, USA, 1997; Volume E399–90. [Google Scholar]
- Yuan, P.; Gu, D.; Dai, D. Particulate migration behavior and its mechanism during selective laser melting of TiC reinforced Al matrix nanocomposites. Mater. Des. 2015, 82, 46–55. [Google Scholar] [CrossRef]
- Seifi, M.; Dahar, M.; Aman, R.; Harrysson, O.; Beuth, J.; Lewandowski, J.J. Evaluation of Orientation Dependence of Fracture Toughness and Fatigue Crack Propagation Behavior of As-Deposited ARCAM EBM Ti-6Al-4V. JOM 2015, 67, 597–607. [Google Scholar] [CrossRef]
- Chauke, L.; Mutombo, K.; Kgomo, C. Characterization of the direct metal laser sintered Ti6Al4V Components. In Proceedings of the RAPDASA 2013 Conference, Clarens, South Africa, 29 October–1 November 2013. [Google Scholar]
- ASTM International. BS ISO/ASTM 52900:2015 Additive Manufacturing. General Principles. Terminology; Rapid Manufacturing Association: West Conshohocken, PA, USA, 2013; pp. 10–12. [Google Scholar]
- Herderick, E. Additive manufacturing of metals: A review. Mater. Sci. Technol. Conf. Exhib. 2011, 2, 1413–1425. [Google Scholar]
- Cain, V.; Thijs, L.; van Humbeeck, J.; van Hooreweder, B.; Knutsen, R. Crack propagation and fracture toughness of Ti6Al4V alloy produced by selective laser melting. Addit. Manuf. 2015, 5, 68–76. [Google Scholar] [CrossRef]
- Van Hooreweder, B.; Moens, D.; Boonen, R.; Kruth, J.-P.; Sas, P. Analysis of Fracture Toughness and Crack Propagation of Ti6Al4V Produced by Selective Laser Melting. Adv. Eng. Mater. 2012, 14, 92–97. [Google Scholar] [CrossRef]
- Becker, T.H.; Beck, M.; Scheffer, C. Microstructure and mechanical properties of Direct Metal Laser Sintered Ti-6Al-4V. S. Afr. J. Ind. Eng. 2015, 26, 1–10. [Google Scholar] [CrossRef]
- Vrancken, B.; Thijs, L.; Kruth, J.-P.; van Humbeeck, J. Heat treatment of Ti6Al4V produced by Selective Laser Melting: Microstructure and mechanical properties. J. Alloys Compd. 2012, 541, 177–185. [Google Scholar] [CrossRef]
- Poondla, N.; Srivatsan, T.S.; Patnaik, A.; Petraroli, M. A study of the microstructure and hardness of two titanium alloys: Commercially pure and Ti-6Al-4V. J. Alloys Compd. 2009, 486, 162–167. [Google Scholar] [CrossRef]
- Mower, T.M.; Long, M.J. Mechanical behavior of additive manufactured, powder-bed laser-fused materials. Mater. Sci. Eng. A 2016, 651, 198–213. [Google Scholar] [CrossRef]
Figure 1.
Sample geometry; print orientation and setup in isometric view.

Figure 2.
Tensile specimen dimensions in inches (mm).

Figure 3.
Fracture toughness sample dimensions in inches (mm).

Figure 4.
Scanning electron microscope (SEM) fractographs of TZ sample: (a) the entire fracture surface; (b) unmelted powder particles; (c) mixed brittle and ductile fracture features.
Figure 4.
Scanning electron microscope (SEM) fractographs of TZ sample: (a) the entire fracture surface; (b) unmelted powder particles; (c) mixed brittle and ductile fracture features.

Figure 5.
SEM fractographs of TY sample: (a) fracture features with respect to build orientation; (b) interlayer fracture.
Figure 5.
SEM fractographs of TY sample: (a) fracture features with respect to build orientation; (b) interlayer fracture.

Figure 6.
SEM fractographs of TX sample: (a) fracture features with respect to build orientation; (b) unmelted powder particles and their sizes.
Figure 6.
SEM fractographs of TX sample: (a) fracture features with respect to build orientation; (b) unmelted powder particles and their sizes.

Figure 7.
SEM micrograph of the fracture surfaces: (a) FX; (b) FY; (c) FZ samples. The schematics show the print orientation and arrangement of the layers.
Figure 7.
SEM micrograph of the fracture surfaces: (a) FX; (b) FY; (c) FZ samples. The schematics show the print orientation and arrangement of the layers.
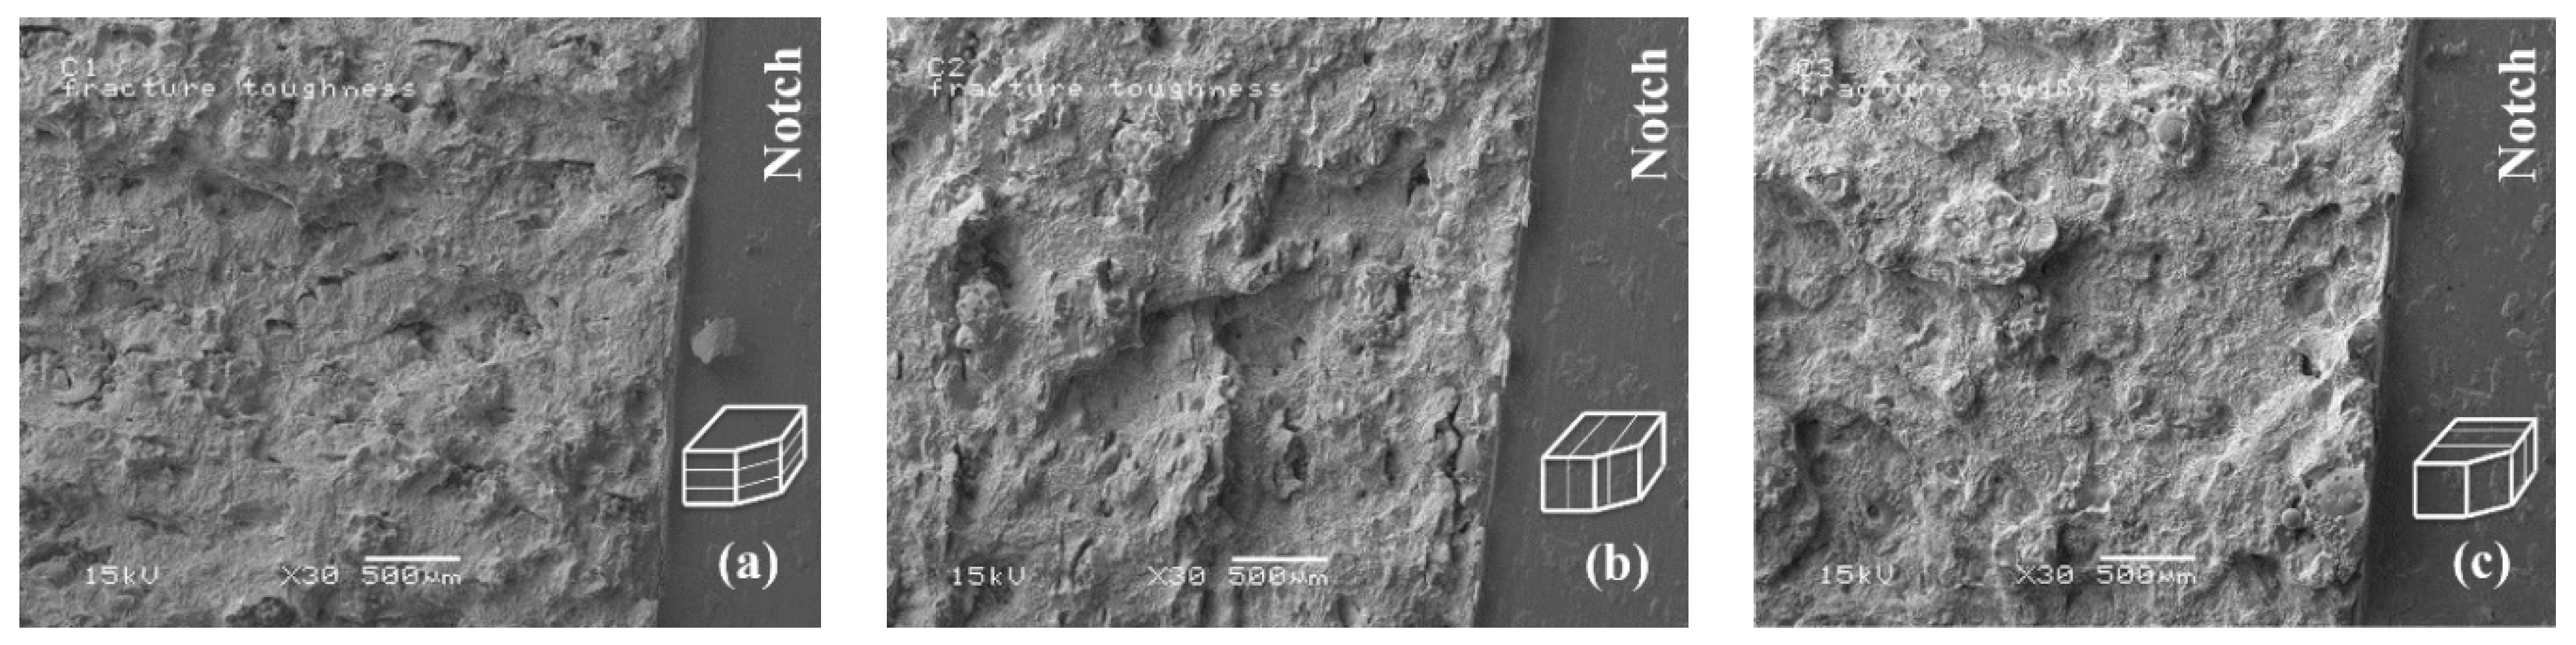
Figure 8.
SEM micrograph of the fracture surface: (a) EONSINT M270 [27]; (b) AM250 (current study).
Figure 8.
SEM micrograph of the fracture surface: (a) EONSINT M270 [27]; (b) AM250 (current study).
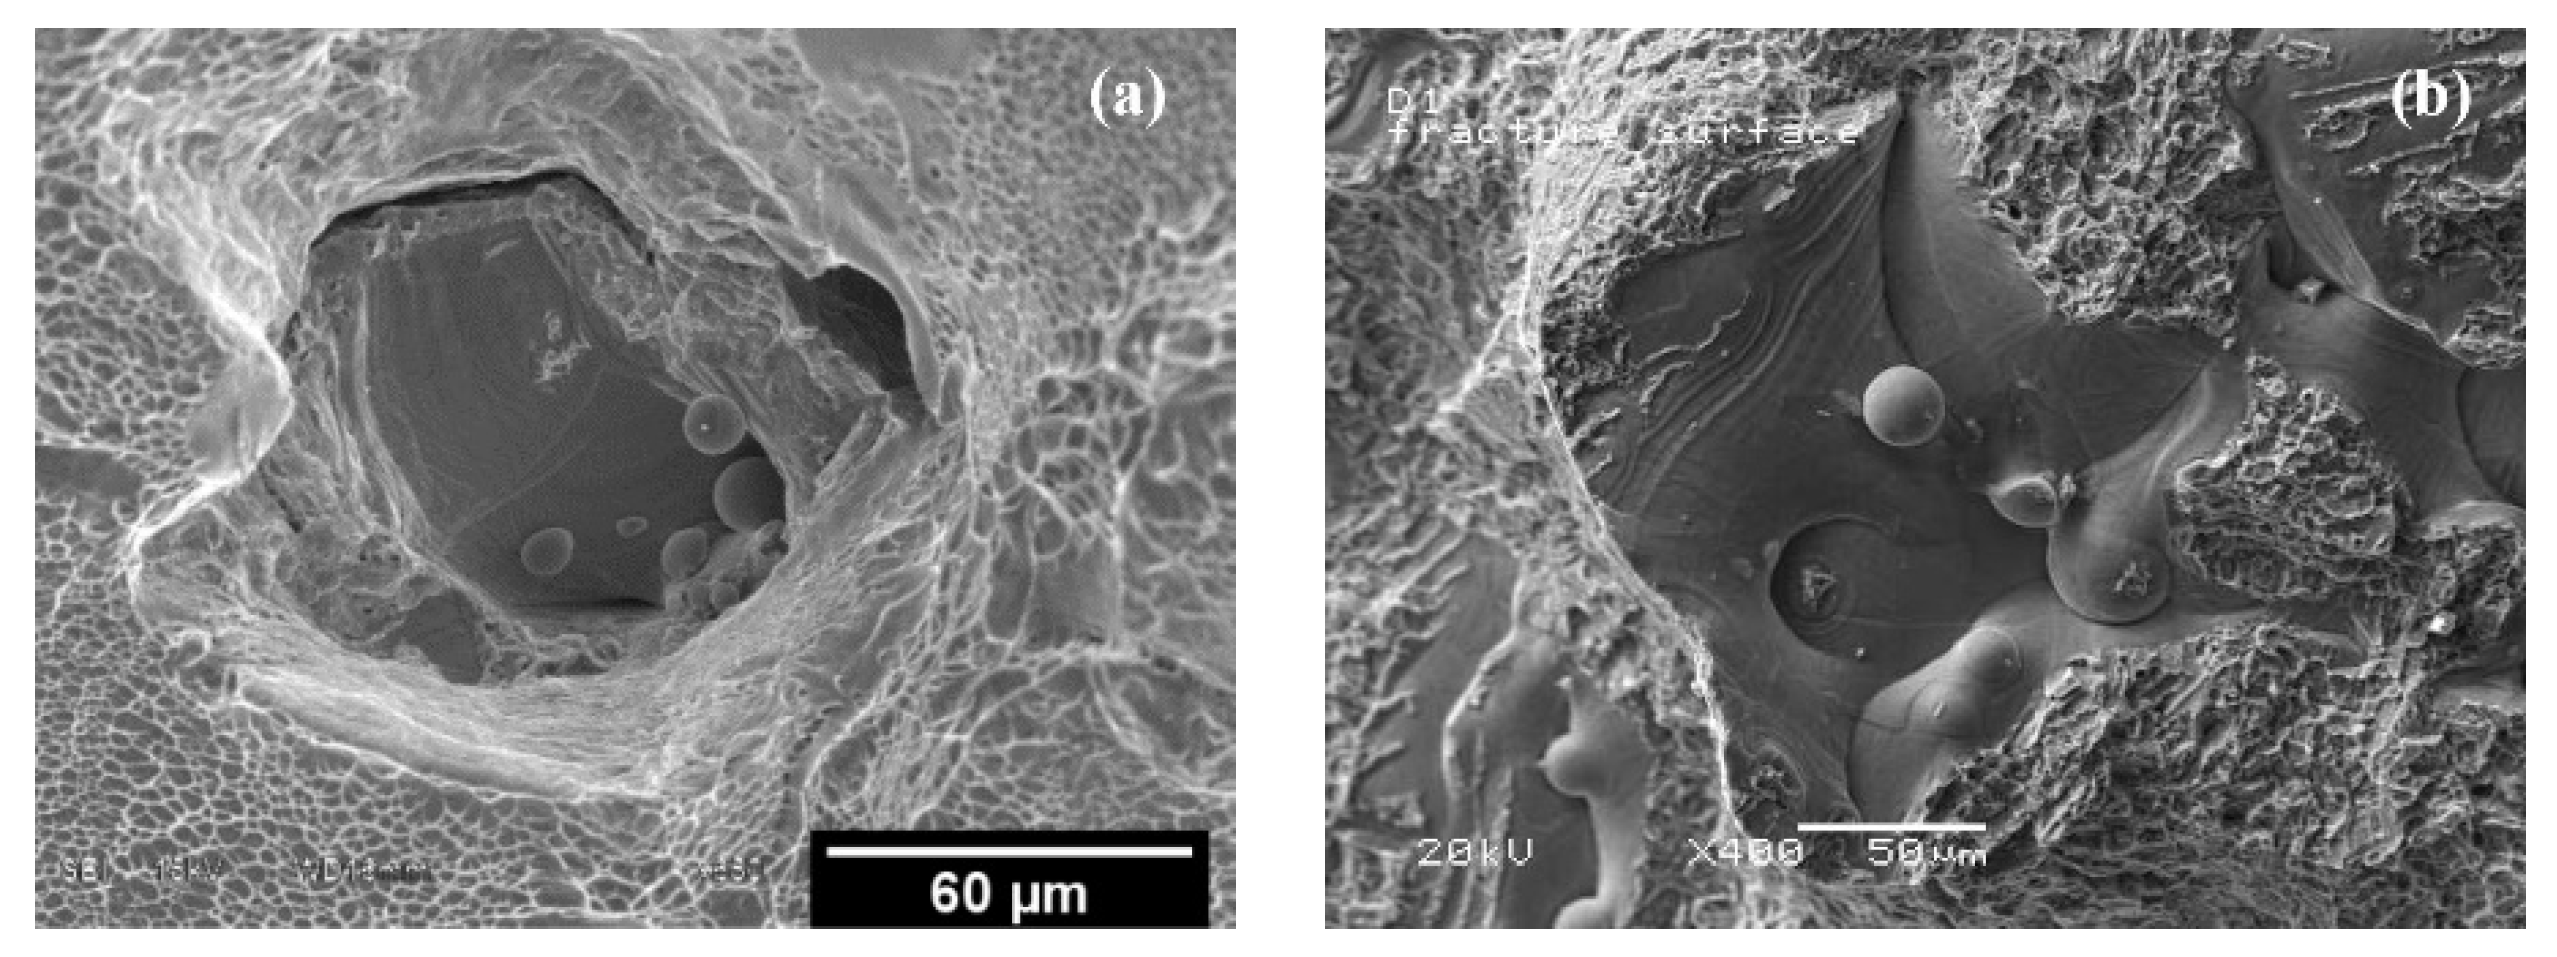
Figure 9.
Comparison of microstructures in: (a) current study; (b) Vranken et al. [33].
Figure 9.
Comparison of microstructures in: (a) current study; (b) Vranken et al. [33].

Figure 10.
Interlayer defects present in the TZ sample.
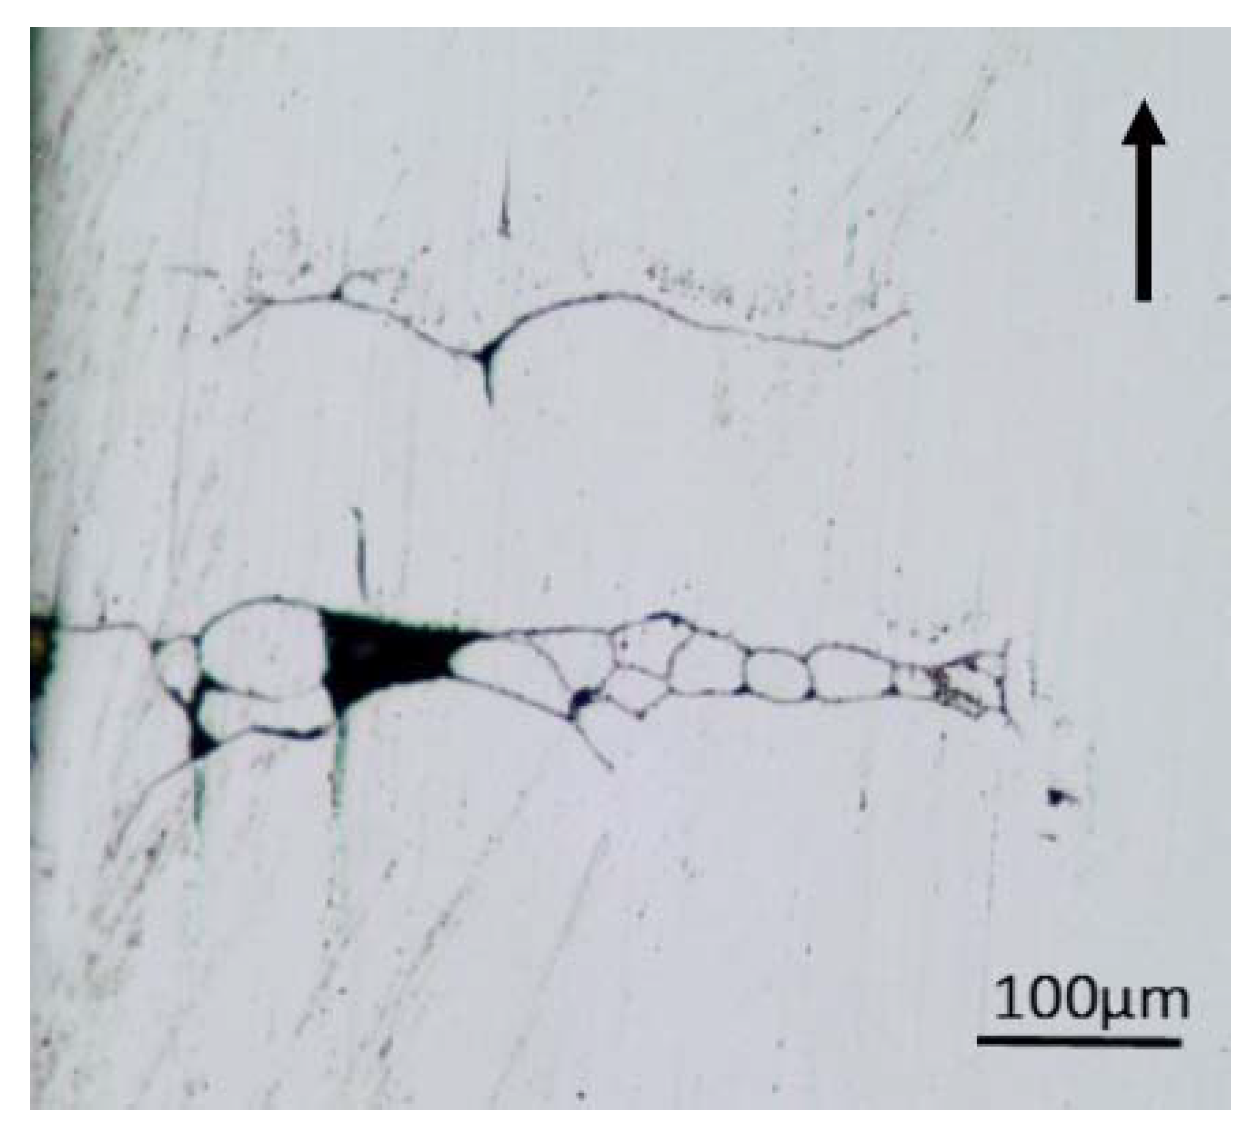
Figure 11.
Collection of defects in the TX sample.

Figure 12.
Optical surface profile: (a) and SEM micrograph (b) for the lateral surface of TZ sample.
Figure 12.
Optical surface profile: (a) and SEM micrograph (b) for the lateral surface of TZ sample.

Figure 13.
Optical surface profile: (a) and SEM micrograph (b) for the top surface of TX sample.

Figure 14.
Surface finish of (a) EONSINT M270 sample [27]; (b) AM250 sample (present study).
Figure 14.
Surface finish of (a) EONSINT M270 sample [27]; (b) AM250 sample (present study).

Table 1.
Process parameters used for manufacturing test samples.
| Environment | Argon/Nitrogen |
|---|---|
| Exposure time | 50 µs |
| Focal point | 75 µm |
| Laser power | 200 W |
| Layer thickness | 30 µm |
| Operational temperature | 170 °C |
| Hatch spacing | 75 µm |
Table 2.
Tensile and fracture toughness sample nomenclature.
| Orientation | Tensile | Fracture |
|---|---|---|
| XYZ (X) | TX | FX |
| XZY (Y) | TY | FY |
| ZXY (Z) | TZ | FZ |
Table 3.
Tensile test results in different build orientations.
| Build Orientation | Yield Strength MPa (ksi) | Ultimate Strength MPa (ksi) | Strain % | E MPa (psi) |
|---|---|---|---|---|
| TX | 1002.15 (145.35) | 1023.9 (148.5) | 1.13 | 97,216 (14.1 × 10⁶) |
| TY | 981.81 (142.40) | 1018.3 (147.7) | 1.30 | 97,216 (14.1 × 10⁶) |
| TZ | 868.05 (125.90) | 872.9 (126.6) | 0.98 | 95,148 (13.8 × 10⁶) |
Table 4.
Ti–6Al–4V fracture toughness results.
| Orientation | PQ Kgf (lbs) | Kq MPa√m (psi√in) | Kq Std. Deviation |
|---|---|---|---|
| FX | 1073.6 (2367) | 55.6 (50,953) | 0.99 (1438.25) |
| FY | 1031.5 (2274) | 57.8 (55,507) | 1.06 (3107.03) |
| FZ | 992.0 (2187) | 61.6 (52,841) | 2.54 (2285.37) |
Table 5.
PBF Ti–6Al–4V fracture toughness data comparison.
| Machine | Condition | Orientation | Kq (MPa√m) | Kq (psi√in) | Reference |
|---|---|---|---|---|---|
| SLM | As built | XY | 28 ± 2 | 25,481 | [30] |
| XZ | 23 ± 1 | 20,931 | |||
| ZX | 16 ± 1 | 14,561 | |||
| Stress relieved | XY | 28 ± 2 | 25,481 | ||
| XZ | 30 ± 1 | 27,301 | |||
| ZX | 31 ± 2 | 28,211 | |||
| Heat treated | XY | 41 ± 2 | 37,312 | ||
| XZ | 49 ± 2 | 44,592 | |||
| ZX | 49 ± 1 | 44,592 | |||
| SLM MTT250 | As built | XY | 66.9 ± 2.6 | 60,882 | [20] |
| XZ | 64.8 ± 16.9 | 58,971 | |||
| YZ | 41.8 ± 1.7 | 38,040 | |||
| SLM | As built | ZX | 52.4 ± 3.48 | 47,686 | [31] |
| EOS M280 | As built | XY | 37.5 ± 5 | 34,126 | [32] |
| HIP | XY | 57.8 ± 5 | 52,600 | ||
| Heat-treated | XY | 86.3 | 78,537 | ||
| SLM | Heat-treated | XY | 55.6 ± 1.0 | 50,953 | Current Study |
| AM250 | XZ | 57.8 ± 1.1 | 55,507 | Current Study | |
| ZX | 61.6 ± 2.5 | 52,841 | Current Study |
Table 6.
Average HRC comparison on bottom and top layers of the tensile samples.
| Build Orientation | Ave. HRC Bottom Layer | Ave. HRC Top Layer |
|---|---|---|
| TX | 33.55 | 31.65 |
| TY | 32.77 | 24.01 |
| TZ | 37.67 | 30.10 |
Table 7.
Surface roughness comparison of the present study with other reported data [35].
© 2018 by the authors. Licensee MDPI, Basel, Switzerland. This article is an open access article distributed under the terms and conditions of the Creative Commons Attribution (CC BY) license (http://creativecommons.org/licenses/by/4.0/).
Share and Cite
MDPI and ACS Style
Hartunian, P.; Eshraghi, M. Effect of Build Orientation on the Microstructure and Mechanical Properties of Selective Laser-Melted Ti-6Al-4V Alloy. J. Manuf. Mater. Process. 2018, 2, 69. https://doi.org/10.3390/jmmp2040069
AMA Style
Hartunian P, Eshraghi M. Effect of Build Orientation on the Microstructure and Mechanical Properties of Selective Laser-Melted Ti-6Al-4V Alloy. Journal of Manufacturing and Materials Processing. 2018; 2(4):69. https://doi.org/10.3390/jmmp2040069
Chicago/Turabian StyleHartunian, Patrick, and Mohsen Eshraghi. 2018. "Effect of Build Orientation on the Microstructure and Mechanical Properties of Selective Laser-Melted Ti-6Al-4V Alloy" Journal of Manufacturing and Materials Processing 2, no. 4: 69. https://doi.org/10.3390/jmmp2040069