Abstract
Remanufacturing is a viable option to extend the useful life of an end-of-use product or its parts, ensuring sustainable competitive advantages under the current global economic climate. Challenges typical to remanufacturing still persist, despite its many benefits. According to the European Remanufacturing Network, a key challenge is the lack of accurate, timely and consistent product knowledge as highlighted in a 2015 survey of 188 European remanufacturers. With more data being produced by electric and hybrid vehicles, this adds to the information complexity challenge already experienced in remanufacturing. Therefore, it is difficult to implement real-time and accurate remanufacturing for the shop floor; there are no papers that focus on this within an electric and hybrid vehicle environment. To address this problem, this paper attempts to: (1) identify the required parameters/variables needed for fuel cell remanufacturing by means of interviews; (2) rank the variables by Pareto analysis; (3) develop a casual loop diagram for the identified parameters/variables to visualise their impact on remanufacturing; and (4) model a simple stock and flow diagram to simulate and understand data and information-driven schemes in remanufacturing.
1. Introduction and Related Research
In tackling the various challenges identified in the transition towards a circular economy of more sustainable, intelligent, sociotechnical systems, various approaches have been proposed. These have varied from the 3Rs of Reduction, Reuse and Recycling of materials and energy [1] to further versions with 6Rs and 9Rs frameworks [2,3], which include remanufacture of materials as a key circular business approach. The concept of a “circular economy (CE)” is relatively new [4], certainly in research—the first CE article for the Journal of Resources, Conservation and Recycling is recorded in 2007 [5]. Remanufacturing, however, is not a new concept. According to Hatcher et al. [6], remanufacturing has been a common industrial activity since the Second World War. As an academic research area, however, remanufacturing only emerged as a topic in the late 1970s and early 1980s. Robert Lund’s 1984 investigation [7] into remanufacturing in the United States comprehensively communicated the experience of the US, as well as implications for developing countries. There has been a slow uptake of academic interest in remanufacturing, as compared to other circular approaches such as recycling [6]. This may be attributed to the similarly slow uptake in industry interest in remanufacturing, particular in comparison to the recycling industry, which has grown by 300% [8]. When thirty-seven (37) “design for remanufacture” papers were reviewed in Hatcher et al. (2011) [6], it was found that 6 had been published in 1995–1999, rising to 12 between 2000 and 2005, and with only 19 published in 2006–2011, thus confirming the slow increase in remanufacturing-based research.
Within the literature, there are various definitions of remanufacturing, with [9] and [10] stressing that no universally accepted definition exists. Ijomah et al. [11] state that this ambiguity has presented a key challenge for practitioners and researchers. In addition to the confusion in terminology associated with remanufacturing, differences in definitions have been seen to exist in the expected quality and performance level of a remanufactured product in comparison to a newly remanufactured product [12]. Remanufacturing as [10] “the process of transforming durable products that are worn, defective, or discarded to a ‘like new or better’ condition through a production-bath process of disassembly, cleaning, refurbishment and replacement of parts, reassembly, and testing”. Ijomah (2009) [13] further argues that “the performance specification should be returned to the original level from the customers’ perspective and warranty will be given as equivalent to new products”. Chapman (2010) [9], on the other hand, defines remanufacturing as “an industrial process of returning a used product to at least its original performance, equivalent to or better than that of the newly manufactured product”. The American National Standards Institute (ANSI), in a more recent definition, argued that “remanufacturing is a comprehensive and rigorous industrial process by which a previously sold, leased, used, worn, or non-functional product or part is returned to a “like-new” or “better-than-new” condition, from both a quality and performance perspective, through a controlled, reproducible and sustainable process” [14]. Thus, remanufactured goods could be sold at a lower price, but potentially (or often) with a higher profit margin [15]. Following these definitions, it can be observed that the focus on remanufacturing has grown from the state of the product, to the condition of the remanufactured product, to the warranty and to the broader subject of sustainability. Figure 1 gives an example of a used and a remanufactured end product.
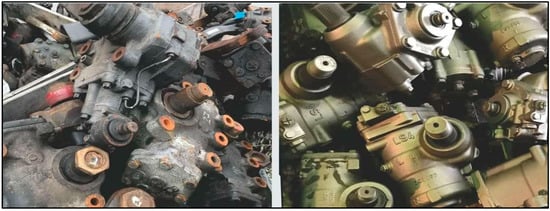
Figure 1.
An example of core and remanufactured product (Courtesy: PSS, Norwich, England, UK).
Thus, remanufacturing makes extensive reuse of a product possible, hence keeping the product within a chain of circularity. This benefit is in addition to the demonstrated economic, social and environmental benefits of remanufacturing [6] observed across key remanufacturing sectors. Research into remanufacturing in the UK by the Centre for Remanufacturing and Reuse in 2004 [9] reveals that remanufacturing was found to take place in 22 sectors of manufacturing activity, of which the aerospace, automotive and mechanically powered machinery sectors were found to have the highest uptake. Polk (2013) [16] states that 45% of gearboxes and 23% of engines in the aftermarket inventories of original equipment manufacturers (OEMs) are remanufactured worldwide.
Research related to remanufacturing is varied; however, it can be largely grouped into four categories; these include: (1) research into the processes in remanufacturing and design for remanufacture or DfRem; (2) the business models, frameworks and the wider supply chain associated with remanufacturing; (3) research into the benefits of remanufacturing; and (4) challenges experienced in remanufacturing.
Research on remanufacturing and remanufacturing systems has been conducted by several authors. This includes research on decision-making and Remanufacturing Decision-Making Frameworks (RDMF) for remanufacturing (Subramoniam et al. [17], Ismail et al. [18], Okorie et al. [19]); remanufacturing production and lead times (Inderfurth and van der Laan (2001) [20], Kiesmuller (2003) [21]); design for remanufacturing (DfRem), (Hatcher et al. (2011) [6], Ijomah (2007) [11]); remanufacturing optimisation procedures for inventory level and Economic Order Quantity, (Kiesmuller and van der Laan (2001) [22], Koh et al. (2002) [23], Teunter (2001) [24]); remanufacturing capacity planning, (Georgiadis, et al. (2006) [25], Kleber R. (2006) [26]) and research on assessing metrics for remanufacturability, Bras and Hammond (1996) [27].
Within the scope of remanufacturing implementation benefits, several authors [15,28] have identified specific environmental, social and economic benefits. These include a decrease in the use of resources, water and energy consumption, creation of employment opportunities, as remanufacturing is highly labour-intensive, as well as a 40–65% reduction in used material costs, and lower capital investment in factories and equipment acquisition [29].
Technical Status of Fuel Cells
Since it was identified as an “environmentally aware energy supply” [30], fuel cell (FC) technology has been used to replace energy supply systems such as batteries. According to literature [31], the benefits of FCs revolve around their high efficiencies and low emissions. Hydrogen-powered fuel cells produce clean, pollution-free energy and have more than twice the efficiency of the conventional internal combustion (IC) engine [32]. Comparatively, the traditional combustion-based power plant would generate at efficiencies of 33 to 35%, while fuel cell systems would generate electricity at efficiencies of up to 60% [33] and higher with cogeneration [34]. Sixty percent (60%) of the fuel’s energy is used in the fuel cell system. This corresponds to a more than 50% reduction in fuel consumption in comparison to a traditional vehicle with a gasoline IC engine. Composed of three active components, the fuel electrode (anode), an oxidant electrode (cathode), and an electrolyte in between them, a fuel cell is an electrochemical device that coverts the chemical energy of a fuel directly into electrical energy [34]. The electrolyte is placed between the two electrodes, with bipolar plates on either side of the cell which help to distribute gases and serve as current collectors [33]. The fuel cell provides an integrated cleaner alternative to the thermal processes involved in traditional combustion-based engines. Current combustion-based engines and energy generating technologies cause harm to the environment and contribute to many global issues, the most predominant of which is climate change [34]. Fuel cells provide sustainable solutions and energy security in response to these issues. The static nature of fuel cells also means that they can operate without the challenge of noise or vibration [31].
One type of fuel cell utilised in automotive vehicles is known as the proton exchange membrane fuel cell (PEMFC). This is widely regarded as the most promising for light-duty transportation [32,35], as according to [35], PEMFCs systems have a higher power density and lower operation temperature. In PEMFCs, a solid polymer is used as an electrolyte and porous carbon electrodes are also utilised as an electrolyte, [31], as shown in Figure 2. PEMFCs are normally fuelled with pure hydrogen supplied from storage tanks. The reaction in the fuel cell produces water heat and electricity as outputs [34].
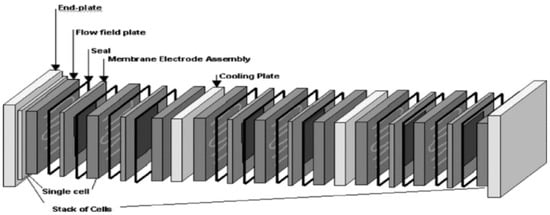
Figure 2.
Removable fuel cell stack (Source: Mehta and Cooper (2004) [35]).
Air flows through channels to the cathode on the other side of the cell. When electricity has been produced (that is, work has been done), the electrons return and react with oxygen in the air and the protons (having already moved through the membrane) at the cathode. Water is hence formed, and this exothermic reaction [32] generates heat, which can be used outside the FC.
The transportation industry is responsible for 17% of global greenhouse gas emissions every year [34]. Thus, in the development of clean energy technologies, Electric Vehicles (EVs) have been touted as an excellent option for the reduction of emissions in the transportation sector [31]. Currently, EVs are driven either by electrical energy stored in batteries or by fuel cell units. Power units in EVs are composed of two stacks, with each containing 40 fuel cells, making 80 FCs in all. There is a tank that supplies the hydrogen. Battery-driven EVs (BEVs) have the challenge of weight and recharging duration [36,37]. This limits the driving range of traditional BEVs. Fuel cell electric vehicles (FCEVs) on the other hand, are superior to those with batteries in terms of volume, mass, initial greenhouse gas reduction and refuelling time [31].
2. Remanufacturing and Industry 4.0
In the auto industry, for example, nearly all global players are producing electric vehicles (EVs) with parts which are sensor-embedded. This is expected to rise in the short term; many studies indicate that by 2020, over 11 million EVs will have been sold globally [38]. Recycling has been proposed as the end-of-life (EOL) option for parts such as EV batteries (called rechargeable energy storage systems) and fuel cells, but there are many issues that make recycling less viable. The degraded battery that is taken out of the EV, for instance, still possesses around 80% remaining capacity [39,40]. Recycling of such batteries reduces the active bulk of the batteries to material constituents, leading to the total loss of the remaining 80% of available capacity in the EV batteries [38]. There have been concerns about the economic viability of recycling [38]. For example, studies have questioned the ability of the market to absorb the enormous quantity of recycled materials, which may result in the long term in a situation where not all degraded batteries can be directly remanufactured into new batteries [40]. There is also doubt regarding attaining the purity of recovered materials and sustainability objectives of EVs [38].
Given the above issues specific to EV products, it is becoming important to seek other sustainable ways of extending the lifecycle of EV components. Remanufacturing is thus proposed primarily because it is seen as the most environmentally friendly of all of the EOL options [41] and has the strongest tradition in the auto industry [38]. As this research seeks to investigate the remanufacturing possibilities for the fuel cell, a sensor-embedded product, it is important to understanding remanufacturing within the larger context of Industry 4.0. Sensor-embedded products contains sensors that collect data from monitoring the product during its life-cycle [42]. Product life-cycle data have an important positive influence on closed-loop product life-cycle management [42]. OEMs, independent remanufacturers, third-party remanufacturers and maintenance teams all benefit from data from sensor-embedded products. These include receiving design feedback to improve upon the current design [43], independent remanufacturers accessing the data conditions of used equipment for subsequent effective remanufacturing process planning [42], and for OEMs with in-house remanufacturing units, their maintenance teams can schedule effective and exact maintenance tasks and spare parts scheduling using product life-cycle information from sensor-embedded products. The emergence of microelectromechanical systems (MEMS) technology has encouraged the manufacturing of smart sensors [42], which are used in fuel cells and rechargeable energy storage systems (RESS) in electric and hybrid vehicles. According to [44], basic smart sensors for product life-cycle data gathering will contain several essential elements. Following this, Ilgin and Gupta [45] outline these embedded elements as: (a) a sensing device that registers environmental parameters, e.g., humidity, and produces a suitable readable signal form that can be analysed; (b) a microprocessor that processes the obtained signals; (c) a memory device which stores the received sensor data and the output from the microprocessor; (d) a data transmitter which transmits the data collected by the smart sensor to the communication network; (e) a battery or alternative power supply; and (f) an ID or sensor identification.
Industry 4.0 (I4.0) refers to the 4th stage of industrialisation, which aims for a high level of automation in manufacturing [46] achieved via the adoption of ubiquitous information and communication technologies (ICTs). Coined and launched in Germany in 2011 [47], and incorporated into its national “High-Tech Strategy 2020 Action Plan” [48], I4.0 encompasses core technologies such as cyber-physical systems, cloud manufacturing, internet of things, and additive manufacturing [49]. For current manufacturing processes, the emergence of Industry 4.0 portends revolutionary opportunities and enablement towards more sustainable manufacturing. As remanufacturing is generally labour-intensive and demanding of highly experienced personnel [46], it is expected that remanufacturing of sensor-embedded products will face similar limitations. Other generic but significant challenges which affect an I4.0-remanufacturing integration include: low profit from remanufacturing [50], lack of human resources, financial challenges [51], legislation restrictions, lack of quality standards of remanufactured products, and customer perception [52].
Despite the increasing interest and social, economic and environmental benefits associated with remanufacturing, challenges associated with remanufacturing exist. In a survey of 188 remanufacturing companies undertaken by the European Remanufacturing Network in 2015 [53], several challenges faced by remanufacturing companies were underlined.
These included high labour costs, quality of feedback, lack of sales channels, lack of product knowledge, volume or availability, lack of technology and customer recognition. There is also a lack of knowledge in the assessment of remanufacturing technical and organisational processes [54]. These challenges can contribute to, among other things, long and variable remanufacturing process lead times [55]. Where large data sets are available, as in the case of fuel cells within the powertrain of hybrid and electric vehicles, it is becoming difficult to implement real-time and accurate remanufacturing on the shop-floor.
The remainder of the paper is organised as follows. Section 2 gives an overview of some terms and terminology utilised in the paper. In Section 3, the materials and methods deployed in meeting the objectives of this paper are described. Section 4 contains the analysis and discussion. In Section 5, the results are presented. The conclusions, limitations and considerations for further work form Section 6 and Section 7.
3. Overview of Terms and Terminology Important in This Research
3.1. System Dynamics Modelling and Its Application for Automotive Systems
For modelling and simulation, this study uses System Dynamics (SD). Employed for computer simulation modelling, SD is a methodology used for understanding the dynamic behaviour of complex systems in order to analyse and solve complex problems [56]. A system is described as a set of elements continuously interaction over a period of time [57], while the term dynamics refers to the situation where these systems have variables that are constantly changing. Sterman (2000) [58] states that in an SD environment, relationships and connections between the components are called the structures of the system. It is these structures that define the system’s behaviour [58]. The functional idea of SD is the perception of a system as a “coherent whole” [59] in terms of its dynamics. Thus, the SD approach allows the user to take into consideration information feedback, which exists in the modelled system, as well as describing the causal dependence of elements of the system which is being tested [59]. Discrete Event Simulation (DES) is the most popular approach for simulation of models; however, due to its “unnecessary complexity” [60] and time-consuming nature, it is not utilised in this research.
Description of the system includes the Stock and Flow Diagram (SFD); that is, according to Sterman (2000) [58], the resource accumulation and the rate of resource change in the system. In this representation, there are stocks, flows, auxiliaries and connectors. According to [61], accumulations in the system are represented as stocks and can be changed due to the action of the flows. These flows are action variables that change the stocks by increasing or decreasing their volumes. The SFD may also have clouds that may appear at the beginning or at the end of each flow; this represents the source or final destination, according to Forrester (1993) [62]. The auxiliary variables, where they exist [57], help formulate the data and define existing flow equations. Interrelations between the system components are represented by arrows or connectors, and these help form the mathematical equations [62]. The SFD also helps enable the quantitative approach of solution in system dynamics, using three possible techniques: control theory, computational simulation and statistical analysis [63]. Automotive manufacturing is extremely complex, requiring the machining, assembly and inspection of many components; hence, formulating manufacturing within an automotive system using only mathematical equations is difficult [60]. A simulation approach, containing variables and relationships, which analyses and optimises a given system structure is needed [60]. Thus, on an automotive shop-floor, simulations using SD can help in understanding the interactions and potential difficulties, allowing the evaluation of different alternatives, thus reducing the number of changes in the final system [64]. These are the reasons why SD is an appropriate method for investigating the remanufacturing process. The parameters or variables required for efficient remanufacturing are discussed in the next section.
3.2. Parameters for Remanufacturing
The parameters required to remanufacture a product can also be defined as metrics for remanufacturing [27], remanufacturing variables, or remanufacturing parameters [65]. According to [65], the parameters required for end-of-life strategies such as remanufacturing are normally obtained from a close examination of the type and function of a product during its useful life. Greater insight into the parameters for remanufacturing can be seen via another manufacturing quantity, the condition-based maintenance (CBM). CBM recommends maintenance decisions and schedules are obtained through monitoring operational data and behaviour of the machine-product while in operation, normally a sensor-embedded product. Thus, variables such as temperature, vibration analysis data, and oil analysis data that provide information on the health of the machine-product are collected and analysed.
The Table 1 gives certain parameters required by an OEM during the decision to remanufacture (modified from [66]).

Table 1.
Parameters for remanufacturing.
Traditional remanufacturing utilises parameters as itemised in Table 1. However, where the product contains embedded smart sensors, product end-of-life recovery is expected to be more data-driven than products in traditional remanufacturing. According to [42], uncertainty in the quality, quantity and frequency of product returns has been identified as one of the prevalent issues faced by remanufacturers. This issue, also highlighted in [55], has a serious impact on decision-making for product remanufacturing. While quality categorisation of product returns [70] and customer incentives to promote returns [71] have helped in addressing this issue, the presence of uncertainty in product information [42] is suggested as a reason these remanufacturing issues have lingered. The subject of embedded sensors in products, used to gather useful information, including information about remanufacturing parameters, has received considerable research interest [42].
3.3. Fuel Cells and Remanufacturing
Improving durability and reducing costs rank as the two most important challenges in the commercialisation of FCs. To serve as a viable alternative to fossil-powered systems, FC systems must be cost-competitive and perform better than or as well as conventional power technologies over the life cycle of the system. They should also have an EOL mechanism that extends the life cycle of the FC stack. As other EOL options such as recycling of FCs [38] have their limitations, remanufacturing has been proposed as an appropriate EOL option [18]. Despite the growing academic and manufacturing interest in FCs, end-of-life interest in FCs, especially remanufacturing, has received little research to date. A SCOPUS search of “remanufacture*” and “fuel cell*” revealed only 8 results. Of these 8 articles, only 2 come from journals and there have been only 4 publications on this topic since 2013. This suggests that the research area is still in its infancy. A SCOPUS search of “recycle*” and “fuel cell*”, on the other hand, yielded an initial 757 documents.
A reason for this slow uptake in fuel cell remanufacturing research is due to the many components in the fuel cell stack that have to be considered. This includes membranes, bipolar plates, catalysts and membrane-electrode assemblies, as well as the fact that an efficient FC remanufacturing must be low-cost and high-volume manufacturing process [32]. Remanufacturability of fuel cells, though, at end of life, is possible, as fuel cell stacks in FCEVs have been shown to be recoverable when they reach their end of life [72]. However, as the catalyst within the membrane degrades, the membrane would need to be replaced with the catalyst [30]. This drives up the cost for remanufacturing of FCs, and is hence a limitation for FC remanufacturing, as the stacks cannot be reused multiple times without changing the membrane.
3.4. Real-Time Efficiency in Remanufacturing
While efficiency in remanufacturing can be understood through its definition of the “final quality of the product being as new or better than a new product [73]”, efficiency in remanufacturing can also be analysed by the five dimensions of man, machine, management, material and energy, as stated in [74]. Due to the many dimensions, research on efficiency in remanufacturing has focused on individual aspects, rather than being considered as an integrated whole. Lange (2017) [73] reviewed resource efficiency in remanufacturing, Steinhilper et al. (2011) [74] investigated increasing energy efficiency by remanufacturing, while the efficiency of remanufacturing in a dynamic input–output model was studied by Dobos and Floriska (2008) [75].
4. Materials and Methods
In this section, the method utilised in identifying and itemising the data parameters required for real-time fuel cell remanufacture is presented.
4.1. Semi-Structured Interviews
To explore the data parameters for fuel-cell remanufacture, semi-structured interviews were undertaken. According to Robson (2002) [76], this type of interview method “has predetermined questions, but the order can be modified based upon the interviewer’s perception of what seems most appropriate. Question wording can be changed and explanations given; particular questions which seem appropriate with a particular interviewee can be omitted, or additional ones included”. Hence, this kind of interview offers greater room for flexibility to the interviewer and interviewee and can be administered via a face-to-face interview session or via a phone/video conferencing call session. Semi-structured interviews are exploratory, using qualitative designs and can supporting quantitative research [77].
In the choice of organisation and respondents to interview, an initial search for remanufacturing and automotive companies was undertaken using the “European Remanufacturing Network” database (www.remanufacturing.eu). This database holds case studies of 66 companies across range of 10 key industry sectors. However, the focus was on the automotive sector, so an initial pruning was performed. Emails were sent and phone calls were made to the 19 companies who had automotive sector case studies recorded in the database. Out of these 19 companies, 9 responded, and further discussions were held. Three companies eventually agreed to participate. While this number is a fraction of the initial pool of 19 possible companies, Dyer and Williams (1991) [78] argue that smaller case studies improve the capturing of greater detail regarding the context within which the problem studied exists. These selected respondents also showed a willingness to participate and share the deeper characteristics of their companies. The selected companies had ongoing collaborations with research Universities, and this was an enabling factor.
4.2. Case Companies’ Profiles
Organisational and respondent characteristics for this research are shown in Table 2. Respondents are denoted by numbers (1)–(6). The companies selected for the study are innovative and leading companies in their respective fields of digital manufacturing research, remanufacturing, and automotive manufacturing. Below are the profiles for the participating companies.
Table 2.
Variables needed for fuel-cell remanufacture.
Company A is a digital manufacturing and remanufacturing research company. It is an independent business, operating from three offices in the United Kingdom. It was formed in 2012 and is a strategic partner to the manufacturing sector, providing valuable services to government-funded programmes and private business as consultants and collaborators with academia. Their capabilities include advanced manufacturing research, virtual engineering, circular value chains, data analytics for resource efficiency, and manufacturing new technologies. Collaborators of Company A include Microcab Industries Ltd., MCT Reman Ltd., Env-Aqua Solutions Ltd. and Hydrogen London.
Company B is a UK and global leader in automotive remanufacturing and manufacturing. With over 45 years’ experience, they have served the automotive industry in OEM steering systems (manufacturing over 60,000 steering columns annually), military engineering, remanufactured steering, remanufactured hydraulics. The company is ISO 9001: 2015 certified and is a member of various remanufacturing and manufacturing networks across the world. Suppliers include JLR, Ford, Leyland Trucks, Arriva, Volvo, Textron, Caterpillar, and a host of others.
Company C is a UK-based hydrogen-powered fuel cell vehicle manufacturer. With a design studio in Spain, their business model is one which puts stakeholders, sustainability and profitability at the core of the business. Their prototype hydrogen fuel-cell car has a range of 300 miles on an 8.5 kW hydrogen fuel cell and with emissions of zero at the tailpipe (just water vapour). With an employee strength of 25, their partners include Michelin, KS composites, Sevcon, SDC Seat Design. Circular Economy is at the heart of what they do.
All companies asked to remain anonymous for this research. The respondents for the three companies were selected primarily because of their knowledge and experience in remanufacturing, sustainability and the fuel cell electric vehicles.
4.3. Data Collection
The researchers developed questions which requested respondents to give their views on the expanding parameters for data-driven remanufacturing. The data was gathered via face-to-face interviews; 2 were held at the companies’ on-site location, and the third, for Company A, was administered via WebEx video conferencing. For data collection, a two-part questionnaire was developed. Part A consisted of questions relating to the company’s experience in remanufacturing. Part B consisted of questions on existing parameters for remanufacturing, new parameters for remanufacturing sensor-enabled components such as the fuel cell in electric vehicles, their rank of importance and efficiency calculation for fuel cell remanufacturing. The questions were developed based on an extensive review of literature and several discussions among the authors, and were first tested with the respondent from Company A. This extensive evaluation of the questionnaire helped the researchers to produce a comprehensive list of questions and, based on the first feedback, produced a more objective list. After the first round of interviews, follow-up questions were sent to respondents via telephone calls and emails. This was done to ensure a thoroughness of the data collection process and to answer any criticism relating to issues of respondent numbers [12].
5. Analysis and Discussion
5.1. Pareto Analysis of (Data-Driven) Remanufacturing Variables
Respondents were asked to give their expert judgment on the variables which they view as important in remanufacturing fuel cells in EVs. As fuel cells are enclosed within a BMS, respondents were encouraged to suggest possible remanufacturing variables which they felt should be considered for remanufacturing the fuel cell. This is shown in Table 2.
Question 1: What are the variables needed for remanufacturing the fuel cell?
Table 3 gives a compilation of the data gathered from the respondents as it relates to the questions asked. It can be seen in Table 3 that there is no uniformity in terms of the variables needed to remanufacture fuel cells. This comes as no surprise, perhaps, as remanufacturing has been affirmed in literature to have no singular definition [12] due to, among other things, complexities arising from manufacturers’ internal process challenges and challenges outside the manufacturers’ borders, Hammond et al. (1996) [43] and Lundmark et al. (2009) [79]. (‘Manufacturers’ include both OEM and third-party remanufacturers). Secondly, variables that affect fuel cell remanufacturing can be grouped into three categories: (i) variables from FC stack; (ii) variables required for traditional remanufacturing; and (iii) variables relating to location of OEM, third-party remanufacturers and sustainability of the process. Thirdly, while sensors produce useful information to enable remanufacturing of fuels, expertise from traditional remanufacturing is also needed. Hence, effective remanufacturing of FCs is a collaborative effort. A Pareto analysis and chart was used to rank these variables in order to understand the most important parameters required for remanufacturing FCs. The Pareto principle [80] states that in any population that contributes to a common effect, a few account for the bulk of the effect.
Table 3.
Ranking of Parameters for Pareto Chart.
Question 2: What are the most important variables required for fuel cell remanufacture?
Respondents agreed that it was important to rank the identified variables. In total, 19 different variables were computed, as shown in Table 3. The nine (9) parameters for remanufacturing, as presented in Table 1, are grouped as “Trad reman” or traditional remanufacturing variables. From Table 3, it can be observed that there are no large deviations between the highest- and the lowest-ranked variable; the range of values is just 5. Thus, it could be argued that while efficiency demands that variables are ranked, all variables are significant for sensor-enabled remanufacturing. Based on Figure 3, the most important variables within the top 80% were compiled and described.
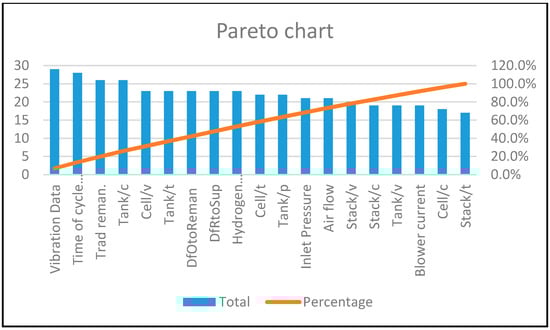
Figure 3.
Pareto chart of remanufacturing variables showing “80/20” distribution.
- Vibration data: The data collected from the sensor placed on the BMS, which collects information on the physical state of the fuel cell.
- Time of cycle run: This is the time which the fuel cell is in operation in seconds, s.
- Traditional remanufacturing: As described in Table 1, this is the parameters of variables currently employed in remanufacturing for non-sensor enabled parts, for example vehicle gearboxes.
- Tank current, Tank/c: The current values of the hydrogen tank in Amps, A.
- Cell voltage, Cell/v: The voltage of the individual fuel cells, V.
- Tank temperature, Tank/t: The temperature captured for the hydrogen tank, in degree centigrade, °C.
- Distance from OEM to 3rd party remanufacturer, DFOtoReman: The distance in kilometres, km, from the OEM to the 3rd party remanufacturer’s site.
- Distance from 3rd party remanufacturer to suppliers, DfRtoSup: The distance in kilometres, km, from the 3rd party remanufacturer to suppliers. It is assumed that there is more than one supplier.
- Hydrogen usage quantity: The quantity of hydrogen used in the fuel cell during operation. This is calculated in grams, g.
- Cell temperature: The temperature of the fuel cell, in degree centigrade, °C.
- Tank pressure, Tank/p: The pressure in Pa, of the hydrogen tank.
- Inlet pressure: The pressure in Pa, at the inlet of the hydrogen tank.
- Air flow: The air flow of the entire system measured in cubic feet per minute (CFM).
- Stack voltage: The voltage of the stack of fuel cells. It is measured in volts, V.
5.2. Dynamic Implications of Data for Remanufacturing
To map out the structure of a complex system, a Causal Loop Diagram (CLD) is used, as shown in Figure 4. In a complex system, [60], the cause and effect connections often form loops which indicate information feedback between parameters. The structure and behaviour of this system is determined by the nature of these feedback loops. The CLD is then expressed as a mathematical model after the different interactions and feedback among different variables of the elements are considered. This is then converted to computer simulations or the stock and flow diagram (SFD) [81]. Negative (−) and positive (+) polarities are assigned to the causal link on the CLD. These polarities represent the relationships between respective connected parameters. Adane and Nicolescu (2018) [60] state that these polarities also indicate how a dependent parameter changes when an independent parameter changes. The notation B and R signify a negative (or balancing) loop and a positive (or reinforcing) loop, respectively (these are feedback loops).
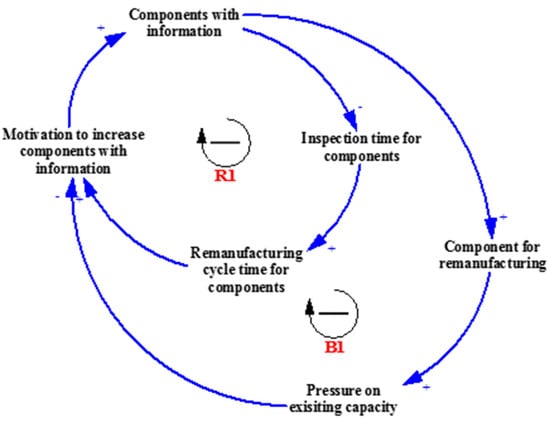
Figure 4.
CLD indicating the dynamic implications of component data on the remanufacturing system for the component.
To develop the causal loop diagram and the stock and flow diagram, we shall consider these assumptions.
- That the remanufacturing variables shall be analysed based on their process data, and not their processes.
- That, for simplicity’s sake, these data shall be analysed as “data from sensors” (for example, vibration data and stack voltage, etc.) and “data from other sources” (for example, data from traditional remanufacturing parameters).
Information about a component is needed before it can be remanufactured. Components with information do not require inspection, as their status is already known from the data about the component. Components without information need to be inspected physically before it can be determined whether to remanufacture them or not.
Two balancing feedback loops are of interest. When components with information (data) increase, the inspection time for components decreases, and the remanufacturing cycle time also decreases. When cycle time decreases, management is motivated to further increase the components with information, seeing it as a benefit to be reinforced, R1. When components with information increases, the number of components for remanufacturing also increases. This puts pressure on existing capacity, encouraging management to reduce the components with information so as not to overload the system, B1. Both feedback loops are in conflict. The CLD representing the two key feedback loops is shown in Figure 4. We proceed to draw the stock and flow diagram (SFD) based on the causal loop diagram. Figure 5 expands the CLD into an SFD. The stock and flow diagram is used to increase the understanding of the feedback and control process of a given system [81]. The intended simulation model can be used to test various policies regarding whether the company should increase data about the components to remanufacture, on the assumption that the increased availability of information about the component means that it is more likely the component can be sent for remanufacturing and vice versa. The less that is known about the component, the less likely it will be sent in for remanufacturing.
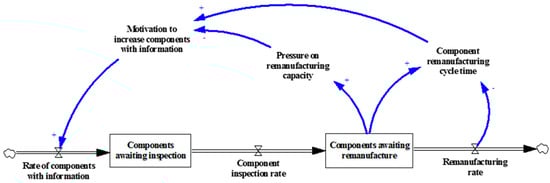
Figure 5.
SFD indicating the dynamic implications of component data on the remanufacturing system for the component.
5.3. Coding the Simulation Model
The below data are all hypothetical estimates to enable the presentation of simulation results that mirror what may occur in real life. This hypothetical data was agreed upon with the respondents; however, using more realistic data (real estimates from one of the companies) would be ideal.
- Rate of entry of components to be remanufactured = Random, between 1 and 3 h.
- Percentage of components with information = 5% (we take a pessimistic baseline situation, as if the majority of components have no information)
- Percentage of components without information (it is assumed that some components without information are also entered into the system; those that are physically inspected) = 95%.
- Inspection time per component (for those components with information) = We use triangular distribution (3, 5, 7) min. While a component may have data about it, it is important to still carry out some physical examination to confirm that it is fit for remanufacturing. This is akin to a verification inspection. We estimate a triangular distribution with min = 3 min, max = 7 min and mode = 5 min.
- Inspection time per component (for those components without information) = Triangular distribution (30, 60, 45) min is used. We estimate a triangular distribution with min = 30 min; max = 60 min and mode = 45 min.
- Remanufacturing time per component = Triangular (2, 3, 5) h. We estimate a triangular distribution with min = 2 h, maximum = 5 h and mode = 3 h.
- Remanufacturing capacity = we assume 1 set of machines.
- Percentage of components (i.e., those without information) that are not remanufactured after inspection (since it is possible that some components will be found not to be “remanufacturable” after inspecting them physically) = 70%. Hence, components that are remanufactured after they are physically inspected constitute 30% of the total.
6. Simulation Results
Running the simulation model is intended to reveal how the system will behave when components with information is increased. The ideal situation is for 100% of components to have information. Hence, there are two options worth considering:
- Continue with the current capacity, but allow the components with information to vary such that capacity is not stretched. In such a situation, when capacity utilisation is approaching a high level (say, 80%), the components with information are reduced, so as not to overburden the system. When there is slack, more components with information can be entered into the system.
- Ensure all components have information and determine (through simulation) the capacity that is needed to ensure that capacity is not overstretched or underutilised.
The simulation results are compared with those of the current status in Table 4.
Table 4.
Comparison of simulation results with current remanufacturing capacity status.
From the table above, the current capacity utilisation is low because there are not enough components entering the system (because there are not enough components with information). The system can be slightly improved by allowing the components with information to vary according to current available capacity. For an ideal situation, the capacity should be increased.
7. Conclusions
Manufacturing companies implement various strategies in order to enable the transition to a more circular economy as well as enhance the performance and efficiency of the manufacturing systems. Among various circular strategies employed, remanufacturing, which restores used products to a like-new state, offers great opportunities to recover products and their parts while adding great benefits to the economy of the localities and countries where remanufacturing activities are carried out. In addition, remanufacturing requires less effort and resources for recovery, as well a retaining part of the raw materials and added value. This has made remanufacturing particularly profitable and viable for automotive-inclined companies, as evidenced in the research. With the entry and growing influence of electric and hybrid cars which are fuel cell- and/or battery-operated, it is becoming increasingly important to understand remanufacturing of the components of the electric cars within the context of Industry 4.0. This research was based on the hypothesis that data collected via sensors on the fuel cell can contribute towards their remanufacturing. The objectives of this research were hence set to identify and rank the remanufacturing parameters for the fuel cell, as well as to understand the relationships between data and remanufacturing using a simple CLD and SFD. Six respondents were selected from three remanufacturing/remanufacturing research companies identified as case studies.
It was found that variables required in the remanufacturing of the fuel cells are inextricably linked to the kind of data producing them. For purposes of remanufacturing, it is important to sub-categorise this data in two forms, namely: data from sensors and data from other sources. Within data from sensors, it was found that the vibration data which gives information about the physical state of the product was viewed as most important by the respondents within the context of remanufacturing. While the data from sensors are important, overall, for remanufacturing, the fuel cell is more dependent on data from other sources, named, “traditional variables”. For manufacturers this finding is important, as it would mean that there is need for greater collaboration between remanufacturers of diesel engine vehicles and electric/hybrid vehicles. Within the wider economic and environmental context, this provides evidence that data is important in enabling a circular economy.
Modelling results show that when components with information (data) increase, the inspection time for components decreases, and the remanufacturing cycle time also decreases. When the number of components with information increases, the number of components for remanufacturing also goes up. This puts pressure on existing capacity, encouraging management to reduce the components with information so as not to overload the system. Furthermore, from the simulation, it is seen that the system will not be able to cope if the components with information are increased without a corresponding rise in manufacturing. This is important for manufacturers in order to ensure sustained efficiency in the system.
Finally, it was observed that the values (built around the data) are more discretely occurring than dynamic. A part comes in for remanufacturing, the data is utilised and analysed, a decision is taken to remanufacture or not, and the process is completed. As a further work, it is recommended that other modelling and simulation techniques such as discrete event simulation are deployed in the investigation of the relationship between data from sensors and remanufacturing. This may uncover other values important to the remanufacturer. The modelling and simulation in this research was completed with hypothetical data which was approved by the team of experts constituting the respondents for this study.
Limitations and Further Research
For further research, it is recommended that results from sensor-embedded products, such as the FC or RESS, be utilised as a validation procedure where the data is collected over a longer period of time. Within the established cycle time, the BMS produces data for each of the identified parameters. It is recommended that real-time figures be extracted for the FC and other sensor-enabled battery components such as the rechargeable energy storage system as a means for validation. This could further inform useful relationships between data and remanufacturing.
One limitation in this model is that the results are essentially time-driven. Thus, important issues in the decision to remanufacture, such as cost, component value and remanufacturability of the component do not feature in the model. This could be an area for future research.
Rich and detailed answers were sought during the qualitative interview, with the list of questions prepared serving as a guide. However, while all of the respondents had remanufacturing engagements outside the UK, they were all based in the UK. This may be argued to lack representation, as opposed to if the respondents had been based across different global geographical locations. It is recommended that a wider sample of respondents be utilised in further research.
Information and data sharing by manufacturers and OEMs remains a challenge in research, as original data is increasingly viewed as a competitive advantage by companies. Thus, accessing data such as data from sensors for EOL research is a limitation of this research. While investigation of data sharing and collection paradigms is outside the scope of this research, OEMs and automotive companies can be encouraged to share data for research when there are viable benefits for them to do so.
Author Contributions
This formed part of O.O.’s PhD research, hence O.O. contributed in developing the concept and structure of the paper, defined the objectives of the paper, carried out the interviews, developed the models used and made a draft of the paper. F.C. supervised the research, advised concerning the CE aspect of the research and proofread the manuscript. C.T. revised the manuscript, gave suggestions on reducing the number of pages and advised concerning choice of simulation tool. K.S. supervised the research, advised on the simulation aspects of the research, substantively revised the manuscript and gave the approval for the final version to be published.
Funding
The research was partially funded by the EPSRC, EP/P001246. The APC was funded by Cranfield University.
Acknowledgments
This research work is partially funded by the EPSRC through the Feasibility Study Research Project on ‘Circular 4.0: Digital Intelligence to Enable a Circular Economy’, EP/P001246, 2017–18. The authors are grateful to the various respondents who contributed their views in this research. The authors are grateful to Oleghe Omogbai who gave useful insights into the modelling and simulation employed in this paper.
Conflicts of Interest
The authors declare no conflict of interest.
Nomenclature
| BMS | Battery Management System |
| CLD | Causal Loop Diagram |
| CBM | Condition-Based Monitoring |
| CE | Circular Economy |
| DFOtoReman | Distance from OEM to 3rd Party Remanufacturer |
| DfRtoSup | Distance from 3rd Party Remanufacturer to Supplier |
| EOL | End-Of-Life |
| FC | Fuel Cell |
| FCEVs | Fuel Cell for Electric Vehicles |
| FCR | Fuel Cell Recovery |
| OEM | Original Equipment Manufacturer |
| I4.0 | Industry 4.0 |
| SFD | Stock and Flow Diagram |
| V | Voltage |
| Min | Minimum |
| Max | Maximum |
| Reman | Remanufacturing |
References
- Stahel, W.R. The circular economy. Nat. News 2016, 531, 435–438. [Google Scholar] [CrossRef] [PubMed]
- Potting, J.; Hekkert, M.; Worrell, E.; Hanemaaijer, A. Circular Economy: Measuring Innovation in the Product Chain; Policy Report; PBL Netherlands Environmental Assessment Agency: The Hague, The Netherlands, 2017. [Google Scholar]
- Kirchherr, J.; Reike, D.; Hekkert, M. Conceptualizing the Circular Economy: An Analysis of 114 Definitions. Resour. Conserv. Recycl. 2017, 127, 221–232. [Google Scholar] [CrossRef]
- Winans, K.; Kendall, A.; Deng, H. The history and current applications of the circular economy concept. Renew. Sustain. Energy Rev. 2017, 68, 825–833. [Google Scholar] [CrossRef]
- Reike, D.; Vermeulen, W.J.V.; Witjes, S. The circular economy: New or Refurbished as CE 3.0?—Exploring Controversies in the Conceptualization of the Circular Economy through a Focus on History and Resource Value Retention Options. Resour. Conserv. Recycl. 2017, 135, 246–264. [Google Scholar] [CrossRef]
- Hatcher, G.D.; Ijomah, W.L.; Windmill, J.F.C. Design for remanufacture: A literature review and future research needs. J. Clean. Prod. 2011, 19, 2004–2014. [Google Scholar] [CrossRef]
- Lund, R.T.; Mundial, B. Remanufacturing: The Experience of the United States and Implications for Developing Countries; The World Bank: Washington, DC, USA, 1984; p. 126. Available online: http://documents.worldbank.org/curated/en/792491468142480141/Remanufacturing-the-experience-of-the-United-States-and-implications-for-developing-countries (accessed on 12 October 2018).
- All-Party Parliamentary Sustainable Resource Group. Remanufacturing: Towards a Resource Efficient Economy. 2014, pp. 1–12. Available online: http://www.policyconnect.org.uk/apsrg/sites/site_apsrg/files/apsrg_-_remanufacturing_report.pdf (accessed on 12 October 2018).
- Adrian, C. Remanufacturing in the UK; Centre for Remanufacturing & Reuse: Aylesbury, UK, 2010. [Google Scholar]
- Hauser, W.; Lund, R. The Remanufacturing Industry: Anatomy of a Giant; Report; Boston University: Boston, MA, USA, 2008; Available online: http://www.bu.edu/reman/OrderAnatomy.htm (accessed on 12 September 2018).
- Ijomah, W.L.; McMahon, C.A.; Hammond, G.P.; Newman, S.T. Development of design for remanufacturing guidelines to support sustainable manufacturing. Robot. Comput.-Integr. Manuf. 2007, 23, 712–719. [Google Scholar] [CrossRef]
- Abdulrahman, M.D.A.; Subramanian, N.; Liu, C.; Shu, C. Viability of remanufacturing practice: A strategic decision making framework for Chinese auto-parts companies. J. Clean. Prod. 2015, 105, 311–323. [Google Scholar] [CrossRef]
- Ijomah, W.L. Addressing decision making for remanufacturing operations and design-for-remanufacture. Int. J. Sustain. Eng. 2009, 2, 91–102. [Google Scholar] [CrossRef]
- The American National Standards Institute (ANSI). Specifications for the Process of Remanufacturing; ANSI: Washington, DC, USA, 2016. [Google Scholar]
- Giuntini, R.; Gaudette, K. Remanufacturing: The next great opportunity for boosting US productivity. Bus. Horiz. 2003, 46, 41–48. [Google Scholar] [CrossRef]
- Lu, Y. Industry 4.0: A survey on technologies, applications and open research issues. J. Ind. Inf. Integr. 2017, 6, 1–10. [Google Scholar] [CrossRef]
- Subramoniam, R.; Huisingh, D.; Chinnam, R.B.; Subramoniam, S. Remanufacturing Decision-Making Framework (RDMF): Research validation using the analytical hierarchical process. J. Clean. Prod. 2013, 40, 212–220. [Google Scholar] [CrossRef]
- Okorie, O.; Turner, C.; Salonitis, K.; Charnley, F.; Moreno, M.; Tiwari, A. A Decision-Making Framework for the Implementation of Remanufacturing in Rechargeable Energy Storage System in Hybrid Vehicles. Procedia Manuf. 2018, 25, 142–153. Available online: https://www.sciencedirect.com/science/article/pii/S2351978918305870?via%3Dihub%0A%0A (accessed on 11 September 2018). [CrossRef]
- Ismail, H.N.; Zwolinski, P.; Mandil, G.; Brissaud, D. Decision Making System for Designing Products and Production Systems for Remanufacturing Activities. Procedia CIRP 2017, 61, 212–217. [Google Scholar] [CrossRef]
- Inderfurth, K.; Van Der Laan, E. Leadtime effects and policy improvement for stochastic inventory control with remanufacturing. Int. J. Prod. Econ. 2001, 71, 381–390. [Google Scholar] [CrossRef]
- Kiesmüller, G.P. A new approach for controlling a hybrid stochastic manufacturing/remanufacturing system with inventories and different leadtimes. Eur. J. Oper. Res. 2003, 147, 62–71. [Google Scholar] [CrossRef]
- Van der Laan, E.A.; Kiesmüller, G.P. An inventory model with dependent product demands and returns. Int. J. Prod. Econ. 2001, 72, 73–87. Available online: https://www.researchgate.net/publication/4916733_An_inventory_model_with_dependent_product_demands_and_returns (accessed on 12 September 2018).
- Zhou, J.; Wang, Y.; He, H.Q. An optimal ordering and recovery policy for direct reusable deterioration items. In Proceedings of the 2009 International Conference on Management Science and Engineering, Moscow, Russia, 14–16 September 2009. [Google Scholar]
- Teunter, R.H. Economic ordering quantities for recoverable item inventory systems. Nav. Res. Logist. 2001, 48, 484–495. [Google Scholar] [CrossRef]
- Georgiadis, P.; Vlachos, D.; Tagaras, G. The Impact of Product Lifecycle on Capacity Planning of Closed-Loop Supply Chains with Remanufacturing. Prod. Oper. Manag. 2009, 15, 514–527. [Google Scholar] [CrossRef]
- Kelber, R. Dynamic Inventory Management in Reverse Logistics; Springer: Berlin, Germany, 2006; Available online: https://www.springer.com/gp/book/9783540332299 (accessed on 24 August 2018).
- Bras, B.; Hammond, R. Towards Design for Remanufacturing—Metrics for Assessing Remanufacturability. In Proceedings of the 1st International Workshop on Reuse, Eindhoven, The Netherlands, 11–13 November 1996; pp. 5–22. [Google Scholar]
- Hauser, W. LRT. Remanufacturing. An American Resource. 2003. Available online: www.bu.edu/reman/RemanSlides (accessed on 30 May 2012).
- Saavedra, Y.M.B.; Barquet, A.P.B.; Rozenfeld, H.; Forcellini, F.A.; Ometto, A.R. Remanufacturing in Brazil: Case studies on the automotive sector. J. Clean. Prod. 2013, 53, 267–276. [Google Scholar] [CrossRef]
- Freiberger, S. Design for recycling and remanufacturing of fuel cells. In Proceedings of the 2005 4th International Symposium on Environmentally Conscious Design and Inverse Manufacturing, Tokyo, Japan, 12–14 December 2005; pp. 466–471. [Google Scholar] [CrossRef]
- Alaswad, A.; Baroutaji, A.; Achour, H.; Carton, J.; Al Makky, A.; Olabi, A.G. Developments in fuel cell technologies in the transport sector. Int. J. Hydrogen Energy 2015, 41, 16499–16508. [Google Scholar] [CrossRef]
- U.S. Department of Energy. Fuel Cells Fact Sheet. 2015; Volume 2. Available online: https://www.energy.gov/sites/prod/files/2015/11/f27/fcto_fuel_cells_fact_sheet.pdf (accessed on 23 August 2018).
- Ohi, J.M.; Vanderborgh, N.; Consultants, G.V.; Ahmed, S.; Kumar, R. Hydrogen Fuel Quality Specifications for Polymer Electrolyte Fuel Cells in Road Vehicles; Office of Energy Efficiency and Renewable Energy: Washington, DC, USA, 2016.
- Sharaf, O.Z.; Orhan, M.F. An overview of fuel cell technology: Fundamentals and applications. Renew. Sustain. Energy Rev. 2014, 32, 810–853. [Google Scholar] [CrossRef]
- Mehta, V.; Cooper, J.S. Review and analysis of PEM fuel cell design and manufacturing. J. Power Sources 2003, 114, 32–53. [Google Scholar] [CrossRef]
- Bendjedia, B.; Rizoug, N.; Boukhnifer, M. Influence of secondary source technologies and energy management strategies on Energy Storage System sizing for fuel cell electric vehicles. Int. J. Hydrogen Energy 2017, 43, 11614–11628. [Google Scholar] [CrossRef]
- Li, B.; Li, H.; Ma, J.; Wang, H. PEM Fuel Cells: Current Status and Challenges for Electrical Vehicle Applications. J. Automot. Saf. Energy 2010, 1, 260–290. [Google Scholar]
- Ramoni, M.O.; Zhang, H.C. End-of-life (EOL) issues and options for electric vehicle batteries. Clean Technol. Environ. Policy 2013, 15, 881–891. [Google Scholar] [CrossRef]
- Zhang, Y.; Wang, C.Y.; Tang, X. Cycling degradation of an automotive LiFePO4 lithium-ion battery. J. Power Sources 2011, 196, 1513–1520. [Google Scholar] [CrossRef]
- Wolfs, P. An economic assessment of ‘second use’ lithium-ion batteries for grid support. In Proceedings of the 20th Australasian Universities Power Engineering Conference (AUPEC), Christchurch, New Zealand, 5–8 December 2010; pp. 1–6. [Google Scholar]
- Gutowski, T.G.; Sahni, S.; Boustani, A.; Graves, S.C. Remanufacturing and energy savings. Environ. Sci. Technol. 2011, 45, 4540–4547. [Google Scholar] [CrossRef] [PubMed]
- Fang, H.C.; Ong, S.; Nee, A.Y. Use of Embedded Smart Sensors in Products to Facilitate Remanufacturing. In Handbook of Manufacturing and Engineering Technology; Nee, A.Y., Ed.; Springer: Berlin, Germany, 2014; pp. 3265–3290. Available online: https://link.springer.com/referenceworkentry/10.1007%2F978-1-4471-4670-4_85 (accessed on 24 September 2018).
- Hammond, R.; Amezquita, T.; Bras, B. Issues in the Automotive Parts Remanufacturing Industry—A Discussion of Results from Surveys Performed among Remanufacturers. Eng. Des. Autom. 1998, 4, 27–46. [Google Scholar]
- Zeid, I.; Kamarthi, S.V.; Gupta, S.M. Product take-back: Sensors-based approach. In Proceedings of the SPIE, Philadelphia, PA, USA, 26–27 October 2004; pp. 200–206. [Google Scholar] [CrossRef]
- Ilgin, M.A.; Gupta, S.M. Use of Sensor Embedded Products for End of Life Processing. In Proceedings of the 2010 Winter Simulation Conference, Baltimore, MD, USA, 5–8 December 2010. [Google Scholar]
- Yang, S.; MR, A.; Kaminski, J.; Pepin, H. Opportunities for Industry 4.0 to Support Remanufacturing. Appl. Sci. 2018, 8, 1177. [Google Scholar] [CrossRef]
- De Sousa Jabbour, A.B.L.; Jabbour, C.J.C.; Godinho Filho, M.; Roubaud, D. Industry 4.0 and the circular economy: A proposed research agenda and original roadmap for sustainable operations. Ann. Oper. Res. 2018, 270, 273–286. [Google Scholar] [CrossRef]
- Liao, Y.; Deschamps, F.; de Freitas Rocha Loures, E.; Ramos, L.F.P. Past, present and future of Industry 4.0—A systematic literature review and research agenda proposal. Int. J. Prod. Res. 2017, 55, 3609–3629. [Google Scholar] [CrossRef]
- Kang, H.S.; Lee, J.Y.; Choi, S.; Kim, H.; Park, J.H.; Son, J.Y.; Kim, B.H.; Do Noh, S. Smart manufacturing: Past research, present findings, and future directions. Int. J. Precis. Eng. Manuf. 2016, 3, 111–128. [Google Scholar] [CrossRef]
- Kapetanopoulou, P.; Tagaras, G. Drivers and obstacles of product recovery activities in the Greek industry. Int. J. Oper. Prod. Manag. 2011, 31, 148–166. [Google Scholar] [CrossRef]
- Shaharudin, M.R.; Zailani, S.; Tan, K.C. Barriers to product returns and recovery management in a developing country: Investigation using multiple methods. J. Clean. Prod. 2015, 96, 220–232. [Google Scholar] [CrossRef]
- Bhatia, M.S.; Srivastava, R.K. Analysis of external barriers to remanufacturing using grey-DEMATEL approach: An Indian perspective. Resour. Conserv. Recycl. 2018, 136, 79–87. [Google Scholar] [CrossRef]
- ERN. Remanufacturing Market Study. 2015. Available online: www.remanufacturing.eu (accessed on 23 September 2018).
- Butzer, S.; Schötz, S.; Steinhilper, R. Remanufacturing Process Assessment—A Holistic Approach. Procedia CIRP 2016, 52, 234–238. [Google Scholar] [CrossRef]
- Kurilova-Palisaitiene, J.; Sundin, E.; Poksinska, B. Remanufacturing challenges and possible lean improvements. J. Clean. Prod. 2018, 172, 3225–3236. [Google Scholar] [CrossRef]
- Poles, R. System Dynamics modelling of a production and inventory system for remanufacturing to evaluate system improvement strategies. Int. J. Prod. Econ. 2013, 144, 189–199. [Google Scholar] [CrossRef]
- Ghisolfi, V.; de Lorena Diniz Chaves, G.; Siman, R.R.; Xavier, L.H. System dynamics applied to closed loop supply chains of desktops and laptops in Brazil: A perspective for social inclusion of waste pickers. Waste Manag. 2017, 60, 14–31. [Google Scholar] [CrossRef] [PubMed]
- Sterman, J.D. Business Dynamics: Systems Thinking and Modeling for a Complex World; McGraw-Hill: New York, NY, USA, 2000. [Google Scholar]
- Stadnicka, D.; Litwin, P. Value Stream and System Dynamics Analysis—An Automotive Case Study. Procedia CIRP 2017, 62, 363–368. [Google Scholar] [CrossRef]
- Adane, T.; Nicolescu, M. Towards a Generic Framework for the Performance Evaluation of Manufacturing Strategy: An Innovative Approach. J. Manuf. Mater. Process. 2018, 2, 23. [Google Scholar] [CrossRef]
- Wang, Y.; Chang, X.; Chen, Z.; Zhong, Y.; Fan, T. Impact of subsidy policies on recycling and remanufacturing using system dynamics methodology: A case of auto parts in China. J. Clean. Prod. 2014, 74, 161–171. [Google Scholar] [CrossRef]
- Morecroft, J. Strategic Modelling and Business Dynamics: A Feedback Systems Approach; John Wiley & Sons: Cornwall, UK, 2015. [Google Scholar]
- Naim, M.M.; Towill, D.R. Establishing a framework for effective materials logistics management. Int. J. Logist. Manag. 1994, 5, 189–197. [Google Scholar] [CrossRef]
- Oyarbide, A.; Baines, T.S.; Kay, J.M.; Ladbrook, J. Manufacturing Systems Modelling Using System Dynamics: Forming a Dedicated Modelling Tool. J. Adv. Manuf. Syst. 2003, 2, 71–87. [Google Scholar] [CrossRef]
- Okorie, O.; Salonitis, K.; Charnley, F.; Moreno, M.; Turner, C.; Tiwari, A. Manufacturing Data for the Implementation of Data-Driven Remanufacturing for the Rechargeable Energy Storage System in Electric Vehicles. In Proceedings of the Smart Sustainable Technologies, Gold Coast, Australia, 24–26 June 2018. [Google Scholar]
- Yang, S.S.; Ong, S.K.; Nee, A.Y.C. Product Design for Remanufacturing. In Handbook of Manufacturing and Engineering Technology; Springer: London, UK, 2014; pp. 3195–3217. [Google Scholar]
- Nasr, N.; Thurston, M. Remanufacturing: A key enabler to sustainable product systems. In Proceedings of the 13th CIRP International Conference on Life Cycle Engineering, Brussels, Belgium, 31 May–2 June 2006; pp. 15–18. [Google Scholar]
- Marzouk, O.Y.; Dheilly, R.M.; Queneudec, M. Eco-Efficiency, Asset Recovery and Remanufacturing. Waste Manag. 2007, 27, 310–318. [Google Scholar] [CrossRef] [PubMed]
- Shu, L.H.; Flowers, W.C. Reliability Modeling in Design for Remanufacture. J. Mech. Des. 1998, 120, 620–627. [Google Scholar] [CrossRef]
- Aras, N.; Boyaci, T.; Verter, V. The effect of categorizing returned products in remanufacturing. IIE Trans. 2004, 36, 319–331. [Google Scholar] [CrossRef]
- Liang, Y.; Pokharel, S.; Lim, G.H. Pricing used products for remanufacturing. Eur. J. Oper. Res. 2009, 193, 390–395. [Google Scholar] [CrossRef]
- Dhanushkodi, S.R.; Mahinpey, N.; Srinivasan, A.; Wilson, M. Life cycle analysis of fuel cell technology. J. Environ. Inform. 2008, 11, 36–44. [Google Scholar] [CrossRef]
- Lange, U. Resource Efficiency through Remanufacturing; VDI ZRE Publications: Berlin, Germany, 2017. [Google Scholar]
- Steinhilper, R.; Slawik, S.; Pentzlin, F.; Boehner, J. Increasing energy efficiency by remanufacturing and reengineering. In Design for Innovative Value towards a Sustainable Society; Springer: Dordrecht, The Netherlands, 2011. [Google Scholar]
- Dobos, I.; Floriska, A. The efficiency of remanufacturing in a dynamic input-output model. Cent. Eur. J. Oper. Res. 2008, 16, 317–328. [Google Scholar] [CrossRef]
- Robson, C. Real World Research: A Resource for Social Scientists and Practitioner-Researchers, 2nd ed.; Blackwell Publishing: Hoboken, NJ, USA, 2002. [Google Scholar]
- King, N. The Qualitative Research Interview. In Qualitative Methods in Organizational Research: A Practical Guide; Cassel, C., Symon, G., Eds.; Sage Publications: London, UK, 1994; p. 253. [Google Scholar]
- Dyer, W.G.; Wilkins, A.L. Better Stories, Not Better Constructs, To Generate Better Theory: A Rejoinder to Eisenhardt. Acad. Manag. Rev. 1991, 16, 613–619. [Google Scholar] [CrossRef]
- Lundmark, P.; Sundin, E.; Bj€orkman, M. Industrial challenges within the remanufacturing system. In Proceedings of the Swedish Production Symposium, Goteborg, Sweden, 2–3 December 2009; pp. 132–138. [Google Scholar]
- Kramp, K.H.; van Det, M.J.; Veeger, N.J.G.M.; Pierie, J.E.N. The Pareto Analysis for Establishing Content Criteria in Surgical Training. J. Surg. Educ. 2016, 73, 892–901. [Google Scholar] [CrossRef] [PubMed]
- Asif, F.M.A.; Rashid, A.; Bianchi, C.; Nicolescu, C.M. System dynamics models for decision making in product multiple lifecycles. Resour. Conserv. Recycl. 2015, 101, 20–33. [Google Scholar] [CrossRef]
© 2018 by the author. Licensee MDPI, Basel, Switzerland. This article is an open access article distributed under the terms and conditions of the Creative Commons Attribution (CC BY) license (http://creativecommons.org/licenses/by/4.0/).