Article

Investigation on Product and Process Fingerprints for Integrated Quality Assurance in Injection Molding of Microstructured Biochips

Department of Mechanical Engineering, Technical University of Denmark, Produktionstorvet, Building 427A, DK-2800 Kgs. Lyngby, Denmark
*
Author to whom correspondence should be addressed.
J. Manuf. Mater. Process. 2018, 2(4), 79; https://doi.org/10.3390/jmmp2040079
Submission received: 8 October 2018 / Revised: 6 November 2018 / Accepted: 12 November 2018 / Published: 15 November 2018
(This article belongs to the Special Issue Anniversary Feature Papers)

Abstract

:
Injection molding has been increasing for decades its share in the production of polymer components, in comparison to other manufacturing processes, as it can assure a cost-efficient production while maintaining short cycle times. In any production line, the stability of the process and the quality of the produced components is ensured by frequently performed metrological controls, which require a significant amount of effort and resources. To avoid the expensive effect of an out of tolerance production, an alternative method to intensive metrology efforts to process stability and part quality monitoring is presented in this article. The proposed method is based on the extraction of process and product fingerprints from the process regulating signals and the replication quality of dedicated features positioned on the injection molded component, respectively. The features used for this purpose are placed on the runner of the moldings and are similar or equal to those actually in the part, in order to assess the quality of the produced plastic parts. For the purpose of studying the method’s viability, a study case based on the production of polymer microfluidic systems for bio-analytics medical applications was selected. A statistically designed experiment was utilized in order to assess the sensitivity of the polymer biochip’s micro features (μ-pillars) replication fidelity with respect to the experimental treatments. The main effects of the process parameters revealed that the effects of process variation were dependent on the position of the μ-pillars. Results showed that a number of process fingerprints follow the same trends as the replication fidelity of the on-part μ-pillars. Instead, only one of the two on-runner μ-pillar position measurands can effectively serve as product fingerprints. Thus, the method can be the foundation for the development of a fast part quality monitoring system with the potential to decrease the use of off-line, time-consuming detailed metrology for part and tool approval, provided that the fingerprints are specifically designed and selected.

1. Introduction

In the last decades, the development of new technology, legislation, and customer needs have influenced a change in the functional requirements and design of complex parts, while keeping the focus on high volume mass production processes that maintain a cost-efficient production for many applications. Such applications originate in the automotive, electronics, communication, and medical industries, as well as in micro manufacturing [1,2]. A process that can maintain a cost-effective production with short cycle times is injection molding. Injection molding is continuously gaining market share in the production of cost effective products, accounting for 50% of the produced plastic parts [3], in comparison to other manufacturing processes.
In a plethora of industrial sectors, and particularly in the medical sector where biomedical and drug delivery devices are concerned, applications with integrated μ-features, such as μ-pumps and μ-measuring devices for the precise handling and administration of drugs, dictate the need for tight tolerances in order to satisfy the functional requirements of the product [4]. Such functional requirements are challenging to fulfil for all the injection-molded components in a high-volume production. They require a stable process with frequent metrological inspections in order to ensure process stability and high part quality. Metrological studies though require a significant amount of time in comparison to the cycle time of injection molding, which is often in the order of few seconds. Due to the high costs involved, especially in the cases of micro molding equipment and micro tools for μ-applications or applications with μ-features, process monitoring is an attractive research subject. The main objective is the monitoring of the process for the occurrence of defects and quality assurance of the molded parts, since an out of tolerance production can lead to an inefficient production line with high costs and scrap rate.
The current paper presents an alternative approach to continuous or statistical monitoring and part quality control, by proposing indexes that serve as part quality indicators (QI) (i.e., “product and process fingerprint”) based both on process and product data.
The presented approach is developed in two parallel tracks. Firstly, the “product fingerprint” track which considers the use of dedicated μ-features positioned on the runner of the component that are equal or similar in size and shape to the features on the part [5]. The two sides of the microfluidic system are used as a study case. The μ-pillars positioned on the microfluidic system are designed as functional micro features [6] that direct the flow of the liquid and inhibit the formation of air bubbles. As functional features, their replication fidelity is of high importance for the overall quality and acceptance of the microfluidic component. The correlation of the features’ replication on the runner to the ones in the part is going to be explored. Current research presents numerous examples of part features in use for fast part quality inspection. Two prominent examples are the use of weld line position to assess the quality of the molded part as described by Tosello et al. [7], and the use of nano-features placed on different areas of a component that provide the necessary indicators for fast part quality assessment as discussed by Calaon et al. [8]. However, in both those cases the μ-features are positioned in the cavity.
The “process fingerprint” track investigates the suitability of the transient time-resolved process data originating from the injection molding machine control sensors, for process monitoring and consequently part quality control. A number of researchers in the field of sensor technology have studied different approaches to develop methods of process control, an optimization that could shorten the duration of metrological investigations for the approval of injection-molded components. Promising results are shown in studies where in-mold sensors are used for process regulation and monitoring, though the placement of sensors involves higher tooling costs [9,10,11,12,13]. Chen et al. [14] have proved that part weight and thickness can be reliably monitored with the use of a linear variable differential transformer (LVDT) monitoring the mold separation (MS) distance. Instead Gao et al. [12] have developed a custom multivariate sensor (MVS) in order to monitor the quality on the injection-molded parts based on the hypothesis that part quality indicators (dimensions) can be tightly controlled and the in-mold process parameters are already known.
Further studies are using data from external sensors placed on the mold or in-line measuring equipment to monitor and optimize the process considering the component’s functional requirements. An online multivariate optimization system for the optimization and control of the process has been developed by Johnston et al. [15], while Yang et al. [16] have detected defects in the process with the use of an in-line digital image processing method. Consequently, for the detection of a defect, the software feeds data to a process optimization algorithm built on a model-free optimization (MFO) procedure. Other approaches involve the use of numerical simulation procedures for the monitoring and optimization of the process, such as the work on dynamic injection molding and sequential optimization of warpage based on the Kriging surrogate model, presented by Wang et al. [3], and the application of artificial neural networks (ANNs) and genetic algorithms as discussed by Ozcelik et al. [17].
Most of the approaches discussed in literature focus on tightly controlled and optimized processes, with the dimensional control of the injection-molded components to be indirectly considered. However, the main target of any quality control system is the quality of the final product, and thus coupling the replication fidelity of the parts to the sensor data is a requirement.
The current paper presents an alternative approach based on process and product fingerprints. The remainder of the article is structured as follows: in Section 2 the experimental setup and methods are presented; in Section 3 the results are discussed; in Section 4 a summary of the article and conclusive remarks are given. The extraction of both process and product fingerprints is discussed with the selection of the most suitable “fingerprints” to be completed.

2. Experimental Setup and Methods

2.1. Molding Tool Geometry

The experimental setup was designed in a way that accommodates both research tracks related to the process and product fingerprints. To proceed with the approach of product fingerprint and in order to access the quality of on-part micro features in correlation with on-runner μ-pillar features, specifically developed tool inserts for the production of a biochip were manufactured. The mold used was a two-cavity mold as seen in Figure 1 and the manufactured geometry consisted of the two sides of a bio-fluidic microchip for drug testing. The biochip had the form of a 20 × 20 × 2 mm plate with on-part conical μ-pillar features with 600 μm nominal height, Ø250 μm base diameter, and Ø200 μm top diameter [6] as seen in Figure 2. The tool inserts were manufactured to accommodate pillar μ-features on the runner equal to those on the part, as it can be seen in Figure 3.
Figure 3 illustrates the geometry of the molded plastic parts and presents the positions of interest; PP1 close to the gate, PP2 in the middle of the parts, PP3 far from the gate and RP2 on the runner of the molding for both cavities. The pillars in the illustrated positions are used to assess the replication quality of the molded components for all treatment combinations in the experiments as presented in the following section of the paper. Figure 4 presents an example of the physical molded components.

2.2. Injection Molding Process and Experimental Conditions

The proposed product and process fingerprint concept is built on the hypothesis that the quality of the on part μ-features is correlated to the on runner μ-features and other quality indicators originated from process signals as is discussed in Section 2.4 and Section 2.5. The concept requires an experimental validation to confirm the hypothesis of the micro features and extracted indices suitable to be used as quality indicators. The experiments were performed on an electric Arburg 370A injection-molding machine (Arburg GmbH + Co KG, Lossburg, Germany), with a hydraulically actuated clamping unit capable of a maximum clamping force of 600 kN and a screw whose diameter was Ø18 mm. A statistically designed 24 × 3 full factorial experiment was utilized in order to investigate the experimental process window. The parameters under consideration are: Tmelt (Tm) [°C], Tmould (Tmld) [°C], Injection Speed (InjSp) [mm/s] and Packing Pressure (PackPr) [bar] that, as from well-established research [18] and preliminary screening experiments are known to be the most significant parameters affecting the quality of injection molded components and surface replication. Table 1 presents the experimental treatments. The process parameter levels were selected by assessing the specification of the material (Figure 5), a commercial grade of acrylonitrile butadiene styrene (ABS, Styrolution Terluran GP-35, INEOS Styrolution GmbH, Frankfurt am Main, Germany), which is characterized by a relatively large processing window. Other parameters such as packing (tpack = 10 s) and cooling times (tcool = tpack + 10 s) were set on levels high enough to avoid their influence on the responses of the experiment.
For every experimental treatment, the initial 20-molded parts from the start of the process were discarded, as the process was running to reach stability. Then the following 10 parts were collected for assessment and the three sample parts were measured (denoted as: part 1, part 5, part 10) for the assessment of the μ-pillars’ replication quality and then placed both on the parts and on the runners. The sequence followed and the experiment is illustrated in Figure 6.

2.3. Pillar Dimensional Measurement and Uncertainty Evaluation Procedure

The pillar height dimensional measurements were carried out by using a focus variation microscope (Alicona Infinite Focus from Alicona Imaging GmbH, Raaba, Austria). The focus variation method is suitable for the scanning of the 3D topologies as it can effectively acquire scans of features with high slopes. A full scan of the μ-pillars though, proved to be challenging due to the almost vertical slopes (88°) of the μ-pillars. The settings used for the measurements are presented in Table 2.
For the assessment of the process’ stability, the effect of process parameter changes and the replication fidelity of the pillar μ-features for each experimental treatment, three pillars in each position were scanned to measure the μ-pillar height. The middle pillars in positions PP2 and RP2 of both cavities were measured five times in order to determine the repeatability of the measurements (standard deviation in the range of 0.1–0.2 μm was achieved) and provide sufficient data for measurement uncertainty calculations (see Section 3.1). The measurement data sets were consequently processed with the use of scanning probe image processing software (SPIP V6.4.1 by Image Metrology A/S, Hørsholm, Denmark) to extract the μ-pillar height from each scan. In SPIP, a procedure was developed to process the scans and prepare the files for pillar height calculations following the same steps for all four positions of interest by correcting the 1st order tilt in the scan as well as to set the zero background for all data-points as illustrated in Figure 7.
The average pillar height was calculated with the use of four profiles that intersected the center of the pillars with the procedure utilized to scan of both mold and molded parts in order to calculate the height and height deviation (mold-part) as a measure of the molded features replication fidelity.
To verify the quality of measurements and procedures an uncertainty evaluation was conducted. The evaluated expanded uncertainty U is a parameter associated with the measurement results and describes the data dispersion always in connection to the respective measurand. The estimation of the uncertainty and its inclusion in the replication fidelity assessment of the micro features is of great importance as the measurement repeatability and instrument accuracy can be of similar magnitude. The uncertainty budget of the measurements of the pillar heights on the parts and the respective cavity features on the mold insert were estimated based on the ISO 15530-3 (Equations (1)–(4)) [20]. The method was developed for measurements conducted with a tactile coordinate measuring machine (CMM); however, it can be adapted and applied for optical measurements [21] using Equation (4).
The expanded uncertainty was calculated with a coverage factor k = 2 to achieve a confidence level of 95%, and four uncertainty contributors were considered (Table 3) (see Equations (1)–(3)). Such uncertainty contributors are ucal which is the standard uncertainty as evaluated from a calibrated step height artefact to have traceable measurements, ub which is the standard uncertainty associated with the systematic error (b) of the measurement process, which is the measuring instrument bias. Thirdly, the uth is the standard uncertainty associated with the systematic error of the measurement process based on the heat expansion coefficient deviations of the material, since the measurements were not conducted at the reference temperature, and lastly up is the uncertainty associated with the manufacturing variation from either mold or parts (upmould and uppart), which is calculated using a square distribution in the modified ISO 15530-3 (Equation (4)). The measurement on individual pillars, features, and different molded parts are all affected by instrument repeatability. Thus, for uppart the maximum value of uncertainty contributor related to instrument and process is considered in order to avoid underestimating the uncertainty. These contributors are part of uppart, where: uppillar is the standard deviation of five repeated measurements on the same pillar; upfeatures, the standard deviation of repeated measurements on four different pillar areas to estimate feature repeatability in terms of polymer replication and upsample the standard deviation of repeated measurements on 3 different samples on four different pillar area. The uncertainty contributors are used to calculate the uncertainty of the mold (Equation (1)) and part pillar (Equation (2)) measurements, as well as the deviation uncertainty (Equation (3)). The values of the specific uncertainties per position and experimental runs are provided in Table 4 and Table 5, respectively. Table 5 provides information on the expanded uncertainty for pillar height and height deviation measurements per run.
U part = k × u cal 2 + u b 2 + u th 2 + u ppart 2
U mould = k × u cal 2 + u b 2 + u th 2 + u pmould 2
U dev = U mould 2 + U part 2
|   u p i = data max data min 2 3 ,   i = pillar , feature , sample   for   part   or   mold
|   u ppart = max ( u ppillar ,   u pfeature ,   u psample )

2.4. Product Fingerprint as Quality Indicator

The concept uses the microfluidic system described in Section 1 as a case study. It is of particular interest as it builds upon past studies that used nano features (fingerprint) on the part, where a close correlation of the fingerprint on the part to the overall quality of the component was revealed [8].
The current paper considers the use of dedicated μ-features positioned on the runner of the molding that are equal or similar in size and shape to the features on the part [5]. The μ-pillars on the runner can be used as a product fingerprint as they can be quickly measured with an in-line process set up, separated from the main component and directly correlated to the overall part quality.

2.5. Process Fingerprint as Quality Indicators

Similar to product fingerprint a set of indices is proposed to serve as QIs in order to represent the quality of the molding components with data from machine signals. Two type of QIs were considered: the first type was calculated based on the deviation of consequent signals and the second was calculated as single values per signal.
The individual QIs belonging to the first type are presented in the following sections. They were error of alignment, integrated squared error, cross correlation, shift error, and dynamic time warping. The same quality indicators were also computed for the cross-correlated signals.

2.5.1. Work of Error and Integrated Squared Error

The controller of the injection-molding machine records the injection speed and the pressure time resolved transient data during the process for every consecutive cycle. In theory, the controller and the responses of an optimized process should be the same; however, in real world conditions, the machine’s controller, the components of the machine, and the material can have different behavior. For example, all operations include a level of uncertainty and interference from external conditions. As such, the recorded signals in every consequent cycle of the process can deviate from the reference cycle. This deviation describes the alignment error from each consequent cycle signal to the reference signal by Equation (6).
ε ( t ) = y 0 ( t ) y i ( t )
Er work = ε ( t ) dt
ISE = ε ( t ) 2 dt
where: ε(t) the alignment error for time instance t, y0 the reference signal, yi any cycle signal, and i = 1, 2, …, N cycles.
The alignment error, though computed by Equation (6), is still a time series that consists of the amplitude difference of two signals for the time instances t, where t = 0, 1, 2, …, 11 s. However, although the ε(t) time resolved data contain valuable information, it is challenging to use. As such, the work of error (Erwork) and the integrated squared error (ISE) [22] as described in Equations (7) and (8), respectively, are used to extract the information as one single value for every signal associated with the deviation of each processing cycle with respect to the reference cycle. The performance of the alignment error and the ISE as a quality indicator in consequence will be discussed in a following section of the paper.

2.5.2. Shift Error

Another quality indicator is the “Shift error” or “Shift” that originates from the cross correlation of the input signals to the reference signal in every DOE run in the conducted experiment. Cross correlation in discrete time series/signals y0(t) and yi(t) is described by Equation (9) [23].
Shift y 0 , y i ( l ) = t = y 0 ( t ) y i ( t l )
where l is the lag of signal yi (i = 1, 2, …, N) in association to the reference signal y0. Cross-correlation measures the similarity between a reference y0 and shifted (lagged) copies of y as a function of the lag as illustrated in Figure 8. The “Shift” error can be used as a QI and will be discussed further in Section 3.3.1. An example of cross correlation alignment from experimental Run 1 is provided in Figure 9.

2.5.3. Work Deviation

The work deviation of any consequent signal to the reference one as described in Equation (10), is an alternative QI that is used to describe similarity of any signal to the reference. A graphical representation of “WorkDev” is provided in Figure 10.
WorkDev = W 0 W i = y 0 ( t ) dt y i ( t ) dt
where: i = 1, 2, 3, …, N cycles.
The compatibility of the “WorkDev” QI will be discussed in Section 3.3.1 and compared with the previously introduced QIs and the dynamic time warping (see next section).

2.5.4. Dynamic Time Warping

Dynamic time warping (DTW) is an algorithm that has found use in applications such as acoustics and seismic motion fields, where the alignment of a pair of time series or sequences is required [24]. The algorithm considers time series data of unequal size and it is used to compute the warping distance between two different time series or signals. The warping distance of vectors yi to the reference vector y0 is defined as the minimum distance from the beginning of the DTW table to the current position (k, j). Based on the dynamic programming (DP) algorithm [25] the DTW table can be calculated as follows [26] in Equation (11):
WarpDis :   D ( k , j ) = d ( k , j ) + min { D ( k 1 , j ) D ( k , j 1 ) D ( k 1 , j 1 )
where D(i, j) is the node cost connected to points yi(k) and y0(j) of the input and reference signals y0 and yi and is calculated with the use of L2-norm in Equation (12).
d ( k , j ) = ( y i ( k ) y 0 ( j ) ) 2
The warping distance (“WarpDis”) is the minimum Euclidean distance in the warping DTW table.
For the purposes of this work, the single dimension DTW algorithm was used to align each consecutive signal to a reference signal. The algorithm stretches the two vectors y0 and yi, onto a common set of instances such that the warping distance “WarpDis”, the sum of Euclidean distances between corresponding points yi(k) and y0(j), is minimized. To properly match the input and reference signals, the algorithm repeats each element of vectors yi and y0 as many times as necessary resulting in two signals yi* and y0* of equal size, as illustrated in Figure 11. As such, the warping distance “WarpDis” can be used as a QI.
To ensure the validity of the previously introduced QIs, the QI values were not directly comparable to the dimensional measurements of the micro-feature on the collected samples, and the data were standardized using Equation (12).
Zscore = x μ σ
where, “x” is the xth observation, “μ” the mean value of all observations, and “σ” the standard deviation of all observations per treatment.
Apart from the “process fingerprint” candidates originated from the deviation of both the transient injection pressure and injection speed signals to the respective reference signals, two more “process fingerprint” candidates were calculated from each signal. Those candidates belong to the second type of quality indicators and were the signal integrals and signal powers as described below.

2.5.5. Signal Integral

The signal integral “Ix” is calculated with Equation (14) and of the time resolved data from the whole signal y(t) recorded starting at the injection phase (t0 = 0 s), till the end of the packing phase (tn = 11 s). The integral is related to the energy stored in the system and can differ on the measured quantity. When the integral is calculated from the pressure signals, it provides the approximate value of energy stored in the polymer from the melting, compression, and injection of the molten polymer in the cavity.
I x = 0 T y ( t ) dt
T: end time of signal during (time = 11 s).

2.5.6. Signal Power

The power of a signal x, “SPx” is given as the sum of the absolute squares of the time-domain samples of the signals divided by the signal length. Similar to the integral, signal power relates to the energy of the system for all the recorded frequencies of the signal.
SP x = lim T 1 T 0 T | y ( t ) | 2 dt
T: end time of signal during (time = 11 s).

3. Results and Discussion

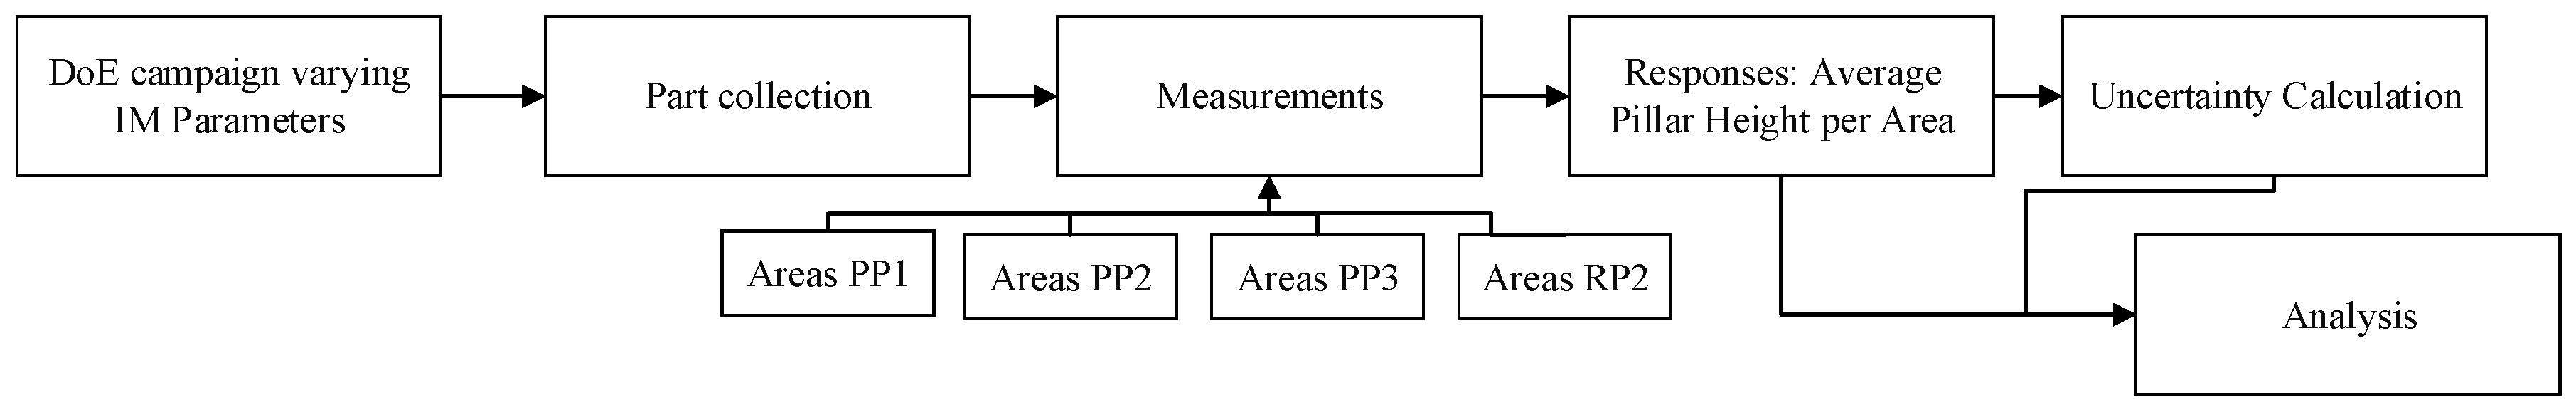
3.1. Dimensional Measurements and Uncertainty Calculation

As stated in 
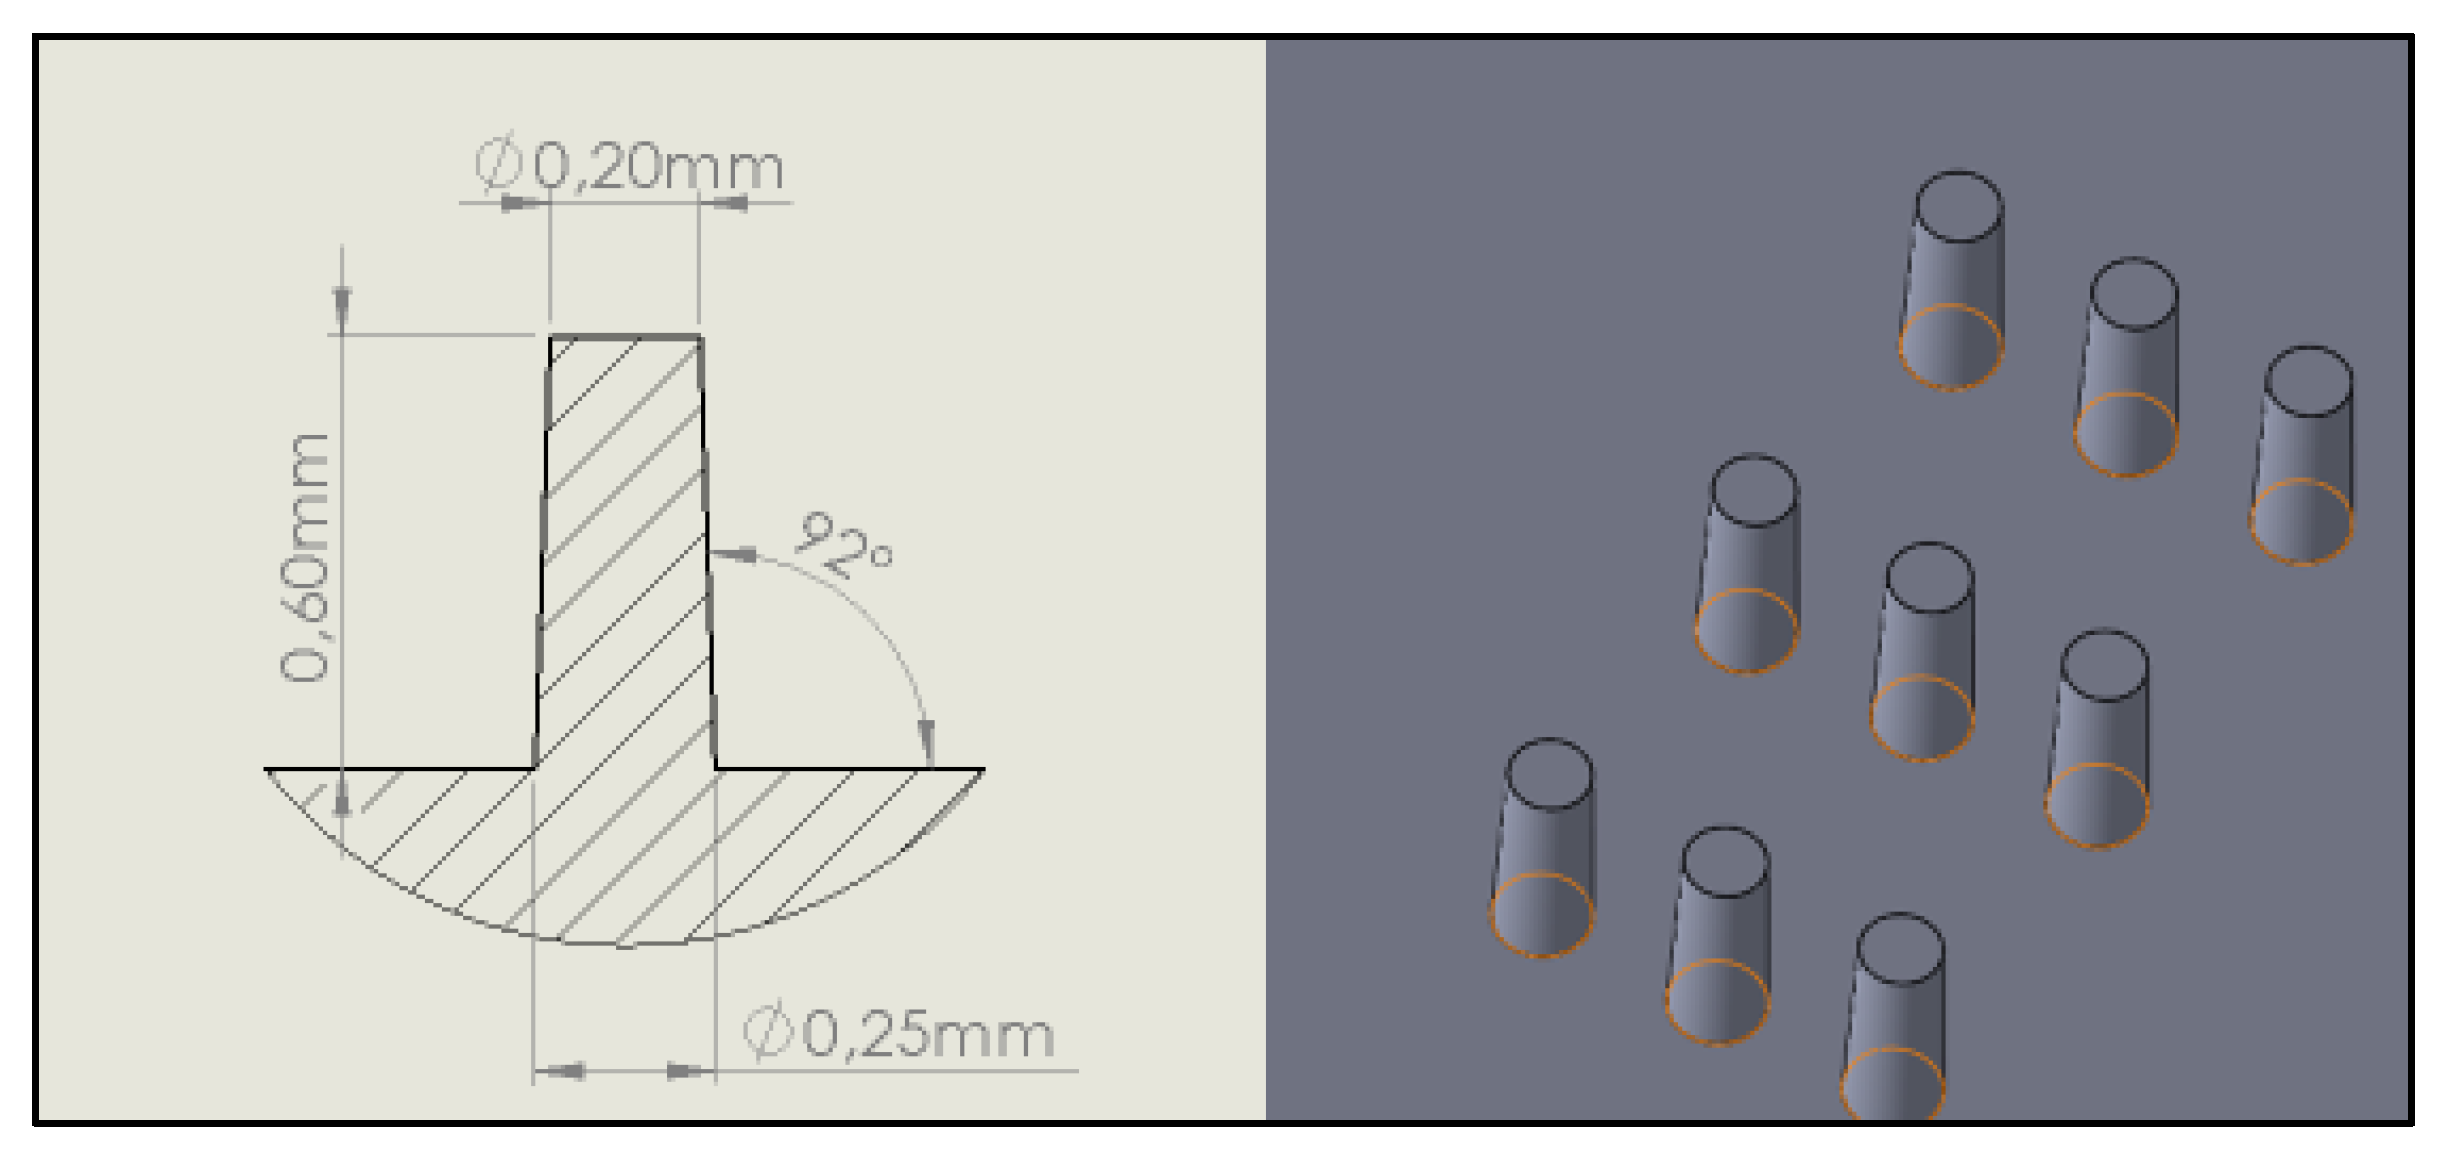
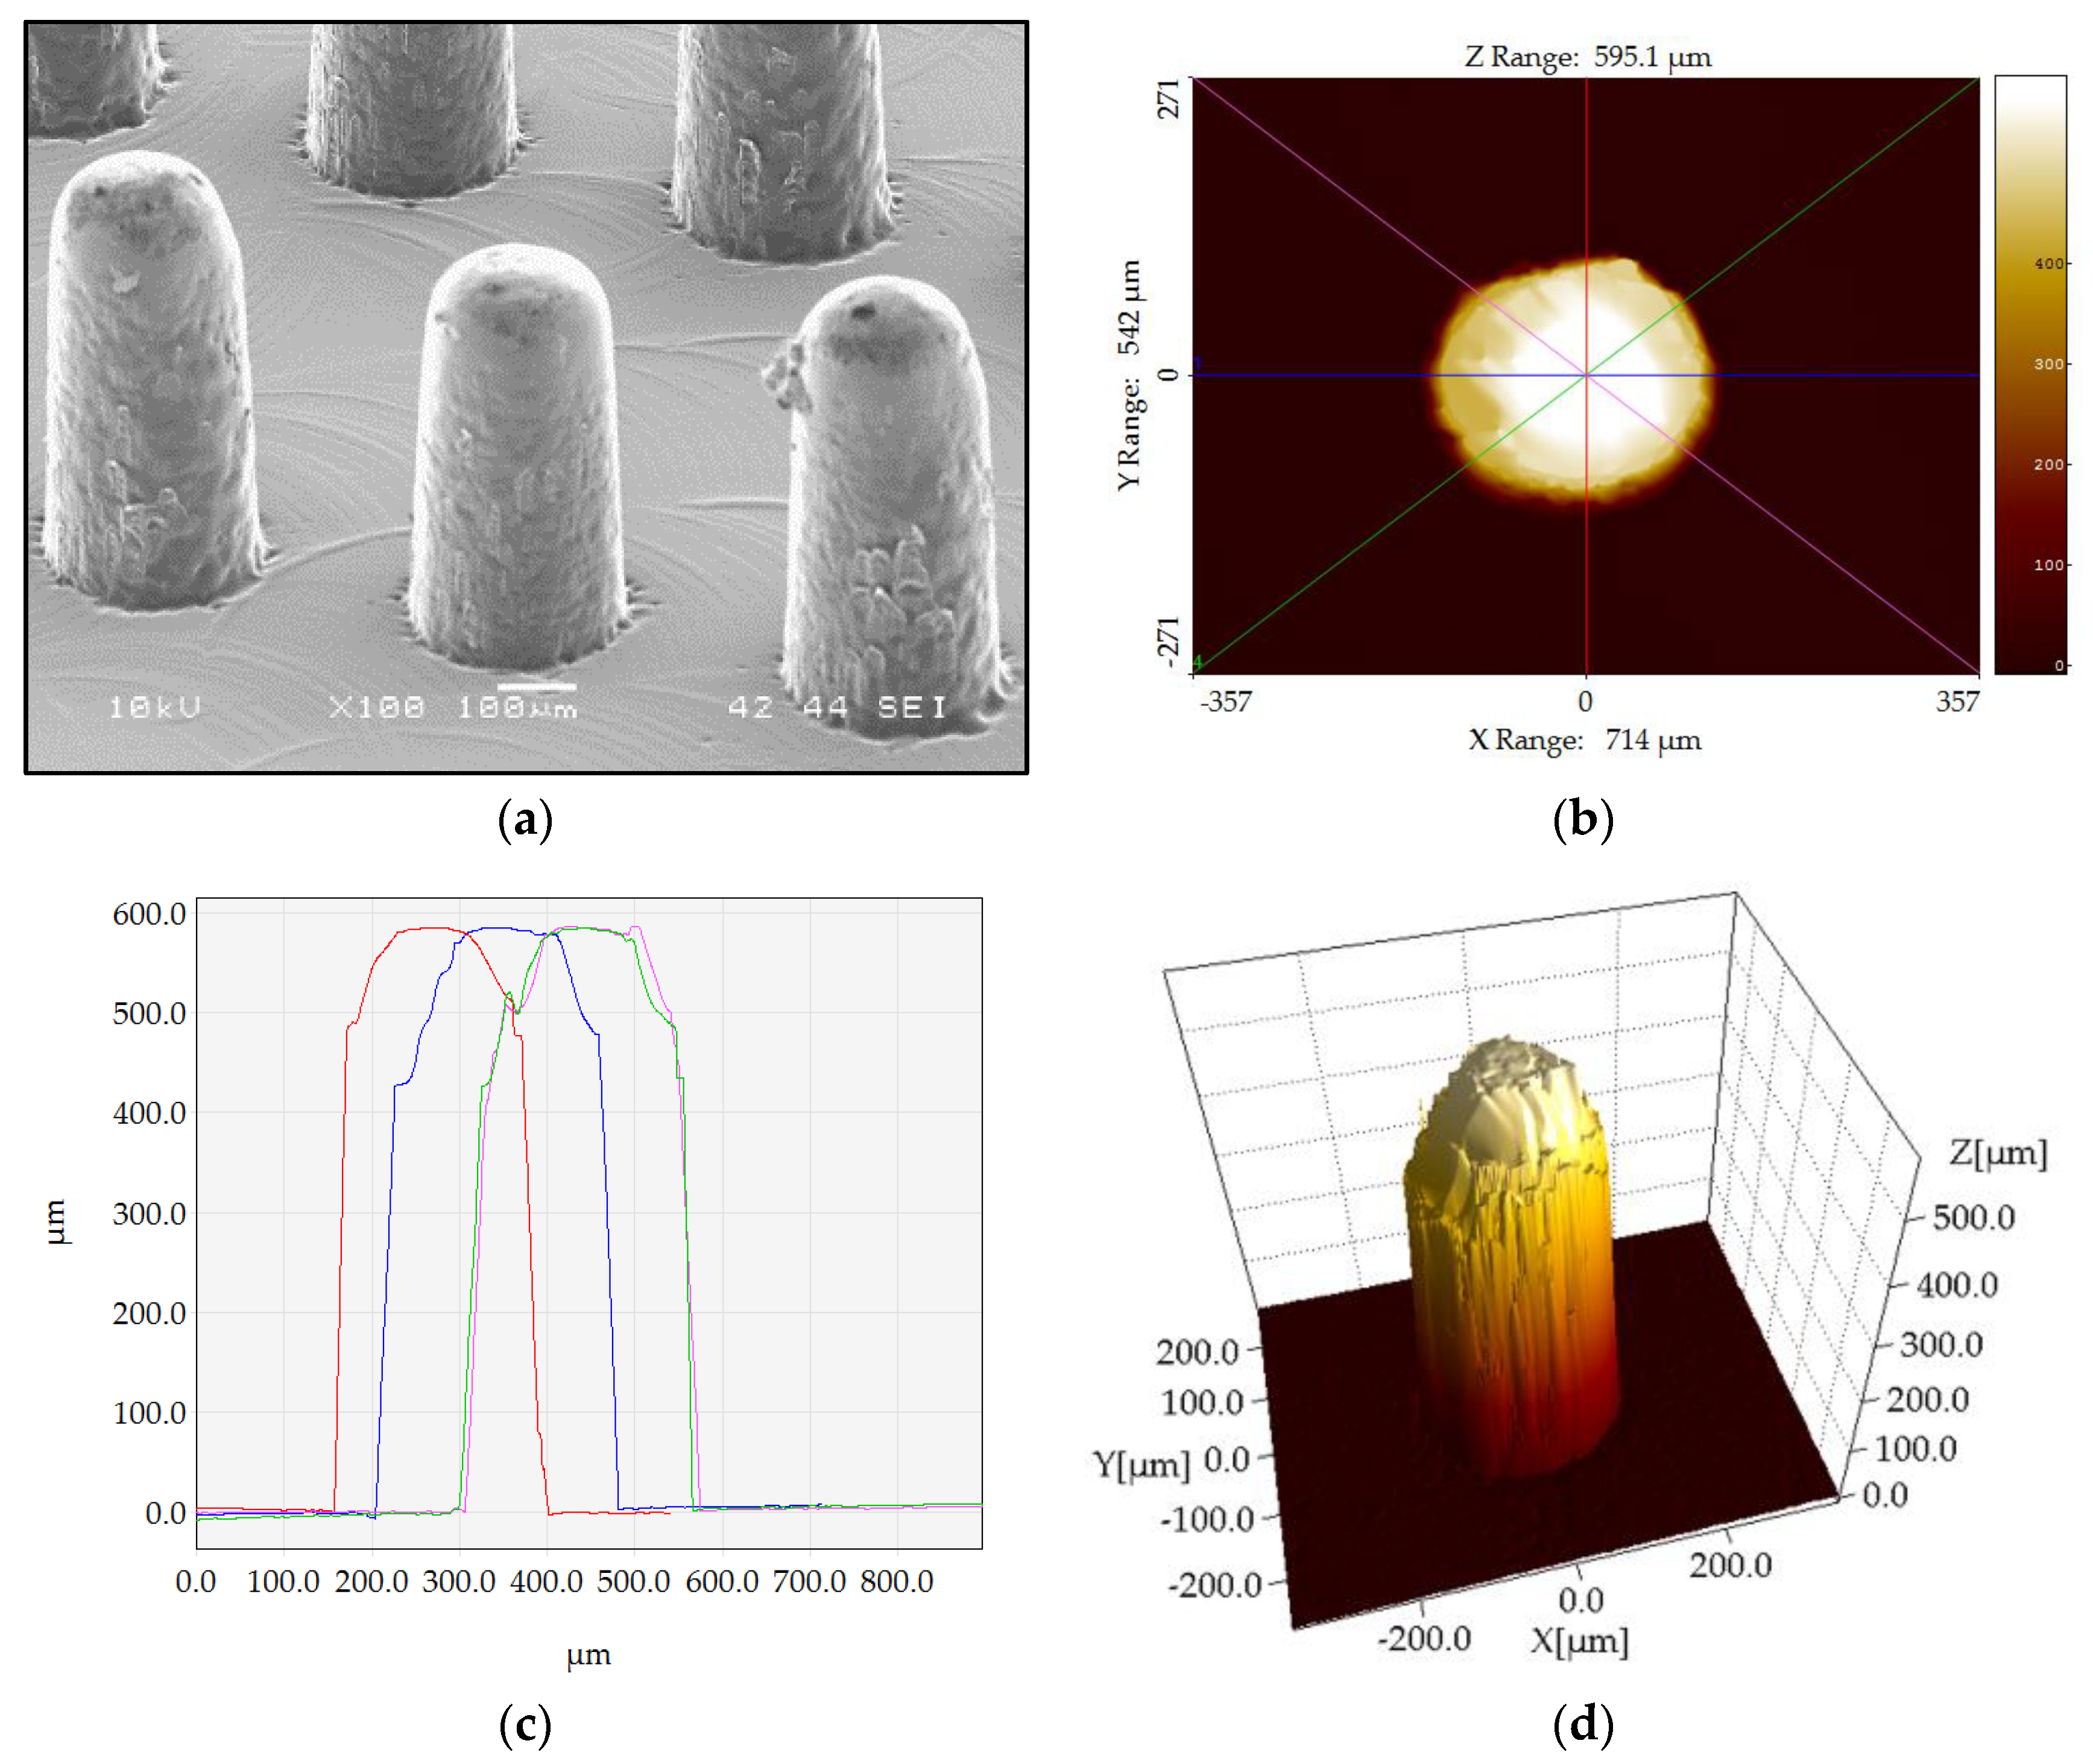
Section 2.3, three collected parts for each experimental run were examined. In order to assess the quality of the parts and of the three pillars per measurement position, as illustrated in Figure 3, they were examined to provide data for the replication fidelity of the pillars in each area of the parts and the stability of the process.
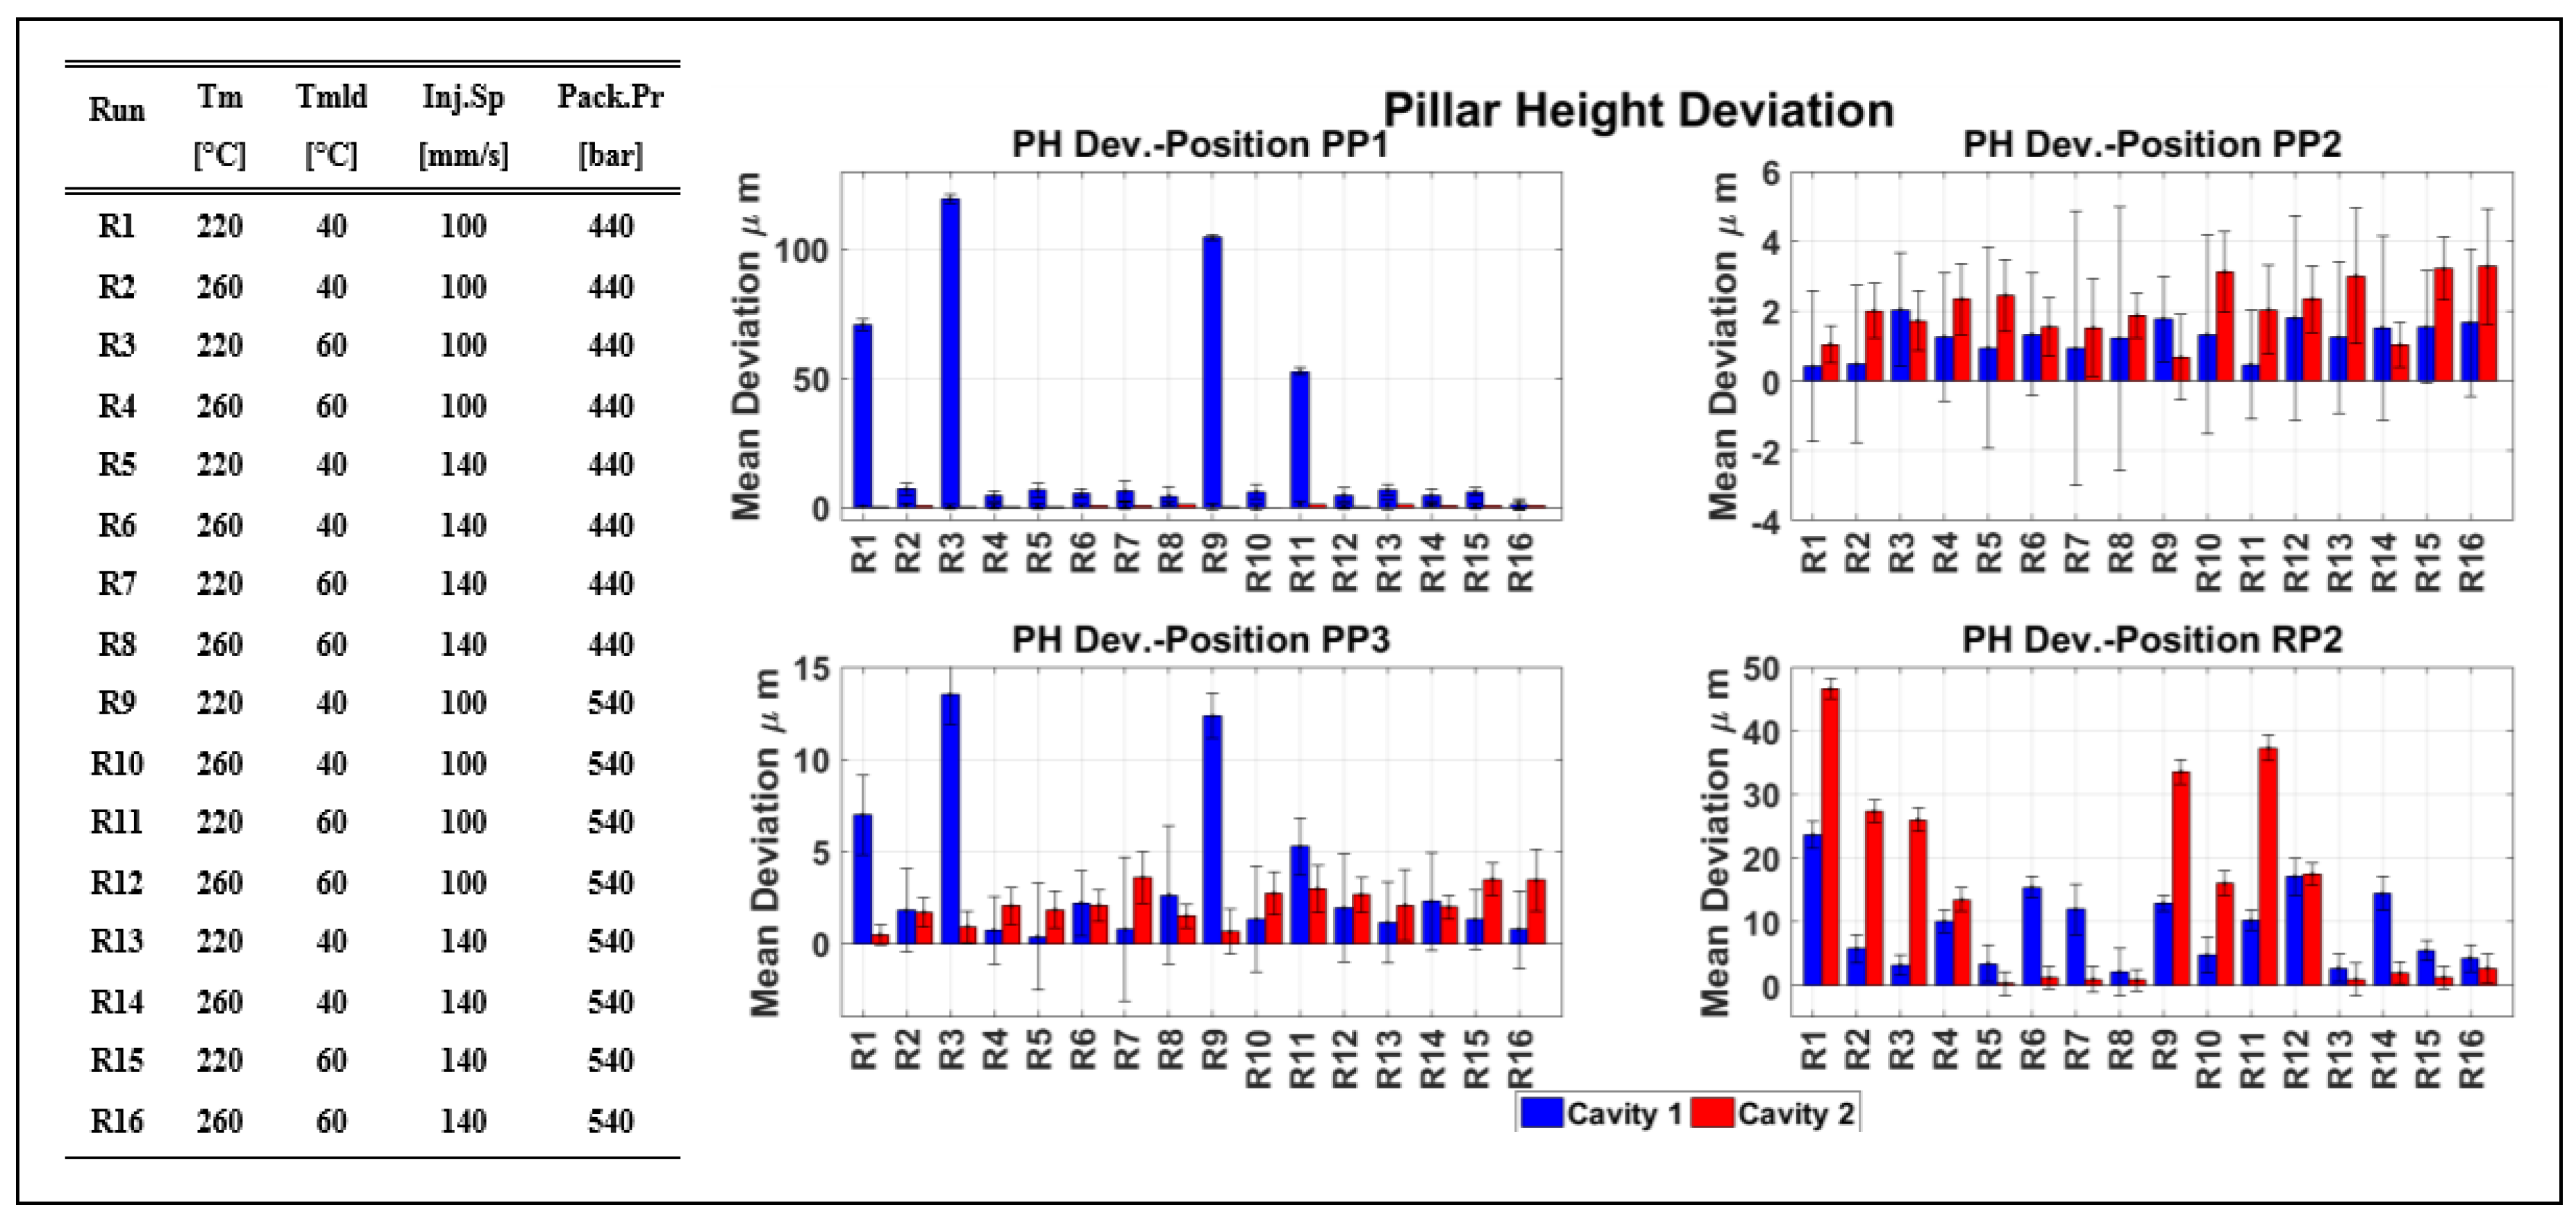
In a preliminary analysis the average pillar height (part) and pillar height deviation per area is presented in Figure 12 and Figure 13, respectively, with their respective part measurement uncertainties as described in Equation (1) (Upart) and Equation (3) (Udev). The uncertainty bars as illustrated on the bar graphs are associated with the combined measurement uncertainty (Udev) (Figure 12) from both mold (Umold) and parts (Upart) (Figure 10) measurements (Equation (3)) as calculated based in the ISO 15530-3 [20].
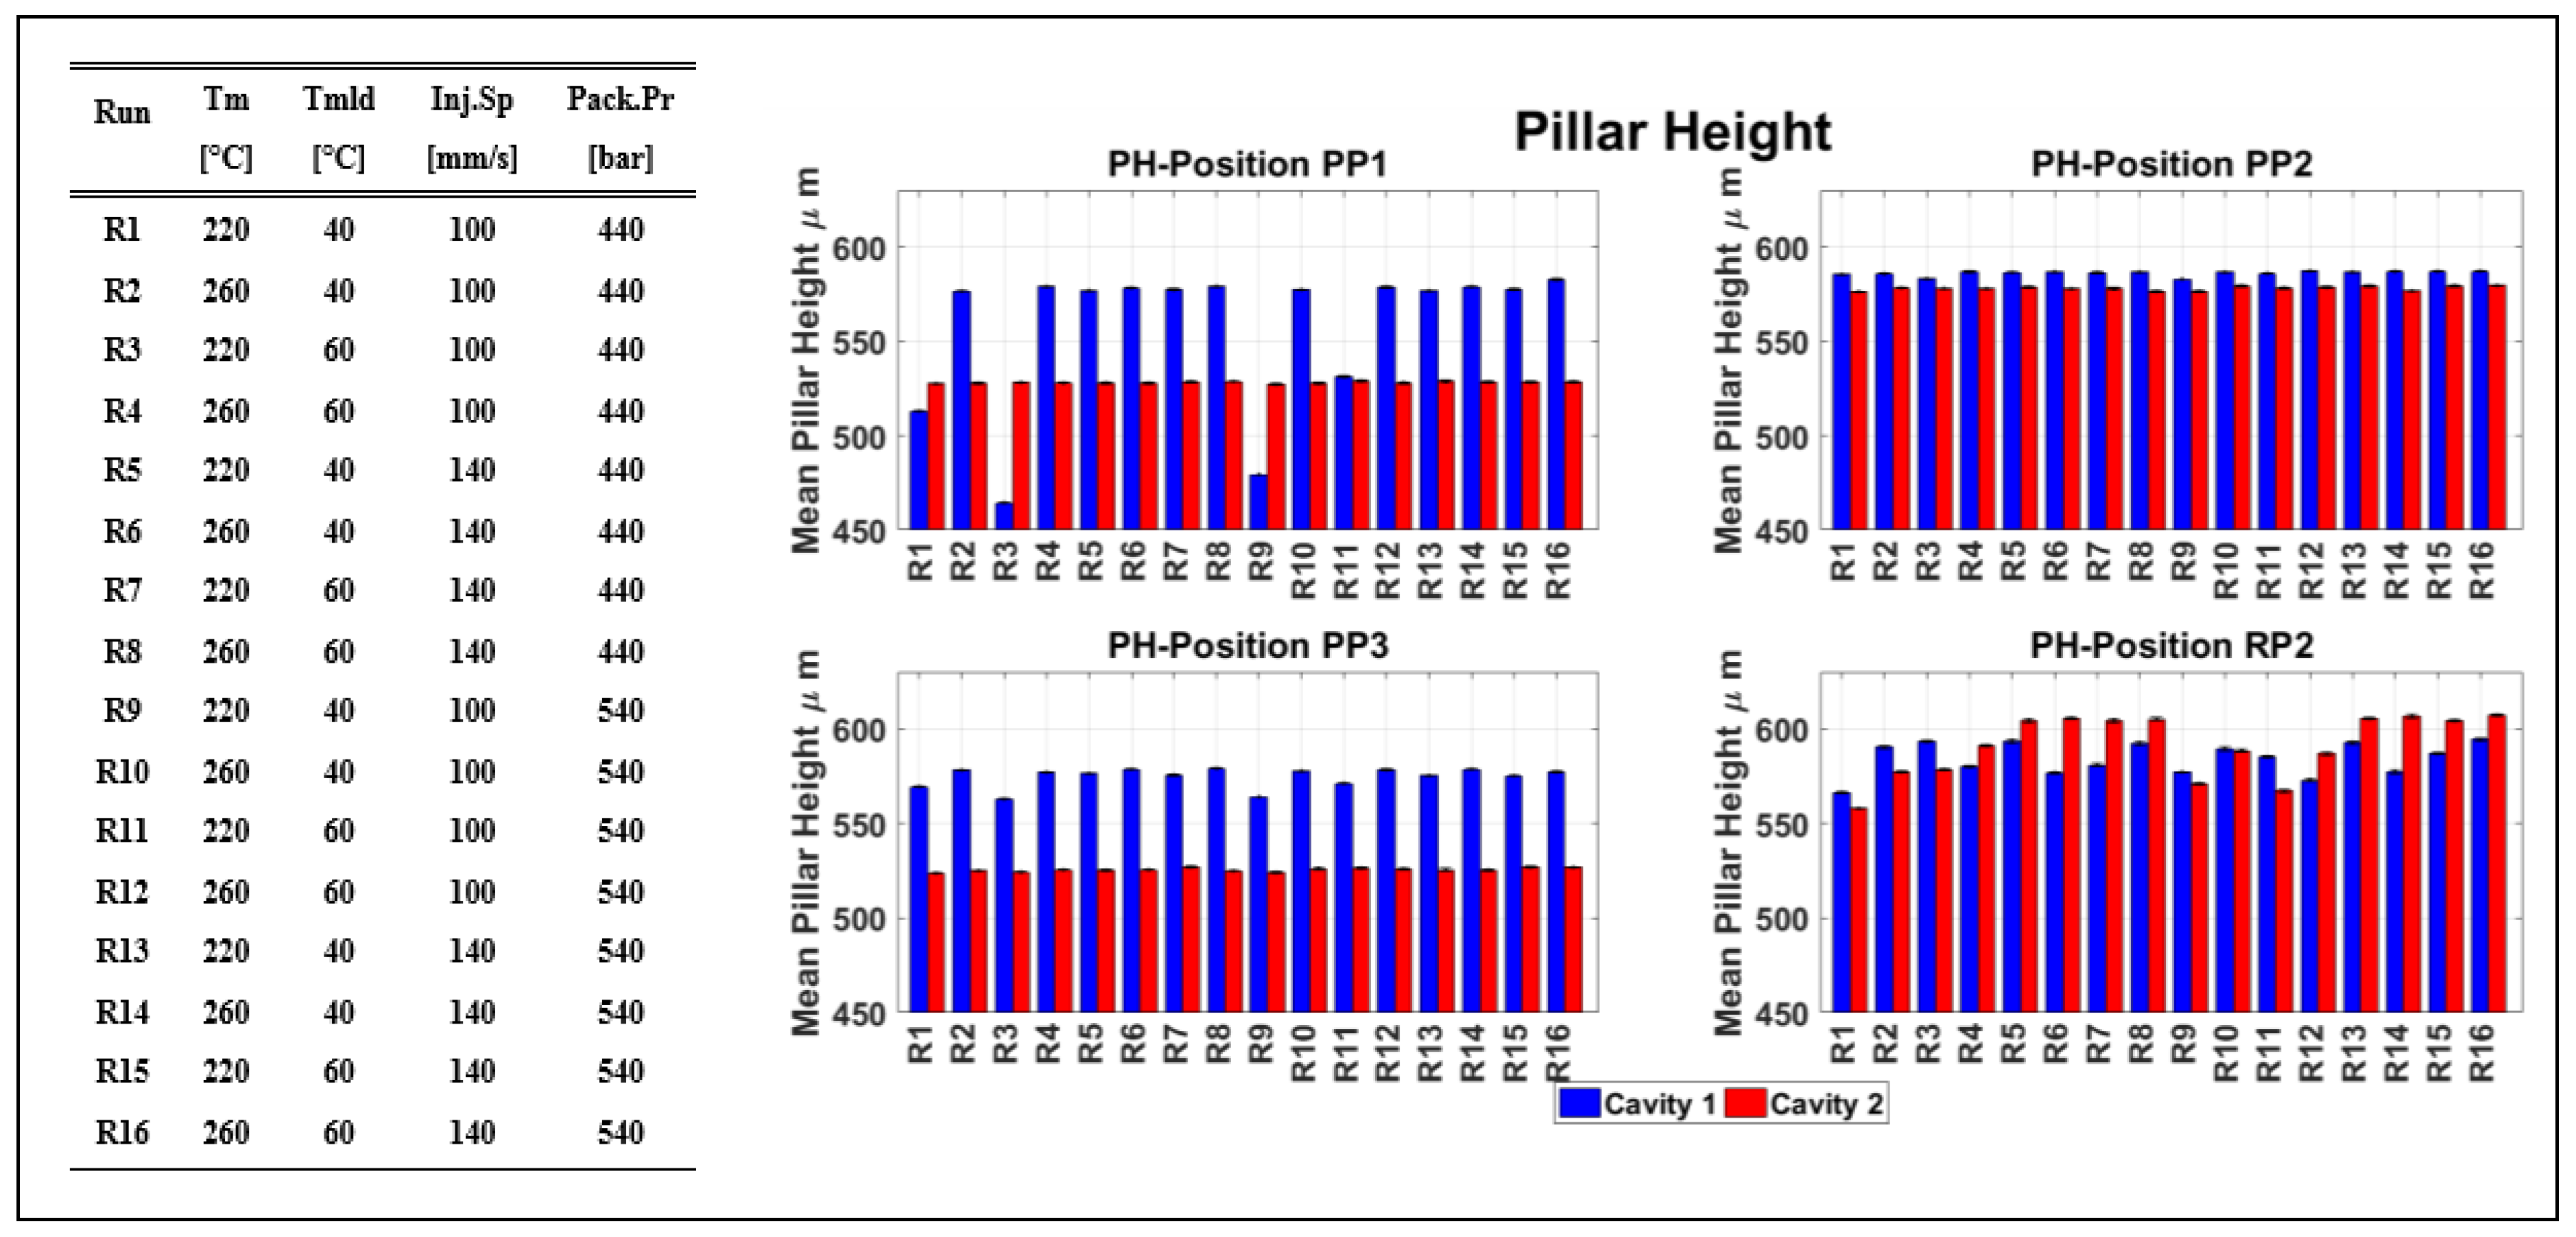
Figure 12 presents the real area pillar height of the biochip, which is homogeneous for most of the experimental runs. Figure 12 illustrates the replication fidelity of the pillars in both cavities. It is evident that the less replicated pillars are originated to position PP1, and for the experimental runs 1, 3, and 9, where the treatment uses the low value of the Tm parameter, and for runs 3 and 9 where Tmld is also at a low level. In position RP2 though, the μ-pillars positioned at the runners before Cavities 1 and 2 are better replicated for all the experimental runs where the high level of the InjSp parameter was used, as higher injection speed increased the temperature of the molten polymer through the mechanism of shear thinning. In comparison, when the lower level of InjSp was used, the replication fidelity of the μ-pillars in position RP2 was lower due to the thicker cross-section where the shrinkage was larger than the rest of the molded component.

3.2. Product Fingerprint Analysis

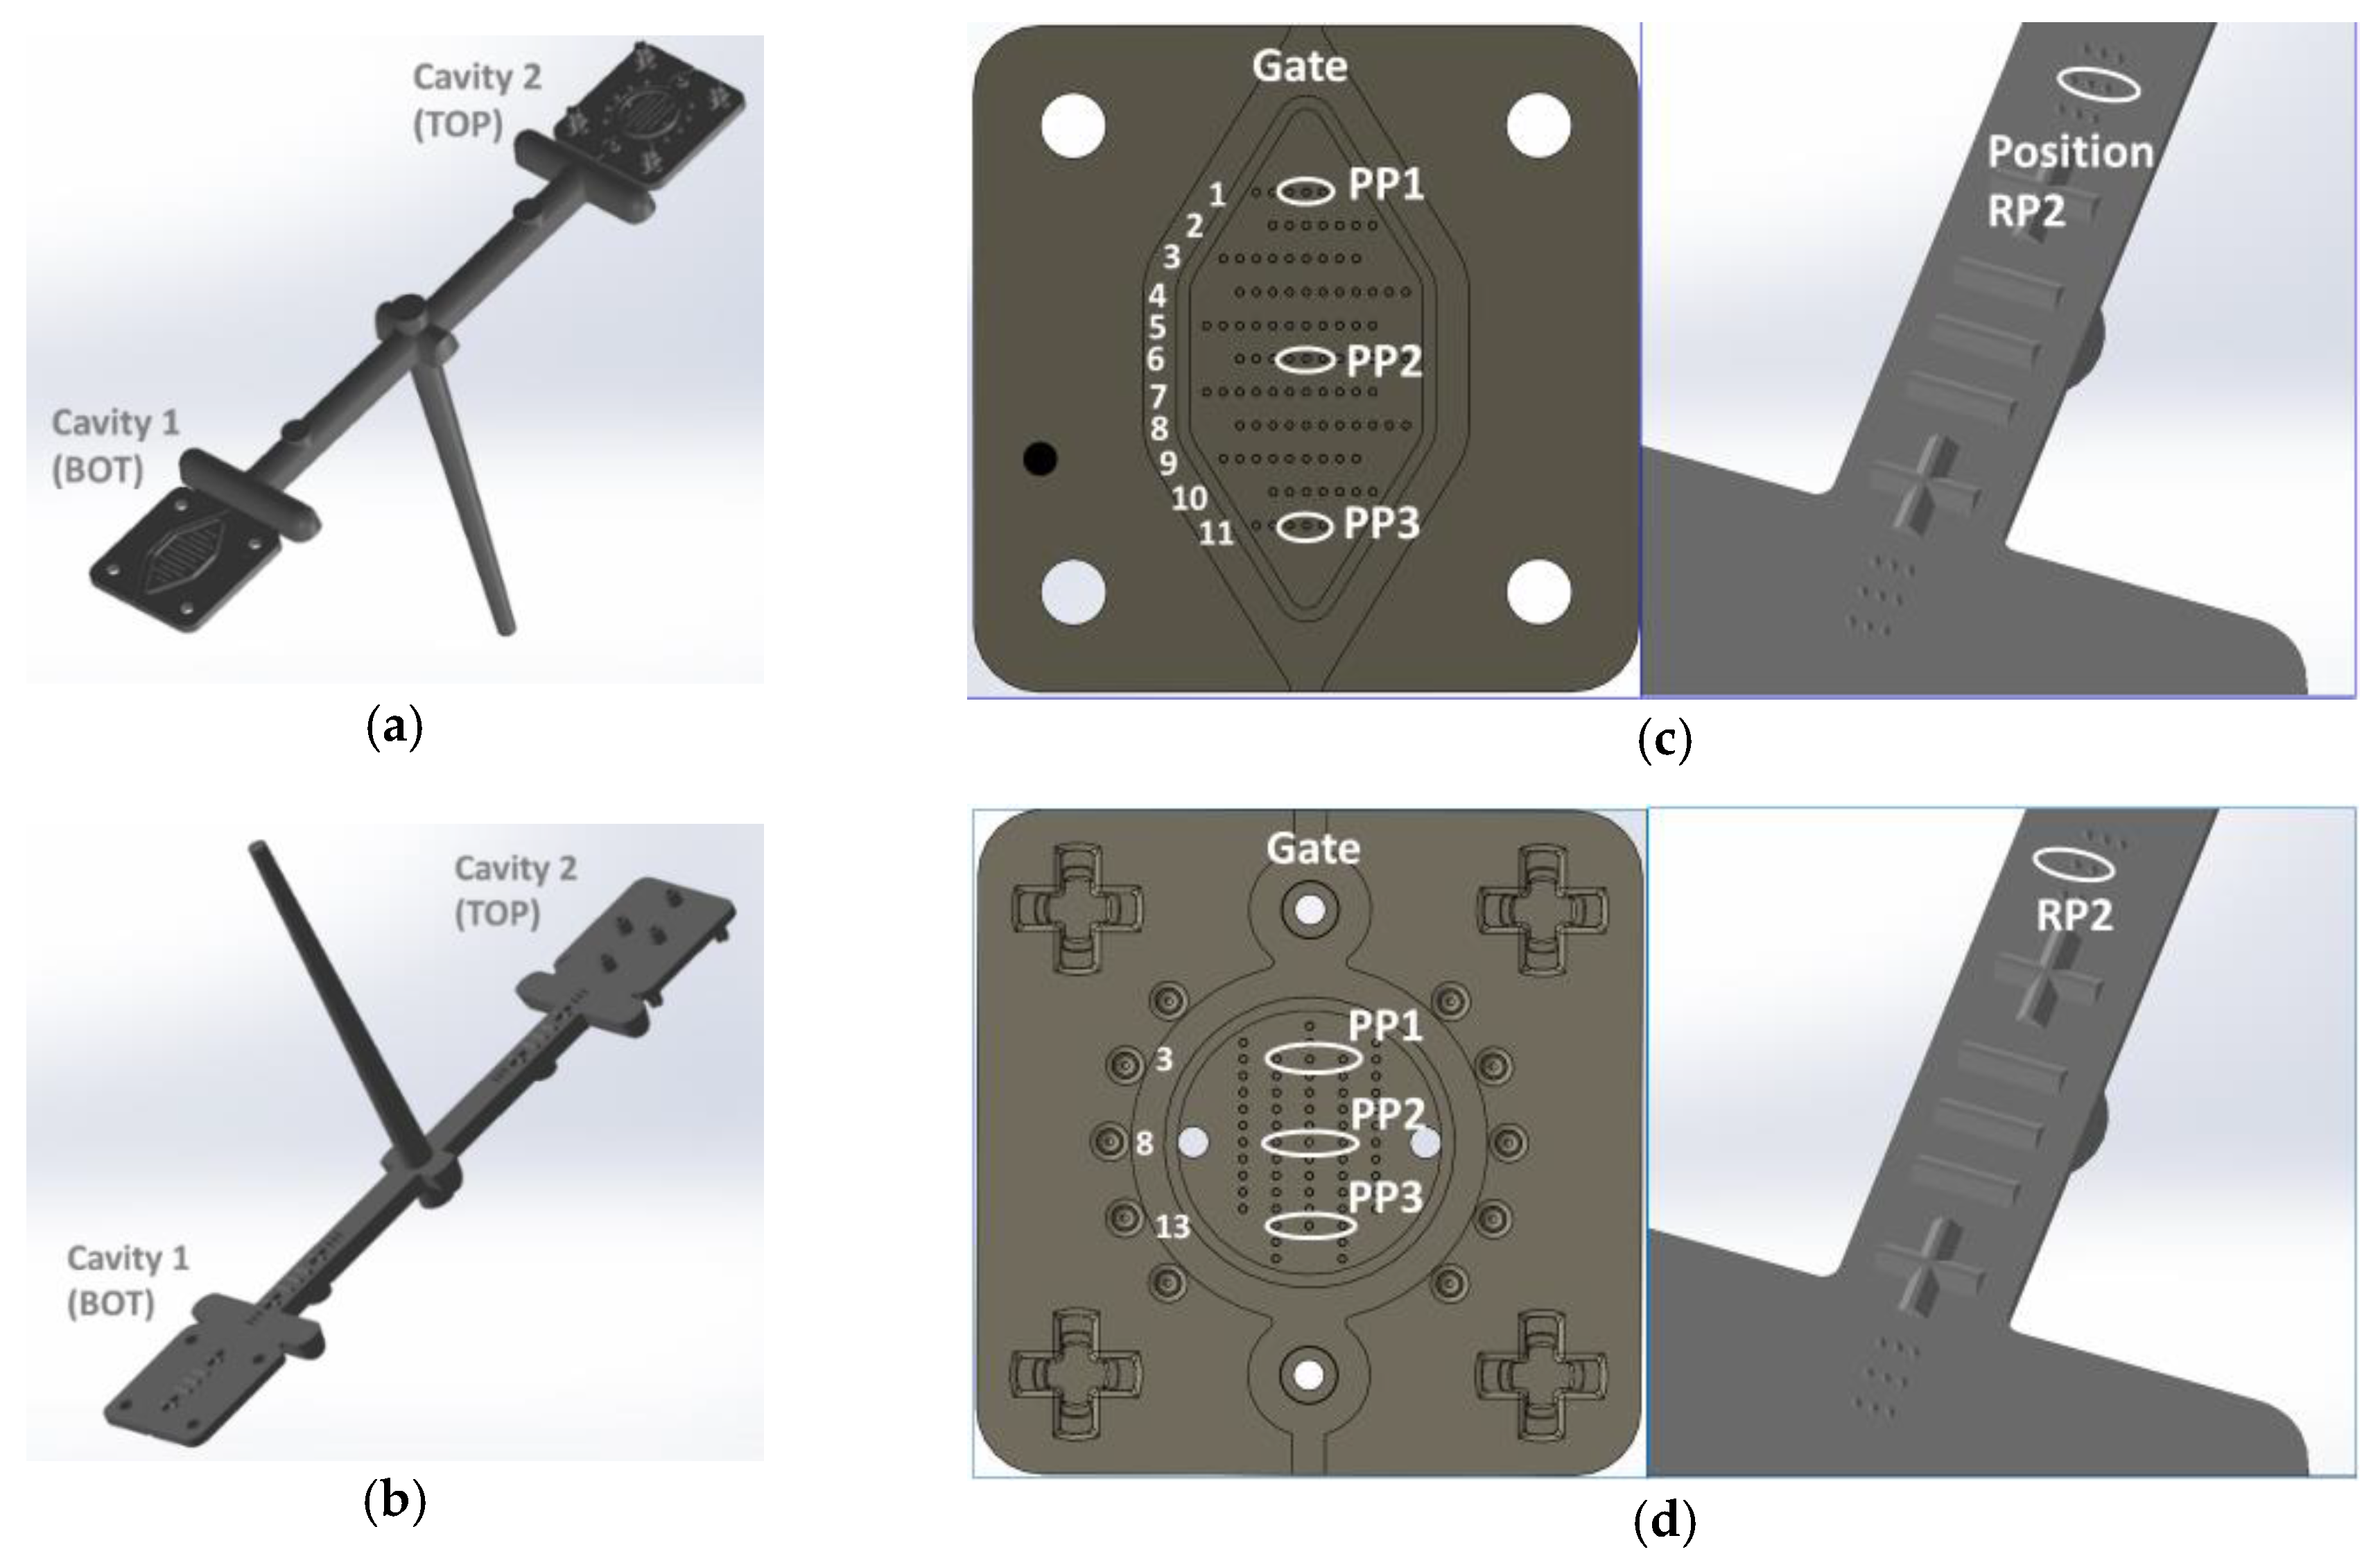
The dedicated μ-pillar features positioned on the runner of the molding can be potentially used as product fingerprints, as they can be rapidly measured with an in-line process set up, while already separated from the main component. However, for the on runner μ-pillars to be considered a suitable candidate for product fingerprints, sensitivity and correlation analyses are required in order to assess the sensitivity of the candidates to the process variation and their correlation to the on-part pillars, respectively.
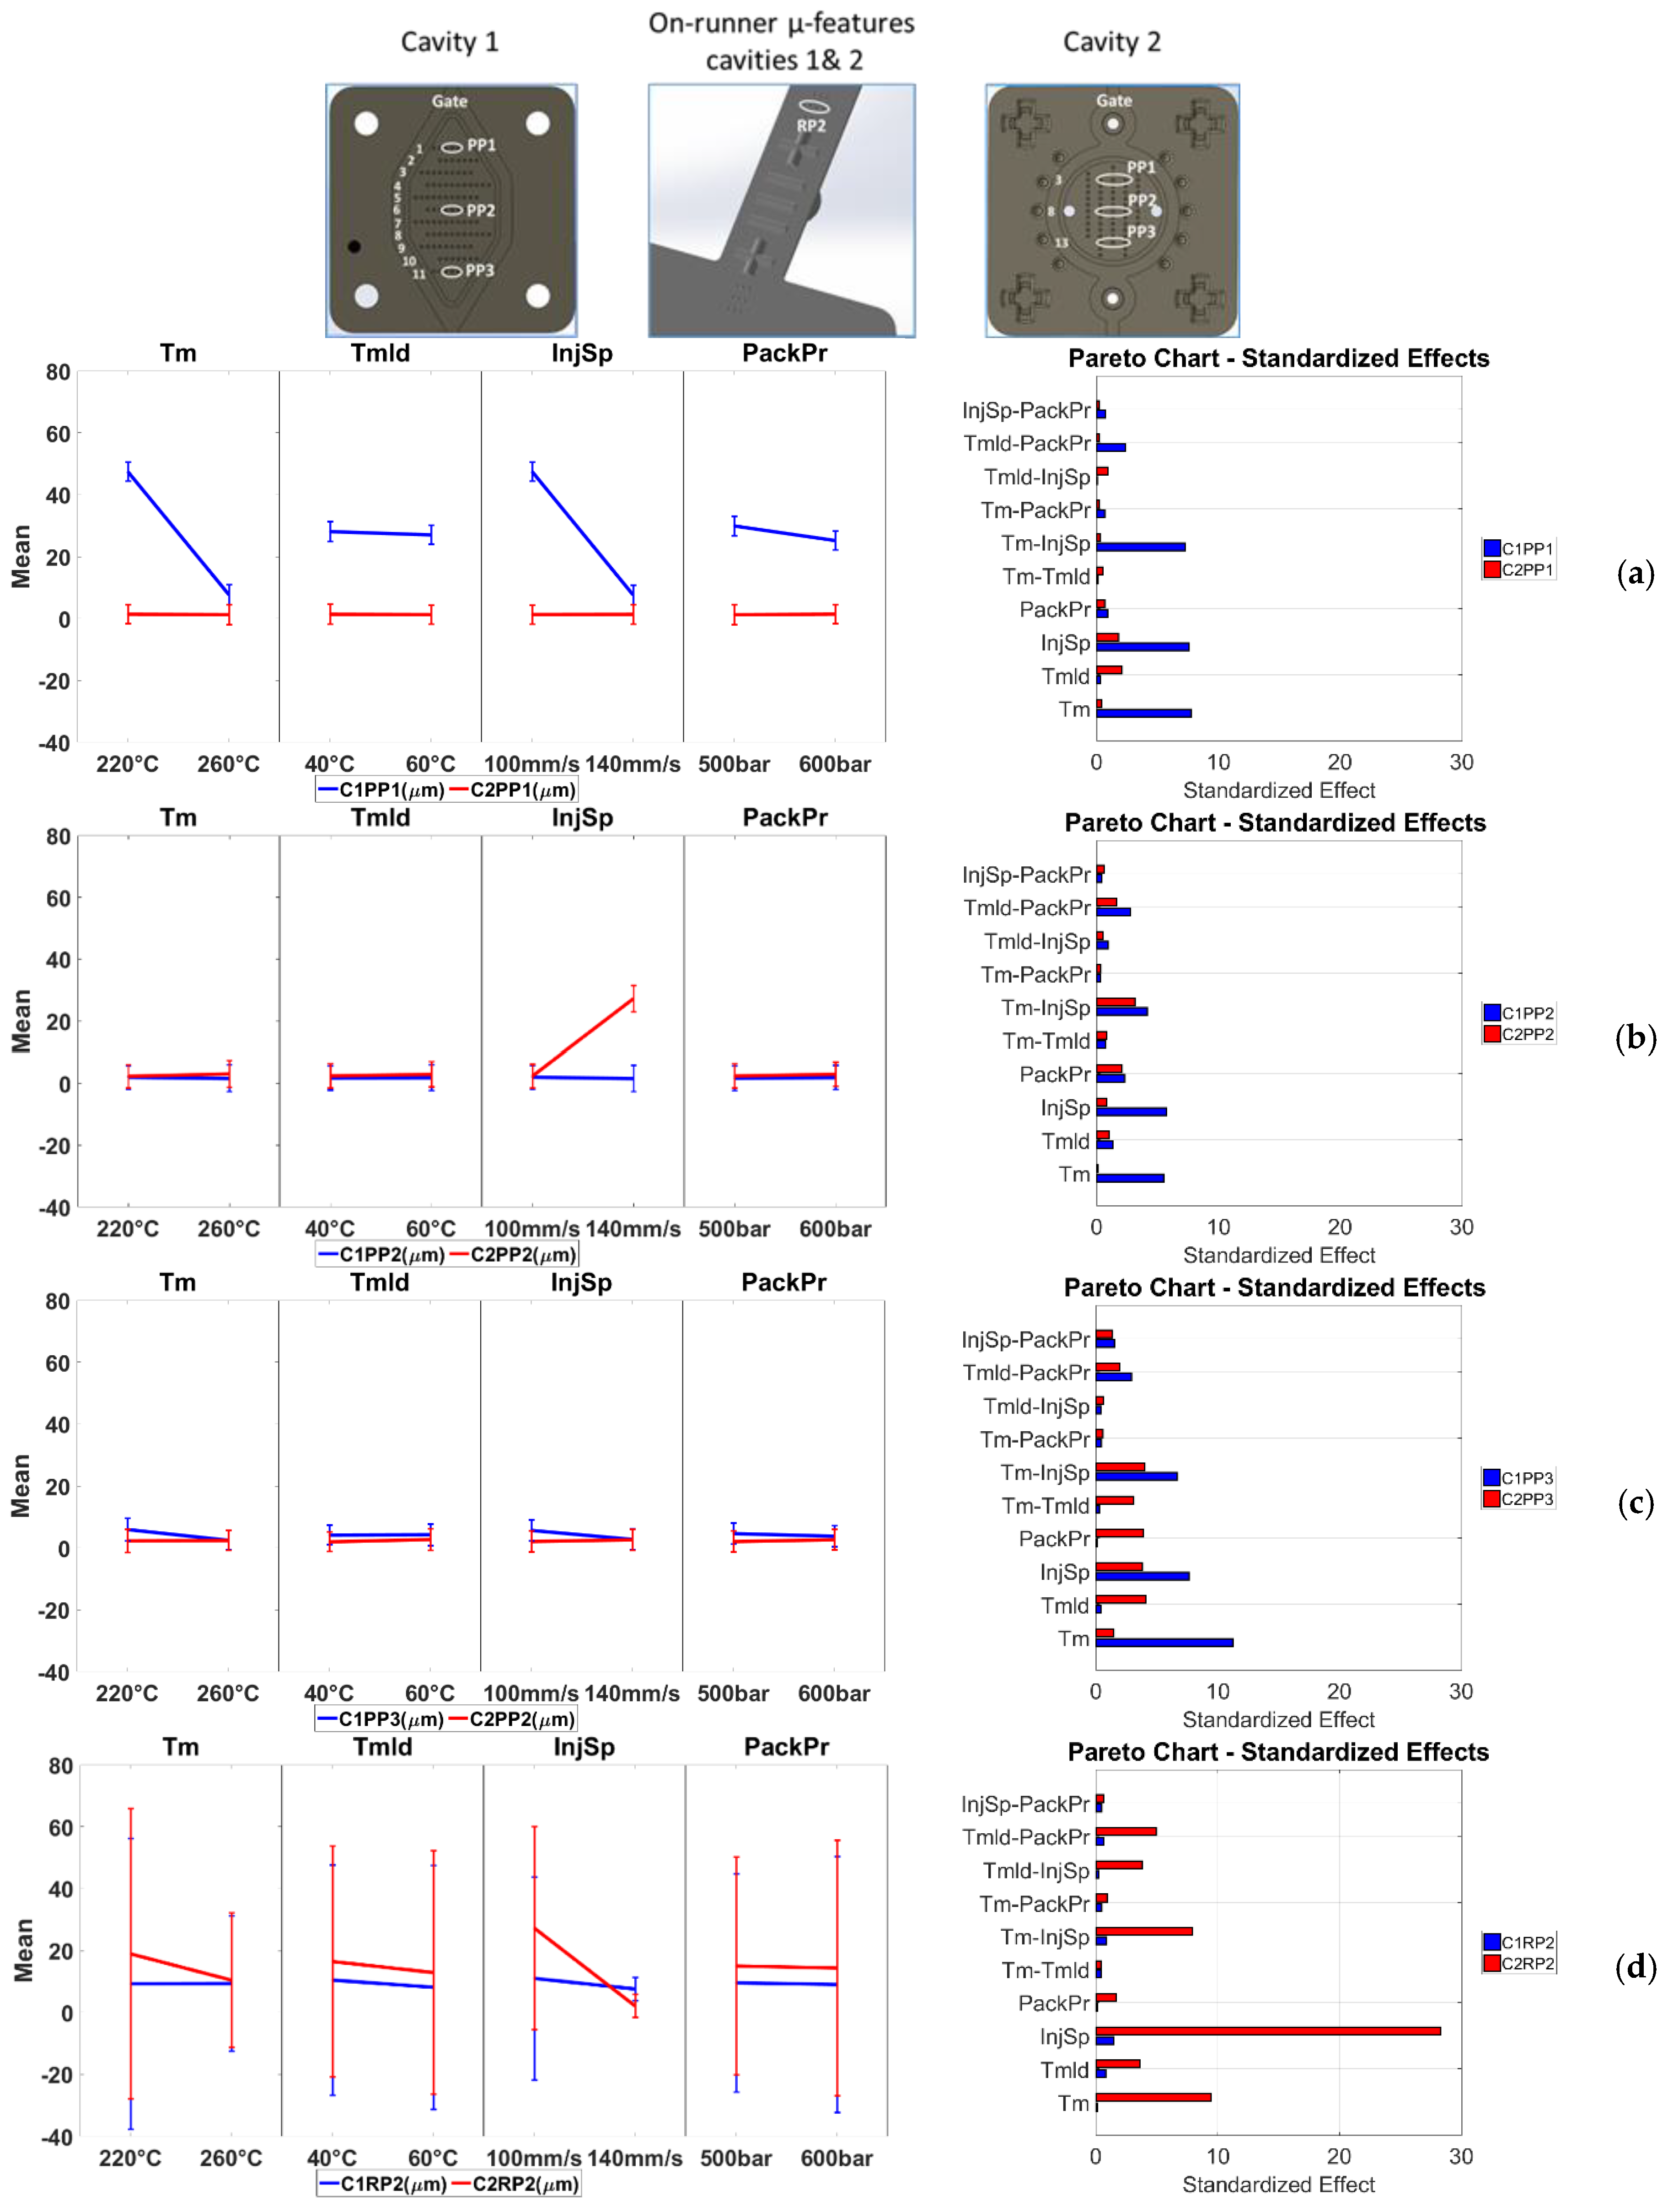
Figure 14 presents the results of the sensitivity analysis for the effects of the process parameter changes. In particular, Figure 14a presents the results from the μ-pillar arrays height measurement in position PP1 (μ-pillar structures near the gate). From the effect plots it can be seen that the parameter with the greatest influence on the response is the injection speed (InjSp); its increase leads to 39.9 ± 3.2 μm height deviation decrease of the feature height for Cavity 1 and a 0.06 μm height deviation increase for features in Cavity 2. The error bars at the two parameter levels do not overlap, and thus, the effect is considered significant for Cavity 1. The parameter with the second most significant effect is Tm where an increase to its level results to 39.8 ± 3.2 μm height deviation (from mold values) decrease of the μ-pillars. The rest of the parameters all appear to have an influence with the exception of Tmld. However, the error bars at the parameter levels of the Tmld and PackPr parameter effects do overlap indicating that the parameters cannot be considered as significant.
Figure 14b presents the results from the pillar array height deviation measurements in position PP2 (μ-pillar structures in the middle of the part). The main effect plots reveal that the parameter with the greatest influence on the response is the InjSp, where its increase from 100 mm/s to 140 mm/s leads to 24.9 μm increase of the feature height deviation for Cavity 2, which is considered significant. For the rest of the parameters only Tm appears to have an influence; however, none can be seen as significant as the error bar in the main effect plot overlap for the two parameter levels for both cavities.
Figure 14c presents the results from the pillar arrays height deviation measurement in position PP3 (μ-pillar structures far from the gate). However, none of the effects can be considered significant as the error bars do overlap again.
In all three cases, the presented results are supported by the Pareto graphs at the right column of the figure with respect to the parameters (Tm and InjSp) that have the largest effect. The effect of the two-way interaction between Tm and InjSp is smaller from the effects of those two parameters, thus it is considered insignificant.
In comparison to positions PP1, PP2, and PP3 that are located on the molded part, the μ-pillar features in positions RP2 (at the middle of the runner for both Cavities 1 and 2) (Figure 14d) are less sensitive to process variation than the three previously discussed measurand positions. In the case of C2RP2 (Cavity 2—position RP2) a level increase in the Tm, Tmld, InjSp, and PackPr parameters results to a feature height deviation decrease of 8.5 μm, 3.6 μm, 25.2 µm, and 0.66 μm, respectively, revealing the influence of the InjSp parameter. In particular, the Pareto chart in Figure 14d presents the larger influence of InjSp to the measurand C2RP2 in comparison to C1RP2, which is directly connected to the different geometries in Cavities 1 and 2. However, similarly for the results of the feature height deviation from positions C1PP3 and C2PP3 (
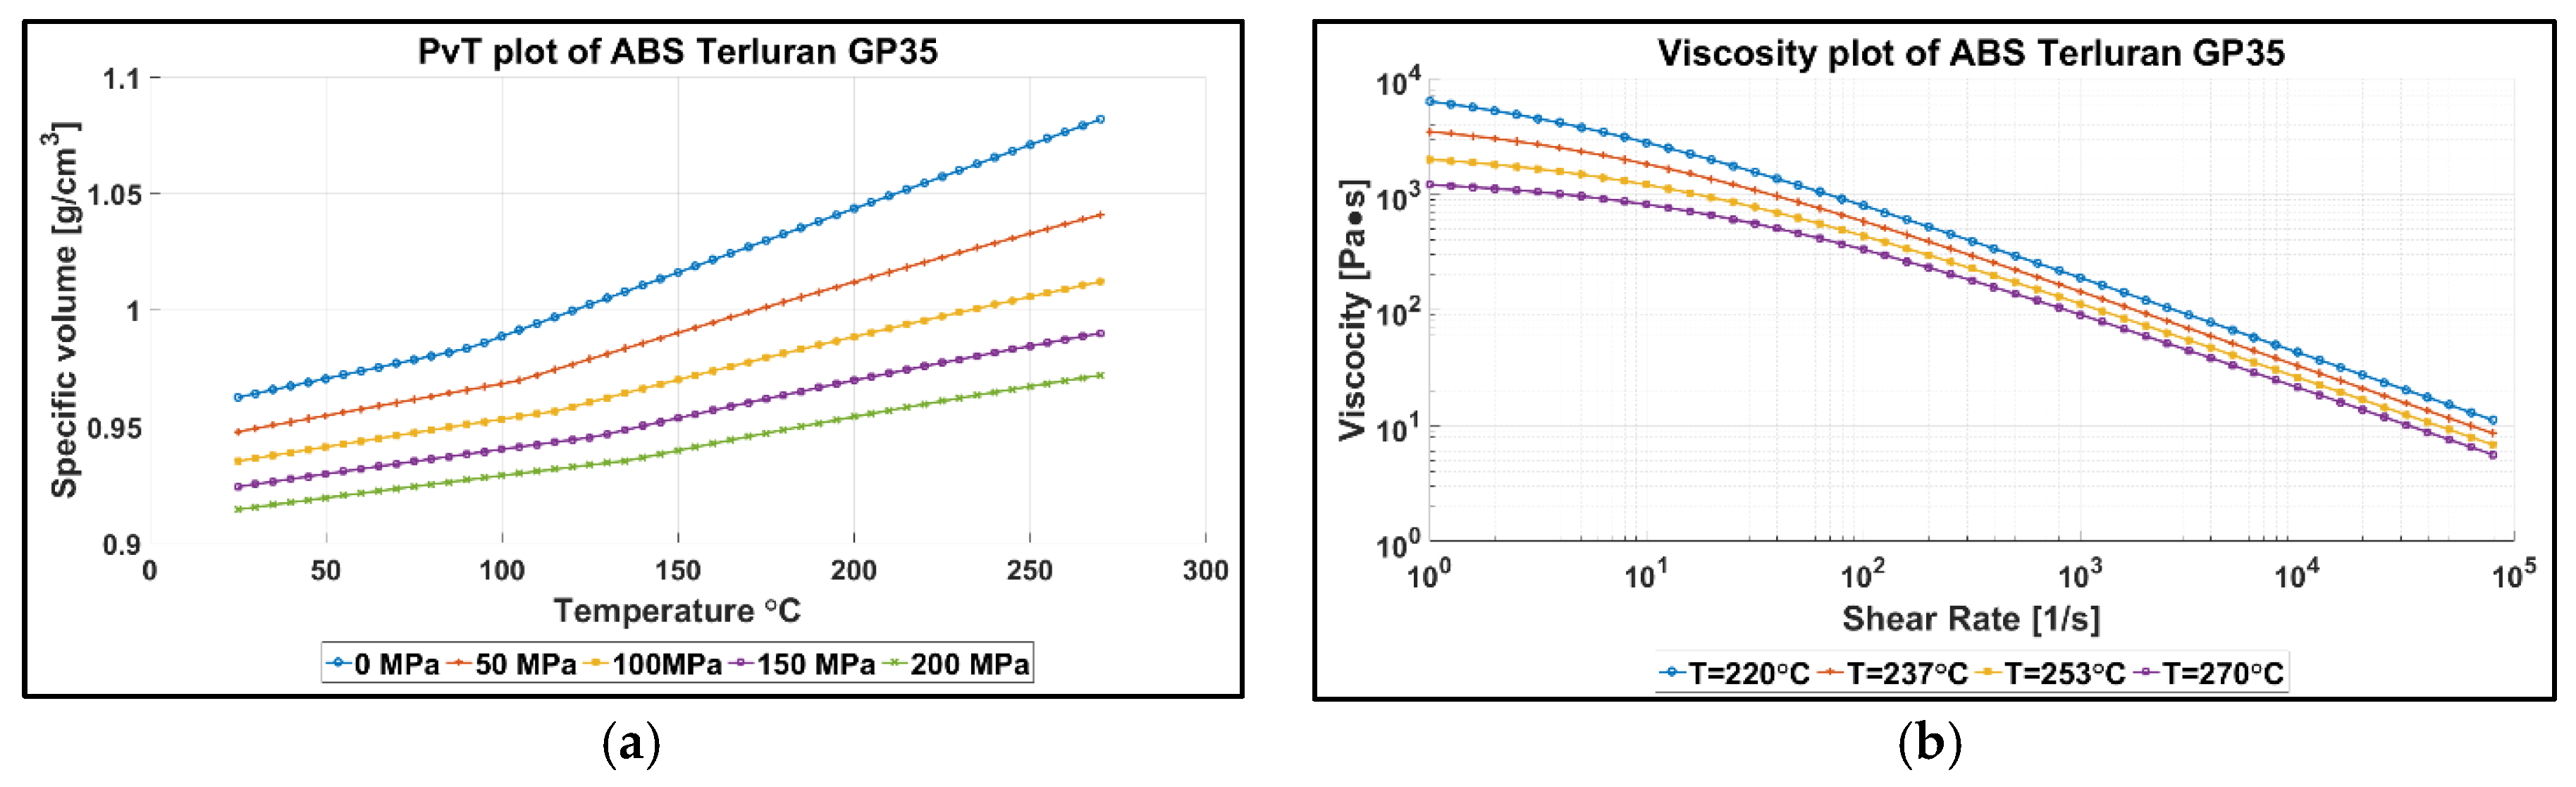
Figure 14c), none of the parameters’ effects can be considered significant due to the overlapping of the uncertainty bars in the presented main effects. The reason for the influence of InjSp and Tm lies again in the lower viscosity of the melt. The melt viscosity in combination with the geometry of μ-structure features, has an effect on the replication of the μ-features, as molten polymer at higher injection speeds (InjSp), or melt temperature (Tm) has a lower value of viscosity and can fill the features before a surface frozen layer is formed. When the packing pressure (PackPr) is considered alone, the already formed frozen layer of the polymer cannot be deformed by the higher packing pressure in order to fill the high aspect ratio μ-pillars. From the main effect plots charts, it can be seen that lower height deviation (i.e., better replication) existed mainly at the positions in the middle of the parts and farther from the gate where the response were less sensitive to process variation. Table 6 presents the measurement uncertainty levels of the main effects shown in Figure 14.
The μ-pillars in position RP2 are sensitive to process variation (although less than the rest of the measurands), and are thus considered suitable “product fingerprint” candidates. The analysis of the effects for the IM process parameters on the eight measurands has provided some indications on the most suitable possible product fingerprints with respect to their sensitivity to process variation. A product fingerprint though is required to have a high level of correlation with the overall part quality assessed by a measurand. In the current concept, the on runner μ-pillars viability as “product fingerprints” is examined.
Thus, the other μ-pillar positions are disregarded since they resulted in non-suitable product fingerprints. A correlation analysis was carried out to determine the most suitable product fingerprint related to the quality of the on part measurands and from the two on runner measurands. For the analysis, the Pearson correlation ρ coefficient was calculated with the use of Equation (16) [27].
ρ ( x , y ) = i = 1 n ( x i x ¯ ) ( y i y ¯ ) i = 1 n ( x i x ¯ ) 2 i = 1 n ( y i y ¯ ) 2
n is the sample size of the two datasets X and Y (n 1 vectors), xi and yi: data points in the vectors; x ¯ and y ¯ : the sample means of datasets X and Y.
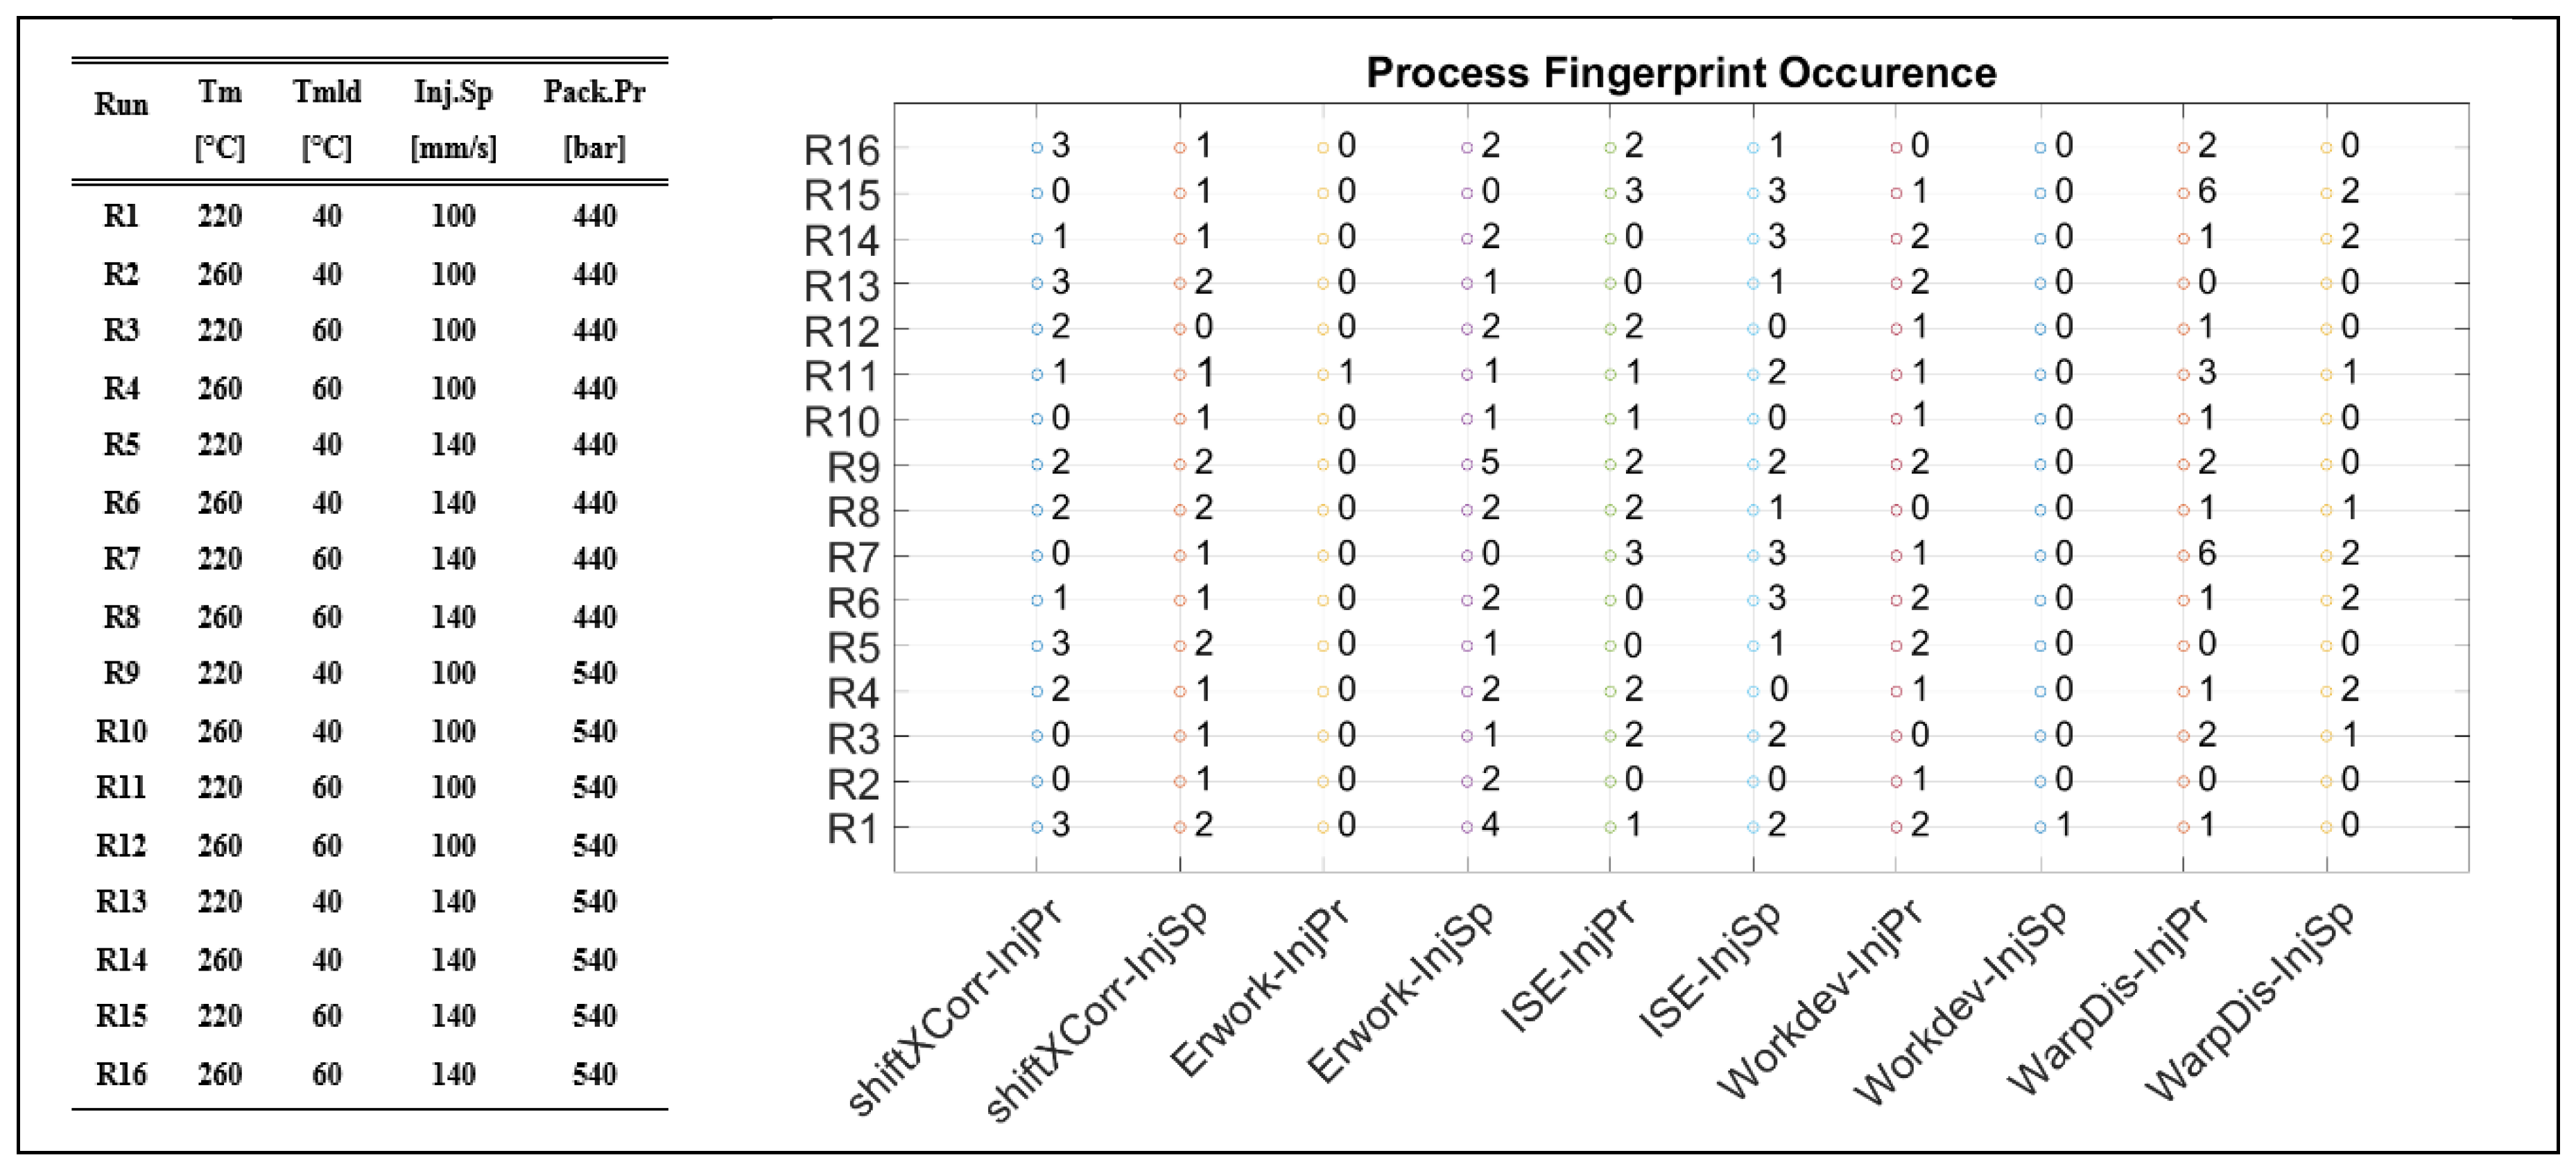
The coefficient ρ can vary between −1 and 1, where −1 indicates a perfect negative correlation and 1 indicates a perfect positive correlation. Instead, a ρ value equal to 0 connotes that no correlation exists between the two compared datasets. In this analysis, all the data points from the three replicates of each treatment of a 24 × 3 full factorial experiment were used for the correlation analysis and the calculation of the absolute Pearson coefficients.
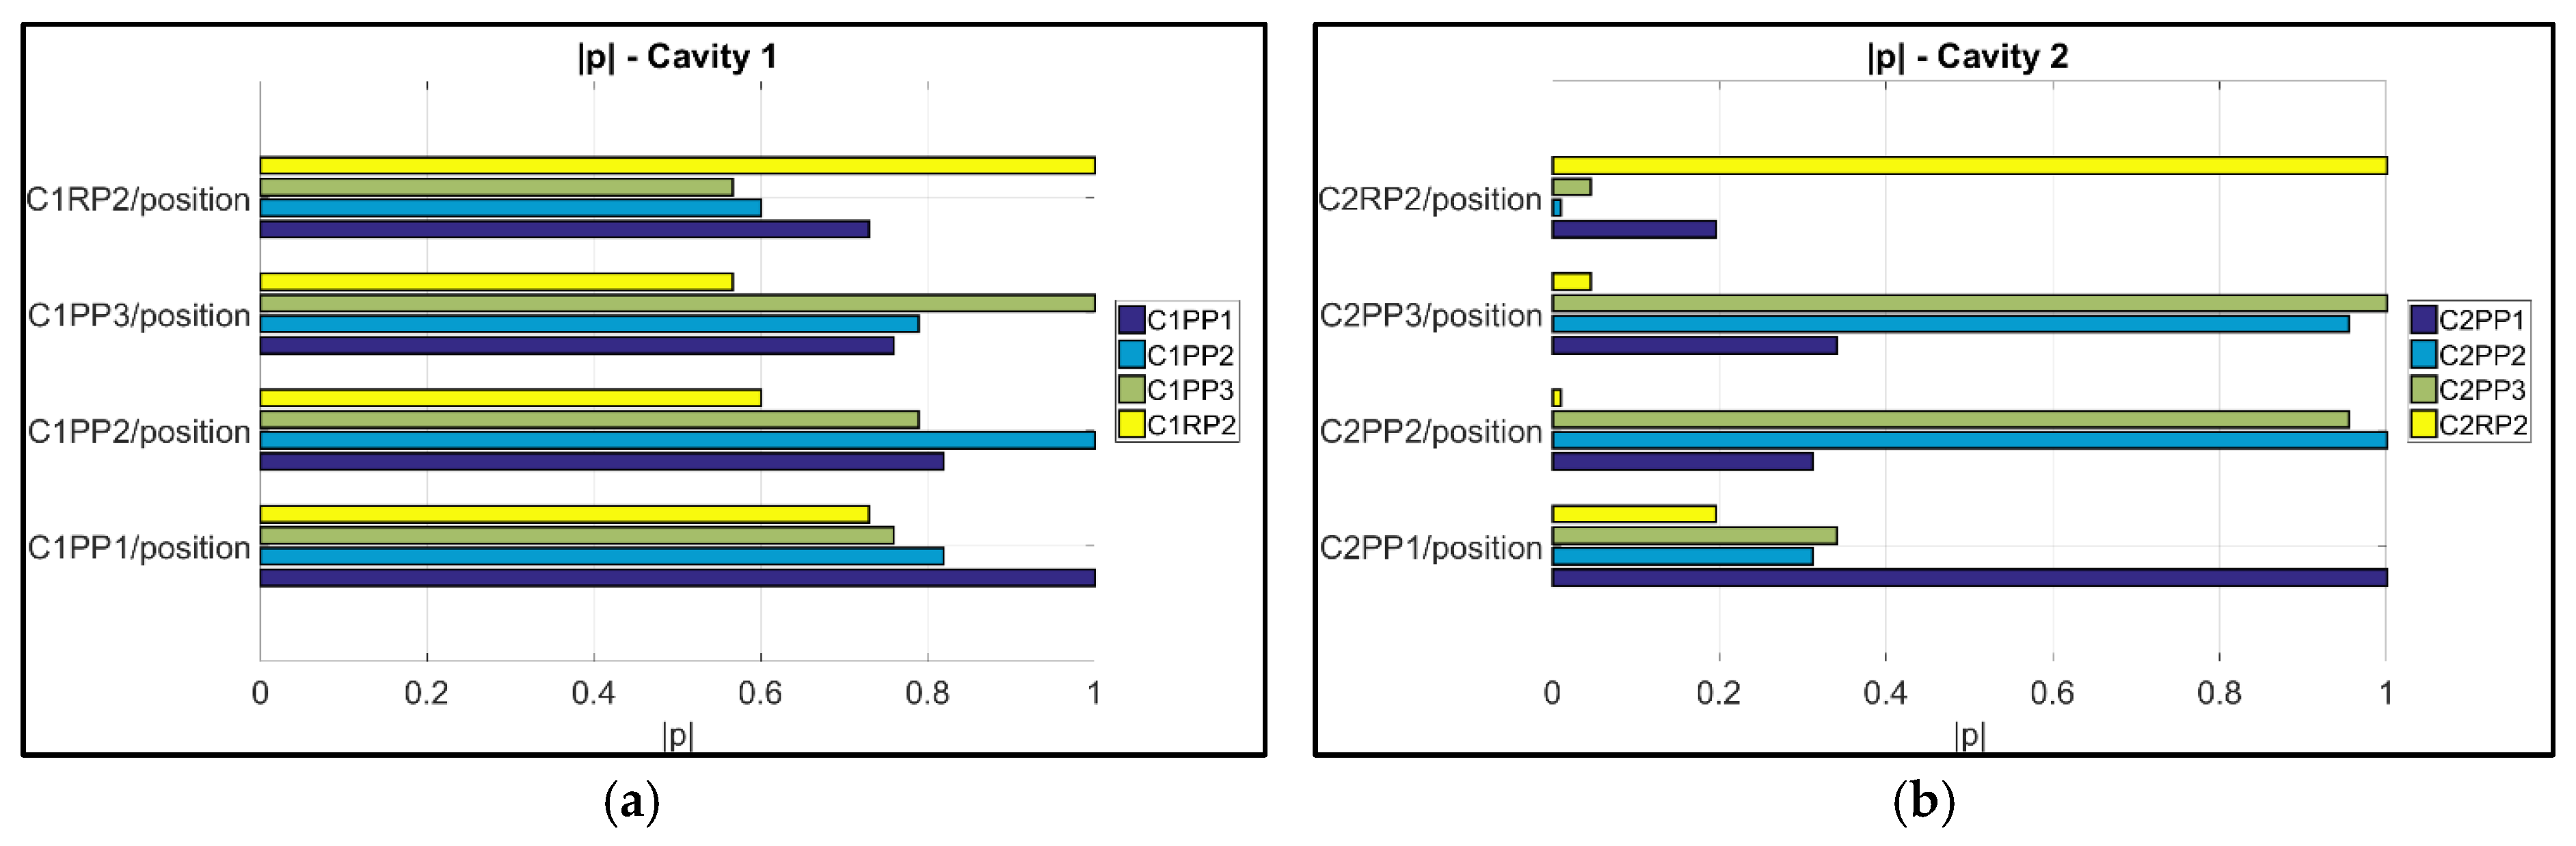
The calculated | ρ | values for the 32 dataset combinations (16 combinations per cavity) are presented in Figure 14. High correlations exist for many dataset combinations, though special focus was given in the correlations of the datasets to the dataset originating to positions RP2 from Cavities 1 (C1RP2) and 2 (C2RP2). Figure 15a is focused on Cavity 1 and it illustrates that the combination dataset with the highest correlation is C1PP1/C1RP2 (| ρ | = 0.73) (i.e., near the gate/on the runner), followed by C1PP2/C1RP2 (| ρ | = 0.60) and C1PP3/C1RP2 (| ρ | = 0.57) (i.e., far from the gate/on the runner), which present a strong correlation for the first combination and moderate correlation for the two consequent ones. Instead, in Cavity 2 no strong correlations exist to the measurands in the cavity, indicating that even though measurand C2RP2 is sensitive to process variations, particularly for injection speed, it is not considered suitable for the quality monitoring of the μ-pillars inside the cavity. Taking into consideration the sensitivity and correlation analyses from measurands in both cavities, only the μ-pillars on the runner of Cavity 1 (C1RP2) can be considered as suitable “product fingerprints” candidate and only for the measurands of Cavity 1.

3.3. Process Fingerprint Analysis

In the same way as for the “product fingerprint”, a set of “process fingerprint” candidates were extracted from the machine process monitoring and regulation signals. The goal was to verify which can act as indicators of the overall product quality, especially for the functional μ-pillar features.
The time-resolved machine data were used to extract two type of indicators:
(1)
The first type is characterized by those indicators which originated from the deviation of both the transient injection pressure and injection speed signals with respect to the reference signals such as error of alignment (ε(t)), integrated squared error (ISE), cross correlation shift error (Shift), and dynamic time warping (WarpDis);
(2)
Those indicators where the “signal integral” (Ix) and “signal power” (SPx) were calculated from each signal to extract the information from the signal curve and are subsequently converted into a single value representative of the second type.

3.3.1. Process Fingerprint Based on Indicators of Type 1

As already discussed in Section 2.5.1, the machine controller records the injection speed and the pressure time series and transient data during the process for every consecutive cycle. The deviation of those signals from the initial reference (1st signal per run) is used for the calculation of the deviation-based “process fingerprints” (Type 1). When this type of indicator is considered, the “fingerprints” as well as the dataset’s values are standardized in order to be compared. Figure 16 provides an example of the trends that exist between the standardized mold-part deviation measurement and the standardized “process fingerprints” candidate values. It can be seen, particularly for experimental run 16, that not all deviation datasets follow the same trend of the “process fingerprints” candidates. However, the same fingerprints and dataset trends exist for both the nominal (see Figure 16 top) and cross correlated aligned signals (see Figure 16 bottom). It can be seen that “Workdev-InjPr” and “Erwork-InjPr” follow the exact trend with the dataset “C2PP2”. Analogously “ISE-InjPr” follows a similar trend. Moreover, the dataset of position RP2 in Cavity 2 (C2RP2) follows a similar trend to fingerprint candidate “ShiftXcorr-InjPr”. A similar trend can be observed between the “process fingerprint” candidate “WarpDis-InjPr” and the dataset of position C1PP3.
When the whole experimental space is considered, the same dataset trends were not always in agreement with the trends of the same candidates. Figure 17 illustrates the occurrence of similar “process fingerprint” trends to the measurement datasets of each experimental run. For example, significant trends between the measurement datasets and the candidate “WarpDis-InjPr” occur a maximum of six times (i.e., six datasets) for Runs 7 and 15 where the Tmelt parameter is kept on the low level. The second process fingerprint candidate occurrence is “Erwork-InjSp” with five times for Run 9 and four times for Run 1. Instead, “process fingerprint” candidates such as “Workdev-InjPr”, “ISE-InjPr”, and “ISE-InjSp” have less similar trends to the measurement datasets from the same run, even though they appear to have similar trends to measurement datasets from most of the experimental runs.
As a conclusion, “process fingerprints” “Workdev-InjPr”, “ISE-InjPr”, and “ISE-InjSp” together with “WarpDis-InjPr” are considered suitable for the quality control of the pillar μ-features in most of the examined experimental space. However, their correlation and trend are directly dependent on each of the treatments’ process parameter combination.

3.3.2. Process Fingerprint Based on Indicators of Type 2

The second type of “process fingerprint” candidates originates from each signal individually. To examine the suitability of signal integrals and signal power to serve as “process fingerprint” candidates, a correlation analysis to respective measurement datasets was conducted with the correlation coefficients | ρ | to be presented in Figure 18a for Cavity 1 and Figure 18b for Cavity 2. The maximum correlation coefficient (| ρ | = 0.436, indicating a moderate correlation) values occur for the combination I.InjSp/C2PP2 (integral of injection speed signal vs. the dataset in position C2PP2, in the middle of the part). The rest of the combinations had weak correlation: they exhibited | ρ | values lower than 0.4. For this reason, the integral and power of the injection pressure and speed signals originating from the IM machine were not considered suitable “process fingerprint” candidates for the quality control and assurance for μ-pillar structured molded components for the particular application.

4. Conclusions

A new approach towards process monitoring and fast-integrated quality assurance of injection molded microstructured components based on product and process fingerprints was presented and validated in this paper. The concept is examined on two parallel tracks. Micro pillars were positioned on the runner before each cavity to serve as “product fingerprints” and the process controlling signals were collected to extract “process fingerprint” candidates. The suitable fingerprints were selected after a sensitivity and correlation analysis was conducted to assess their sensitivity to process variation and correlation, respectively. As far as the product quality assurance was concerned, the replication quality of the μ-pillars was assessed using 3D scanning focus variation microscopy (i.e., off-line metrology). For the process monitoring, the signals generated by the machine regulation embedded sensors were used to extract the time-resolved data. Summarizing the key findings of the research, the following conclusions can be drawn:
  • The variation of the IM process parameters settings has an effect on the manufacturing quality and replication of the molded μ-pillar structured components placed both in the cavities as well as on the runners.
  • The variation of the process was used to assess the suitability of μ-pillars in the eight different positions to act as product fingerprint. The analysis was based on their replication quality. A correlation analysis was then used for verification. This track was focused on the μ-pillars positioned on the runners of the molding in positions C1RP2 and C2RP2. For Cavity 1, it can be seen that the dataset position C1RP2 can be used to monitor the quality of the μ-features on the part, especially for position C1PP1 (near the gate) with the highest correlation to originate to the combination is C1PP1/C1RP2 (| ρ | = 0.73) (i.e., near the gate/on the runner), followed by C1PP2/C1RP2 (| ρ | = 0.60) and C1PP3/C1RP2 (| ρ | = 0.57) (i.e., far from the gate/on the runner). Instead, the μ-pillars on the runner of Cavity 2 (C2RP2), did not present strong correlations with respect to the measurands of the features in the cavity, indicating that these μ-pillars are not suitable to serve as a “product fingerprint”.
  • Two different types of process fingerprint candidates were assessed for their suitability to act as quality indicators of the micro structures on the molded parts. Results show that only a small number of process fingerprint candidates from the category of deviation-based process fingerprints (i.e., Type 1) were considered suitable for process monitoring when considered together with the proper measurand. From the Type 2 indicators in fact, no candidate presented a strong correlation with the quality of a measurand. This indicates that the integral and signal power of machine injection pressure and speed signals could not be used for the monitoring of the overall part quality in the current application.
  • Finally, it can be concluded that the deviation of the quality of the part’s μ-pillars can be monitored by monitoring the deviation of the “Workdev-InjPr”, “ISE-InjPr”, “ISE-InjSp”, and “WarpDis-InjPr” process fingerprints. These fingerprints present similar trends with measurands for most of the treatments in the investigated process window.
Future work will aim at the validation of the presented concept, enriched with data acquired from in-mold temperature and pressure sensors. Furthermore, the assessment of product and process fingerprints performance robustness will be carried out in longer manufacturing runs emulating an actual production environment.

Author Contributions

N.G., G.T., and Y.Z. conceived and designed the experiments; N.G. performed the experiments and measurements; N.G. analyzed the data; G.T. and Y.Z. consulted on the work; N.G. wrote the paper; G.T. and Y.Z. revised the paper.

Funding

This research was funded by Innovation Fund Denmark grant number 3067-00001B and the APC was funded by the Technical University of Denmark.

Acknowledgments

This paper reports work undertaken within the framework of the project MADE (Manufacturing Academy of Denmark, http://en.made.dk/) Work Package 3 “3D Print and New Production Processes” of the Research Platform MADE SPIR (Strategic Platform for Innovation and Research, http://en.made.dk/spir/). MADE is a collaborative research project supported both by the Danish Manufacturing Industry and by the Innovation Fund Denmark (https://innovationsfonden.dk/en). MADE and Innovation Fund Denmark are thanked for providing financial support to the PhD project “Precision Injection Moulding of Micro Features using Integrated Process/Product Quality Assurance”.

Conflicts of Interest

The authors declare no conflict of interest.

References

  1. Alting, L.; Kimura, F.; Hansen, H.N.; Bissacco, G. Micro Engineering. CIRP Ann. Manuf. Technol. 2003, 52, 635–657. [Google Scholar] [CrossRef]
  2. Brousseau, E.B.; Dimov, S.S.; Pham, D.T. Some recent advances in multi-material micro- and nano-manufacturing. Int. J. Adv. Manuf. Technol. 2010, 47, 161–180. [Google Scholar] [CrossRef]
  3. Wang, X.; Gu, J.; Shen, C.; Wang, X. Warpage optimization with dynamic injection molding technology and sequential optimization method. Int. J. Adv. Manuf. Technol. 2015, 78, 177–187. [Google Scholar] [CrossRef]
  4. Theilade, U.A.; Hansen, H.N. Surface microstructure replication in injection molding. Int. J. Adv. Manuf. Technol. 2006, 33, 157–166. [Google Scholar] [CrossRef]
  5. Giannekas, N.; Tosello, G.; Zhang, Y. A study on replication and quality correlation of on-part and on-runner polymer injection molded micro features. In Proceedings of the World Congress on Micro and Nano Manufacturing (WCMNM), Kaohsiung, Taiwan, 27–30 March 2017; pp. 365–368. [Google Scholar]
  6. Marhöfer, D.M.; Tosello, G.; Islam, A.; Hansen, H.N. Gate Design in Injection Molding of Microfluidic Compoments Using Process Simulations. J. Micro Nano-Manuf. 2016, 4, 025001. [Google Scholar] [CrossRef] [Green Version]
  7. Tosello, G.; Gava, A.; Hansen, H.N.; Lucchetta, G. Study of process parameters effect on the filling phase of micro-injection moulding using weld lines as flow markers. Int. J. Adv. Manuf. Technol. 2010, 47, 81–97. [Google Scholar] [CrossRef]
  8. Calaon, M. Process Chain Validation in Micro and Nano Replication. Ph.D. Thesis, Technical University of Denmark, Kongens Lyngby, Denmark, 2014. [Google Scholar]
  9. Gao, R.X.; Tang, X.; Gordon, G.; Kazmer, D.O. Online product quality monitoring through in-process measurement. CIRP Ann. Manuf. Technol. 2014, 63, 493–496. [Google Scholar] [CrossRef]
  10. Kusić, D.; Kek, T.; Slabe, J.M.; Svečko, R.; Grum, J. The impact of process parameters on test specimen deviations and their correlation with AE signals captured during the injection moulding cycle. Polym. Test. 2013, 32, 583–593. [Google Scholar] [CrossRef]
  11. Wong, H.Y.; Fung, K.T.; Gao, F. Development of a transducer for in-line and through cycle monitoring of key process and quality variables in injection molding. Sens. Actuators A 2008, 141, 712–722. [Google Scholar] [CrossRef]
  12. Kazmer, D.O.; Gordon, G.W.; Mendible, G.A.; Johnston, S.P.; Tang, X.; Fan, Z.; Gao, R.X. A Multivariate Sensor for Intelligent Polymer Processing. IEEE/ASME Trans. Mechatron. 2014, 1, 1–9. [Google Scholar] [CrossRef]
  13. Mendibil, X.; Llanos, I.; Urreta, H.; Quintana, I. In process quality control on micro-injection moulding: The role of sensor location. Int. J. Adv. Manuf. Technol. 2017, 89, 3429–3438. [Google Scholar] [CrossRef]
  14. Chen, Z.; Turng, L.-S.; Wang, K.-K. Adaptive Online Quality Control for Injection Molding by Monitoring and Controling Mold Separation. Polym. Eng. Sci. 2006, 46, 569–580. [Google Scholar] [CrossRef]
  15. Johnston, S.; Mccready, C.; Hazen, D.; Vanderwalker, D.; Kazmer, D. On-Line Multivariate Optimization of Injection Molding. Polym. Eng. Sci. 2015, 55, 1–8. [Google Scholar] [CrossRef]
  16. Yang, Y.; Yang, B.; Zhu, S.; Chen, X. Online quality optimization of the injection molding process via digital image processing and model-free optimization. J. Mater. Process. Technol. 2015, 226, 85–98. [Google Scholar] [CrossRef]
  17. Ozcelik, B.; Erzurumlu, T. Comparison of the warpage optimization in the plastic injection molding using ANOVA, neural network model and genetic algorithm. J. Mater. Process. Technol. 2006, 171, 437–445. [Google Scholar] [CrossRef]
  18. Liu, C.; Manzione, L.T. Process Studies in Precision Injection Moulding I: Process Parameters and Precision. Polym. Eng. Sci. 1996, 36, 1–9. [Google Scholar] [CrossRef]
  19. Moldflow Synergy; Autodesk: San Rafael, CA, USA, 2017.
  20. Dansk Standards-ISO. 15530-3 Geometrical Product Specifications (GPS)—Coordinate Measuring Machines (CMM)—Technique for Determining the Uncertainty of Measurement—Part 3: Use of Calibrated Workpieces or Measurements Standards. 2011. Available online: https://www.ds.dk/en/standards/buy-standards (accessed on 8 October 2018).
  21. Gasparin, S.; Hansen, H.N.; Tosello, G. Traceable surface characterization using replica moulding technology. In Proceedings of the 13th International Conference on Metrology and Properties of Engineering Surfaces, Lyngby, Denmark, 12–15 April 2011; pp. 310–315. [Google Scholar]
  22. Giannekas, N.; Gammelby, R.; Tosello, G.; Tcherniak, D.; Zhang, Y. Feasibility study on integrated process/product quality assurance framework for precision injection moulding based on vibration monitoring. In Proceedings of the Euspen’s 17th International Conference & Exhibition, Hannover, Germany, 29 May–2 June 2017; pp. 508–509. [Google Scholar]
  23. Gajic, Z. Correlation of Discrete-Time Signals. In Linear Dynamic Systems and Signals; Prentice Hall: Englewood Cliffs, NJ, USA, 2003; pp. 90–100. [Google Scholar]
  24. Chen, H.; Li, Y.; Wu, Z. Dynamic time warping distance method for similarity test of multipoint ground motion field. Math. Probl. Eng. 2010, 2010. [Google Scholar] [CrossRef]
  25. Sakoe, H.; Chiba, S. Dynamic Programming Algorithm Optimization for Spoken Word Recognition. IEEE Trans. Acoust. 1978, 26, 43–49. [Google Scholar] [CrossRef]
  26. Sanguansat, P. Multiple Multidimensional Sequence Alignment Using Generalized Dynamic Time Warping. WSEAS Trans. Math. 2012, 11, 668–678. [Google Scholar]
  27. Lee Rodgers, J.; Nicewander, W.A. Thirteen ways to look at the correlation coefficient. Am. Stat. 1988, 42, 59–66. [Google Scholar] [CrossRef]
Figure 1. Half section view (a) and ¾ views of the movable (b) and stationary (c) sides of the mold used for the experiment.
Jmmp 02 00079 g001
Figure 2. The micro pillars’ feature shape and the dimensions of the parts.
Jmmp 02 00079 g002
Figure 3. Molded geometry with fingerprint structures on the part and runners (a,b), and measurement positions on Cavity 1 (c) and Cavity 2 (d).
Jmmp 02 00079 g003
Figure 4. (a) Molded component with fingerprint structures on the part and runners. The fingerprints at the front (top) and back (bottom) side of the components are visible. (b) Bottom (Cavity 1) and (c) top (Cavity 2) parts of the microfluidic system.
Jmmp 02 00079 g004
Figure 5. (a) PvT and (b) viscosity plots of material Styrolution Terluran GP-35 (Acrylonitrile Butadiene Styrene—ABS) [19].
Jmmp 02 00079 g005
Figure 6. Flow diagram of the experimental sequence. The figure denotes the measurement areas on the part (i.e., PP1 = Part Position 1) and on the runner (i.e., RP2 = Runner Position 2) without the indication of cavity as seen in the text (i.e., Cavity 2 RP2 = C2RP2)
Jmmp 02 00079 g006
Figure 7. (a) SEM 3D image of the pillars and (bd) pillar height measurement procedure, (b) step 1: extracting cros-section profiles, (c) step 2: assessing pillar height from the four extracted profiles as indicated by different color, and (d) 3D representation of the pillar [5].
Jmmp 02 00079 g007
Figure 8. Alignment error ε(t) and Shift error.
Jmmp 02 00079 g008
Figure 9. Signals of injection speed and pressure from part cycles 1, 5, and 10 of Run-1 before (top) and after cross correlation alignment (bottom).
Jmmp 02 00079 g009
Figure 10. Representation of work deviation, given by the non-intersecting area of signals y0(t) and yi(t).
Jmmp 02 00079 g010
Figure 11. Alignment of original (top) and cross-correlated (bottom) signals of injection speed and pressure of Run 1 and part c ycles 1, 5, and 10 using dynamic time warping (DTW).
Jmmp 02 00079 g011
Figure 12. Average pillar height and Upart measurement uncertainty per position on the part for Cavities 1 and 2 parts. The x-axis here represents the experimental DOE runs (R1 for Run 1) as presented in Table 1.
Jmmp 02 00079 g012
Figure 13. Comparison of average pillar height deviation (mold-part) per position for Cavities 1 and 2.
Jmmp 02 00079 g013
Figure 14. Influence of IM process on the eight measurand deviations (from mold values) and “product fingerprints candidates”. (a) Position PP1 in Cavities 1 and 2, (b) position PP2 in Cavities 1 and 2, (c) position PP3 in Cavities 1 and 2, (d) position RP2 in Cavities 1 and 2. The figure presents the main effects (left column) and the Pareto graphs (right column), with a schematic representation of the measurement areas to be provided at the top. The error bars in the main effect’s plots represent the measurement uncertainty from the dataset of the respective product fingerprint (Table 6).
Jmmp 02 00079 g014
Figure 15. Pearson correlation coefficient plots of measurands to the pillar “product fingerprint” positioned on the runner of the molding (a) in Cavity 1 and (b) in Cavity 2. A perfect correlation | ρ | = 1 exists only for combinations of the same dataset.
Jmmp 02 00079 g015
Figure 16. Example of process fingerprint candidates to measurand trends for experimental run 16 based on (a) nominal signals and (b) cross correlated signals. The legend of the graphs denotes both the measurand datasets (i.e., C1PP1: Cavity 1–Position PP1) and the deviation based (Type 1) “process fingerprints”.
Jmmp 02 00079 g016
Figure 17. Process fingerprint candidate trend occurrence per Run.
Jmmp 02 00079 g017
Figure 18. Pearson correlation coefficient plots of measurands to the pillar “product fingerprint” positioned on the runner of the molding (a) in Cavity 1 and (b) in Cavity 2.
Jmmp 02 00079 g018
Table 1. Experimental Parameters.
Run
ParameterUnit12345678910111213141516
Tm[°C]220260220260220260220260220260220260220260220260
Tmld[°C]40406060404060604040606040406060
InjSp[mm/s]100100100100140140140140100100100100140140140140
PackPr[bar]440440440440440440440440540540540540540540540540
Table 2. Alicona measurement settings for μ-pillars.
Measurement Settings
Objective×20
Exposure3.05 ms
Contrast1.11
Vertical resolution299 nm
Table 3. Uncertainty contribution for pillar height measurements.
Uncertainty ContributionsMold InsertsParts
Cavity 1Cavity 2Cavity 1Cavity 2
ucal [μm]0.10.10.10.1
uth [μm]0.0030.0030.0030.003
ub [μm]0.0340.0340.0340.034
uppart [μm]--0.26–0.970.22–0.95
umold [μm]0.11–0.120.13–0.79--
Table 4. Expanded uncertainty for single pillar height and height deviations measurements.
Expanded UncertaintiesMold InsertsParts
Cavity 1Cavity 2Cavity 1Cavity 2
Upart [μm]--0.54–1.940.45–1.91
Umold [μm]0.25–0.260.29–1.58--
Udev [μm]0.54–3.92
Table 5. Expanded uncertainty for pillar height and height deviations measurements per Run.
Expanded Uncertainties per Run (Uexp [μm])
R1R2R3R4R5R6R7R8R9R10R11R12R13R14R15R16
Cavity 1
Upart1.041.100.770.881.420.841.941.870.551.400.741.431.051.290.761.02
Udev1.651.741.771.861.861.772.091.691.981.952.021.832.491.681.802.28
Cavity 2
Upart 1.041.100.790.971.420.841.941.871.181.401.241.431.911.290.851.64
Udev1.651.741.771.861.861.772.091.691.981.952.021.832.491.681.802.28
Table 6. Measurement uncertainty of the main effects (Ume) per parameter level.
Ume. per Run-Cavity 1
Tm [°C]Tmld [°C]InjSp [mm/s]PackPr [bar]
PositionUnit2202604060100140440540
PP1[μm]5.63.63.93.83.03.83.23.0
PP2[μm]5.72.25.14.26.20.83.55.7
PP3[μm]16.01.813.313.317.33.212.614.0
RP2[μm]27.521.523.925.626.221.027.221.8
Ume. per Run-Cavity 2
Tm [°C]Tmld [°C]InjSp [mm/s]PackPr [bar]
PositionUnit2202604060100140440540
PP1[μm]3.13.23.23.03.13.23.23.1
PP2[μm]3.74.33.94.13.94.24.03.9
PP3[μm]3.73.23.13.53.43.33.43.3
RP2[μm]46.821.837.339.432.83.735.241.3

