Investigating the Effects of Annealing on the Mechanical Properties of FFF-Printed Thermoplastics


School of Engineering & Built Environment, Anglia Ruskin University, Chelmsford CM1 1SQ, UK
*
Author to whom correspondence should be addressed.
J. Manuf. Mater. Process. 2020, 4(2), 38; https://doi.org/10.3390/jmmp4020038
Submission received: 27 March 2020
/
Revised: 25 April 2020
/
Accepted: 27 April 2020
/
Published: 28 April 2020
Abstract
:Fused filament fabrication (FFF) is a cost-effective additive manufacturing method that makes use of thermoplastics to produce customised products. However, there are several limitations associated with FFF that are adversely affecting its growth including variety of materials, rough surface finish and poor mechanical properties. This has resulted in the development of metal-infused thermoplastics that can provide better properties. Furthermore, FFF-printed parts can be subjected to post-processes to improve their surface finish and mechanical properties. This work takes into consideration two commonly used polymeric materials, i.e., ABS (acrylonitrile butadiene styrene) and PLA (polylactic acid) and compares the results with two metal-infused thermoplastics i.e., copper-enhanced PLA and aluminium-enhanced ASA (acrylonitrile styrene acrylate). The four different materials were subjected to a post-process called annealing to enhance their mechanical properties. The effect of annealing on these four materials was investigated through dimensional analysis, ultrasonic testing, tensile testing, microstructural analysis and hardness testing. The results showed that annealing affects the materials differently. However, a correlation among ultrasonic testing, tensile testing and microstructural analysis was observed for all the materials based on their crystallinity. It was found that the semi-crystalline materials (i.e., PLA and copper enhanced PLA) showed a considerable increase in tensile strength post-annealing. However, the amorphous materials (ABS and aluminium-enhanced ASA) showed a comparatively lower increase in tensile strength, demonstrating that they were less receptive to annealing. These results were supported by higher transmission times and a high percentage of voids in the amorphous materials. The highest hardness values were observed for the ASA material and the lowest for the ABS material. This work provides a good comparison for the metal-infused thermoplastics and their applicability with the commonly used PLA and ABS materials.

1. Introduction
The production of customised products at low costs and required mechanical properties is in demand as it leads to higher customer satisfaction and profits for manufacturers. The impact of additive manufacturing (AM) in this context is undeniable as the key features of these methods include customisation, design freedom and cost-effectiveness. There are seven main categories of AM; vat photopolymerization, powder bed fusion, binder jetting, material jetting, sheet lamination, material extrusion and directed energy deposition [1,2,3]. These technologies can work with different materials (e.g., metals, polymers, ceramics) to manufacture customised products. However, most of these AM systems are expensive and require considerable knowledge to achieve the desired results from the products. One of the most commonly used and cost-effective methods is called fused deposition modelling (FDM), a trademark of Stratasys, or fused filament fabrication (FFF). This process works on the principle of material extrusion using thermoplastics. Materials, in the form of filaments, are heated and extruded out of a nozzle onto a build plate to manufacture a product. Different materials such as PLA (polylactic acid), ABS (acrylonitrile butadiene styrene), ASA (acrylonitrile styrene acrylate), PEEK (polyether ether ketone), nylon, PET (polyethylene terephthalate) and ultem can be used with FFF. These materials can manufacture products that can be used for several engineering applications. In addition to these materials, the manufacture of composites using FFF has also been widely researched due to the ease of modifications in software and hardware for FFF systems [4,5,6]. These efforts have resulted in the development of functional electronics [7,8] and composites with superior mechanical properties [9,10]. This has also led to the development of metal-infused filaments for FFF that can provide the aesthetics and a relative increase in mechanical properties compared to conventional FFF materials. PLA and ABS are commonly used materials for experimentation by researchers to manufacture composites via FFF [11,12]. ASA is also gradually gaining attention due to its superior properties for composite production using FFF [13].
PLA is a biodegradable thermoplastic that is sourced from natural starches such as corn and sugarcane. It is one of the most widely used materials for FFF systems along with ABS. It is a semi-crystalline polymer and is used in a multitude of applications ranging from compost bags and food packaging to disposable cups and bags. The other popular thermoplastic for FFF is ABS. This is an amorphous polymer and is comparatively harder to print than PLA. ABS is also more suitable for high-temperature applications (due to a glass transition temperature of 105 °C) compared to PLA. ABS is prone to warping when printing large parts and discoloration after prolonged exposure to harsh environments. This has led to the development of an ‘advanced ABS’ known as ASA. This material matches or exceeds the mechanical properties of standard ABS and has greater heat resistance. Moreover, ASA demonstrates exceptional UV (ultraviolet) stability and, with its matte finish, offers excellent aesthetics for FFF thermoplastic products.
Metal-infused filaments contain a high percentage of the metal as compared to plastic. An example is copper-enhanced PLA that is being used in this research. Due to the inclusion of metal powder, this filament is three times denser than PLA. That is why the parts made with copper-enhanced PLA material are relatively heavier. The main advantage of working with metal-infused filaments is that the final product can have a metallic finish but unfortunately it requires extensive post-processing (e.g., metal polishing, spray painting). These materials help to achieve the aesthetics of metal prints at an affordable cost compared to commercial metal AM systems such as direct metal laser sintering and electron beam melting. On the other hand, these materials have their own set of challenges and are difficult to print with FFF systems as they require specialized components such as a wear-resistant nozzle. Retractions can also be an issue resulting in print sections with blobs where the extruder starts and stops the extrusion process. Metal filled filaments are quite heavy and that limits their bridging performance. When the molten material is extruded across either side of the bridge, the excessive drooping could lead to breakage before the completion of the bridge. This limits the complexity of the products that can be printed using metal-infused filaments. FFF generally requires optimization of process parameters and metal enhanced filaments require additional precautions that can result in longer processing and maintenance times.
FFF-printed parts can be subjected to various post-processes to enhance mechanical properties and surface finish. They include but are not limited to sanding, gap filling, polishing, vapor smoothing, annealing, epoxy coating and metal plating. Annealing is a popular post-process to enhance the mechanical strength and increase the percentage of crystallinity in FFF parts [14]. In FFF, a material is heated to be extruded out of a nozzle and then cooled rapidly, often in an uneven manner. Uneven cooling due to poor heat conduction of the polymer results in the shrinkage of the layers. This, in turn, causes different tensile and compression forces to build up in the polymer structure. Annealing involves gently reheating the material to its glass transition temperature or just above, but below its melting temperature, holding there for a specified time and then slowly allowing it to cool. This reheating and extended cooling increases the amount of large crystalline structures in the polymer and redistributes the stresses within the printed part leading to higher crystallinity, strength and stiffness [15,16].
Several researchers have analysed the effect of different annealing times and temperatures on thermoplastic materials. Beniak et al. [17] conducted tensile and compressive testing on FDM-printed volcano PLA. They subjected the material to the annealing temperature of 110 °C at 20 min and 60 min to analyse the effect on tensile and compressive strength. The results showed increased compressive strength and reduced elongation for the samples post-annealing. Slavković et al. [18] annealed PLA shape memory polymer at 75 °C and observed increased tensile and compressive strength compared to unannealed samples. They attributed annealing to increased crystallinity, reduced residual stress and better inter-layer bonding. Singh et al. [19] used an annealing-based heat treatment method to improve the surface characteristics of FDM-printed ABS parts. They showed that heating ABS above its glass transition temperature has resulted in material re-flow leading to reduced porosity and interlayer gaps. Furthermore, they predicted the tensile strength, flexural strength and Charpy impact strength using the Taguchi method with errors less than 2%. Wach et al. [20] printed PLA by FDM and annealed it over its glass transition temperature to achieve higher crystallinity as measured by the differential scanning calorimetry and confirmed by X-ray diffraction. They also observed an increase of 11%–17% in the flexural stress of the PLA parts due to increased crystallinity showing a direct correlation between mechanical properties and material crystallinity. The work presented in this paper also builds on this phenomenon of linking the degree of crystallinity with mechanical properties. The literature clearly shows that annealing results in increased crystallinity of FDM-printed parts. The degree of increase depends on annealing temperatures, annealing times, cooling methods (water quenched or air cooled) and cooling times.
In addition to the positive effects of annealing on the mechanical properties of thermoplastics, different operating parameters can also provide favorable results. Factors such as layer thickness, raster angle, build orientation, print speed, nozzle and bed temperatures etc., can significantly alter the properties of the parts made by FFF. Extensive research is available that highlights efforts to optimize the process parameters. Somireddy, Singh, and Czekanski [21] investigated the influence of the mesostructure on the overall mechanical behavior of FFF-printed parts for tensile and bending tests. They treated the printed parts as laminates and characterized them using laminate mechanics as well as laminate theory. They concluded that the process parameters (such as layer thickness and layup order) significantly affect the material properties of the FFF-printed parts. Rodríguez-Panes, Claver and Camacho [22] analysed the effect of layer height, infill density and layer orientation of PLA and ABS samples. They showed that the effect of infill percentage was more noticeable in PLA than ABS, making PLA highly suitable for use in additive technologies. García-Domínguez, Claver, and Camacho [23] experimented with solid infill considering two build orientations for ABS. Their comparison with non-solid specimens showed that the increase of strength due to the infill is not in the same proportion to the percentage of infill. These examples show the need for optimization of process parameters to achieve high quality products from FFF. This is why the use of experimental approaches and predictive techniques is becoming exceedingly prevalent to characterize the mechanical properties of FFF-printed parts [24]. Considering this discussion, this paper aims to provide a comparative account of metal-infused thermoplastics (copper–enhanced PLA and aluminium–enhanced ASA) and their applicability with widely used PLA and ABS materials. The focus is on the use of annealing to assess its effect on the physical and mechanical properties of the FFF-printed samples.
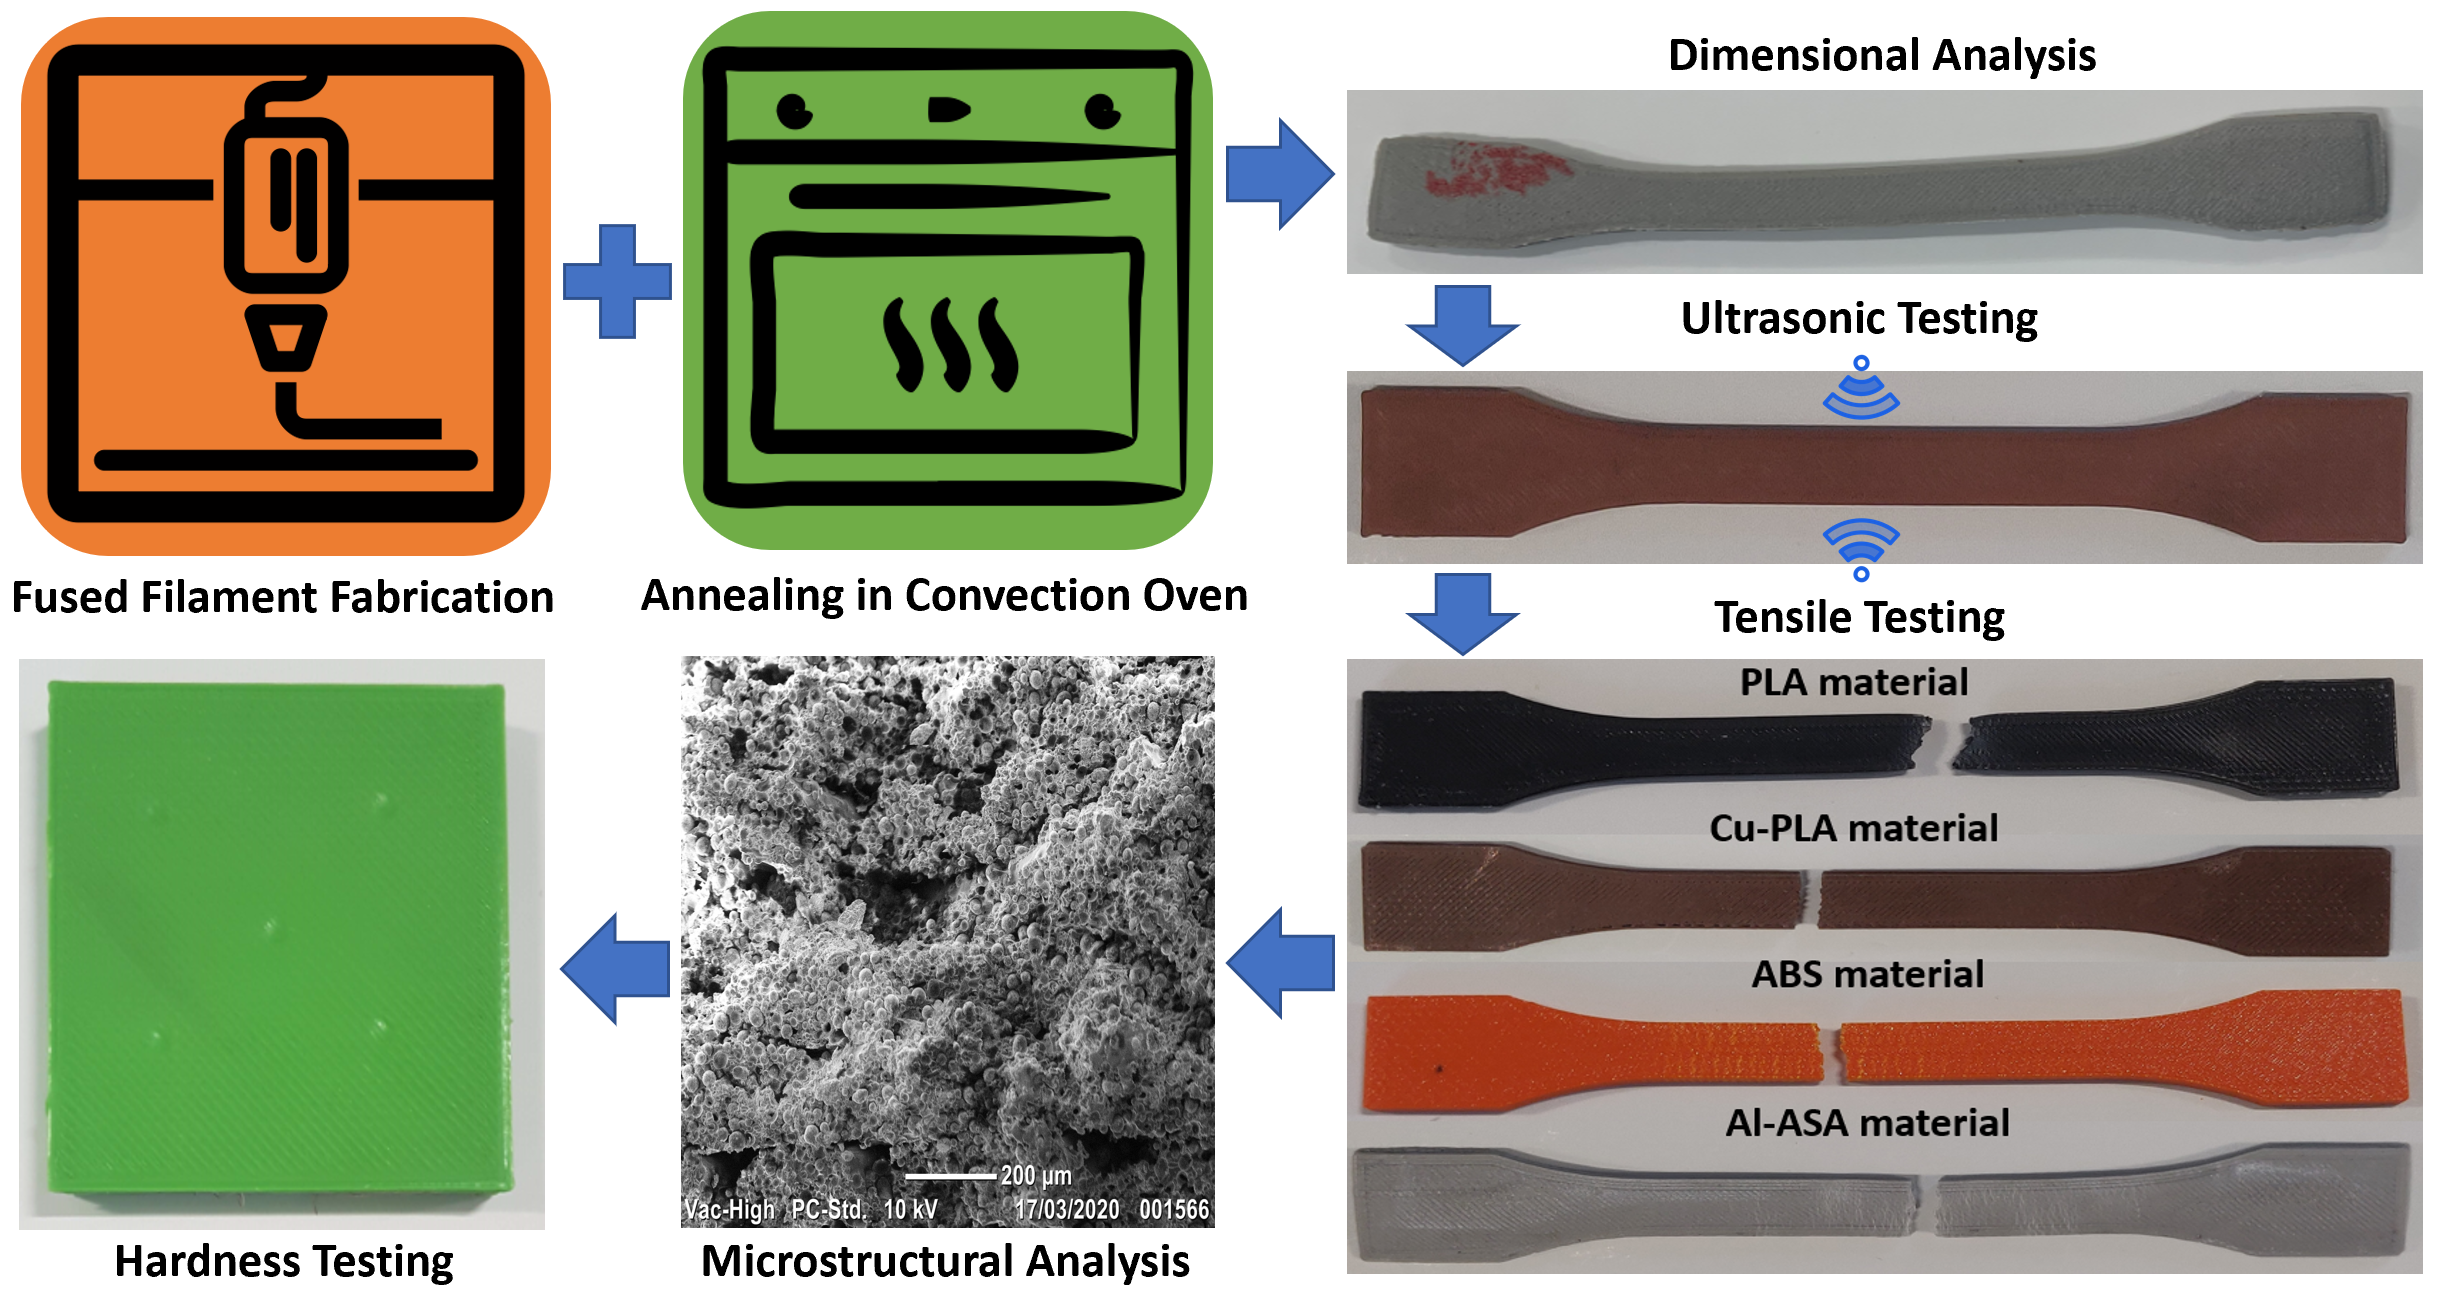
2. Materials and Manufacturing Process
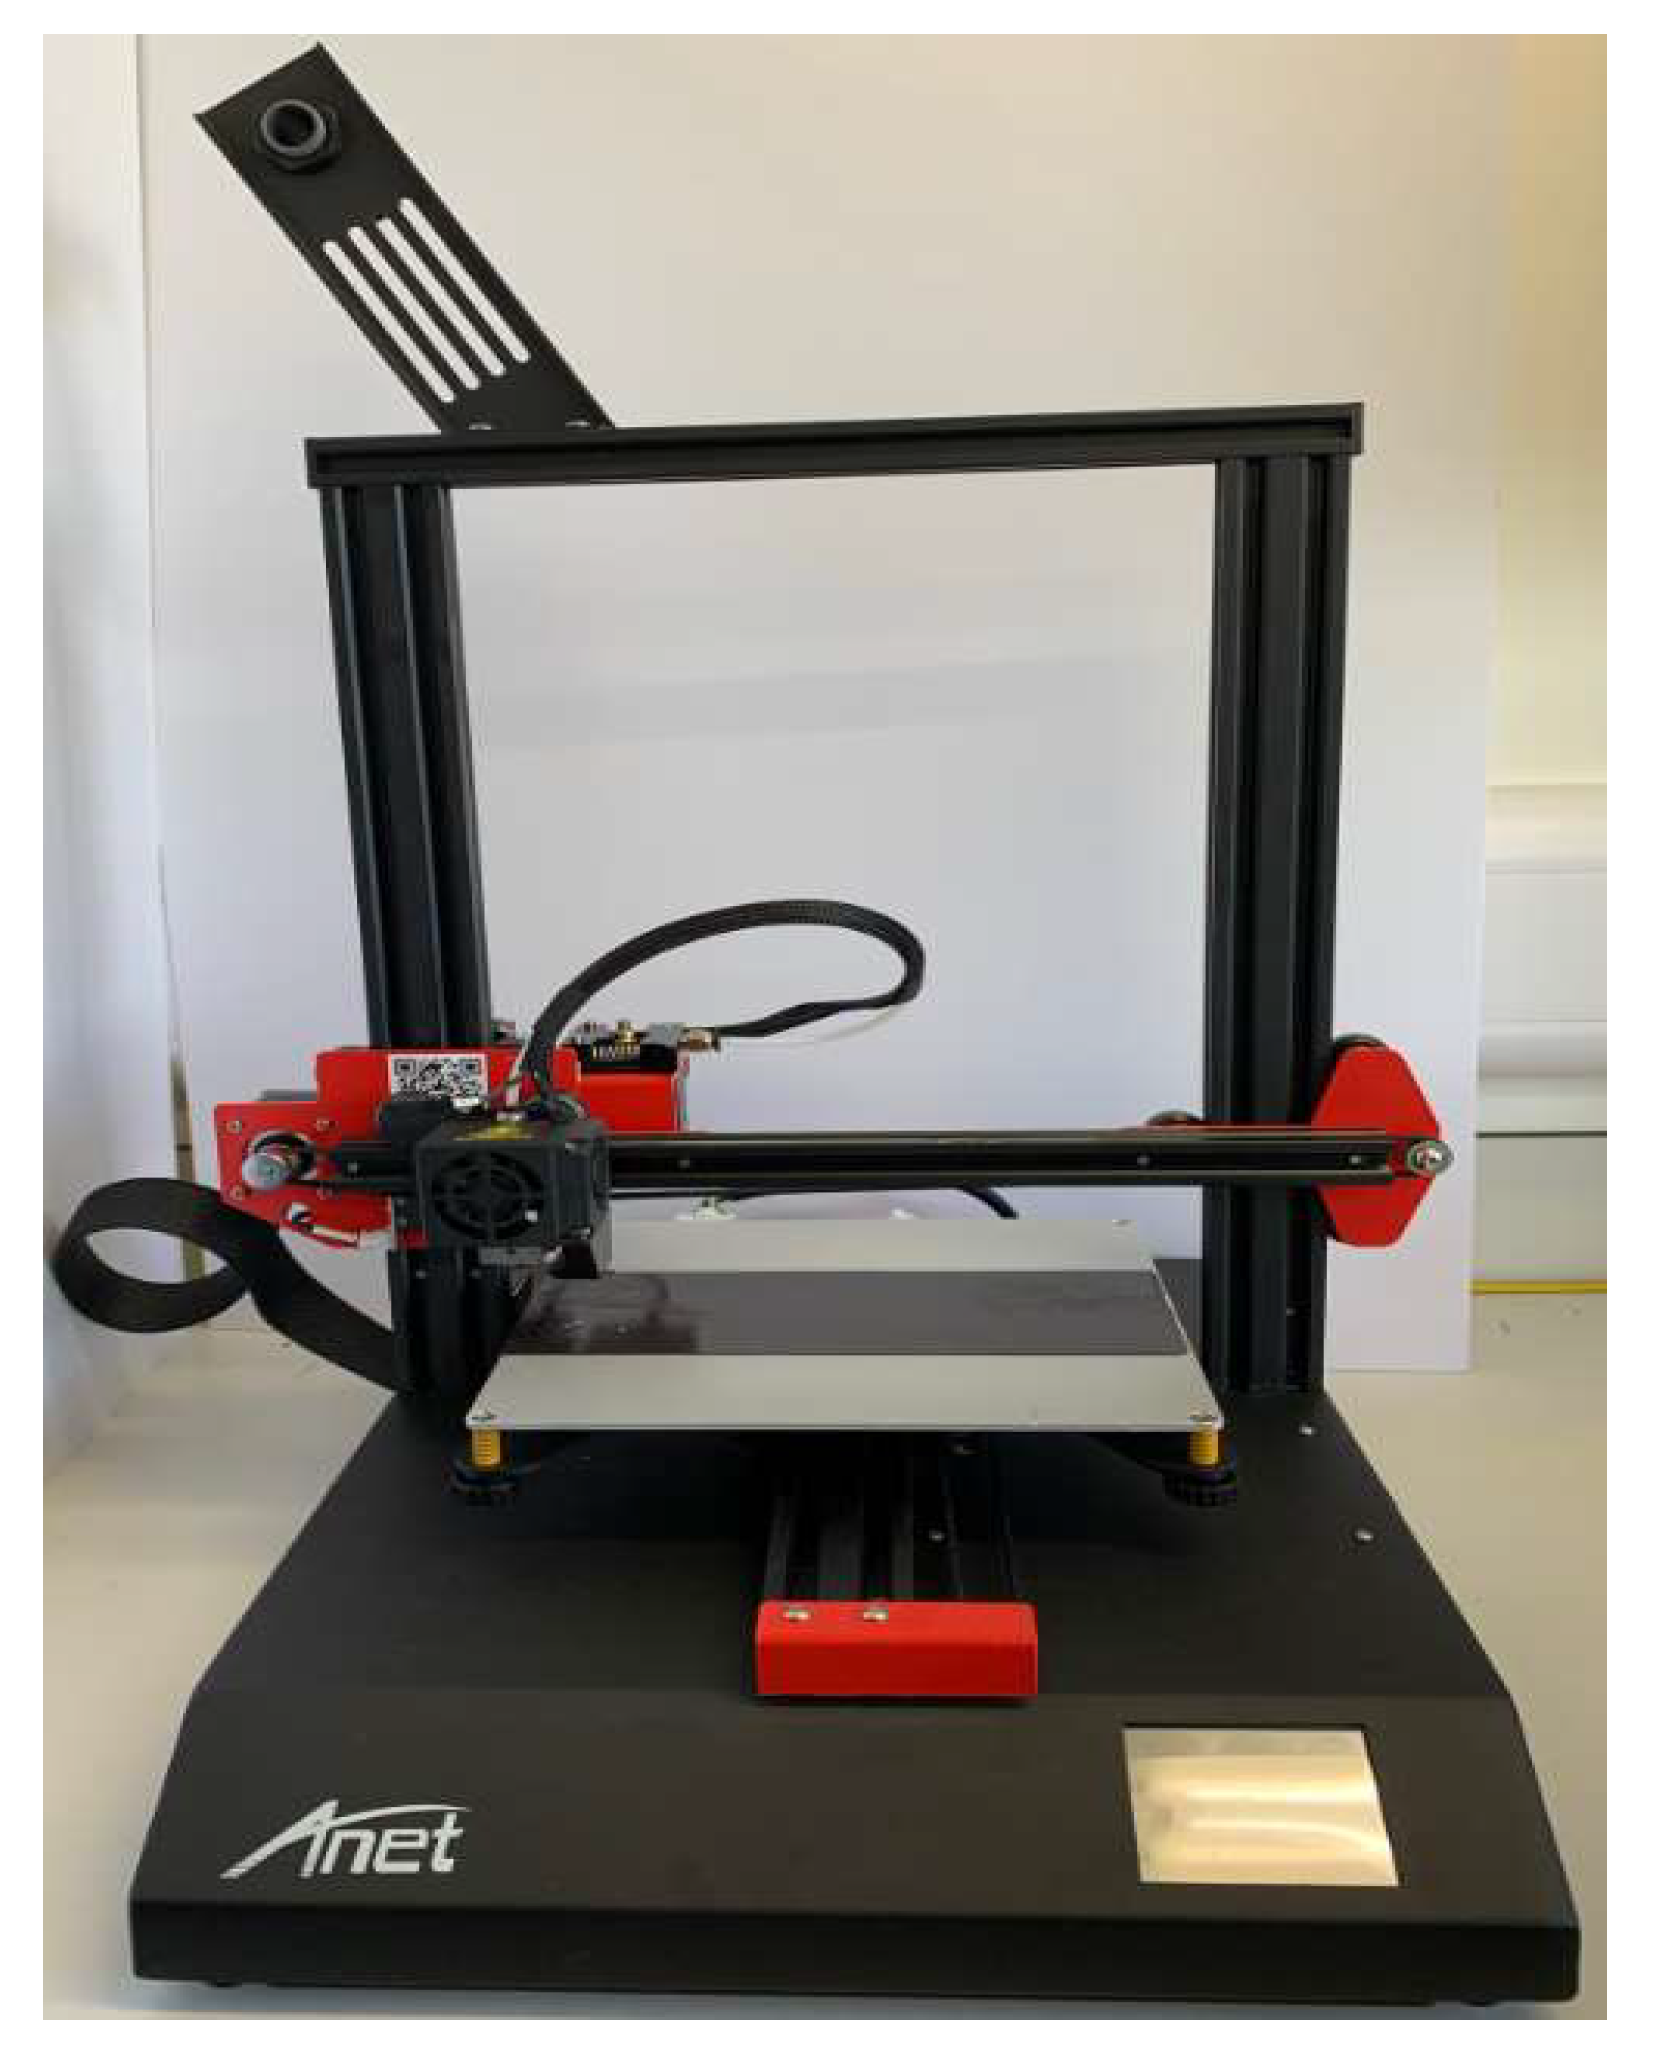
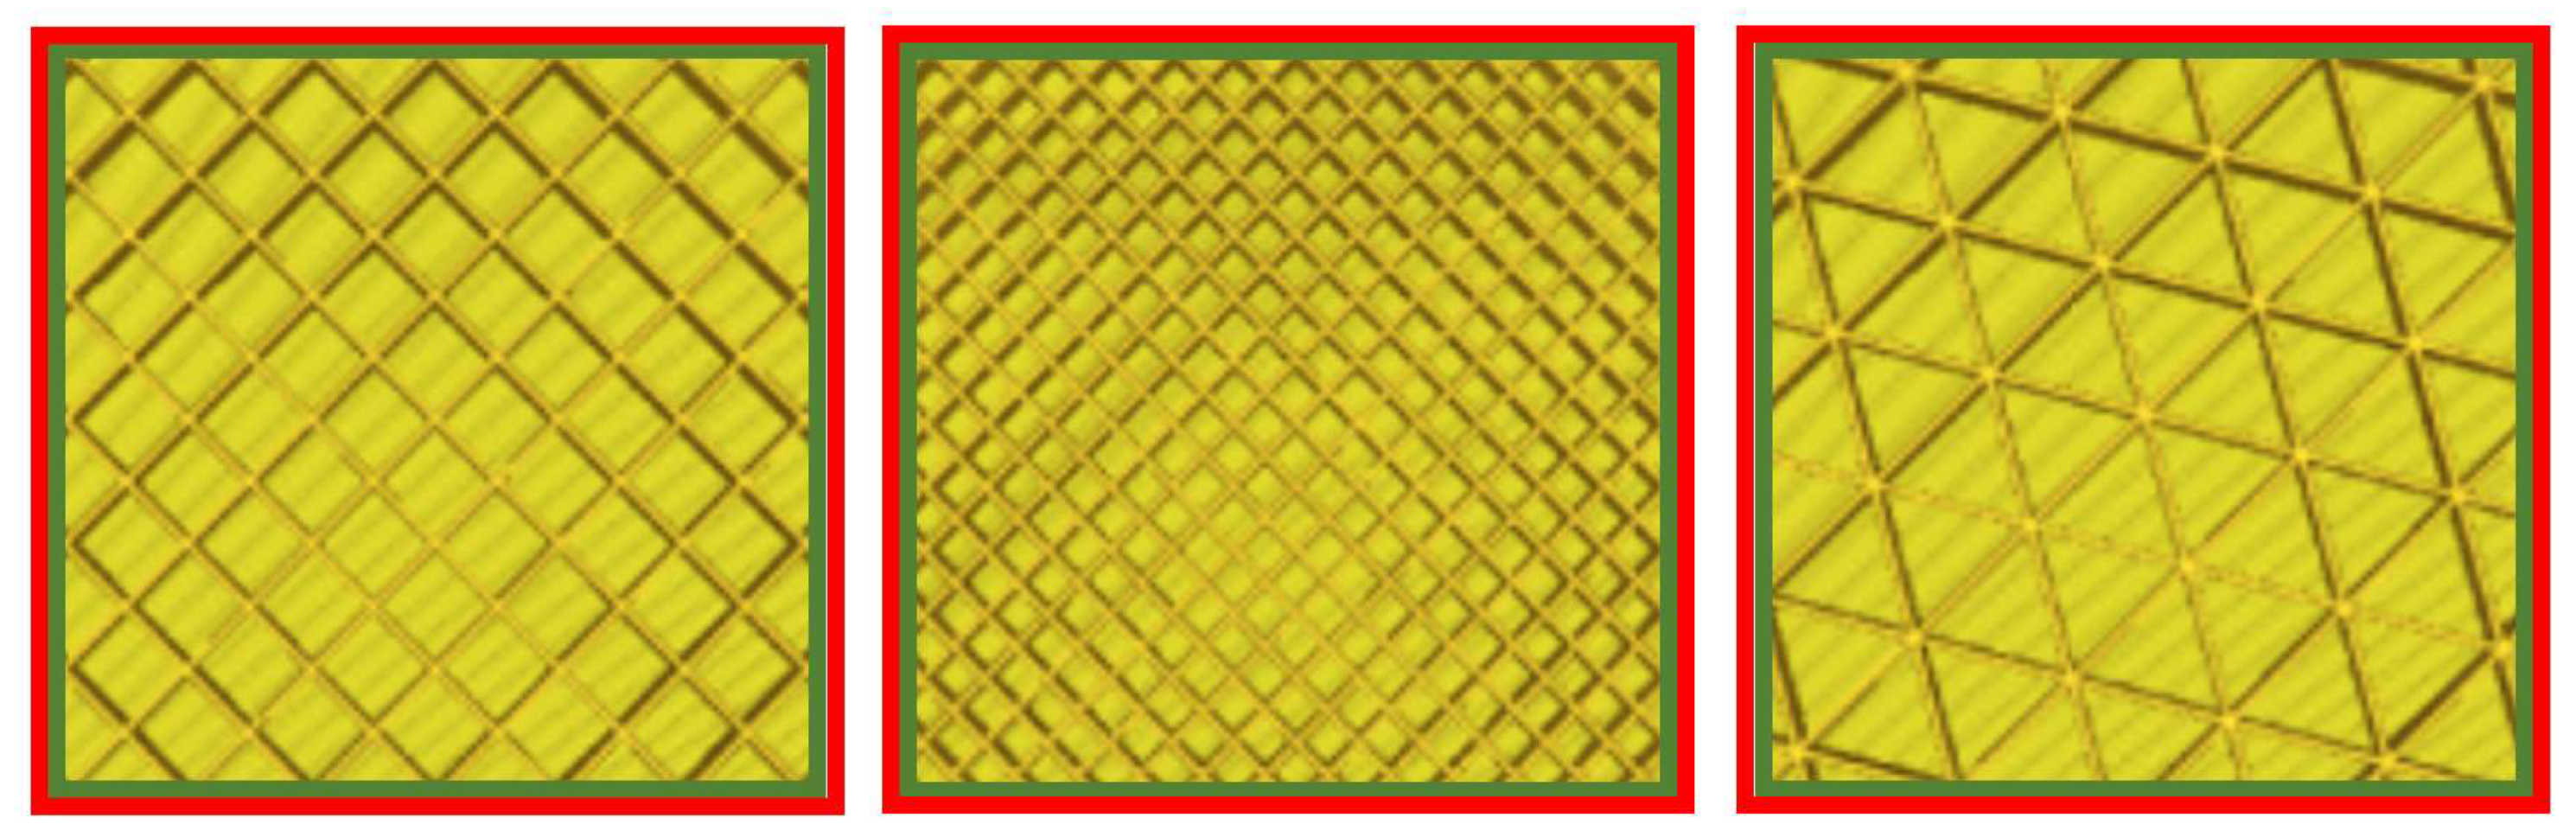
A low-cost desktop 3D printer called Anet® ET4 Pro (from Shenzen Anet Technology Company Limited, Hong Kong, China) was used to produce samples according to British and international standards. The printer had a build platform of 220 mm × 220 mm × 250 mm (X × Y × Z) and an extruder nozzle diameter of 0.4 mm (shown in Figure 1). Four different materials were used to manufacture samples for tensile, hardness and ultrasonic testing. All of them were purchased from 3D FilaPrint, Essex, UK and include 3D Filaprint PLA, FilaPrint metal copper PLA (80% metal content), 3D Filaprint ABS, ASA extrafill aluminium (80% metal content). From here onwards, these materials will be referred to as PLA, Cu-PLA, ABS and Al-ASA, respectively. As with any other FFF-based 3D printer, the 3D CAD model of the part to be built was sent to a slicing software package. This work made use of an open-source package called Ultimaker Cura 4.5.0 that began the build operation. All the samples were printed with a layer thickness of 0.2 mm, infill of 100%, infill pattern of ‘Lines’ and print speed of 60 mm/s. This infill pattern creates a grid-shaped infill, printing in one diagonal direction per layer as shown in Figure 2. Other process parameters can be optimized to achieve better results, e.g., choosing a different infill pattern (such as grid, quarter cubic, triangles, concentric), increasing the thickness of the top as well as bottom layers, layer thickness, raster angle and build orientation [25,26]. Optimization of 3D printing parameters is a complex process; therefore, the build process was kept simple to ensure consistent results promptly. For statistical accuracy, a total of five samples were tested for each of the different materials.
After building the parts for testing, they were subjected to a post-process called annealing. The samples were placed in a laboratory convection oven from CONTROLS Group (Milano, Italy) at a specified temperature for one hour. After the time had elapsed, the oven was turned off and the samples were cooled inside for two hours. The oven was not opened during this time, to allow for the gradual cooling of the samples. A convective oven circulates heated air around an object, providing a 360° heat source that produces more uniform results compared to gas-fired or electric ovens. The temperatures chosen for the different materials were based on their glass transition temperatures and three different values were used for analysis. Table 1 shows the parameters used for the build operation and the annealing process. It is to be noted that different nozzles and bed temperatures can affect the properties of the materials. Therefore, values recommended by the material datasheets have been used in this work.
3. Experimental Methodology
3.1. Dimensional Analysis
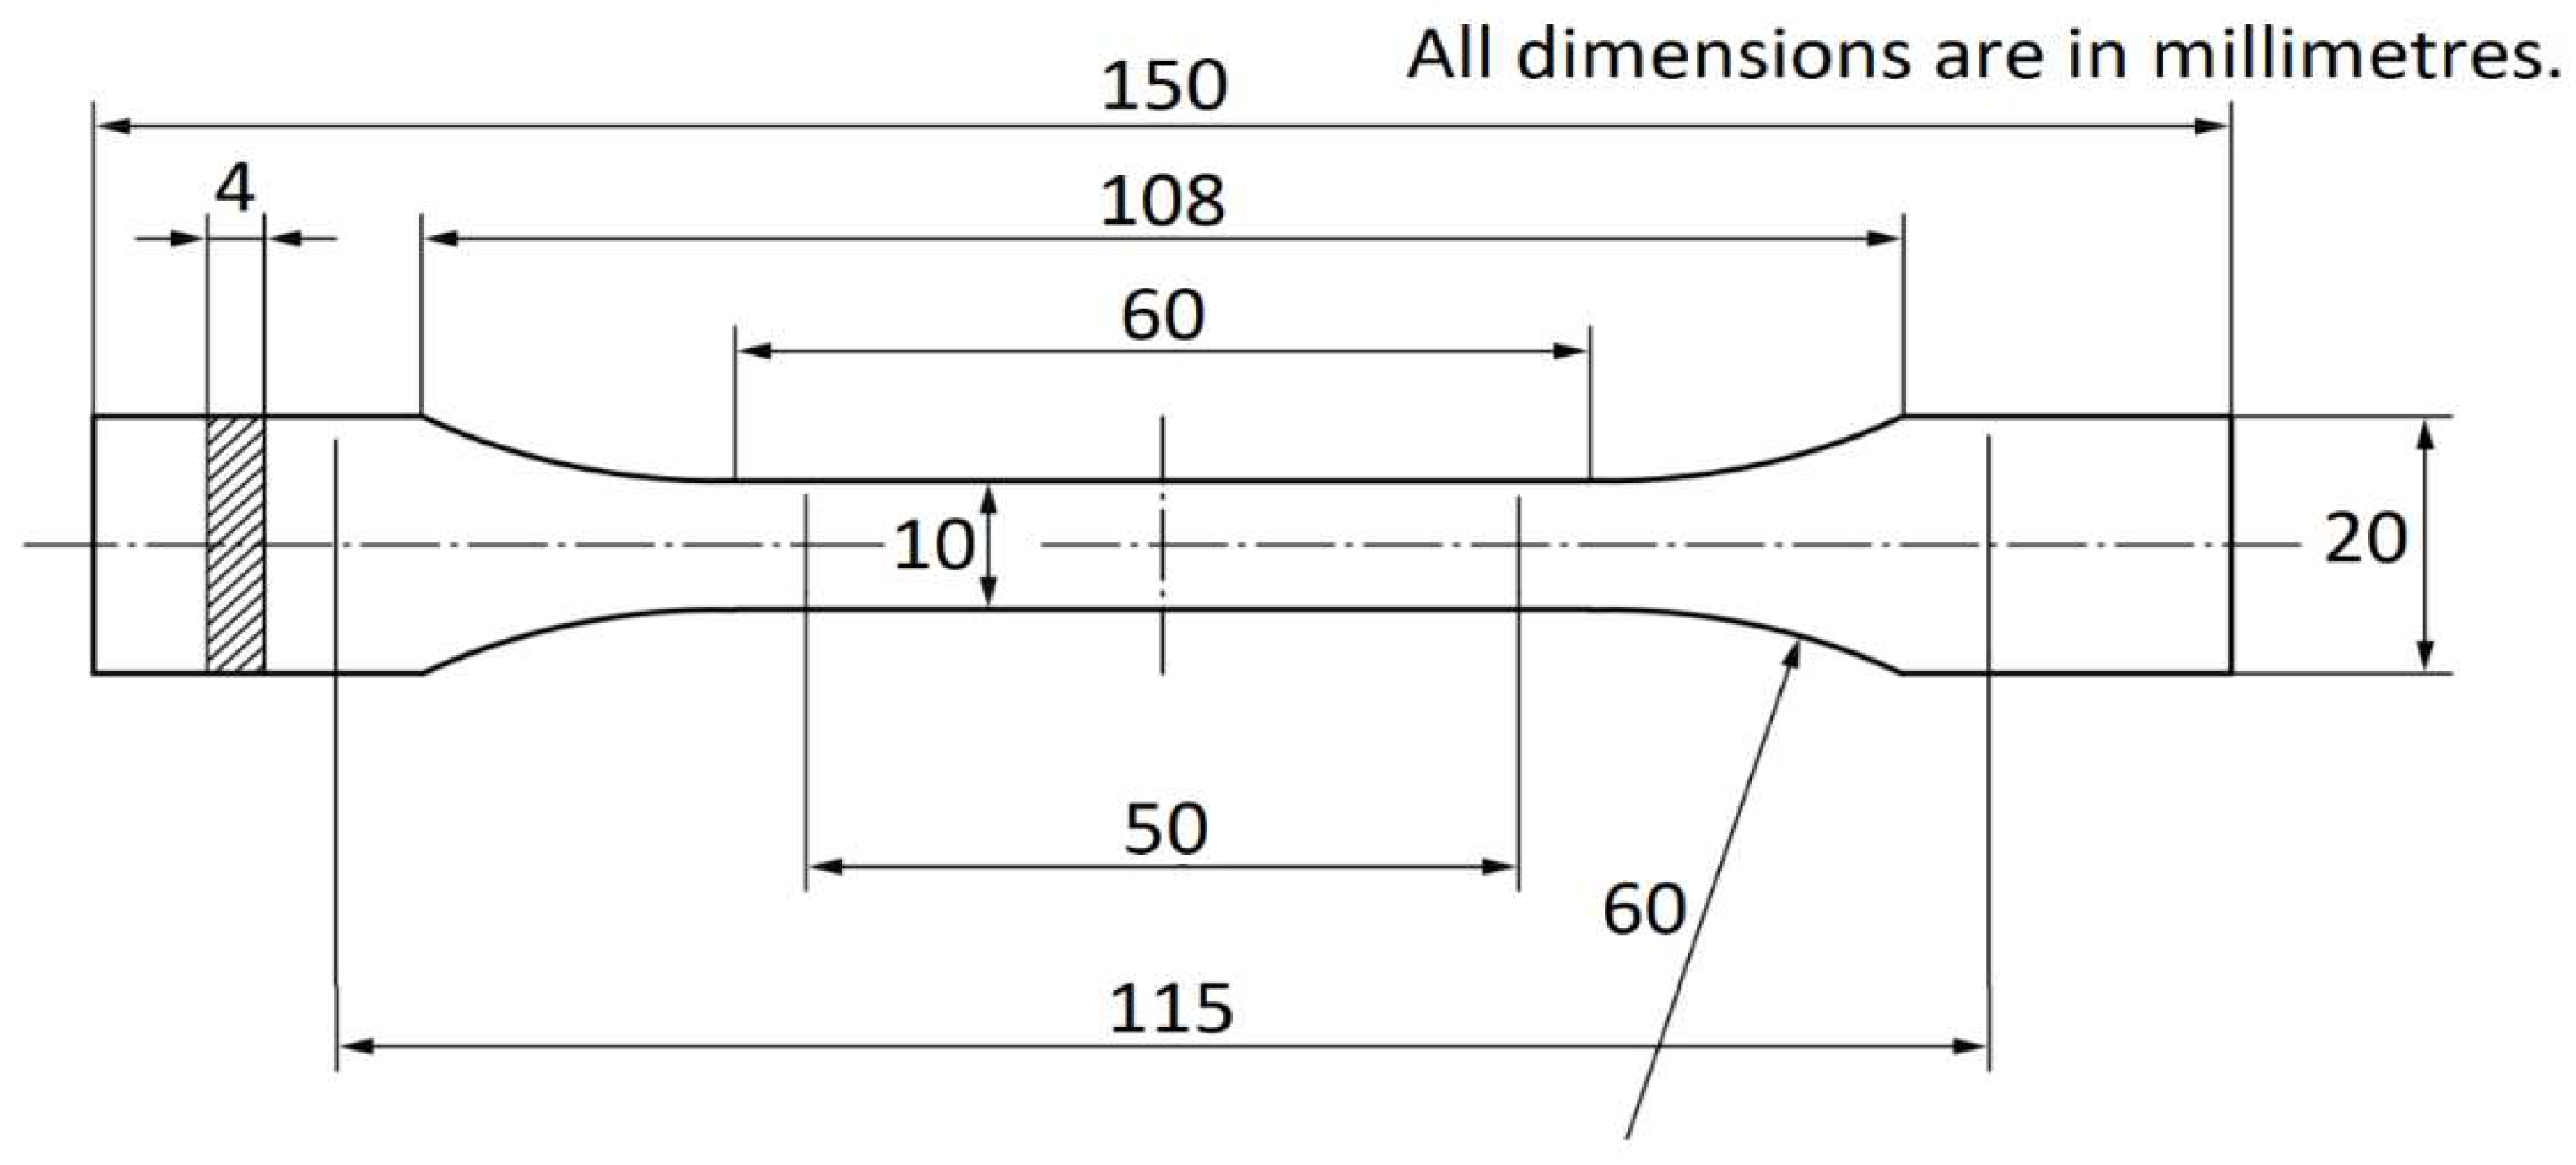
FFF-printed samples are prone to warping [27] due to the nature of the process and are also affected by the dimensional precision of the printing system (Anet ET4 has a precision of ± 0.1 mm). Annealing could also lead to shrinkage and expansion [28] in any of the three axes (X, Y, and Z). Therefore, it is crucial to compare the dimensions of the FFF-printed sample before and after annealing. A Vernier calliper was used to measure the dimensions of the samples. Keeping in mind that the samples will be subjected to tensile testing afterward, they were manufactured according to BS EN ISO 527-2:2012 [29]. The dimensions of the samples are given in Figure 3.
3.2. Ultrasonic Testing
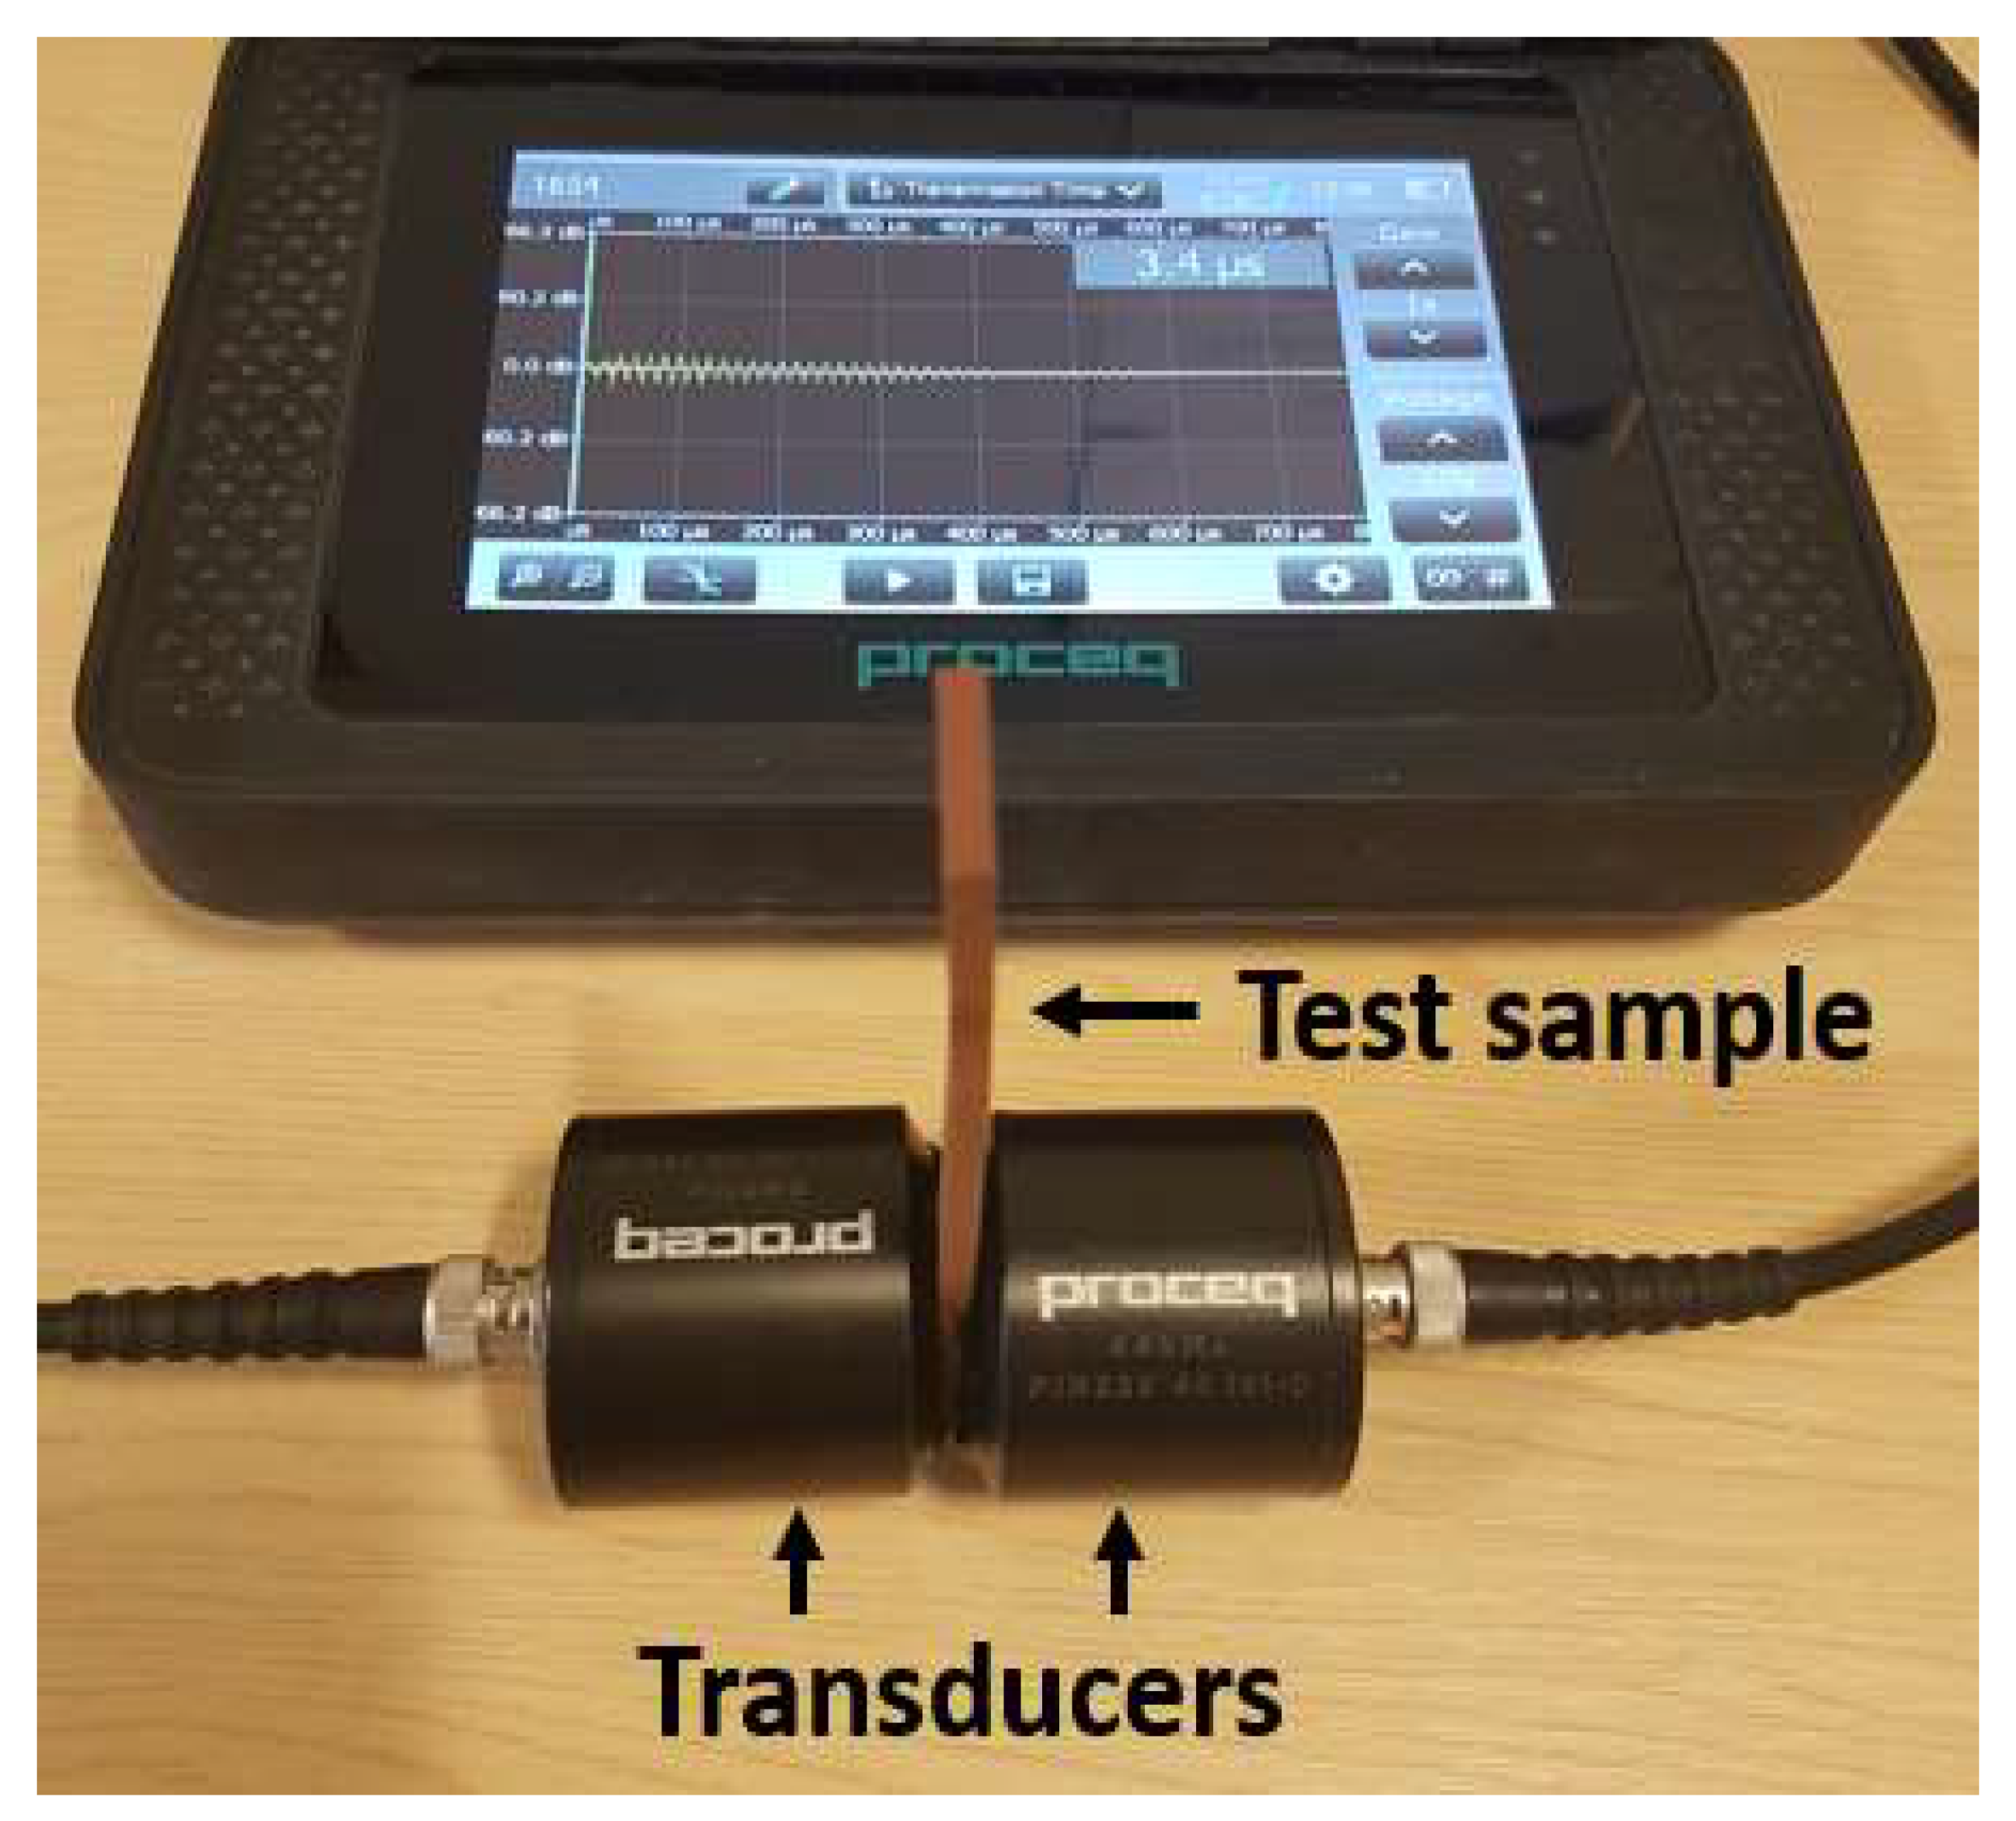
After dimensional analysis, the dog-bone samples were also subjected to ultrasonic testing before and after annealing. This is a non-destructive test (NDT) that makes use of high-frequency sound waves to detect flaws and defects in products as well as take measurements, e.g., thickness. Since annealing is used to relieve internal stresses, this test will help to quantify that reduction. Proceq PUNDIT® PL-200 was used for the test that comprises two transducers (54 kHz) as shown in Figure 4. The use of couplant gel is recommended as it helps in facilitating the transmission of ultrasonic waves from the traducers into the test piece. Reflection and attenuation are the two methods of receiving the ultrasonic waveform. The former method makes use of only one transducer whereas the latter requires two transducers. This work used two transducers with one sending the signal through the test piece and the other receiving the signal, thus following the attenuation method. The transmission time (μs) was measured for all the different materials as shown in Figure 3. The dog-bone samples before and after annealing were subjected to ultrasonic testing at three points along their length to ascertain an average value of transmission time.
3.3. Tensile Testing
The samples for tensile testing were produced in accordance with BS EN ISO 527-2:2012 [29]. The dimensions of the samples are shown in Section 3.1 (Figure 3). All the samples were of the same geometry and this helped in ensuring consistency of testing practices. The tensile testing was carried out using a Hounsfield 200 Series Universal Tensile Testing Machine with a load cell of 5 kN. The crosshead speed was 1.5 mm/s according to the standard.
3.4. Microstructural Analysis
After undertaking tensile testing on all the four different types of materials, their fractured surfaces were analysed using a JCM-5000 NeoScope™ (JEOL, Boston, MA, USA) tabletop scanning electron microscope (SEM). This analysis was conducted to investigate the fracture mechanism, stress relief (as a result of annealing) and interaction of metal particles with the plastic materials in case of Cu-PLA and Al-ASA. The fractured surfaces were carefully cut to size to fit atop the platform of the SEM. No surface treatment was applied to avoid contamination of the fractured surfaces.
3.5. Hardness Testing
There are three categories of hardness measurements, i.e., scratch, indentation and rebound. Each category comprises individual scales for measurements. This work makes use of indentation hardness to test FFF samples. Indentation hardness measures the resistance of a sample to material deformation due to a constant compression load from a sharp object. Common indentation hardness scales are Rockwell, Vickers, Brinell and Shore, amongst others. In this case, the Rockwell hardness scale L was utilized. The preparation of samples and testing procedures were based on BS EN ISO 2039-2: 2000 [30]. This test focus on determining the hardness number and whether the process of annealing has made the samples harder. The parts were 40 mm in length, 40 mm in width with 6 mm thickness. An Avery type 6402 Rockwell hardness testing machine was utilized for the samples. According to Rockwell hardness scale L, the indenter diameter was 6.35 mm. The minor load was 98.07 N and its dwell time was 8s, whereas the major load was 588.4 N with a dwell time of 15 s. The indentation was measured using a hand-held gauge. Each Rockwell hardness scale division represents a 0.002 mm vertical movement of the indenter. The Rockwell hardness number is derived from the following equation:
where,
HR = 130 − e
- HR = Rockwell number
- e = depth of impression after removal of the major load, in units of 0.002 mm.
4. Experimental Results and Discussions
4.1. Results from Dimensional Analysis
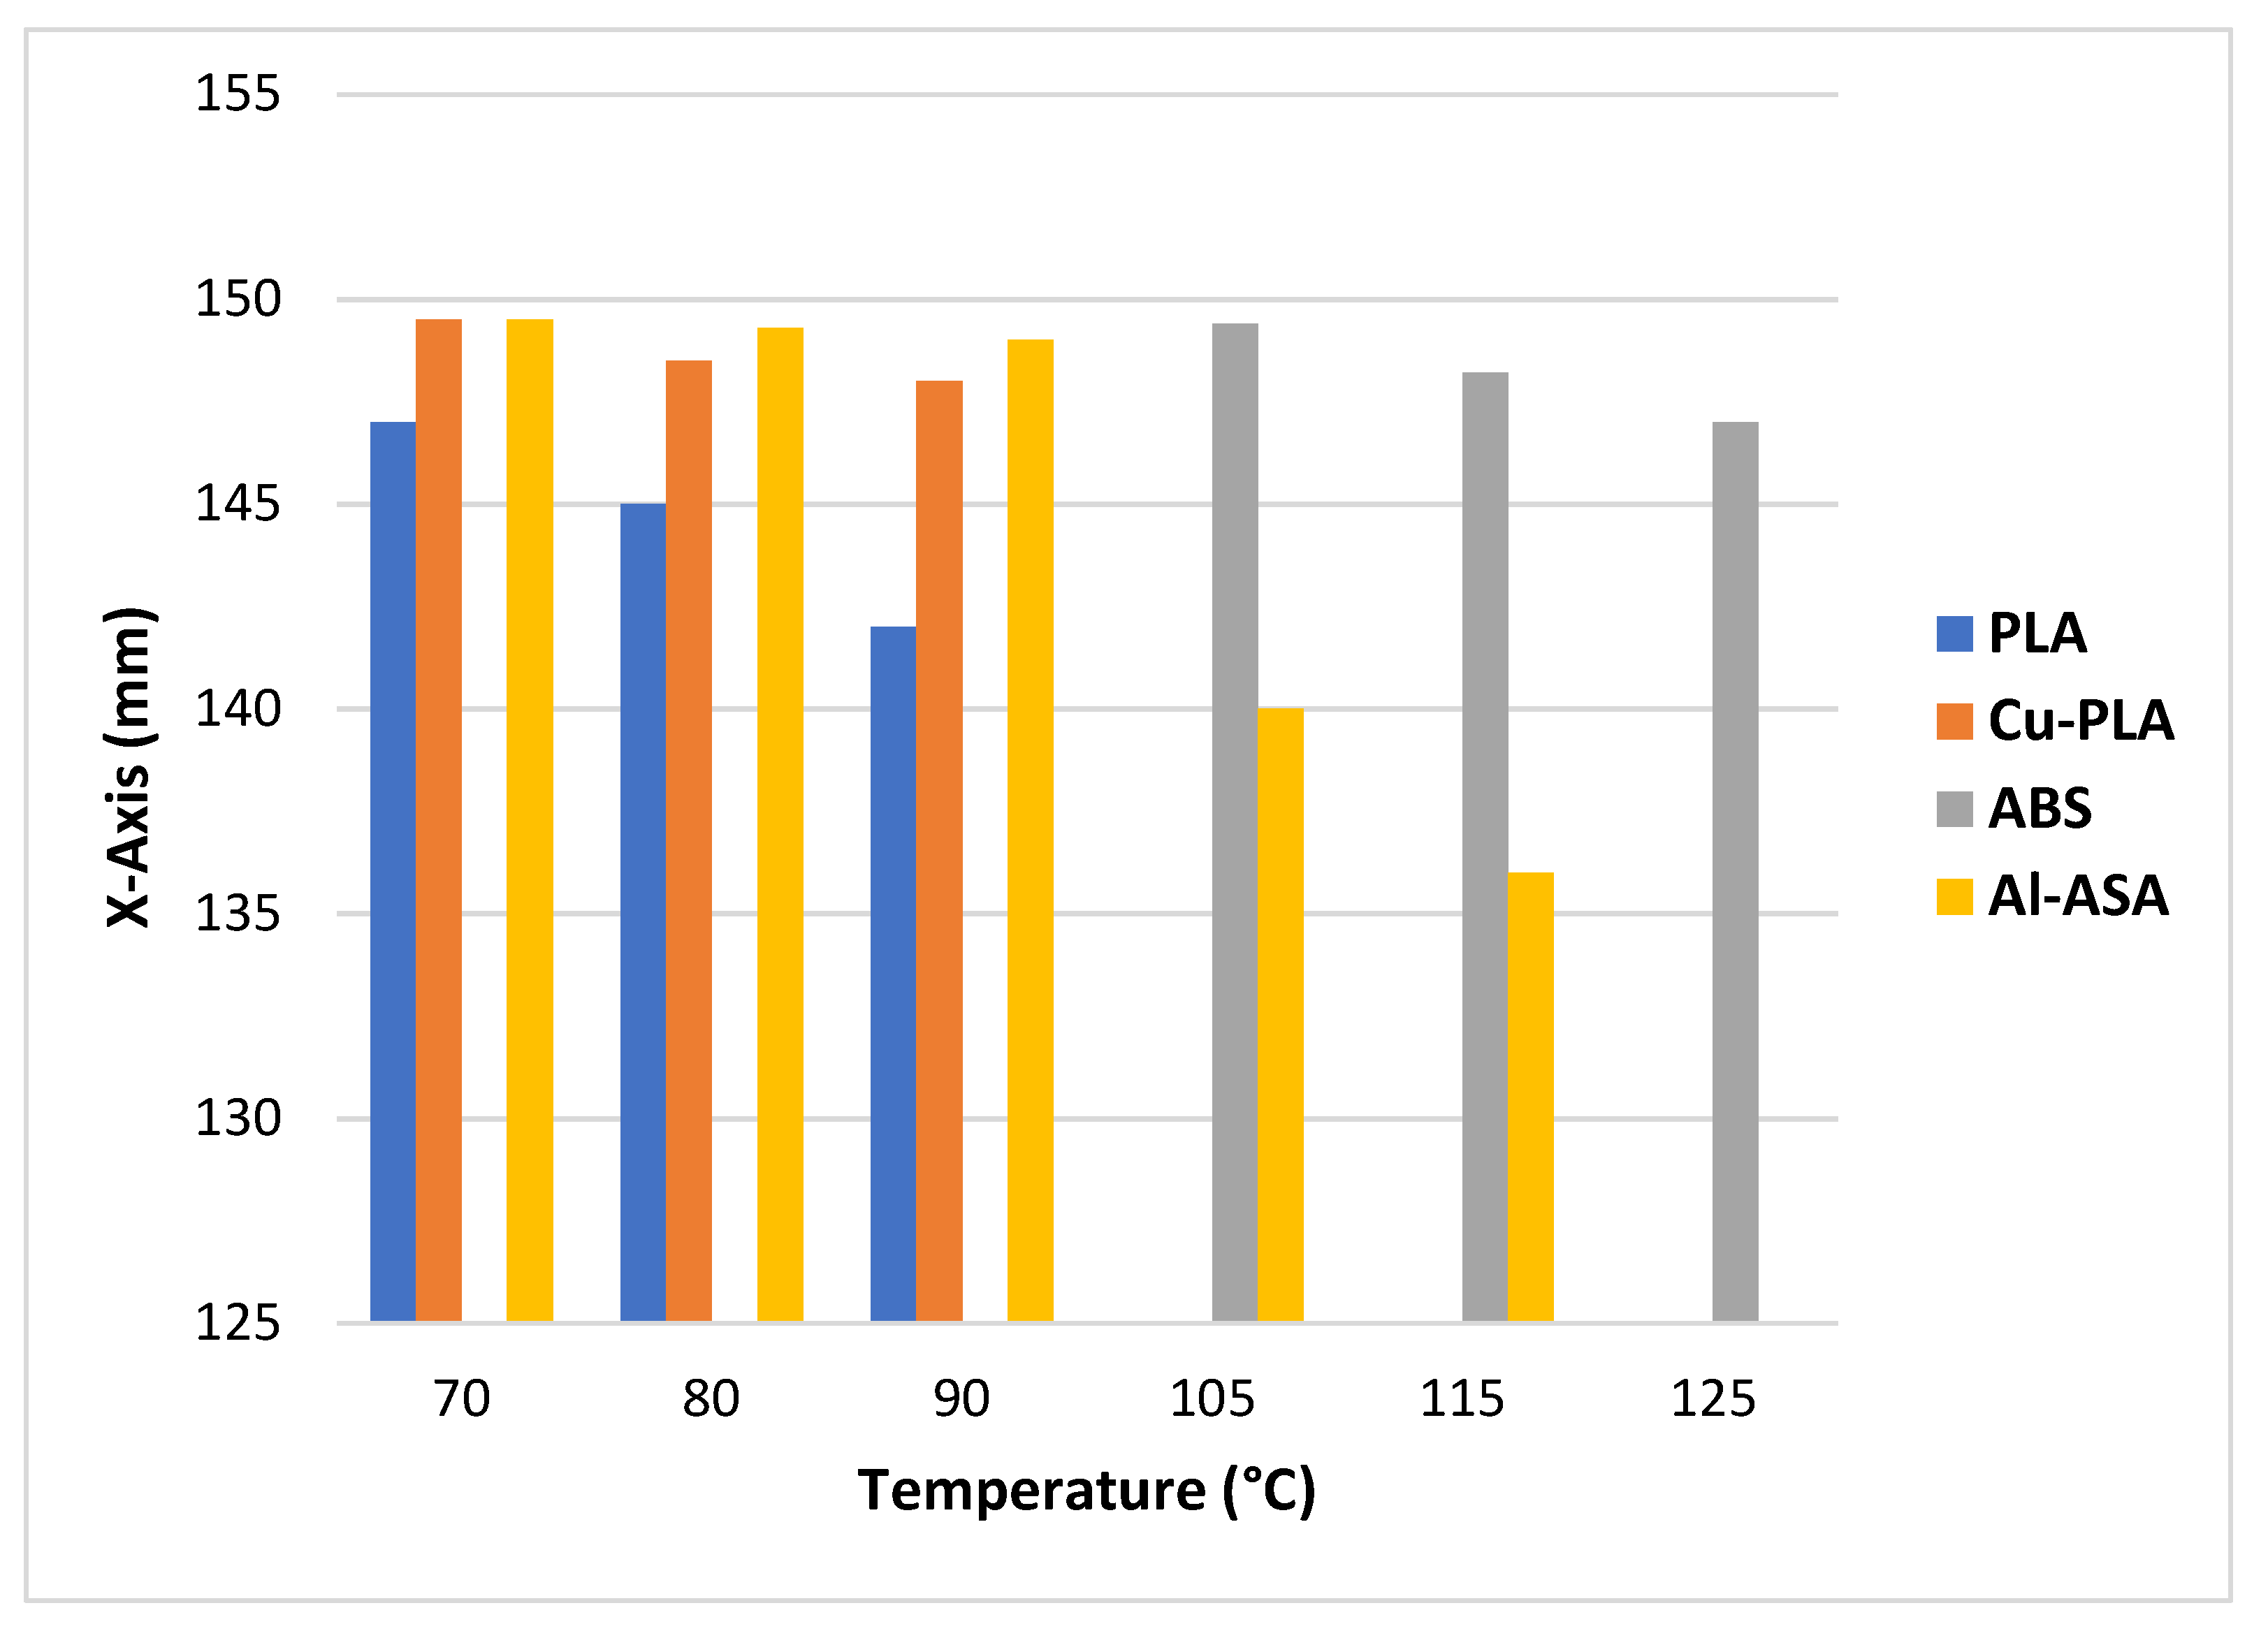
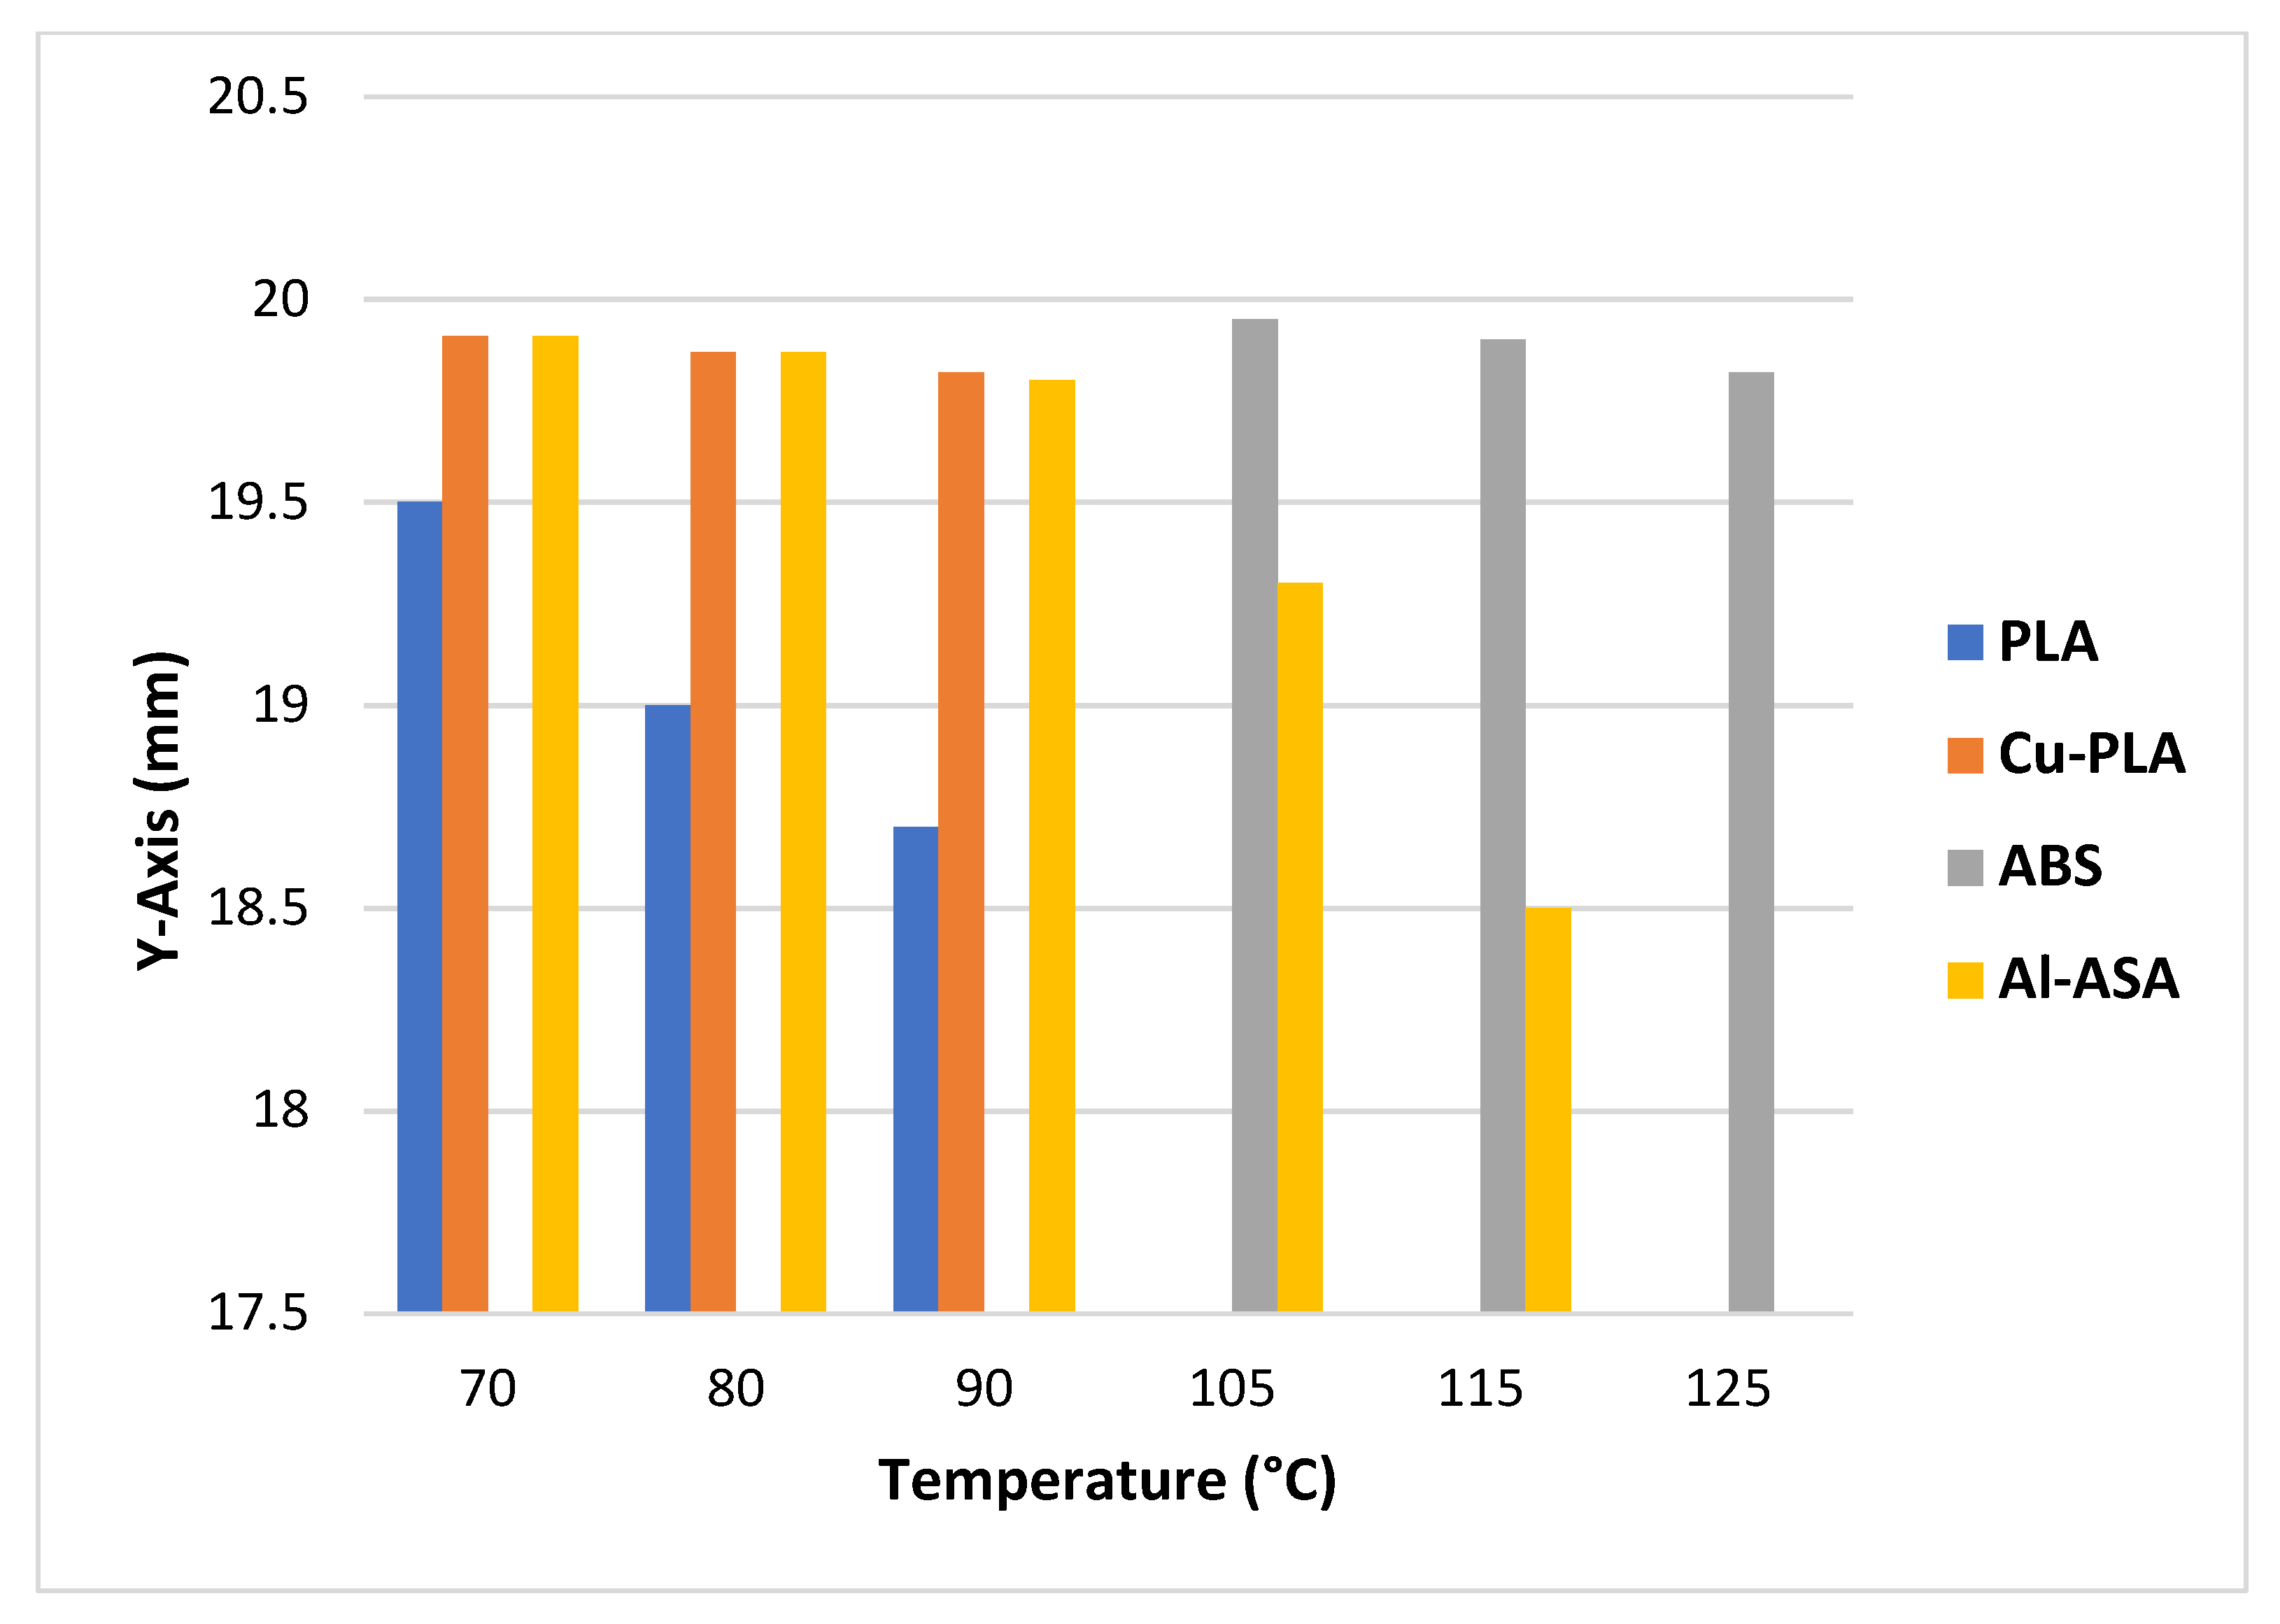
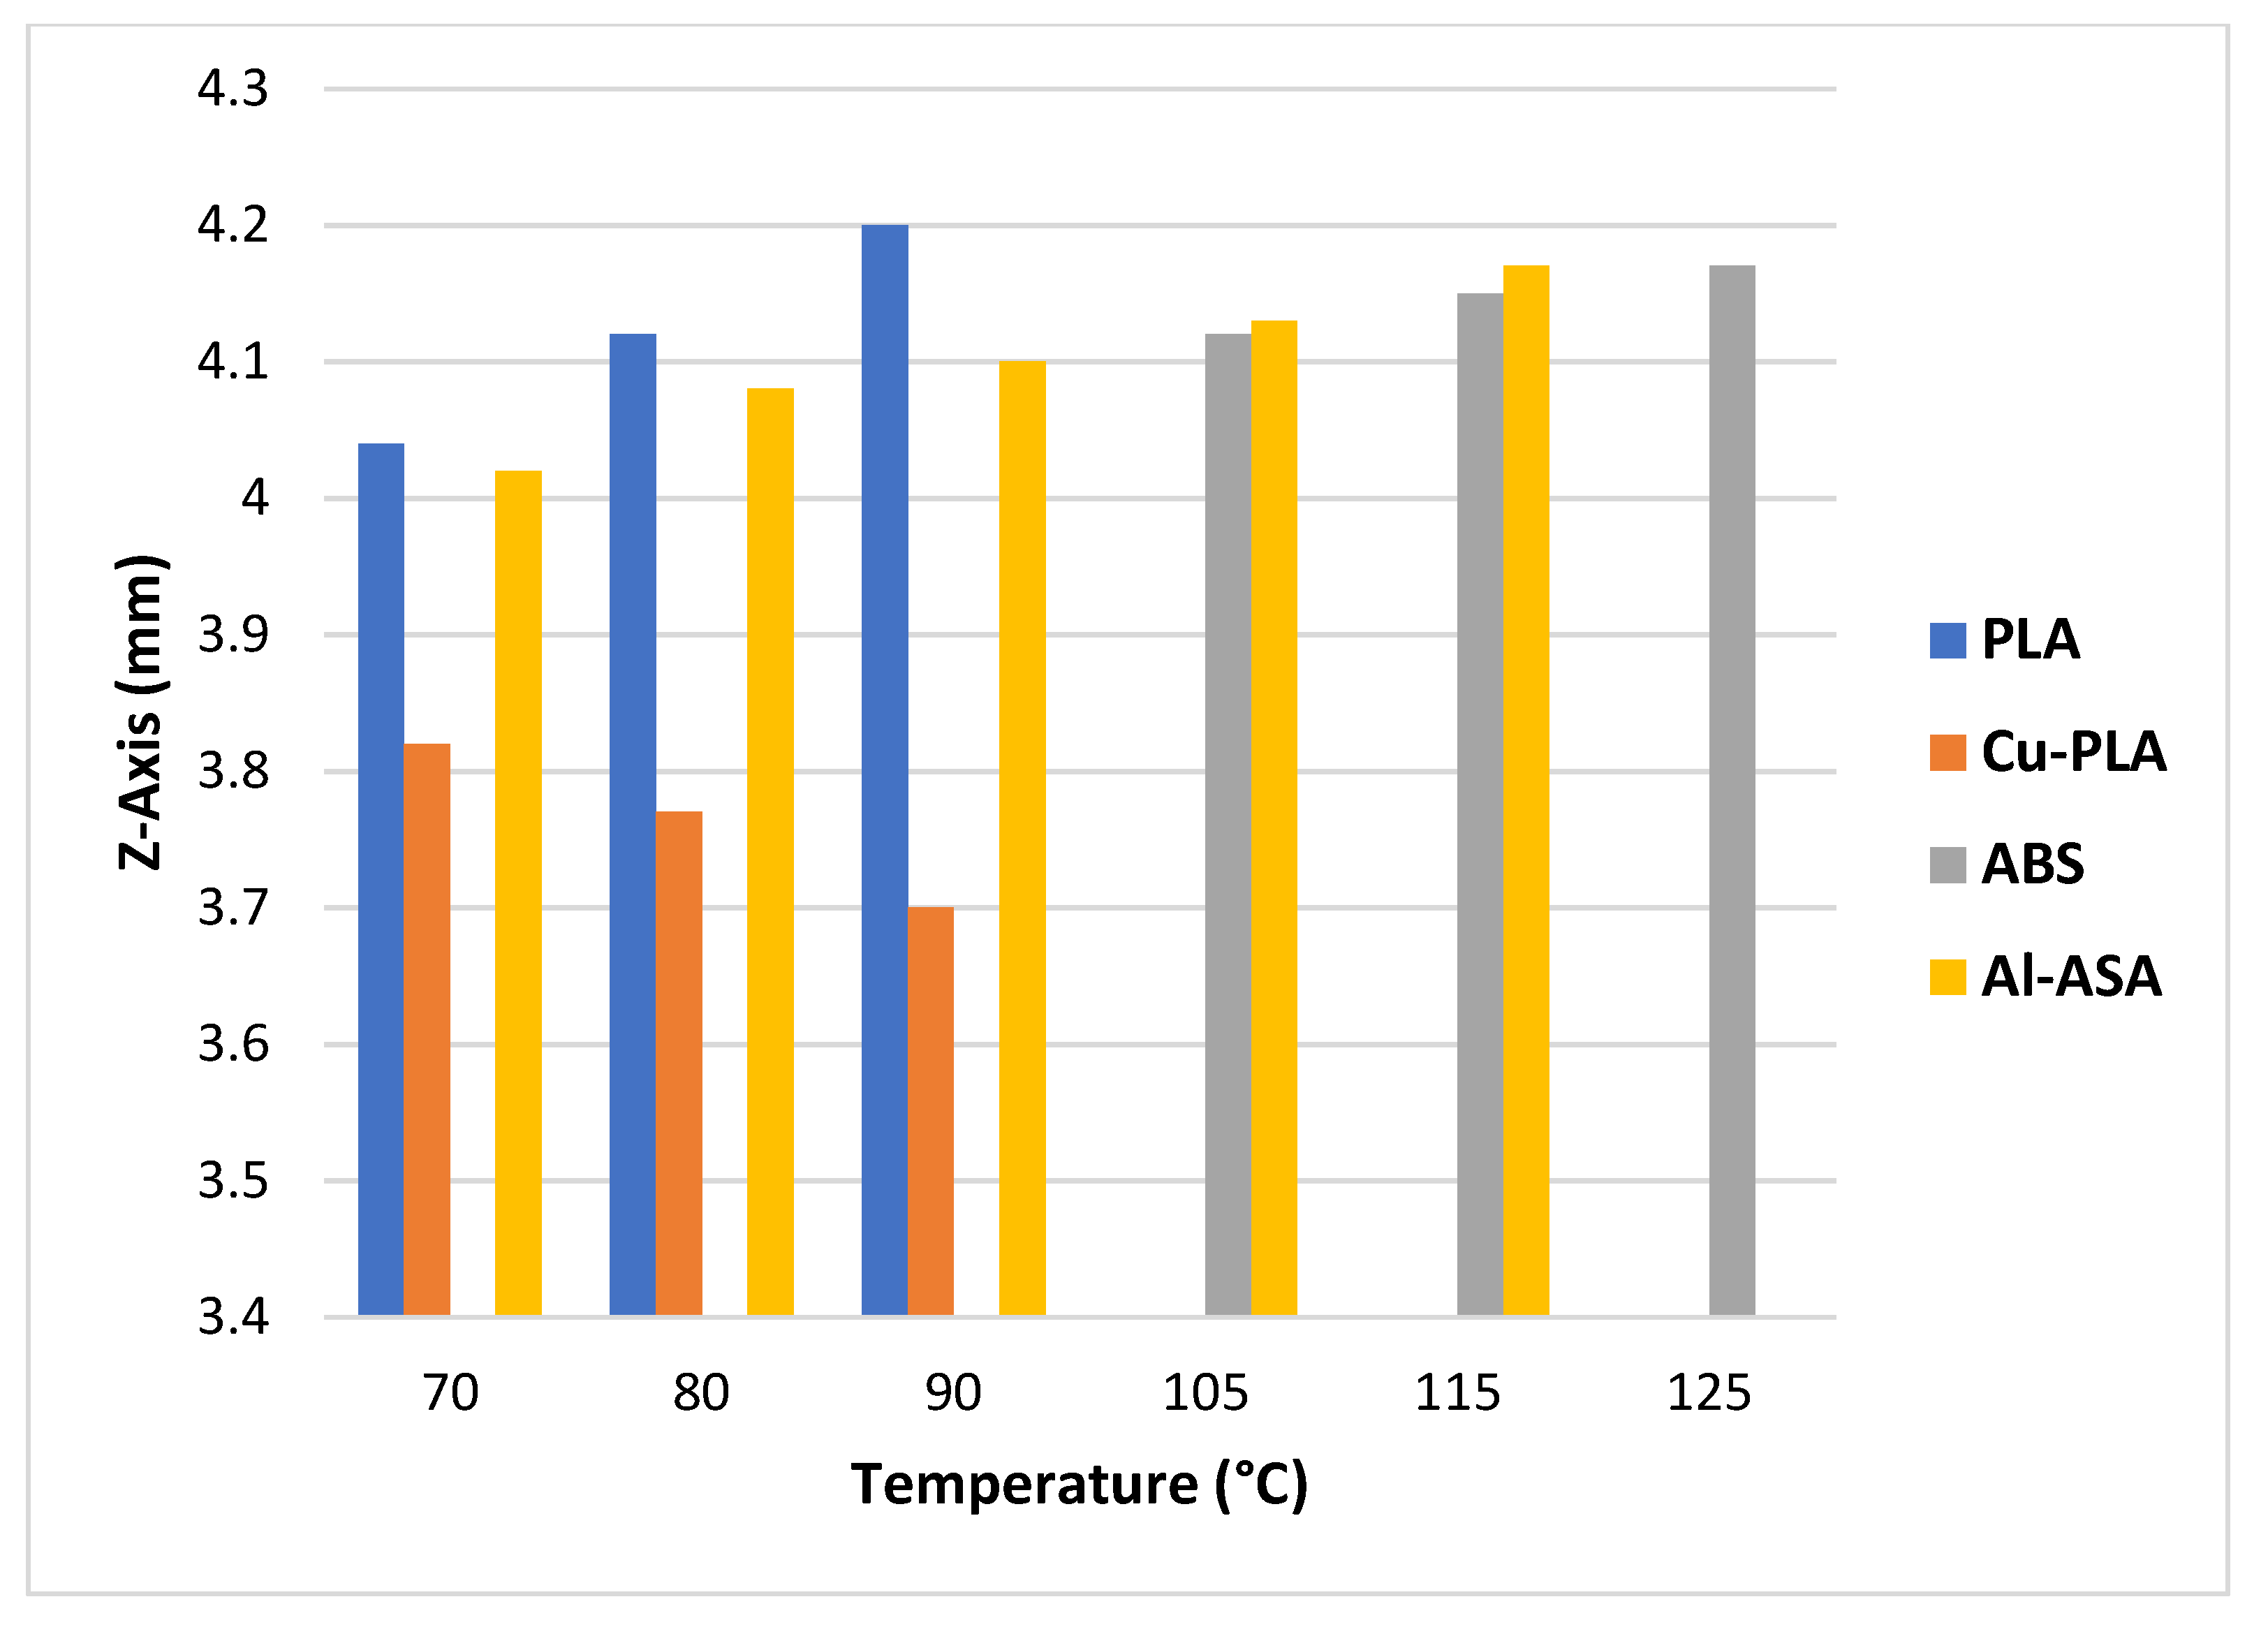
Dimensional changes in FFF-printed samples before and after annealing is a common phenomenon [31] due to the nature of this post-process. In FFF, thermoplastics are extruded out of a nozzle at their melting temperatures and are then cooled rapidly to form the desired shape. Being a poor conductor of heat, the extruded parts are cooled unevenly leading to internal stresses especially between layers. To relieve these stresses, annealing can be performed by heating the materials to their glass transition temperatures, but below their melting points. This will reorganize the internal crystalline structure and cause bigger grains to form, which will result in much stronger objects that are less prone to layer separation. In doing so, the dimensions could also be affected in any of the three axes (x, y, and z) through shrinkage or expansion. This is due to how the FFF-printed samples cool and how the tensions, stresses, and air bubbles get locked between the layers. Figure 5, Figure 6 and Figure 7 show the average values along x, y and z axes for the four materials.
As evident from the dimensional changes, the materials were affected by the annealing conditions but to varying degrees. At 90 °C, PLA shrank by a maximum of 5.6% along the x-axis and 7% along the y-axis. On the other hand, it expanded by 5% at the same temperature along the z-axis. Cu-PLA was not affected significantly in the x and y axes, showing shrinkage of 1.3% and 0.9%, respectively, at 90 °C. However, its thickness was reduced by 8% at 90 °C, showing that annealing does not affect the dimensional tolerances of this material significantly. Like Cu-PLA, ABS also experienced minimum shrinkage along the x (2%) and y (0.9%) axes at 125 °C but it expanded by 4.25%. Al-ASA performed well until 90 °C with shrinkage of only 0.6% and 1% along x and y axes respectively but deformed significantly as it was heated at higher temperatures (105 °C) as shown in Figure 8. This is the reason why the Al-ASA samples (annealed at 105 and 115 °C) were not subjected to tensile testing and should not be annealed at temperatures higher than 90 °C. This is a good estimation and can be used for future testing without adversely affecting the dimensional tolerances of FFF-printed Al-ASA products. Considering that 90 °C is a usable annealing temperature for Al-ASA material, it expanded by 2.5% along the z-axis. Al-ASA is considered to have high heat resistance and that is shown by the extremely small shrinkage/expansion values at 90 °C compared to other materials. However, higher temperatures can result in significant deformation that can render a product useless. The reason for such high shrinkage can be attributed to residual micro-stresses that arise from the inhomogeneity of properties in the microstructure. A common source of micro-stresses is the difference in the coefficients of thermal expansion in multiphase materials. Al-ASA is a combination of aluminium powder and ASA plastic, therefore, it is expected to develop stresses at elevated temperatures between the matrix and reinforcement as they contract at different rates. It is to be noted that different materials from different suppliers could result in varying percentages of shrinkage/expansion along the three axes. These values can be compensated in the original CAD design phase to ensure that the required dimensions are achieved after annealing.
4.2. Results from Ultrasonic Testing
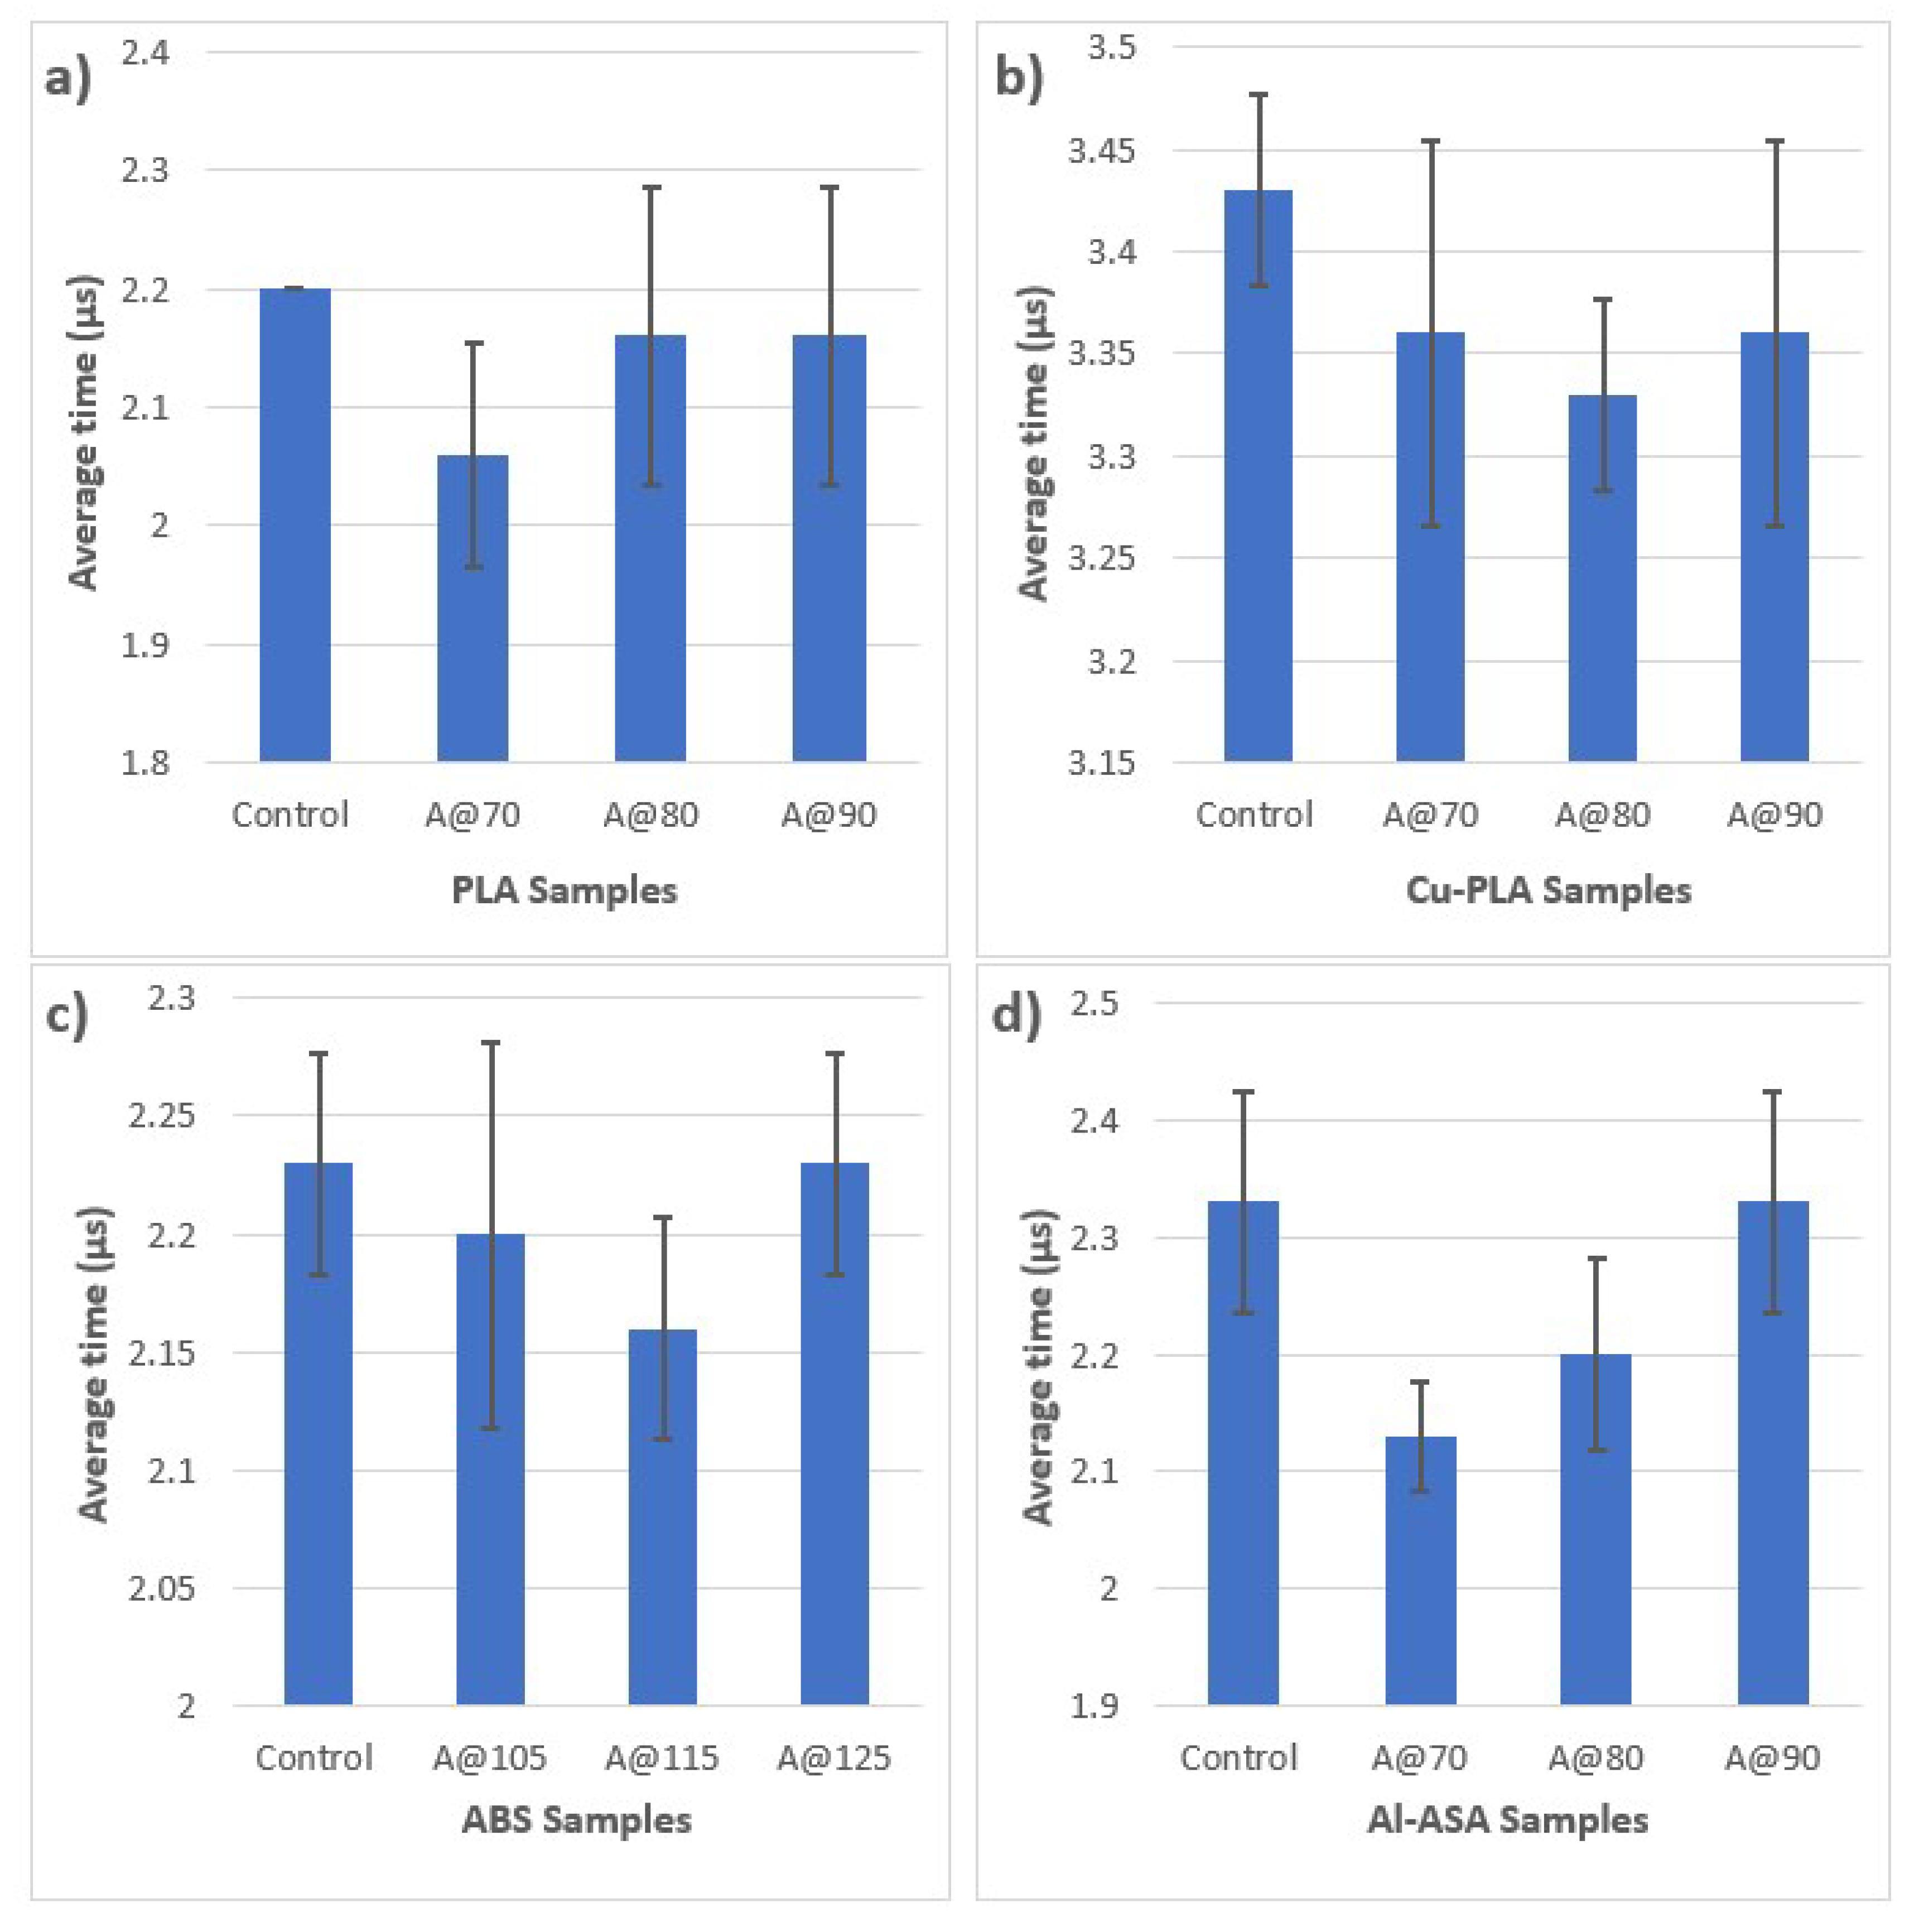
All the materials used in this work are thermoplastics, i.e., they are polymer materials that become pliable or moldable at a certain elevated temperature and solidify upon cooling. These polymers comprise long and repetitive molecular chains, such molecular structures can be classified into semi-crystalline (partially organised structure) and amorphous (random structure). PLA and Cu-PLA fall under the former category whereas ABS and Al-ASA fall under the latter category. The reason for undertaking ultrasonic testing (UT) is to assess whether annealing can enhance the crystallinity of these polymers and subsequently form a smooth pathway for sound waves to travel. It is widely reported that annealing can increase crystallinity at elevated temperatures [14,15,32,33] and this test can provide insight into whether UT is a suitable option to assess the crystallinity of FFF-printed samples. Crystallinity has also been linked with the mechanical properties of FFF-printed PLA [16,18,34,35]. UT was conducted on all the materials and three measurements were taken based on the description given in Section 3.2. The time taken by the high-frequency acoustic sound waves to travel from one transducer through the test piece and to the second transducer was measured and the results for the different materials are shown in Figure 9.
As evident from the UT results, the time taken for sound waves to travel in each material type differs. PLA is a semi-crystalline material and has resulted in an average transmission time of 2.2 μs. These results are consistent with our previous work [36]. However, a significant reduction was observed at 70 °C annealing time with 2.06 μs indicating that the crystallinity of PLA has increased [14], internal stresses and air gaps/voids (as discussed in Section 4.4) have been reduced [15] resulting in faster transmission time. This time went up for 80 and 90 °C (2.16 μs for both) but was still lower than the control PLA sample values. This indicates that annealing of PLA can enhance its crystallinity and reduce its internal stresses significantly [18,20]. Therefore, it is a useful post-process for the PLA material [37,38]. Cu-PLA material followed a similar trend to PLA with the 70 °C samples showing slightly lower average values (3.36 μs) compared to control samples (3.43 μs). These values continued to fluctuate with increasing temperatures but stayed lower than the control samples. This shows that the crystallinity of Cu-PLA samples is affected by annealing but not to a large extent. Since Cu-PLA is about 80% copper, it was expected that the sound waves would travel much faster but that was not the case. It can be attributed to the way PLA and copper particles are mixed together to form the filaments.
With the amorphous materials (ABS and Al-ASA), the results of UT were more like Cu-PLA than PLA. For ABS, the lowest transmission time was observed for the sample annealed at 115 °C (2.16 μs) compared to the control sample (2.23 μs) and then returned to the same values at 125 °C. This shows that annealing can help fill interlayer gaps and porosity for ABS samples but not to a large extent [19,39]. Al-ASA also shows a similar pattern to ABS, but the lowest value was obtained for the sample annealed at 70 °C (2.13 μs) compared to the control sample (2.33 μs) and then the values increased again at 90 °C (2.33 μs). The only positive thing here is that the reduction in transmission time is about 9.3%, which shows the effect of annealing in reducing air gaps/voids within the Al-ASA sample at 70 °C but not at other values. Al-ASA is a unique material as it can be annealed at lower temperatures compared to ABS. One downside of this material is its high operating temperatures (as shown in Table 1) as most low-cost FFF systems would not be able to properly print at such high temperatures. Overall, in terms of crystallinity and differences in transmission times, annealed PLA and Cu-PLA samples showed lower values compared to the control samples whereas the values for annealed ABS and Al-ASA fluctuated with some lower and equivalent values compared to control samples.
4.3. Results from Tensile Testing
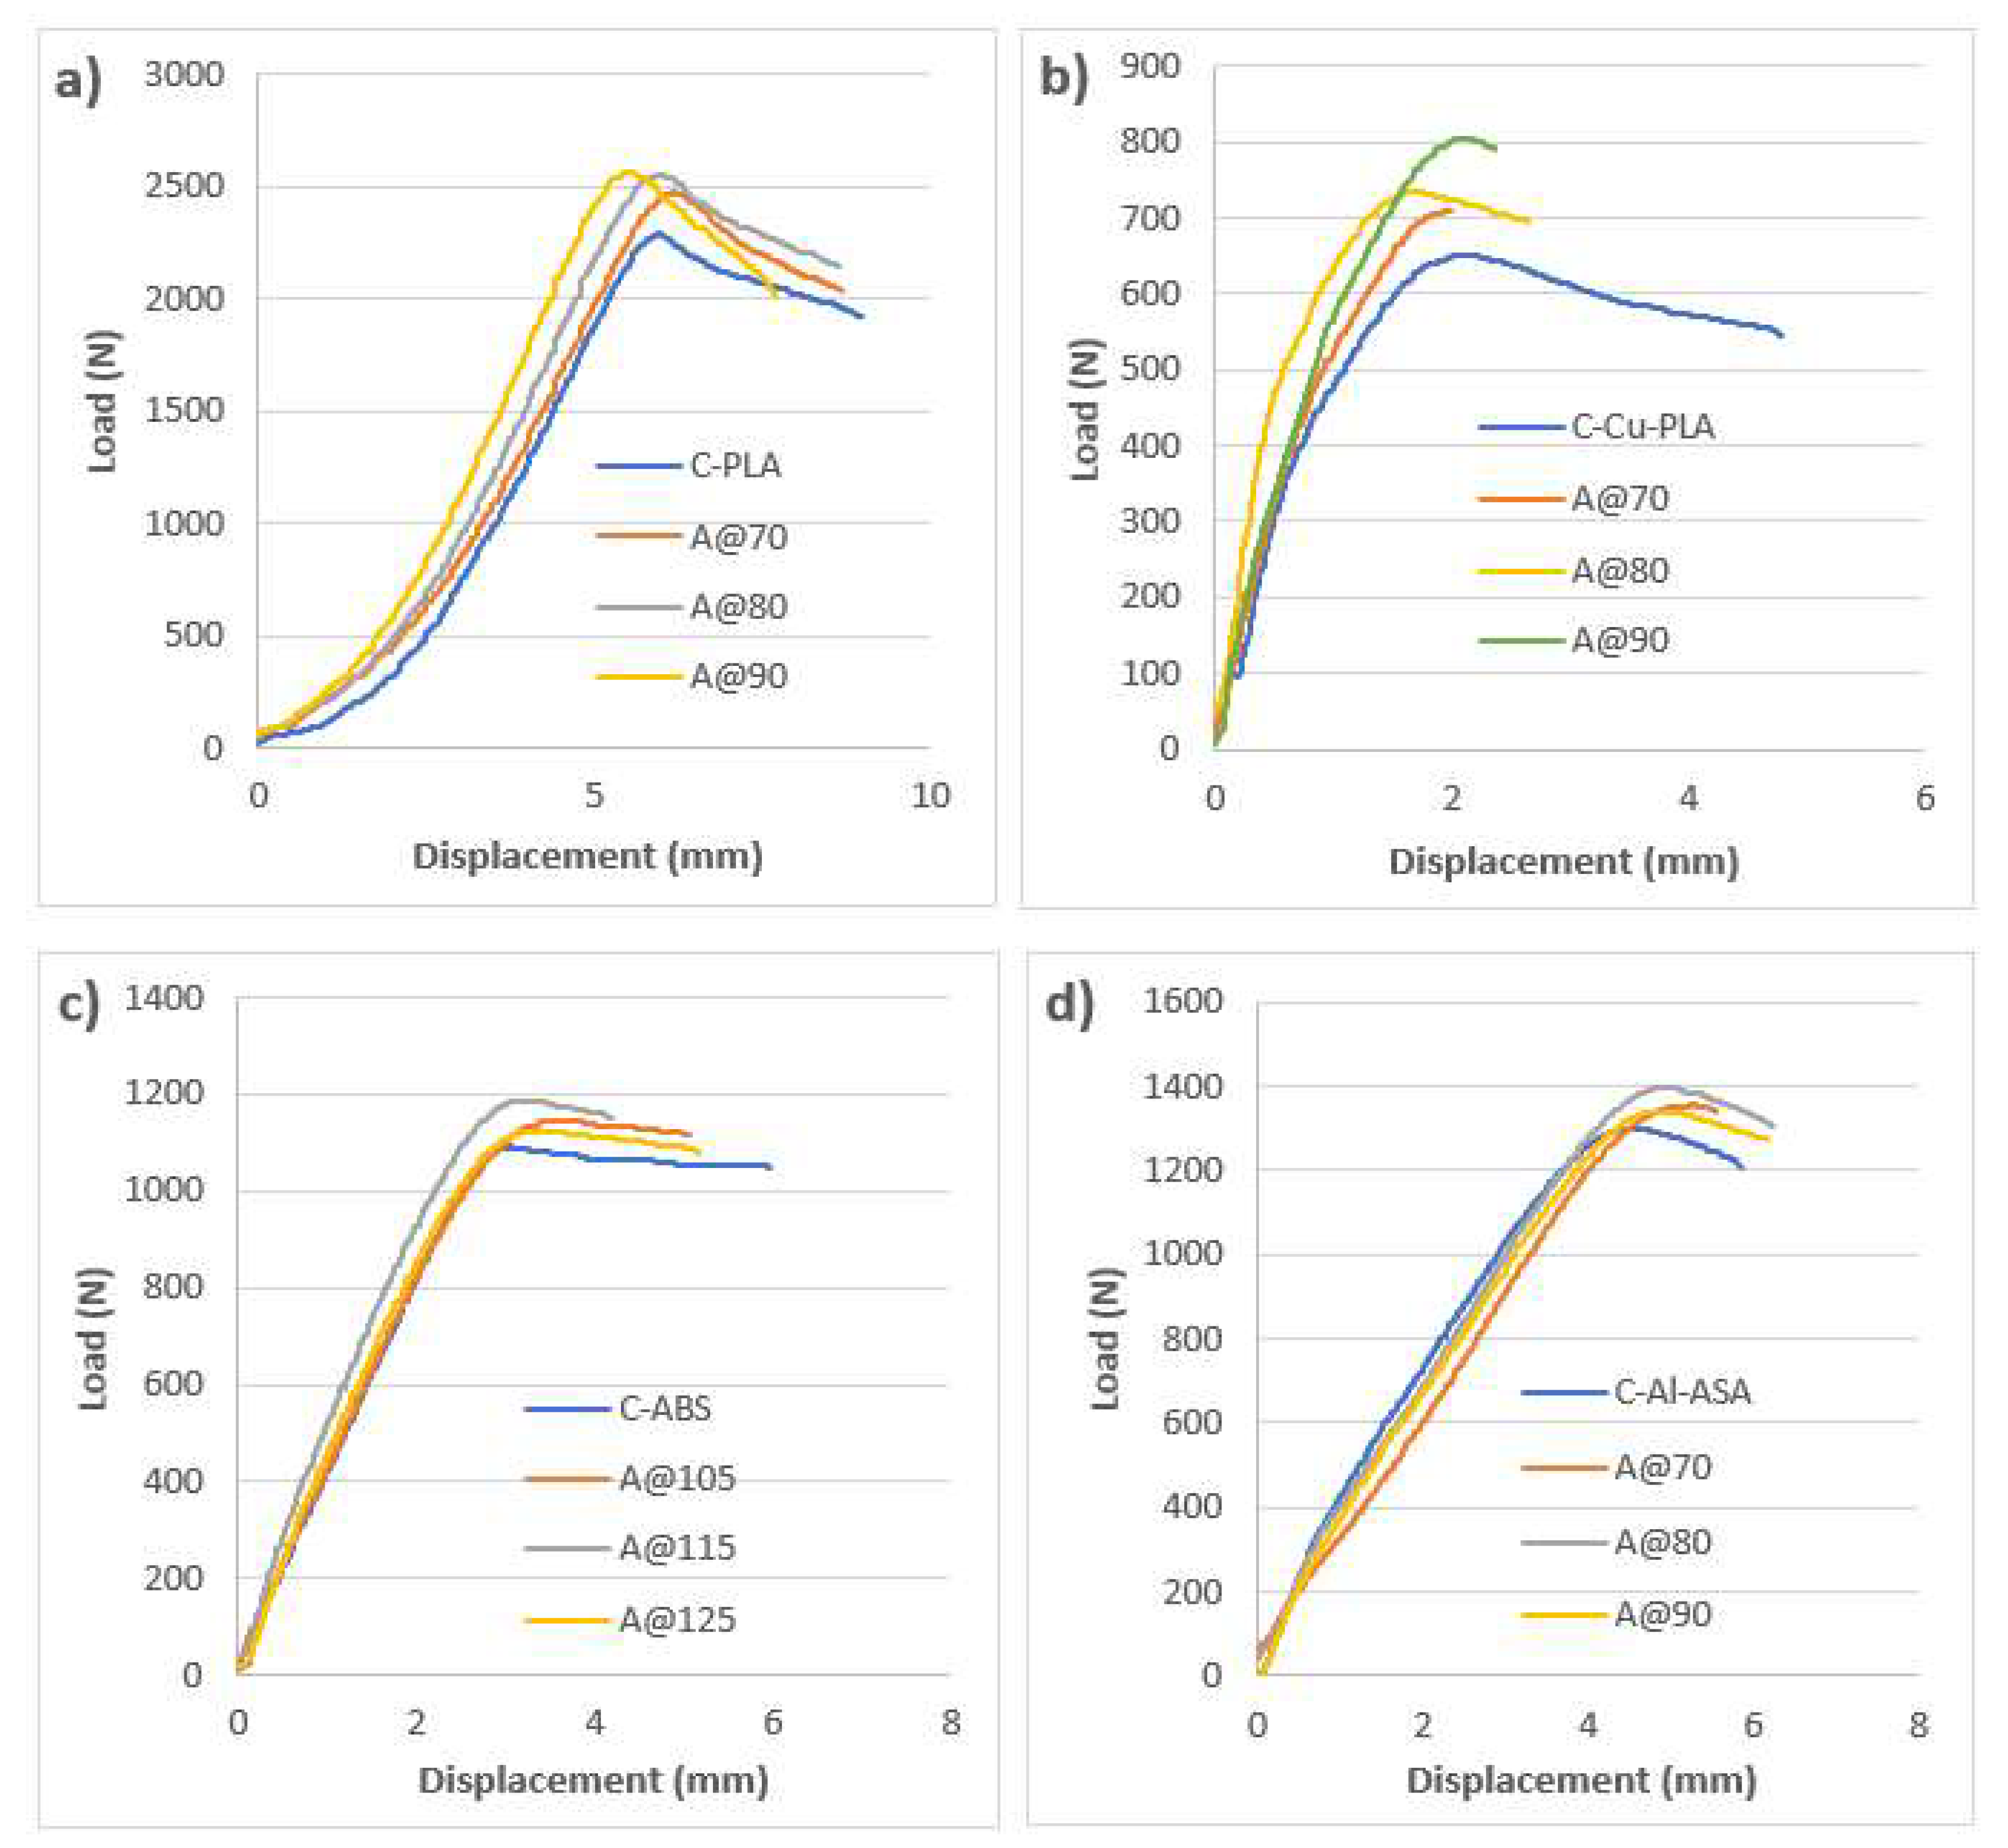
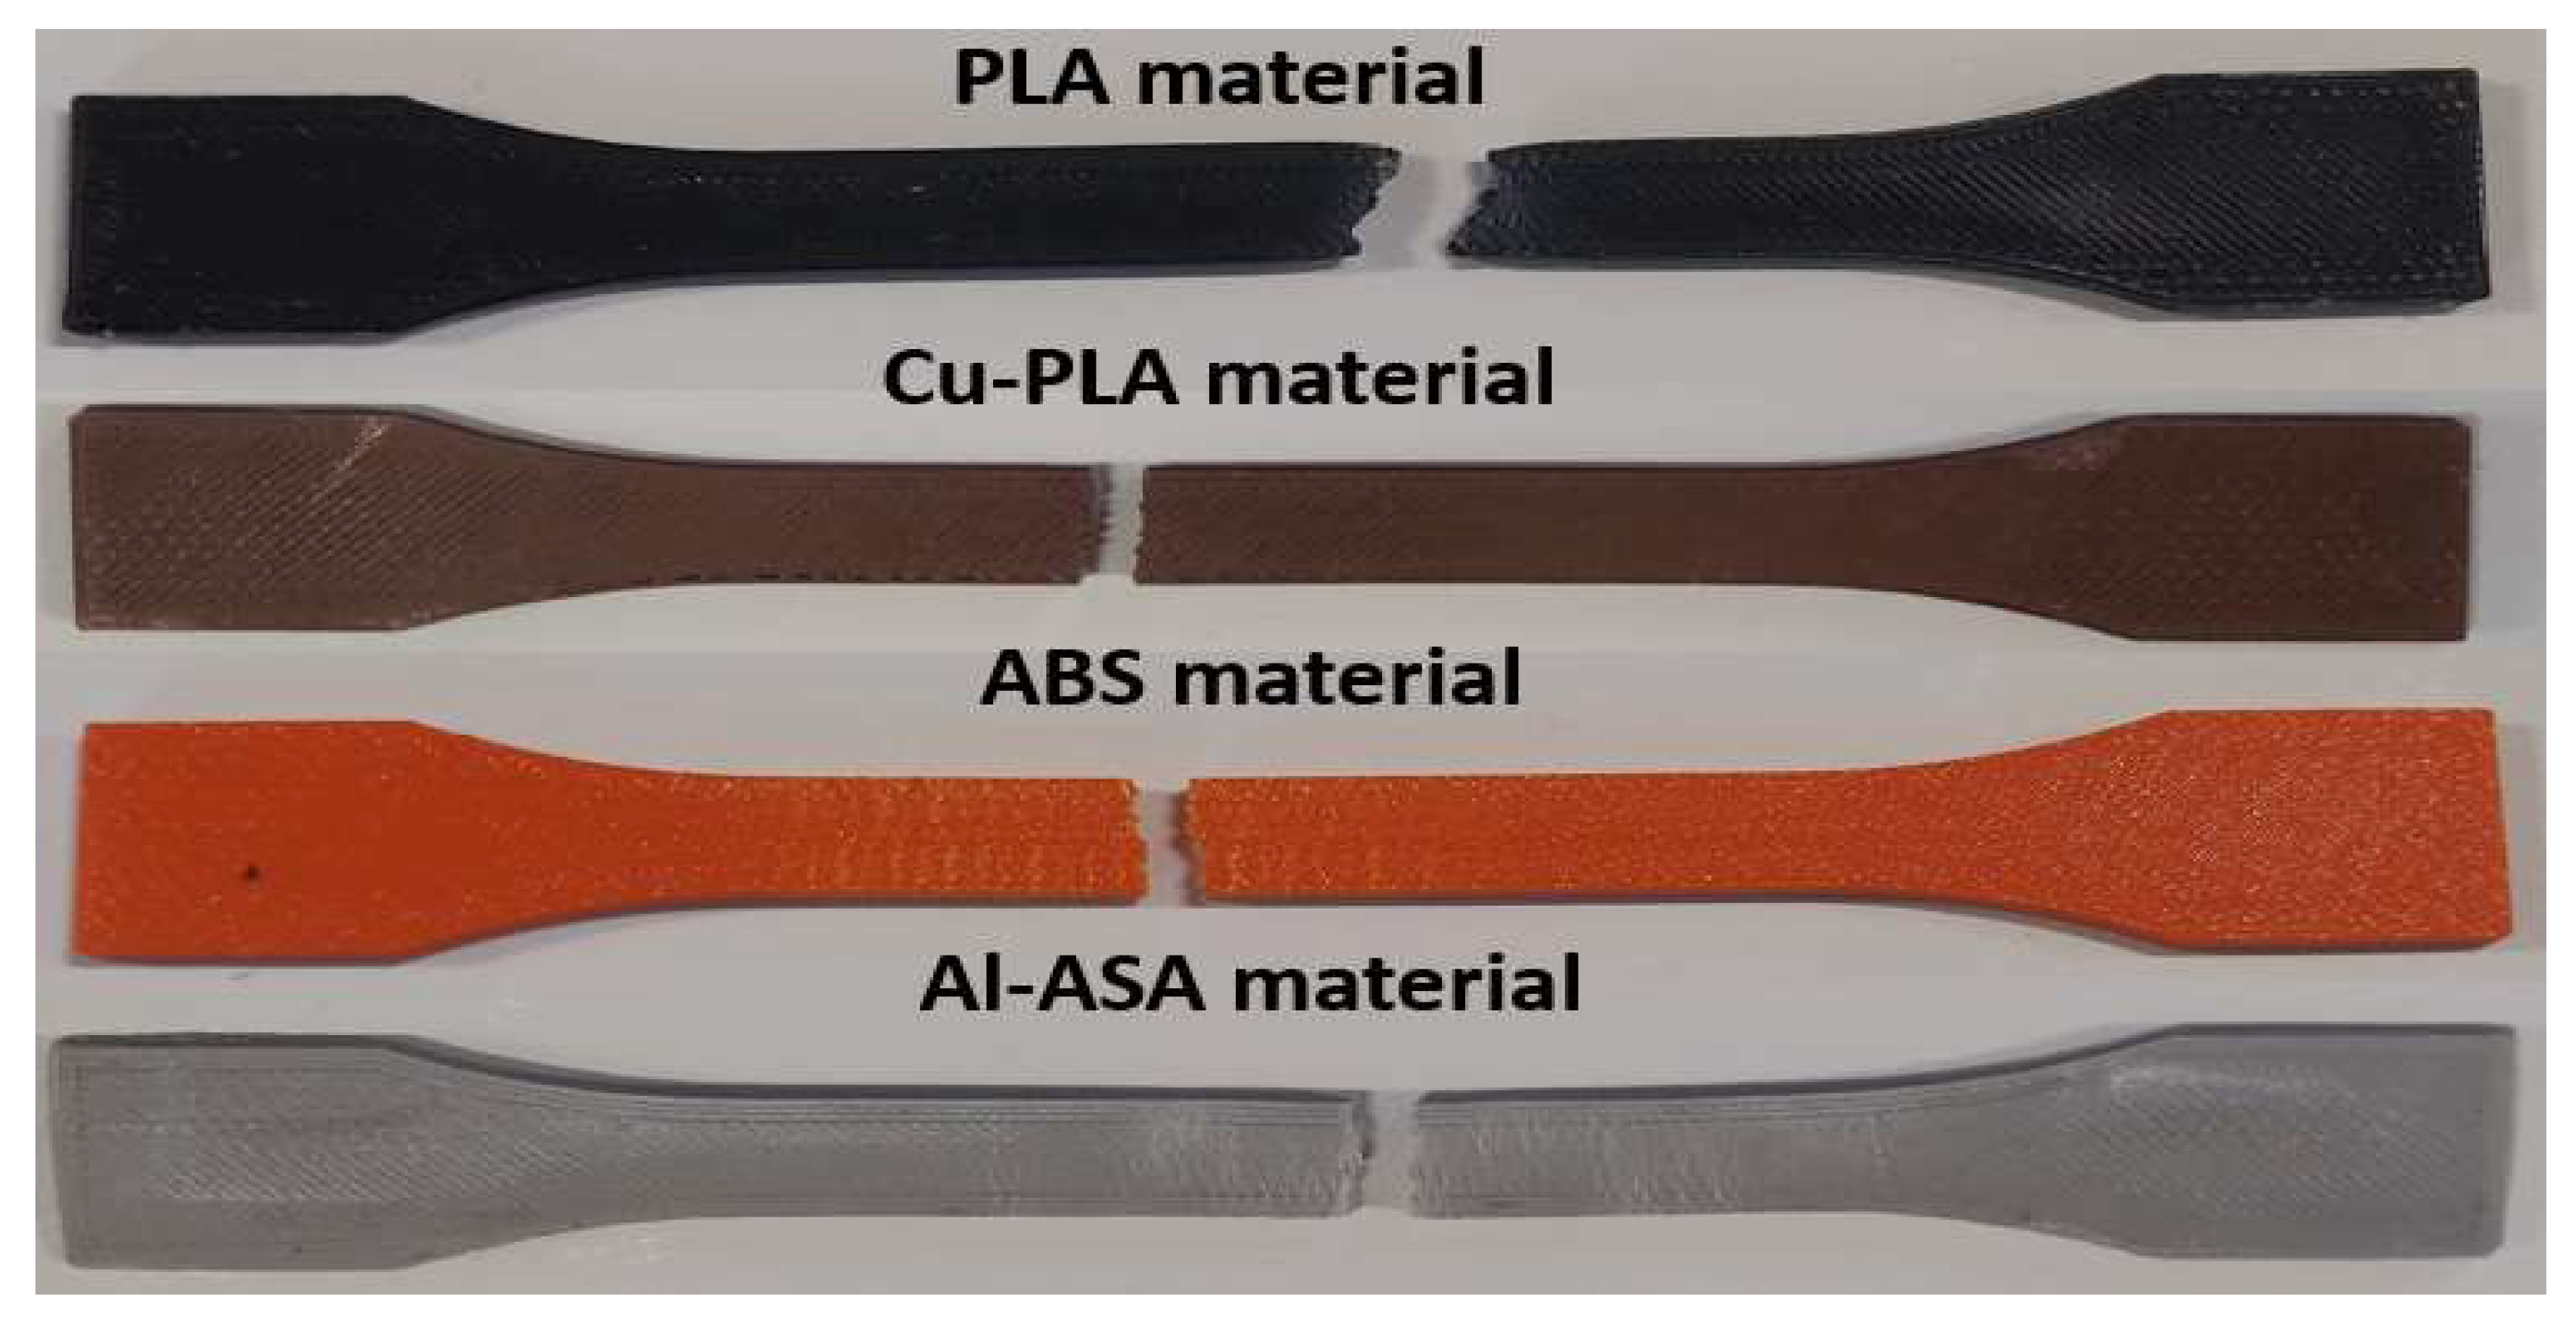
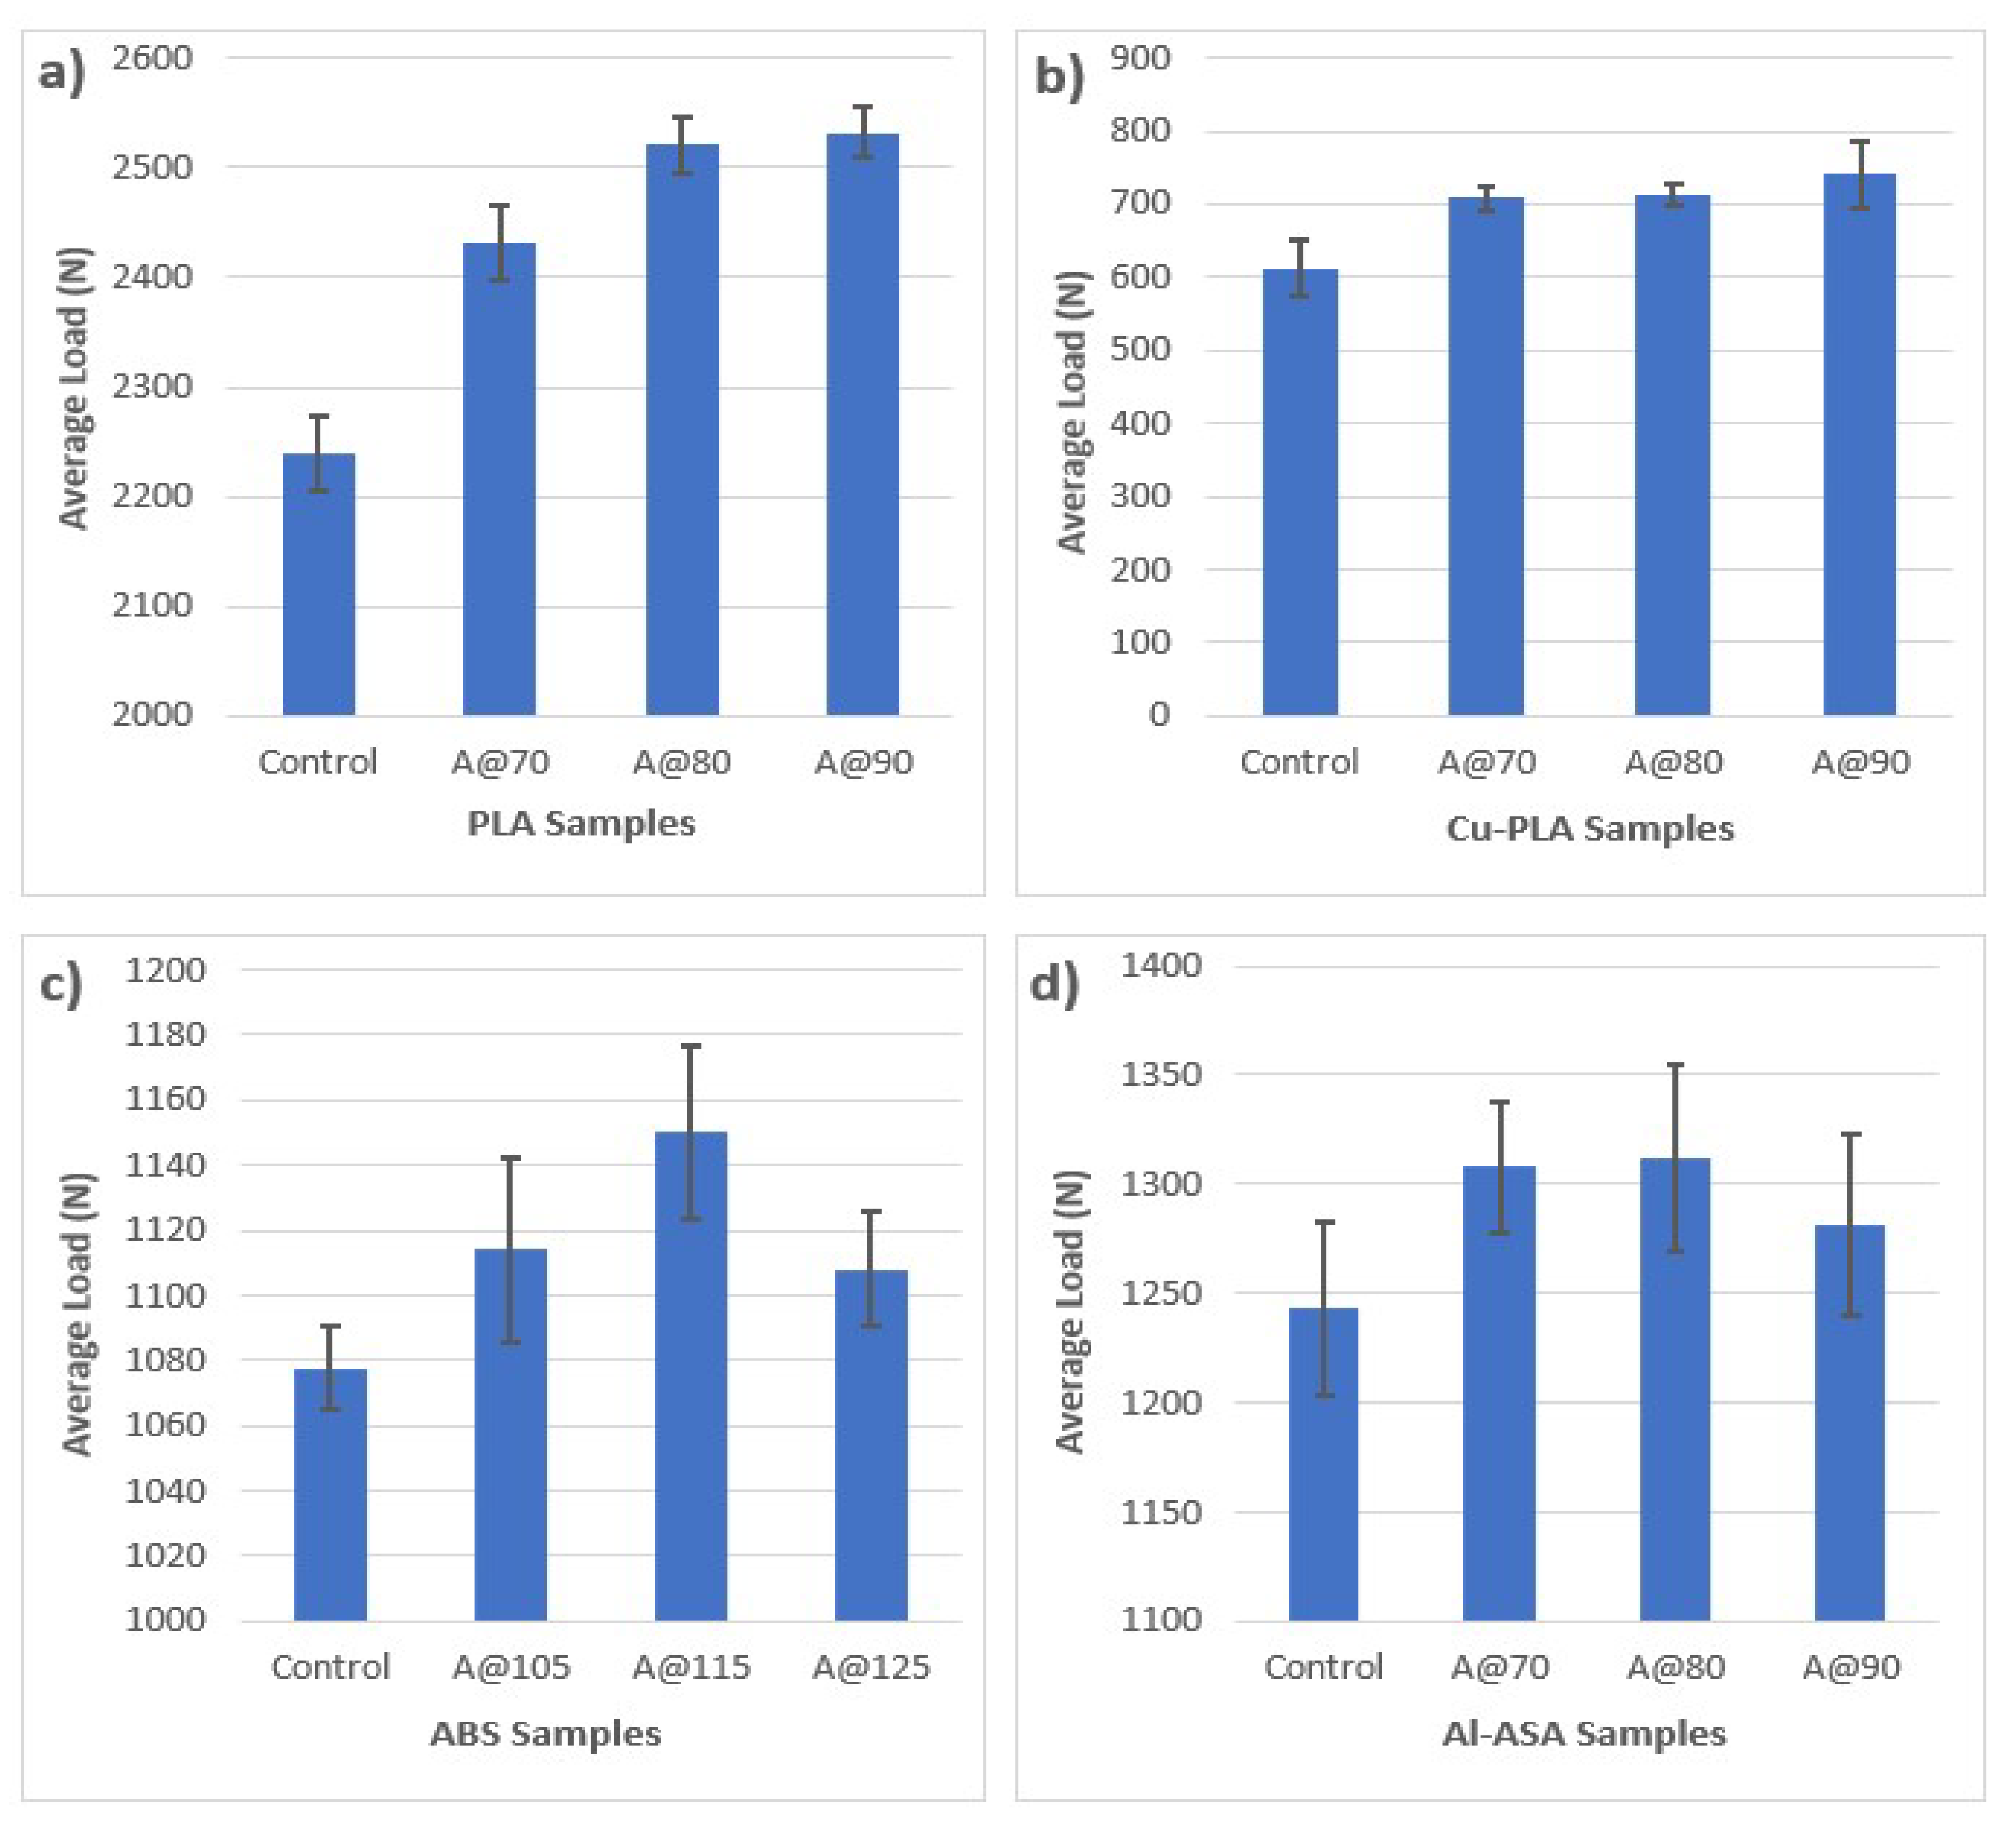
Force vs. displacement curves for all the four materials are shown in Figure 10. It is to be noted that only the samples with the maximum load values have been plotted here. The fractured samples for all the four materials are shown in Figure 11. These samples were used for microscopic analysis in Section 4.3. Average load values with error bars for all the tested samples are shown in Figure 12 to ascertain the difference in test results. An increase in tensile strength of PLA material upon annealing is a widely reported phenomenon [14,17,18,20] and the same has happened here with the average fracture loads increasing with higher annealing temperatures. As shown in Section 4.2 for UT, lower transmission times were observed for annealed samples compared to the control PLA due to the annealed samples becoming more crystalline [15]. This has been supported by a significant increase in tensile strength as shown in Figure 12a. A similar trend of increase in tensile strength with increasing annealing temperatures was observed for Cu-PLA samples as well. The samples annealed at 90 °C show an increase of 21% in fracture load values as shown in Figure 12b. These are the same samples that showed lower transmission times before the tensile test and after annealing. The comparison between PLA and Cu-PLA also shows that the latter is inferior in terms of tensile strength compared to the former. Even though it has shown a substantial increase in load values after annealing, it is still incapable of competing with PLA in terms of strength. This is due to the inhomogeneity and the lack of cohesion between the metal and plastic particles at the microscopic level compared to the homogeneous structure of PLA. Regardless of the difference in the strength of the materials, these results demonstrate that UT is a viable option to ascertain the degree of crystallinity for semi-crystalline polymers.
On the other hand, ABS showed an increase of 3.3%, 6.75% and 2.8% at annealing temperatures of 105, 115 and 125 °C, respectively. This can also be supported by the UT, where the lowest transmission times were observed for the sample annealed at 115 °C, the ones showing the maximum increase in fracture load values in Figure 12c. Al-ASA shows an increase of 5.2%, 5.5% and 3% at temperatures of 70, 80 and 90 °C, respectively (Figure 12d). These results can also be supported by the UT but to a lesser extent compared to ABS. These results also show that UT can be used to assess the crystallinity of amorphous plastics. However, the results indicate quite a low increase in fracture load values after annealing, showing that ABS and ASA materials are not very receptive to annealing. Annealing is a complex process to begin with and requires a balance between time and temperature to achieve optimised results. In this context, a strong reason is needed to anneal these materials knowing the result would be a limited increase in mechanical properties.
4.4. Results from Microstructural Analysis
The fractured surfaces were cut to size to fit on the SEM platform and observed for the presence of voids, cracks and air gaps. First and foremost, all the tested samples exhibited a brittle failure, i.e., without showing any necking or plastic deformation before fracture. FFF is a process where layers of extruded materials are stacked on top of each other leading to the formation of voids or porosity [40]. These voids can be seen clearly in Figure 13, Figure 14, Figure 15 and Figure 16. Voids represent empty areas with no connection and a higher percentage of voids could significantly degrade the mechanical properties [41]. PLA is a brittle material and its SEM micrographs at ×100 magnification are shown in Figure 13. Un-annealed PLA has some gaps due to the nature of the FFF process [42] as seen in Figure 13a, but these gaps reduce in 70 °C annealed samples, as shown in Figure 13b. These voids are still present at 80 (Figure 13c) and 90 °C (Figure 13d) annealed samples. However, they are very few and this is the reason for higher fracture load values (as discussed in Section 4.3) at elevated annealing temperatures for PLA. Furthermore, the low percentage of air gaps and voids is also the reason for the lower transmission times recorded for annealed samples compared to the control PLA (as discussed in Section 4.2). These results indicate a strong correlation among ultrasonic testing, tensile testing and microstructural analysis post-annealing for PLA materials manufactured by FFF.
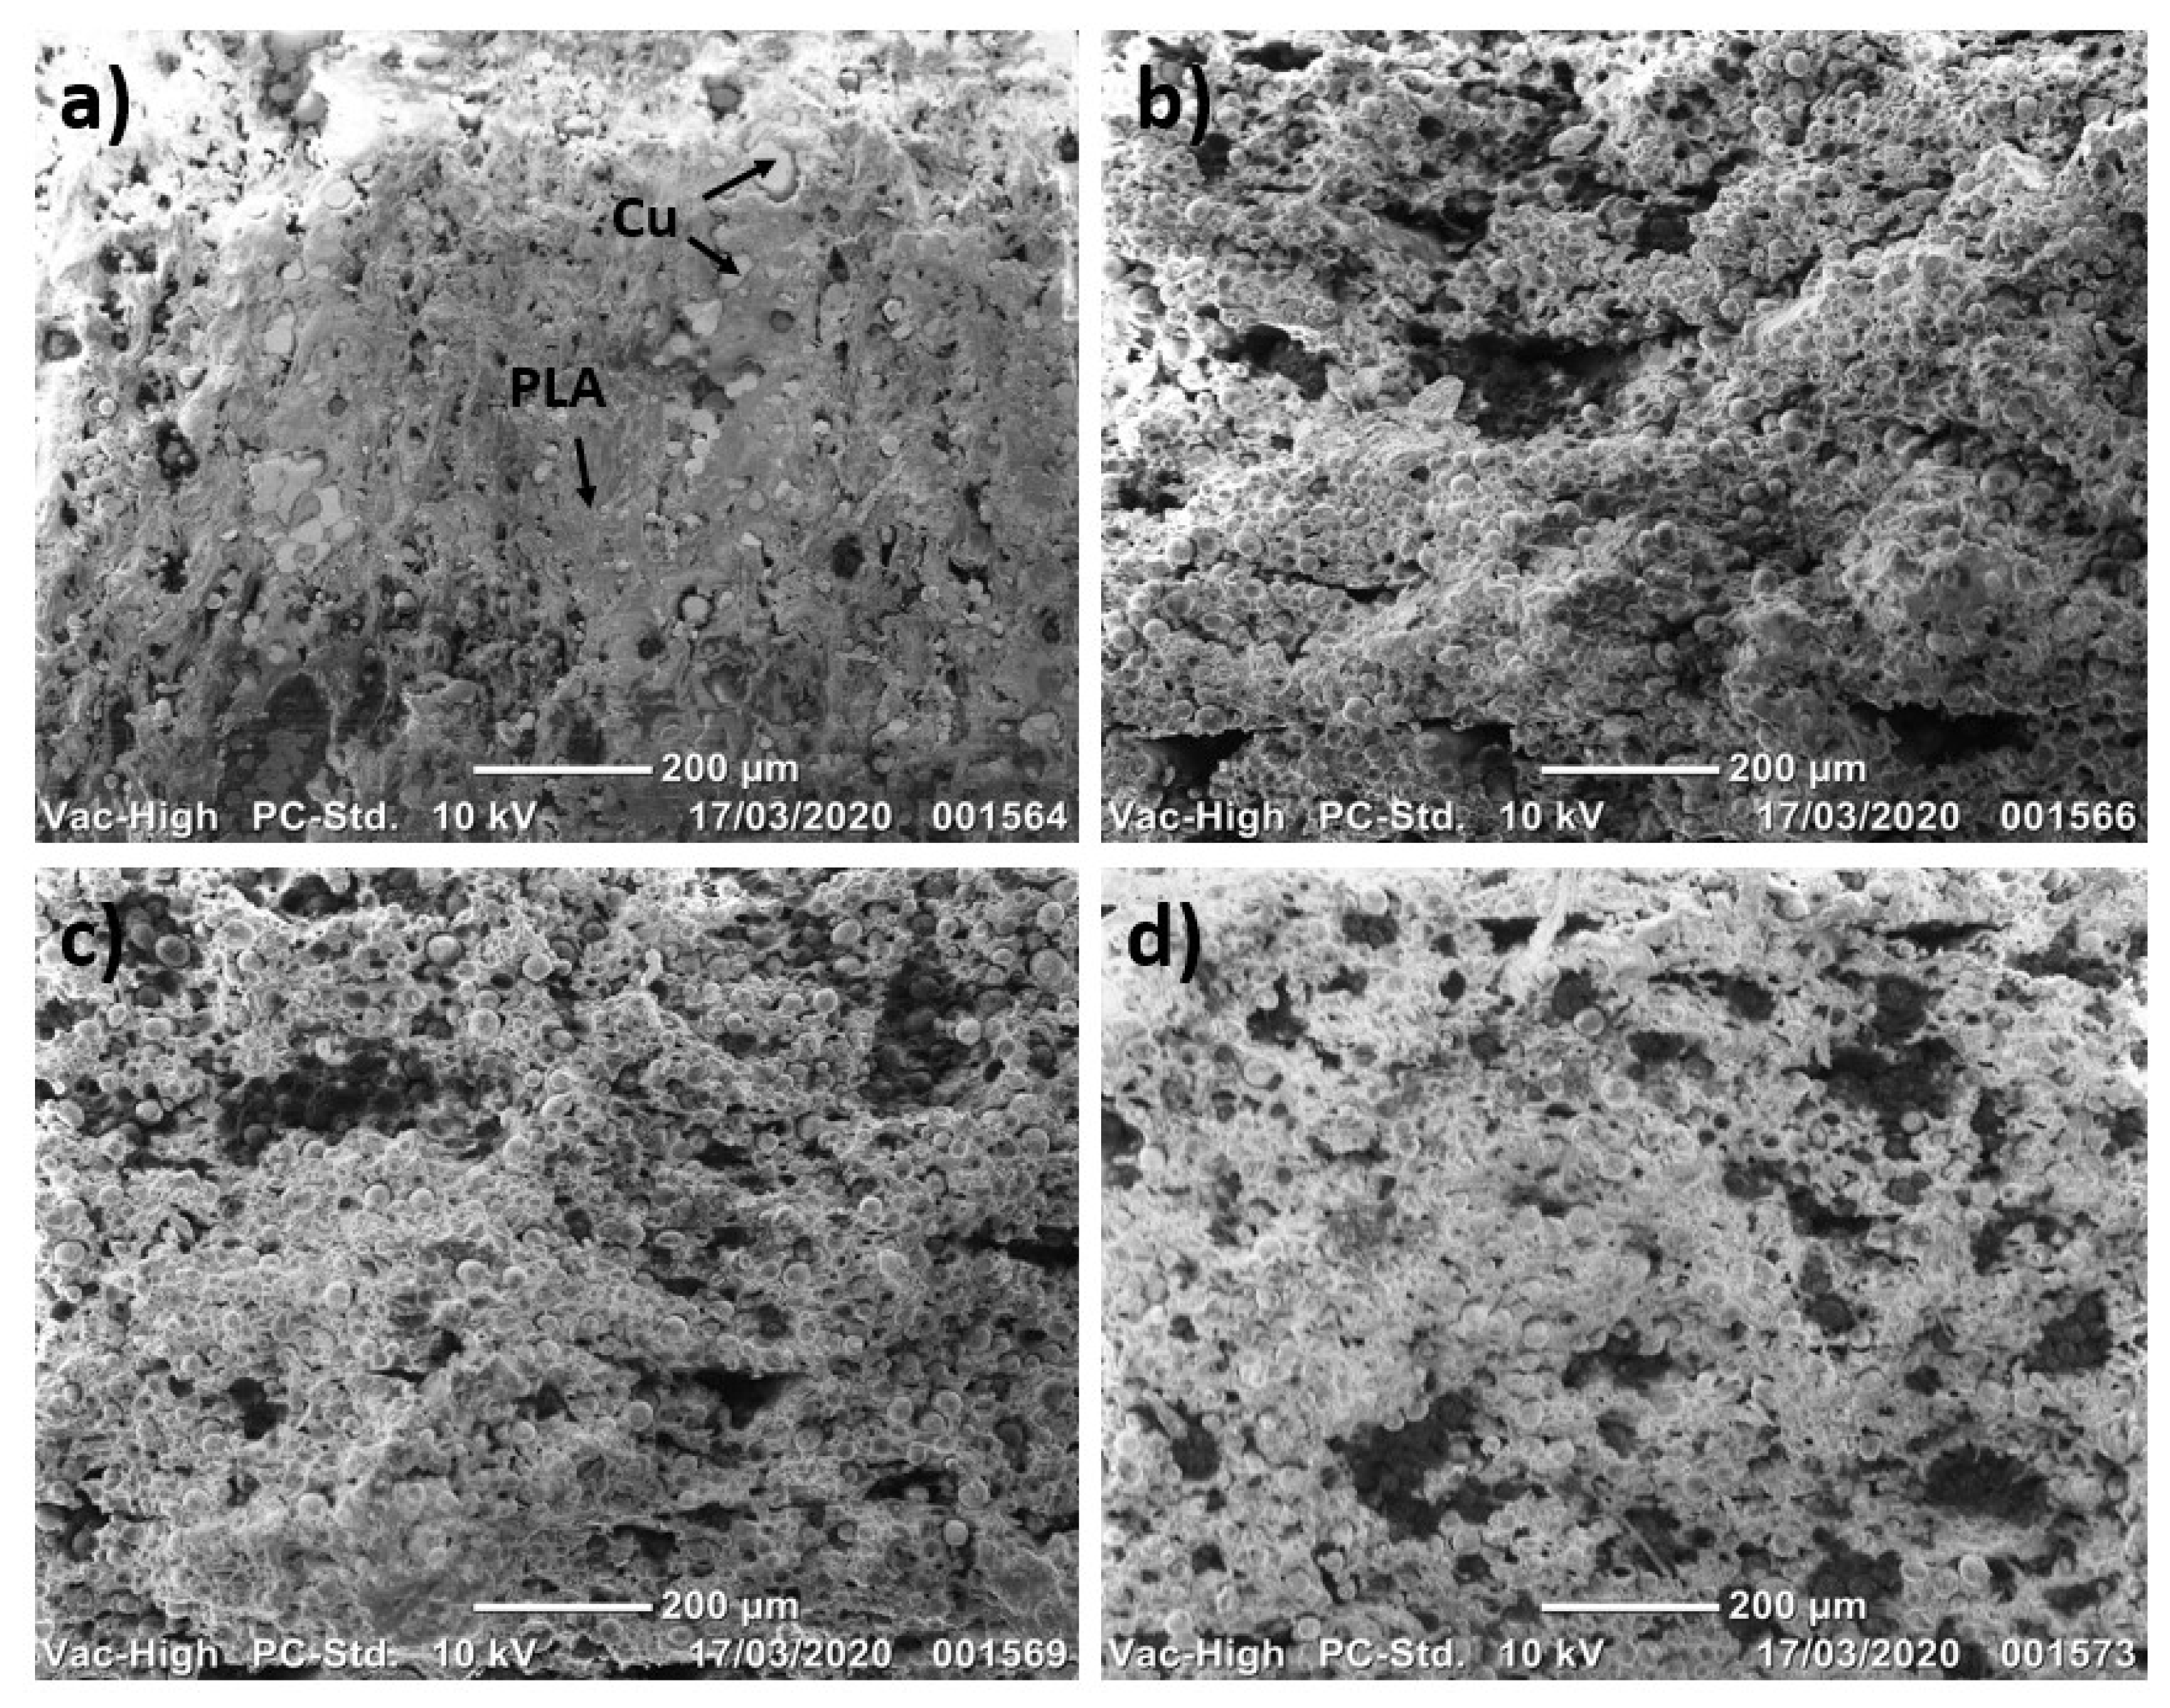
Cu-PLA shows the clear presence of Cu particles in Figure 14a. At 70 °C, the distance among these particles has reduced and they have clustered together showing some voids in Figure 14b. With the increase in annealing temperature, these particles have amalgamated to a large extent and more voids have become visible (Figure 14c,d). This amalgamation is the reason for the higher fracture load values and lower transmission times of annealed Cu-PLA samples compared to the unannealed ones. It is to be noted that the amalgamation should be controlled for better results. Both semi-crystalline materials, i.e., PLA and Cu-PLA, have shown consistent characteristics for all the experimental testing conducted in this work.
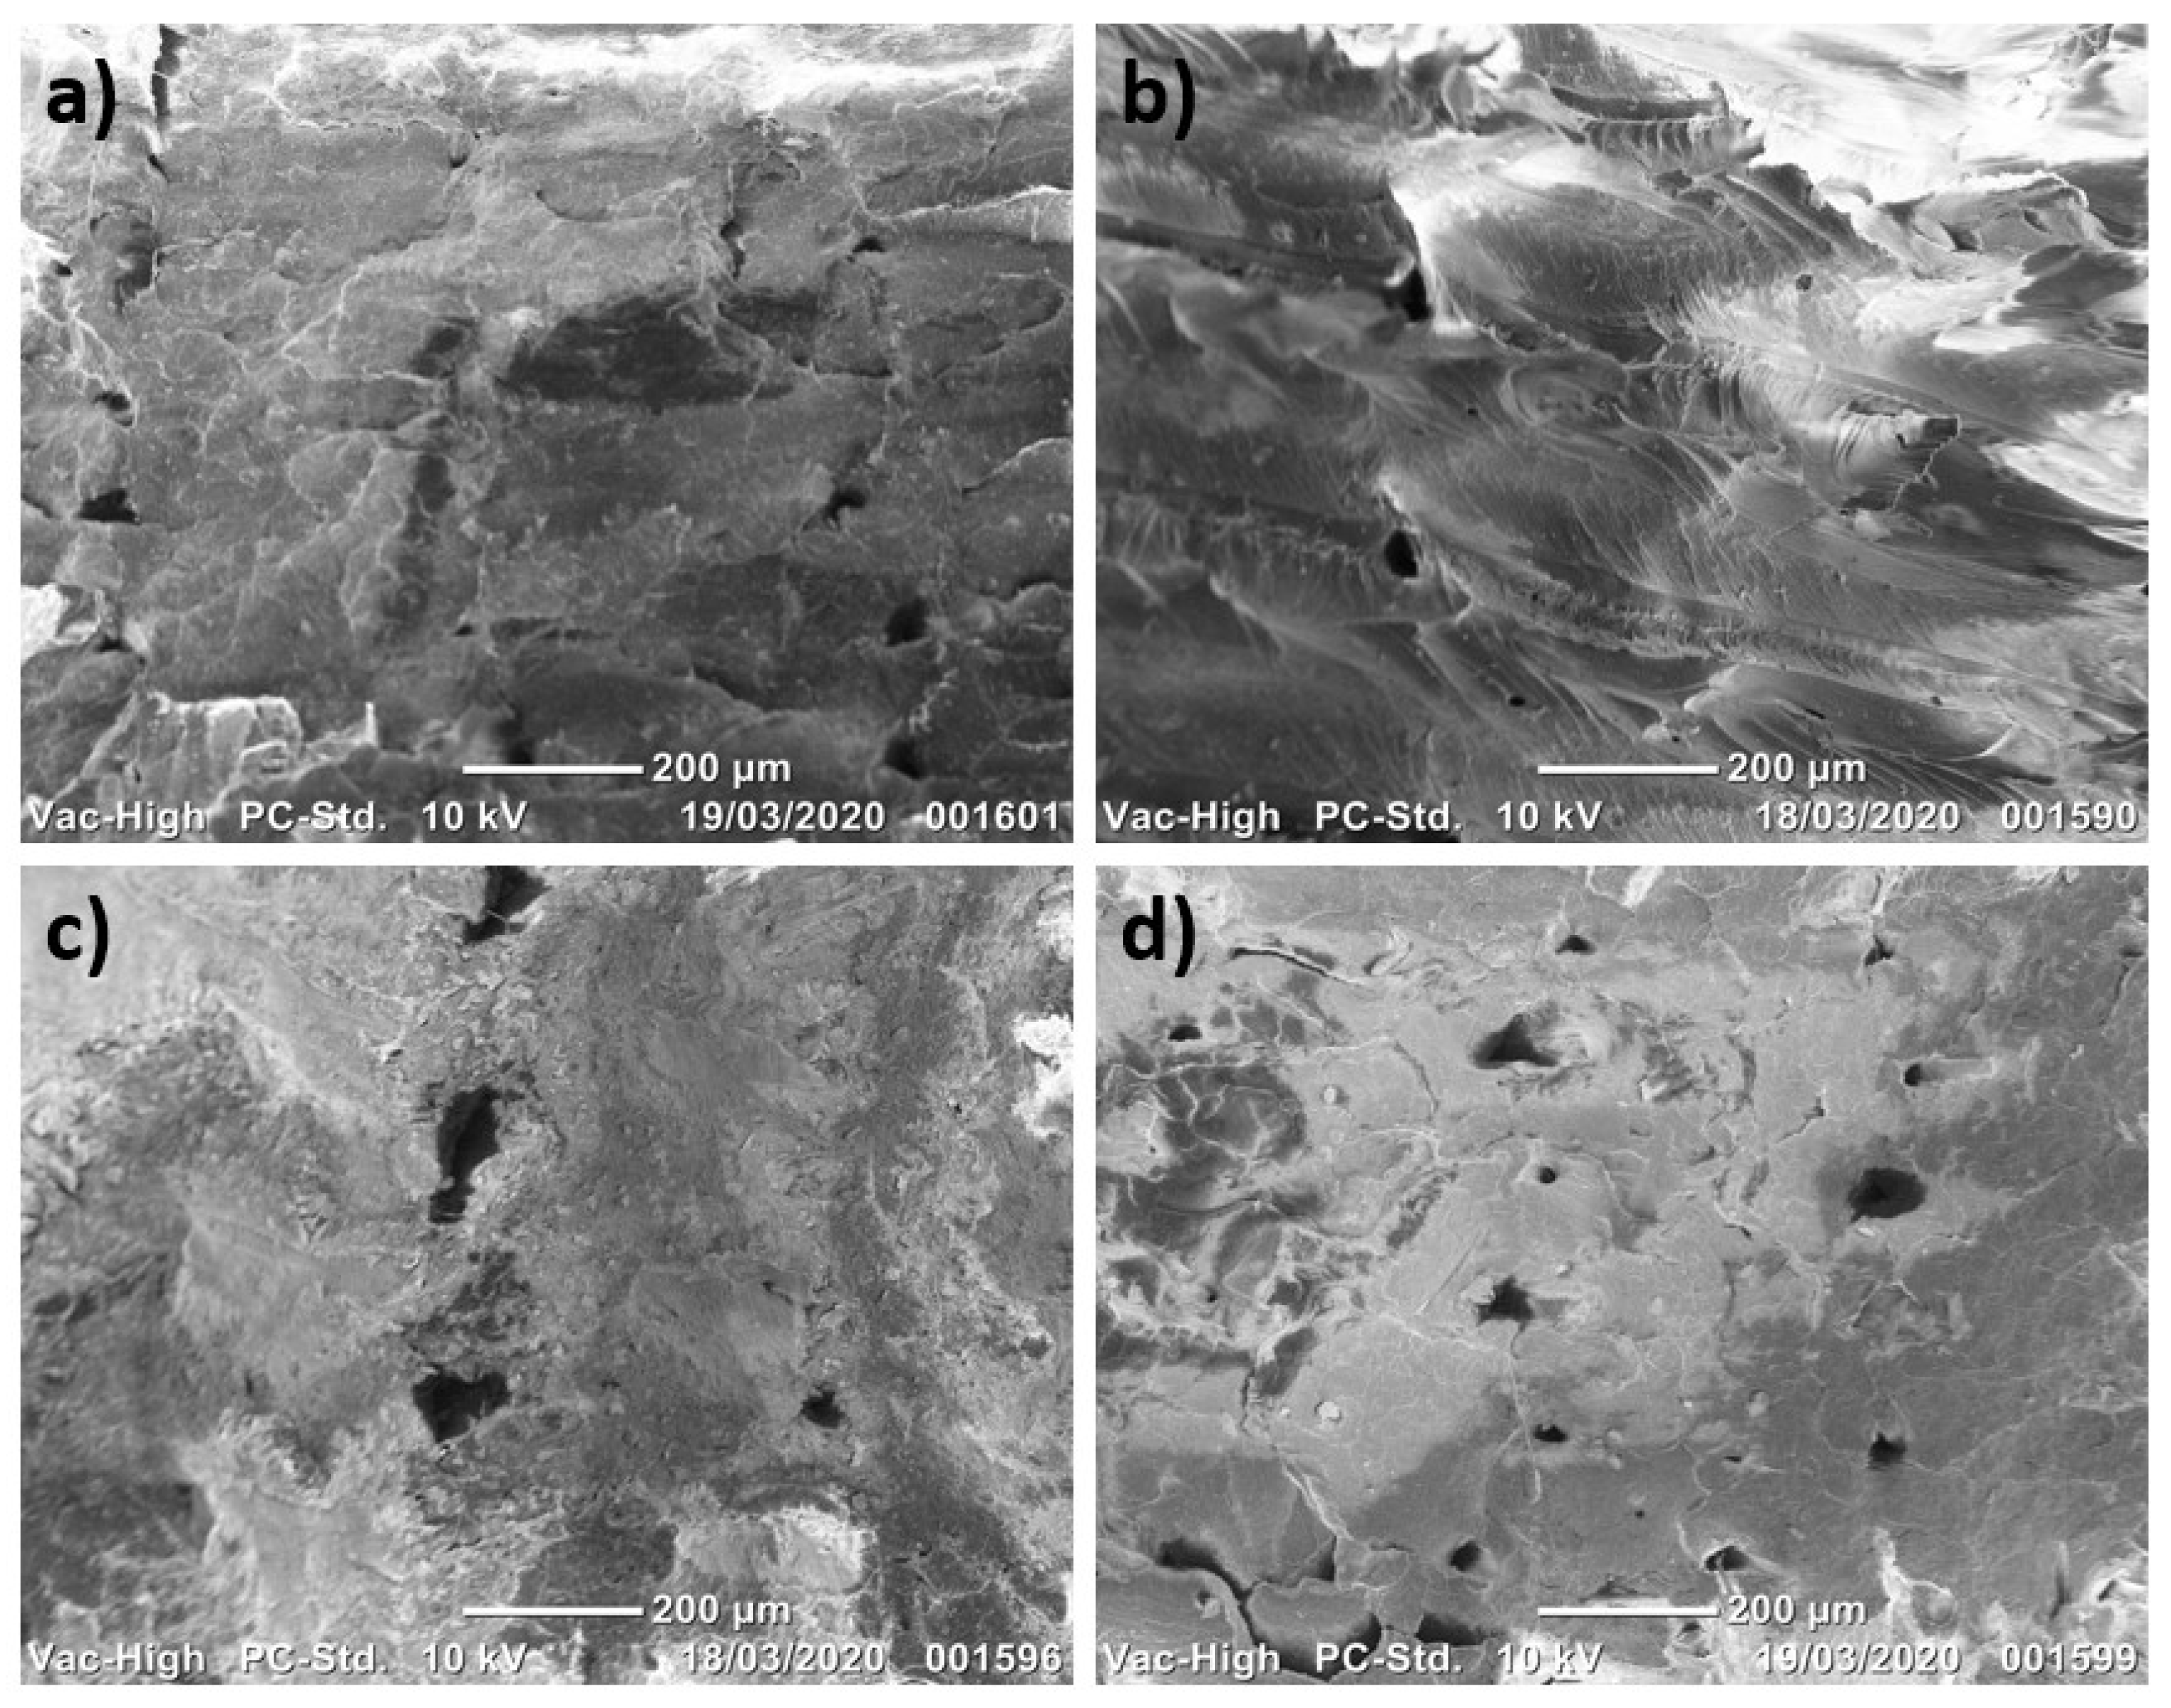
Figure 15 shows the SEM micrographs for the ABS material. It can be observed in Figure 15a that the weld joints of untreated ABS sample have uneven waviness. This may be due to the uneven cooling of the material that resulted in poor surface characteristics [19]. The unevenness has reduced slightly in Figure 15b, but at the same time, the voids can be seen along a straight line in the sample as a result of the material being pulled during tensile testing. Figure 15c shows the smoothest weld joint characteristics at 115 °C; the temperature at which the maximum fracture load values and lowest transmission times were observed during tensile and ultrasonic testing, respectively. The pulled layers also became apparent in Figure 15d at 125 °C, showing a reduction in fracture load values and increased transmission times. The microstructural analysis of ABS has supported the results obtained through ultrasonic and tensile testing.
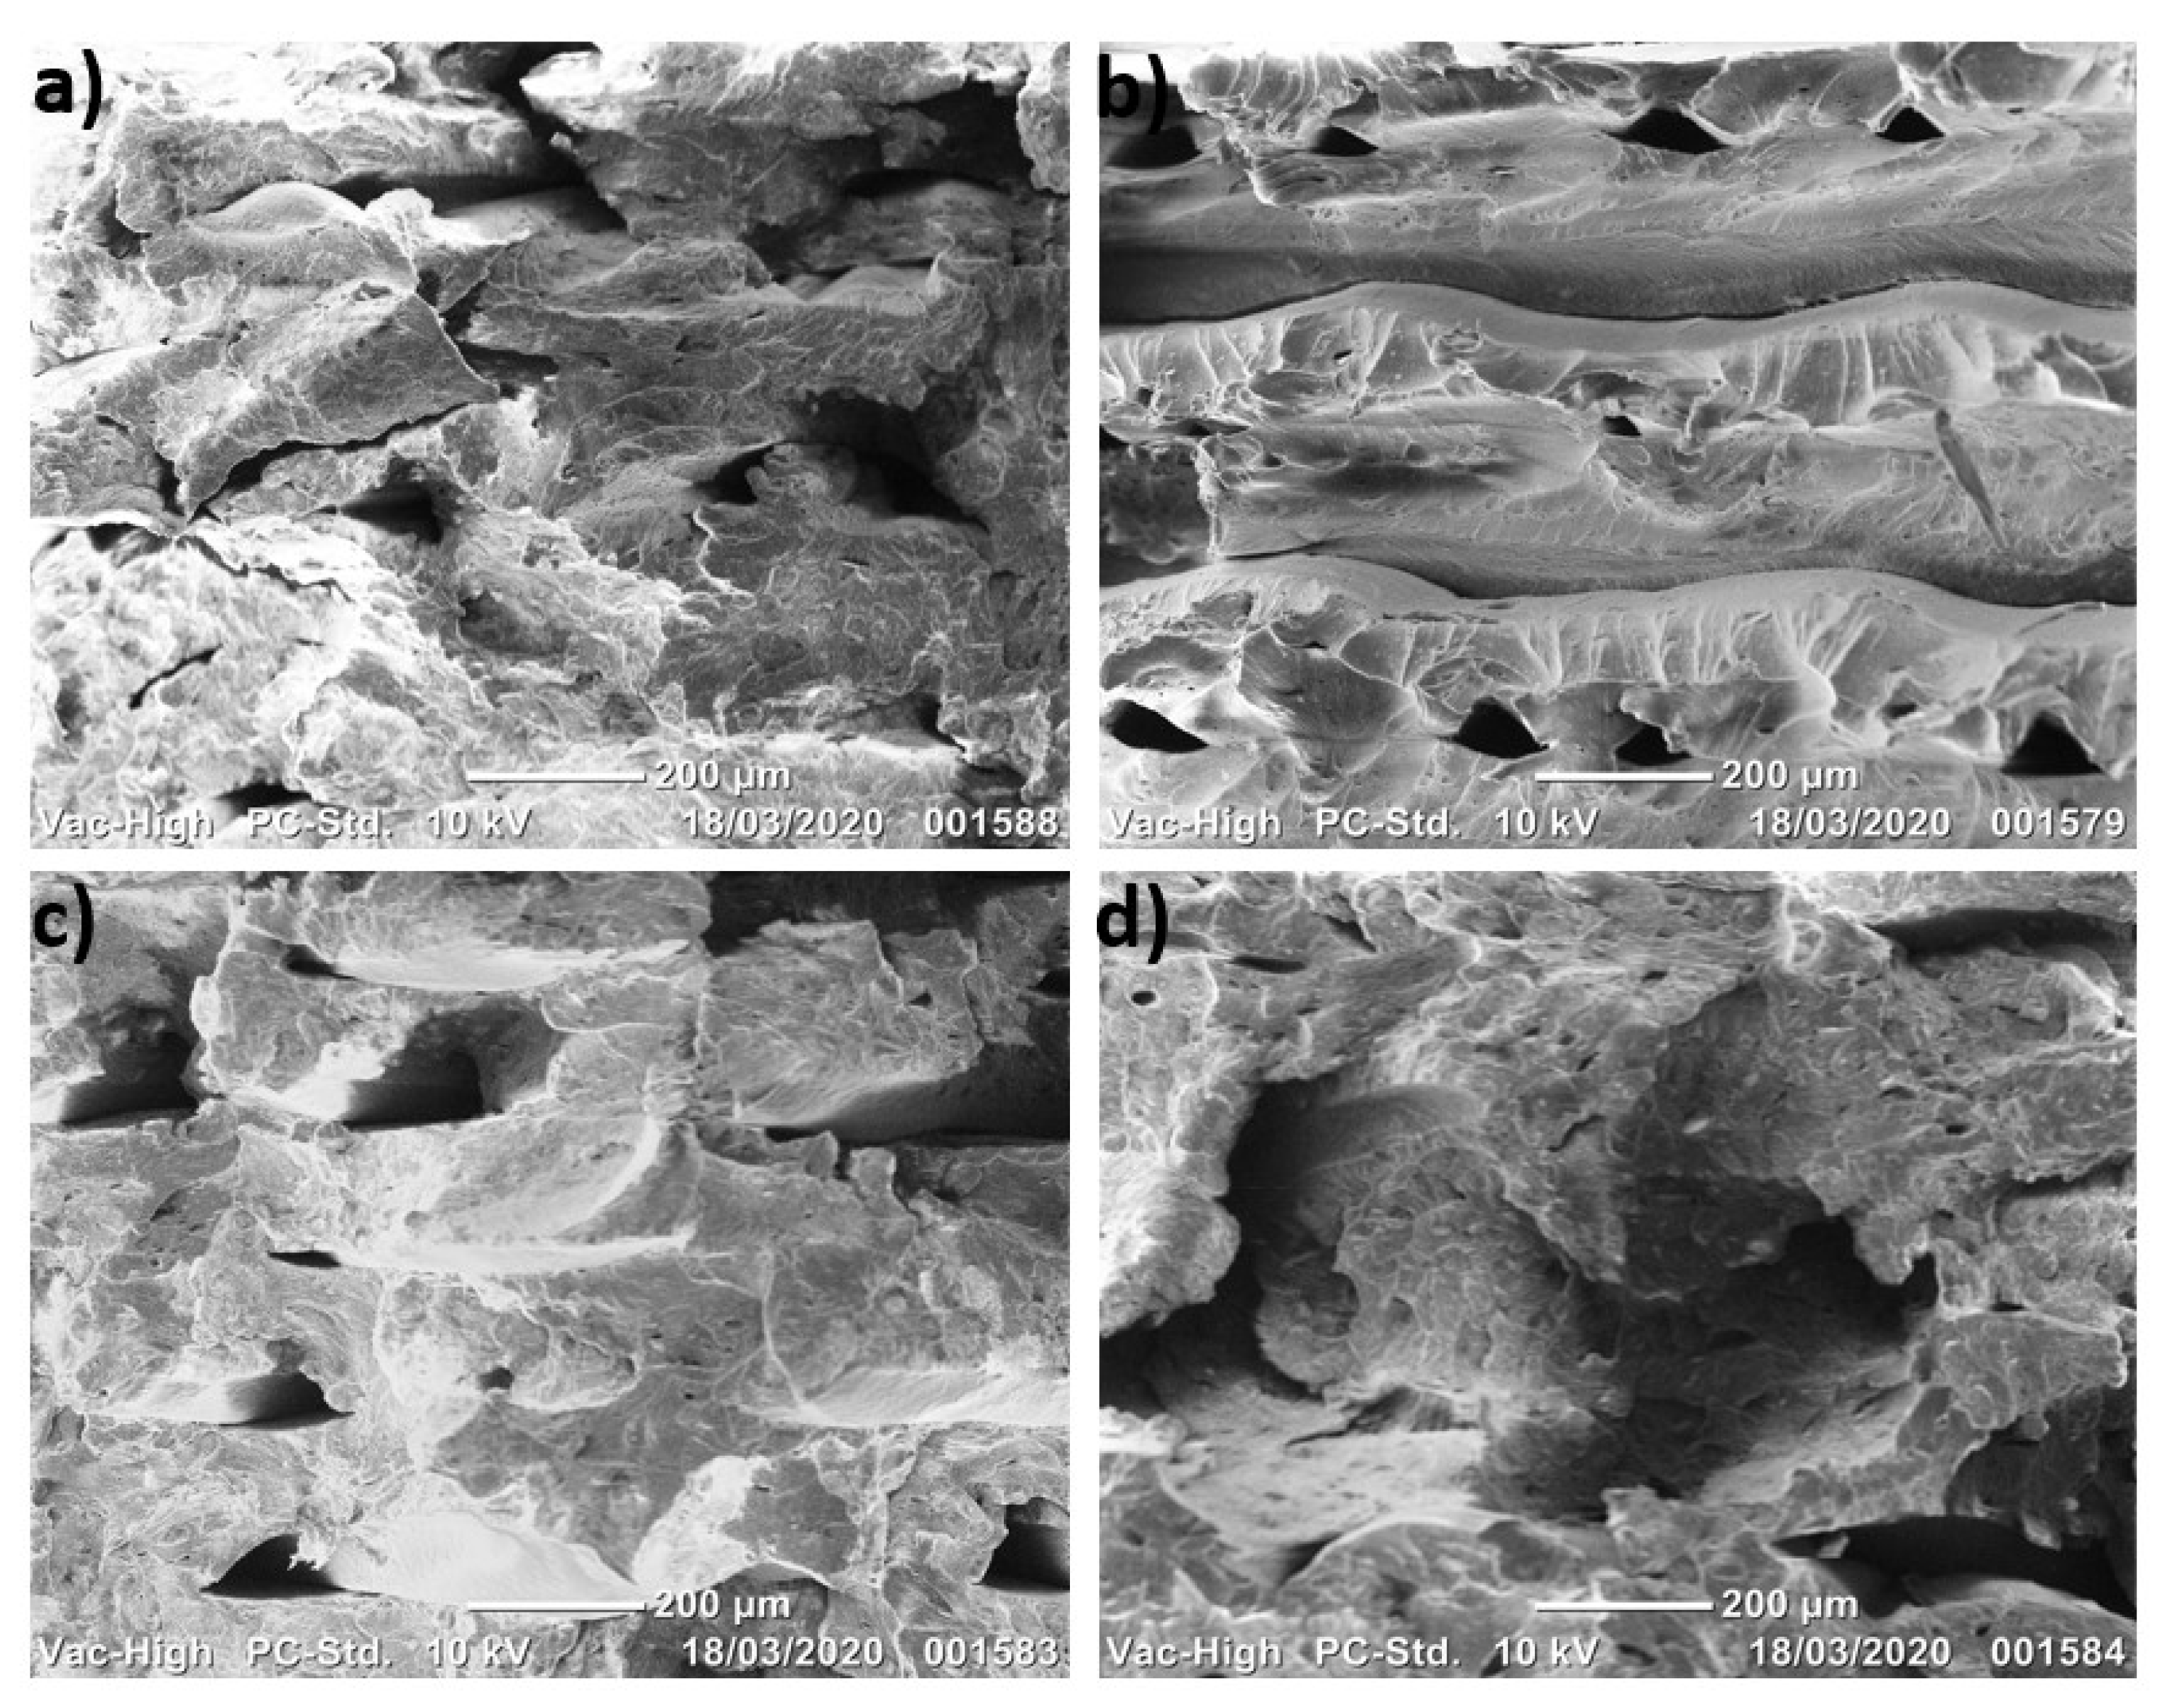
As highlighted in Section 4.1, Al-ASA suffered significant deformation due to annealing at 105 °C. This material is heat resistant up to 93 °C and therefore should not be subjected to higher operating temperatures. In terms of the micrographs, the voids are quite visible in Figure 16. The sample annealed at 70 °C showed the maximum fracture load values and the lowest transmission times. Upon analysing Figure 16b and comparing it to Figure 16c,d, the size of the voids is smaller. However, the size of the voids continues to grow with elevated annealing temperatures. The sample annealed at 90 °C shows the largest voids and this is also the sample with the lowest fracture load values of all the annealed samples.
4.5. Results from Hardness Testing
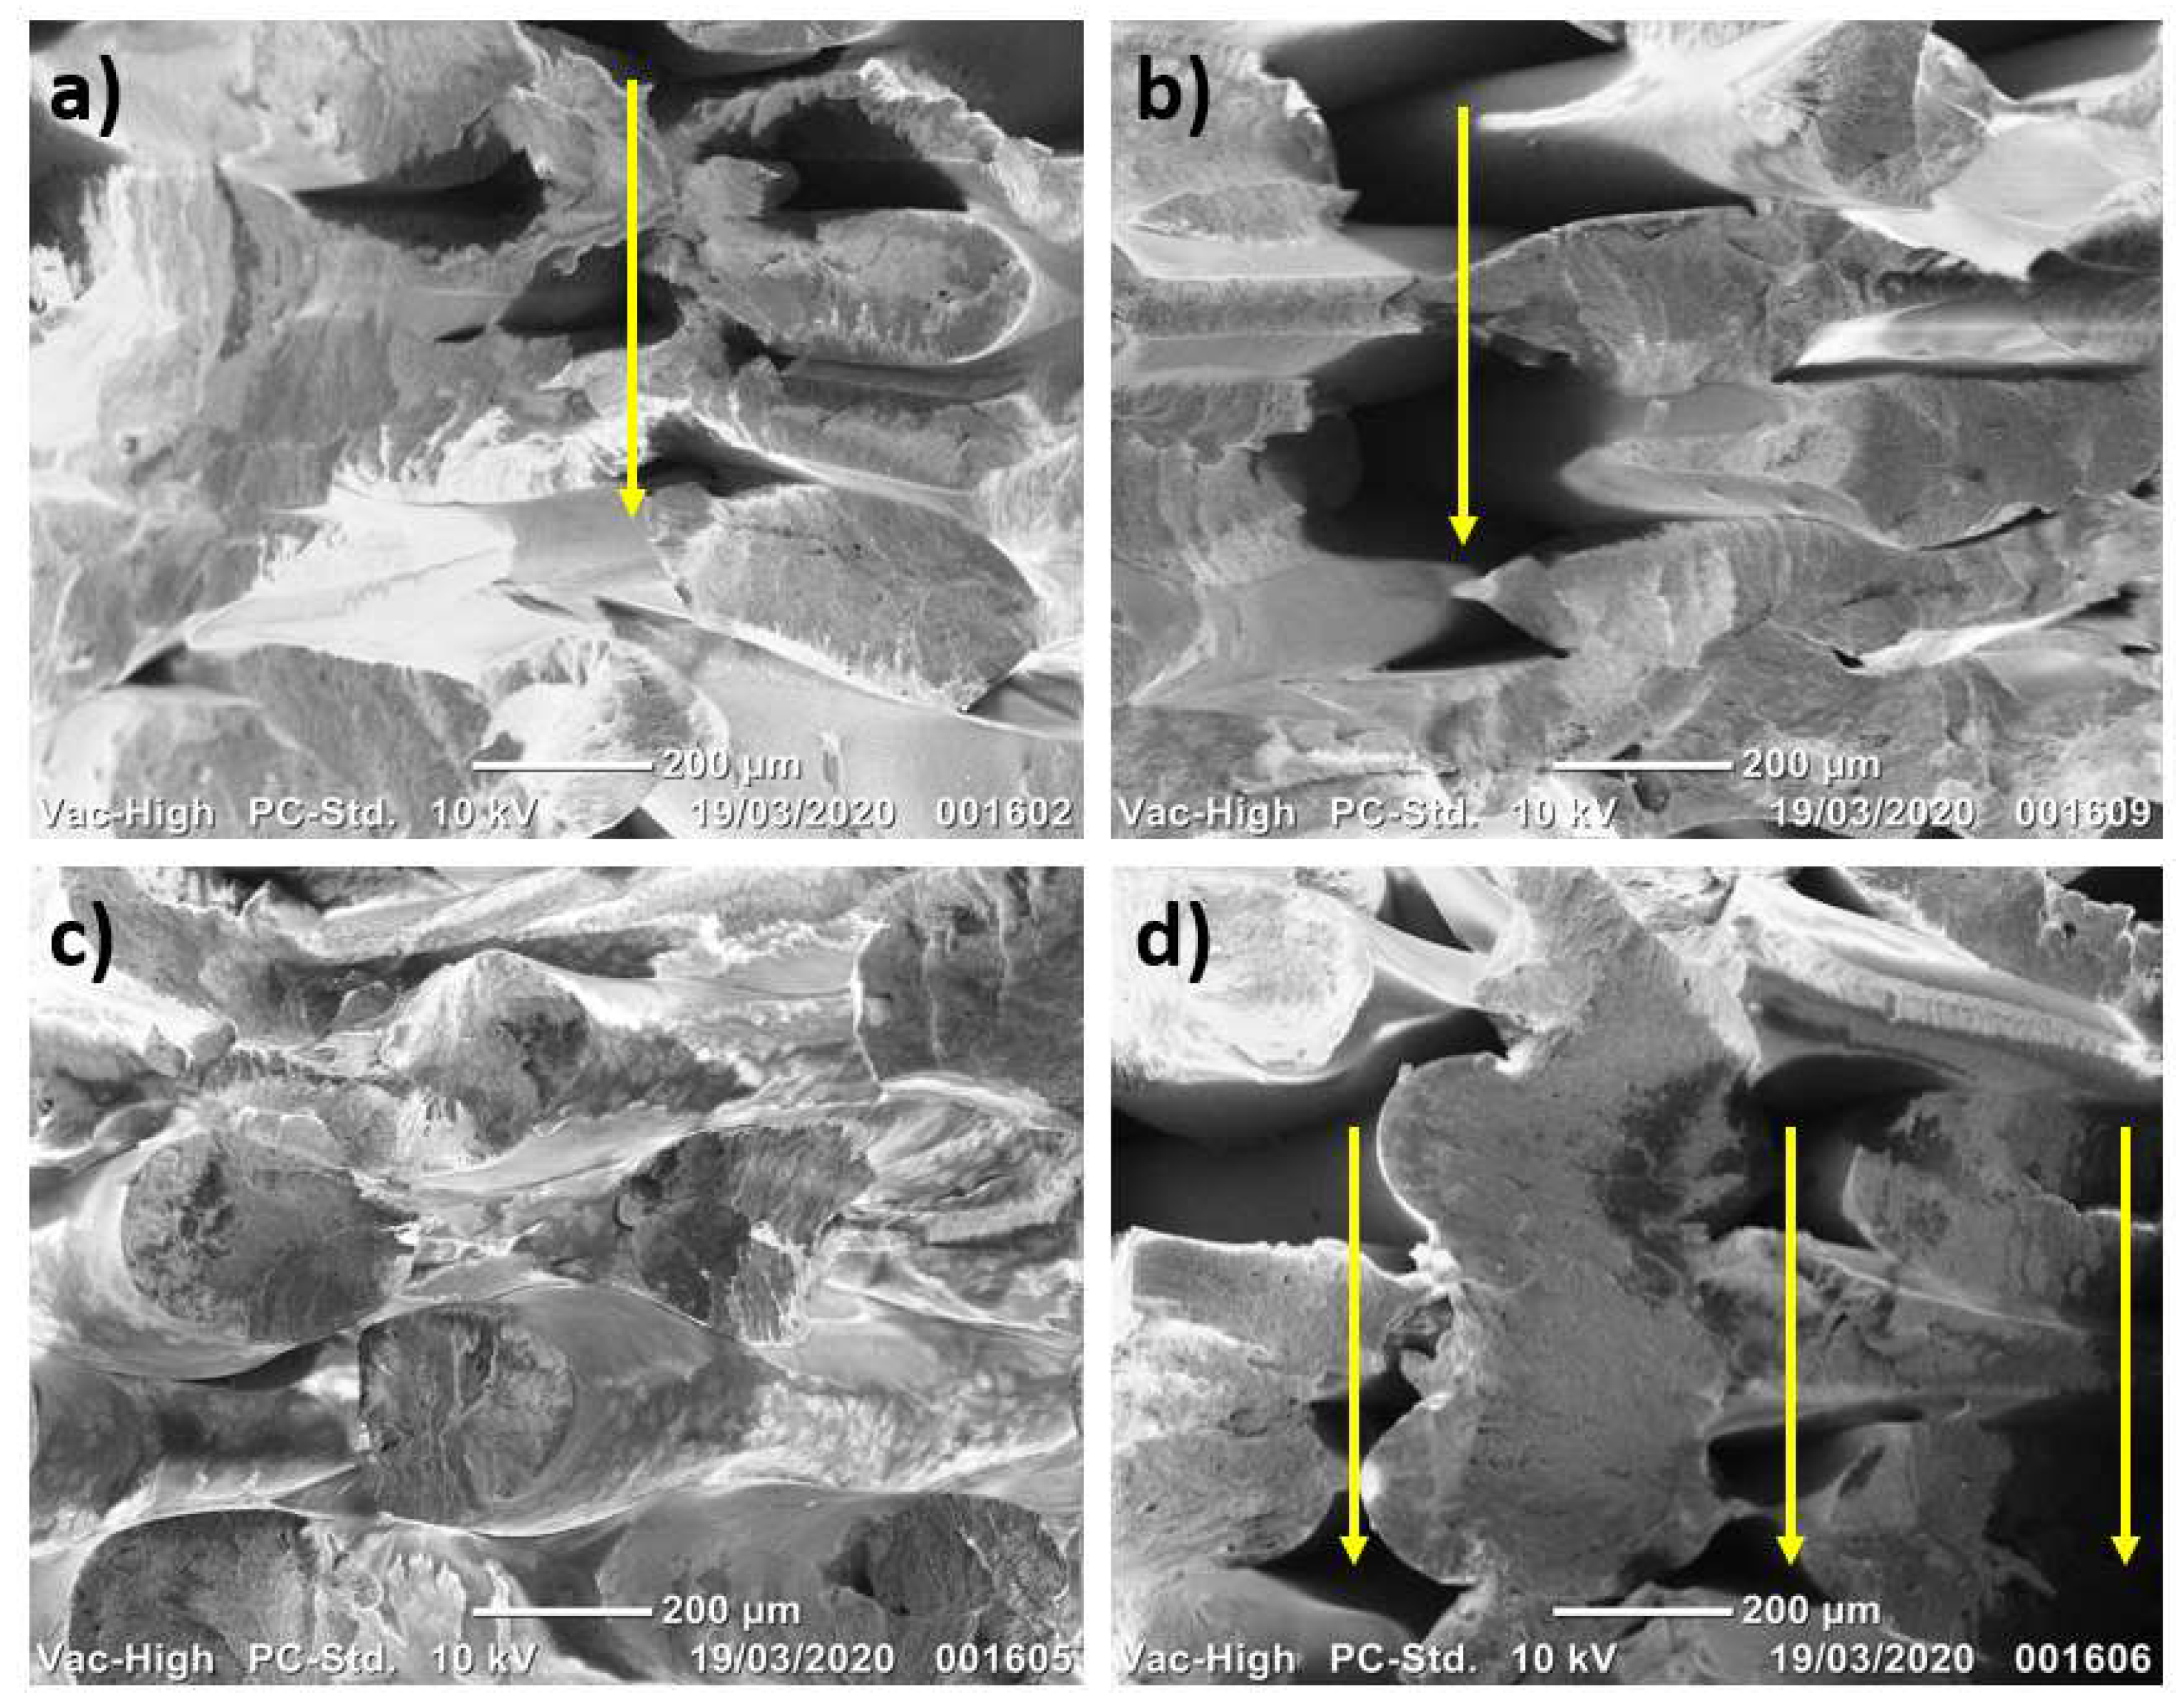
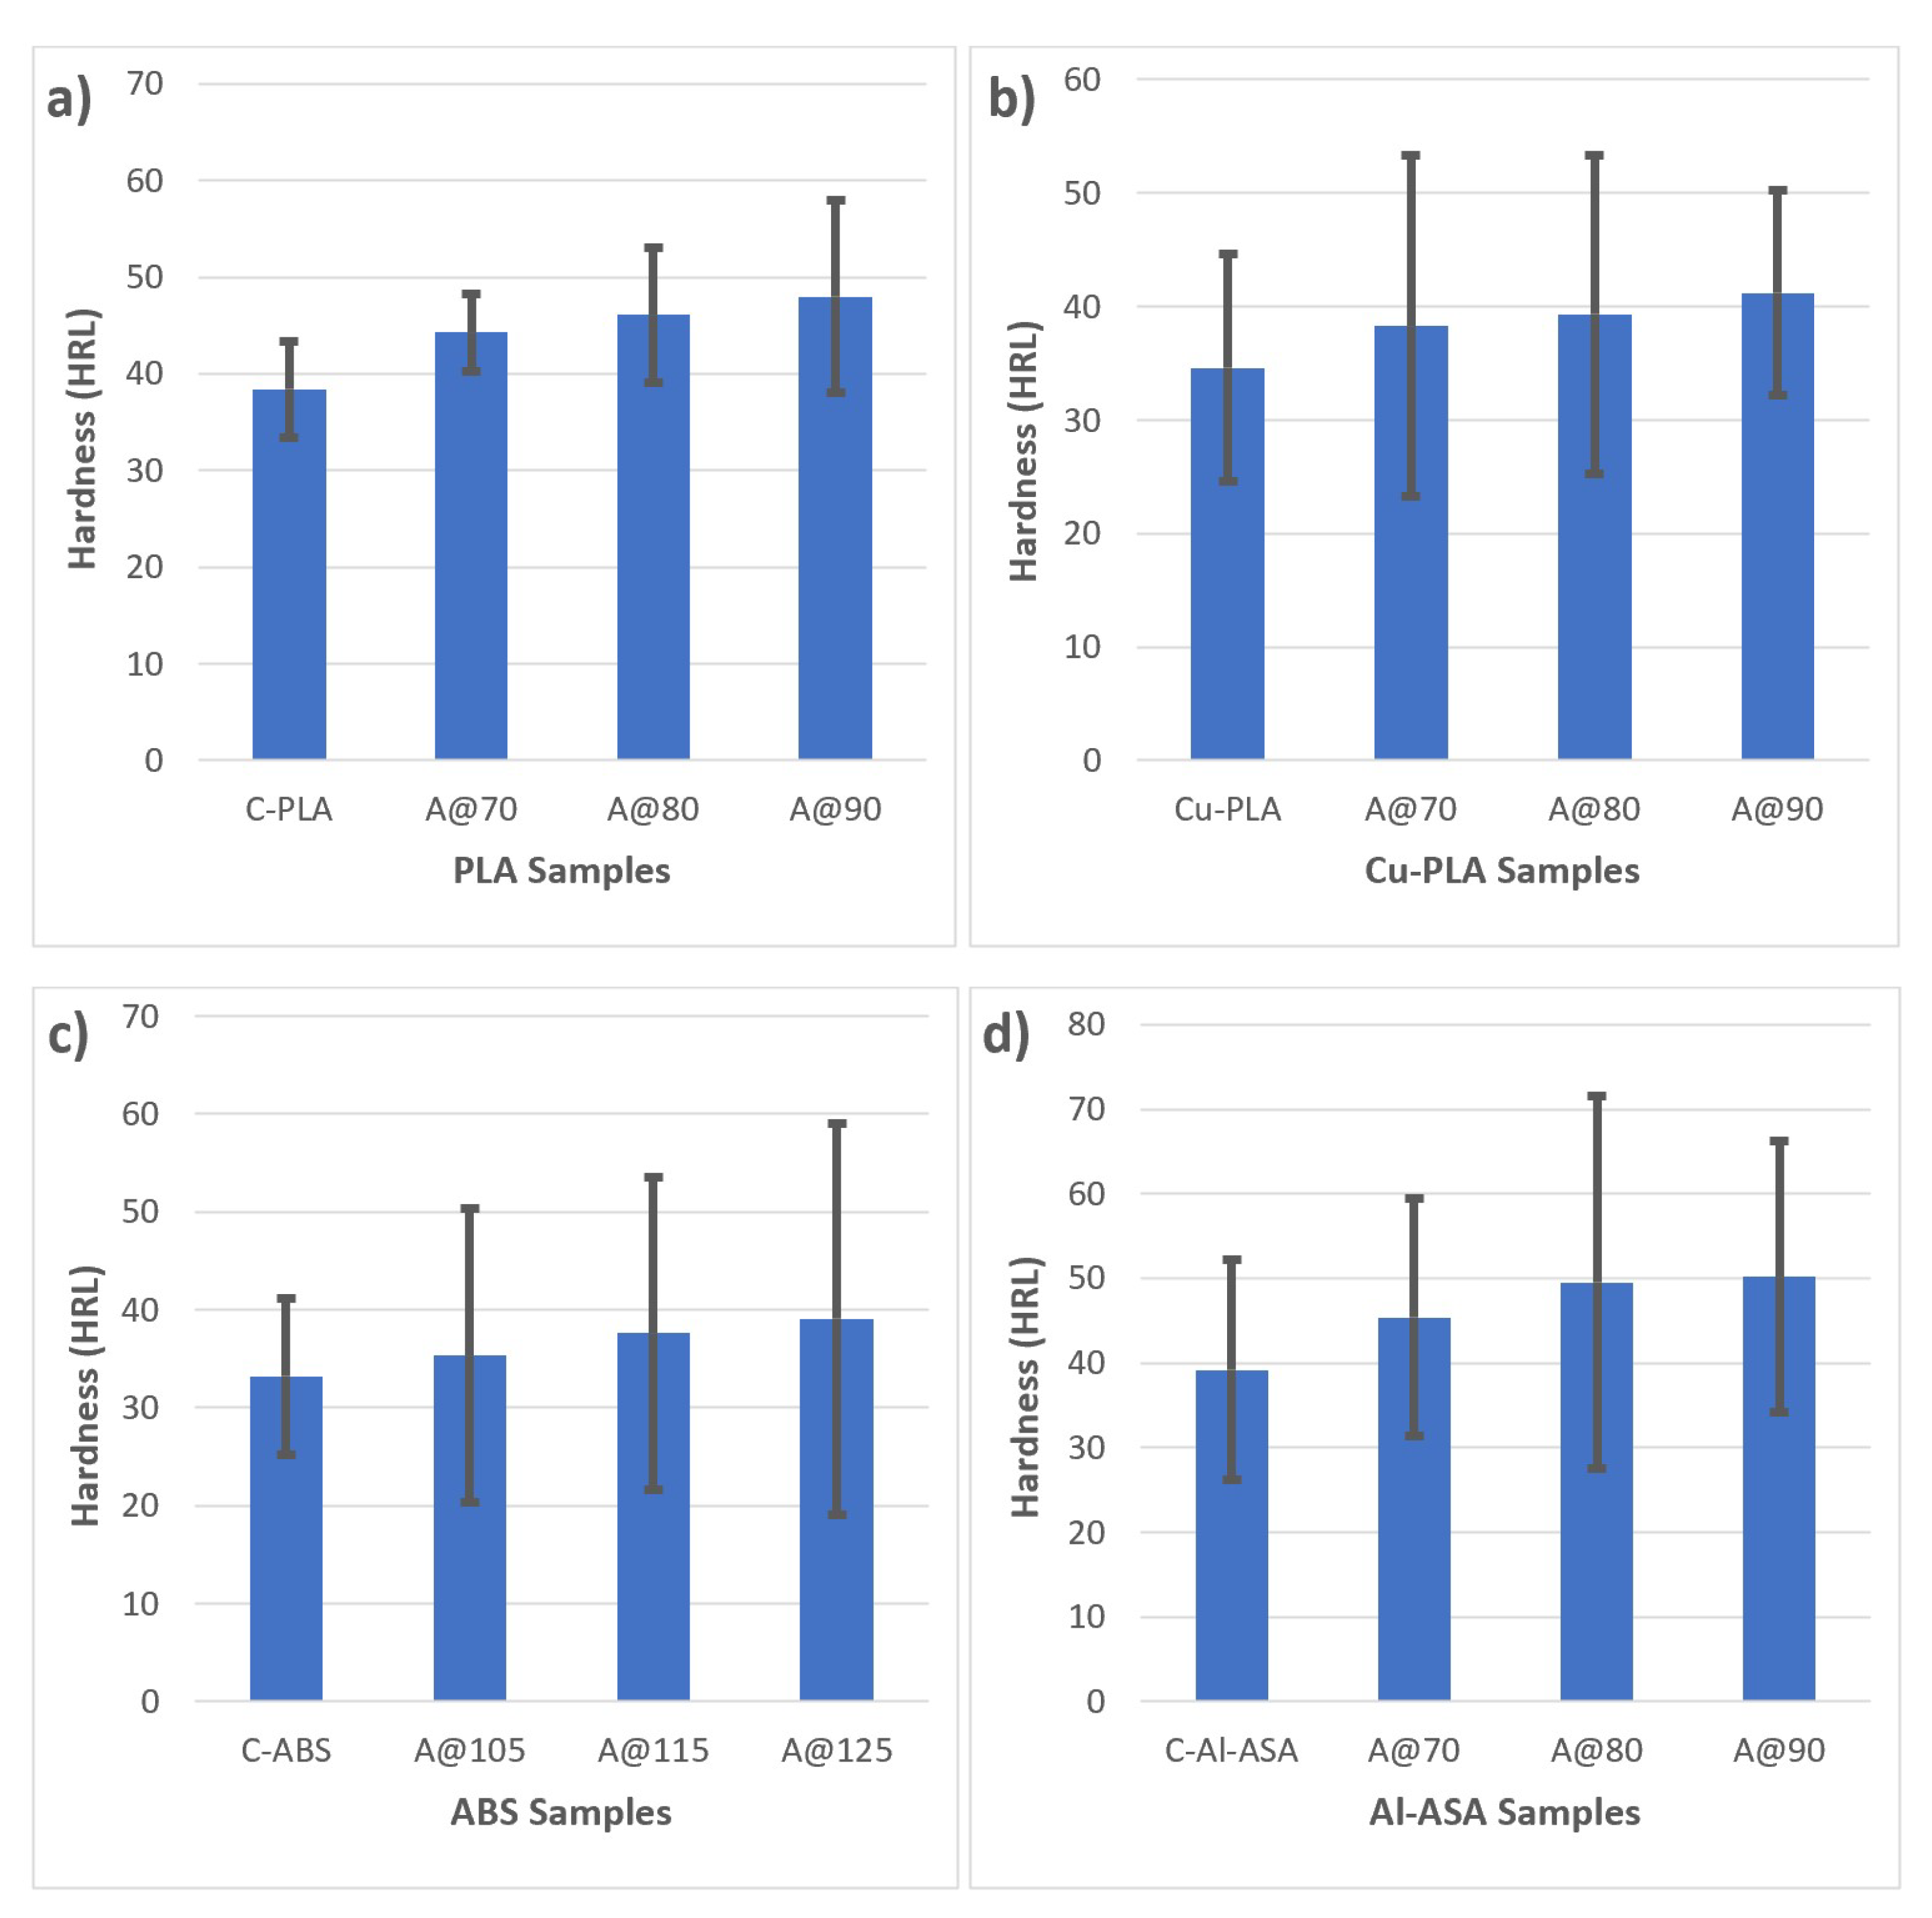
Hardness measurements quantify the resistance of a material to plastic deformation and indentation hardness tests are used to determine material hardness. There are two main categories for indentation hardness tests, i.e., micro-indentation and macro-indentation tests. Micro-indentation tests typically have forces less than 2 N. The results obtained in this work are based on macro-indentation as the applied minor and major loads were 98.07 N and 588.4 N respectively. As with any testing procedure, there are sources of errors that should be mitigated. These errors include but are not limited to poor technique, poor calibration of the equipment and the strain hardening effect of the process. Annealing can reduce surface roughness that can lead to higher hardness values [43,44]. It is to be noted that FFF parameters can also play a major role in determining the indentation hardness, e.g., infill percentage, infill pattern and number of shells. An average of five values was taken from each sample that was equidistant from each other as shown in Figure 17, and the results of Rockwell hardness scale L are shown in Figure 18.
As evident from the hardness test results, all the materials experienced an increase in hardness numbers with elevated temperatures. This is because annealing has reduced the internal stresses and the weld joins for the FFF samples have become more uniform. According to the results, Al-ASA samples have the highest hardness values with PLA as second, Cu-PLA as third and ABS with the lowest values. The difference between the maximum values of Cu-PLA (41.2 HRL) and ABS (39.1 HRL) is not significant, but ABS achieved these values at 125 °C whereas Cu-PLA was annealed to a maximum of 90 °C in this work. Hard materials are often also brittle. This can be seen in Figure 9 and Figure 10 where only ABS offered a small degree of ductility as evident from the slight discoloration near the fractured area. Furthermore, the difference in measurements can be observed for all the materials. This can be attributed to the indenter not being able to compress a uniformly packed surface. Hardness values are greatly affected by surface roughness. FFF-printed samples are usually rougher than other types of plastic parts because of the layer by layer operation and these layers are visible on the surface of the samples after the print [45]. Even though annealing has reduced the surface roughness to an extent, two common situations may arise, i.e., the indenter meeting a peak or a valley. In the former, the non-uniform contact will increase the localized stress at the contact point and will deform the material to a greater depth at relatively low loads. This will result in greater penetration depth and lower calculated hardness value. In the case of the latter, when the indenter meets a valley the true contact area will be underestimated and consequently, the calculated hardness will be overestimated [46].
5. Conclusions
In this study, two categories of polymers were investigated, i.e., semi-crystalline and amorphous. Commonly available FFF materials in PLA and ABS along with metal-infused materials in copper enhanced PLA and aluminium enhanced ASA were subjected to experimental testing to analyse the effect of annealing. The following conclusions were drawn from this study:
- Annealing can adversely affect the dimensional tolerances of FFF-printed parts. Therefore, it is crucial to take the relevant shrinkage/expansion into consideration when designing parts to be printed by FFF and subjected to annealing afterward.
- Ultrasonic testing was used to assess the crystallinity of the annealed and unannealed samples. This NDT was able to accurately show lower transmission times of sound waves for samples annealed at higher temperatures compared to the unannealed ones.
- Tensile testing showed positive results on the semi-crystalline materials (PLA and Cu-PLA). However, the results for the amorphous materials (ABS and Al-ASA) were not comparable with the semi-crystalline materials. Therefore, a strong case should be made to anneal ABS and Al-ASA material for a small increment in tensile strength.
- The microstructural analysis supported the results obtained through ultrasonic and tensile testing. It showed a high percentage of voids for samples with high transmission times and lower fracture load values.
- Testing the materials for Rockwell hardness (scale L) showed that Al-ASA has the highest hardness value (50.2 HRL), PLA is second (48 HRL), Cu-PLA (41.2 HRL) is third and ABS (39.1 HRL) has the lowest hardness values. The maximum values for all the materials were obtained at the highest annealing temperatures specified in this work.
Author Contributions
J.B. conceptualised the idea, designed the methodology, undertook data curation, investigation, formal analysis, project administration, manuscript writing, reviewing and editing; R.B. undertook data curation, investigation, formal analysis, and acquired resources. All authors have read and agreed to the published version of the manuscript.
Funding
This research did not receive any external funding.
Conflicts of Interest
The authors declare no conflict of interest.
References
- Standard, A.S.T.M. Standard Terminology for Additive Manufacturing Technologies; ASTM International F2792-12a: West Conshohocken, PA, USA, 2012. [Google Scholar]
- Butt, J. A Novel Additive Manufacturing Process for the Production of Metal Parts. Ph.D. Thesis, Anglia Ruskin University, Cambridge, UK, 2016. [Google Scholar]
- Butt, J.; Mebrahtu, H.; Shirvani, H. Metal rapid prototyping technologies. In Advances in Engineering Research; Petrova, V.M., Ed.; Nova Science Publishers, Inc.: New York, NY, USA, 2017; Chapter 2; Volume 14, pp. 13–52. [Google Scholar]
- Butt, J.; Shirvani, H. Experimental analysis of metal/plastic composites made by a new hybrid method. Addit. Manuf. 2018, 22, 216–222. [Google Scholar] [CrossRef]
- Butt, J.; Shirvani, H. Additive, subtractive, and hybrid manufacturing processes. In Advances in Manufacturing and Processing of Materials and Structures; CRC Press: Boca Raton, FL, USA, 2018; pp. 187–218. [Google Scholar]
- Gao, J. Production of multiple material parts using a desktop 3D printer. In Advances in Manufacturing Technology XXXI: Proceedings of the 15th International Conference on Manufacturing Research, Incorporating the 32nd National Conference on Manufacturing Research, University of Greenwich, London, UK, 5–7 September 2017; IOS Press: Amsterdam, The Netherlands, 2017; Volume 6, p. 148. [Google Scholar]
- Charbonnier, B.; Menezo, S.; O’Brien, P.; Lebreton, A.; Fedeli, J.M.; Bakir, B.B. Silicon photonics for next generation FDM/FDMA PON. J. Opt. Commun. Netw. 2012, 4, A29–A37. [Google Scholar] [CrossRef]
- Butt, J.; Onimowo, D.A.; Gohrabian, M.; Sharma, T.; Shirvani, H. A desktop 3D printer with dual extruders to produce customised electronic circuitry. Front. Mech. Eng. 2018, 13, 528–534. [Google Scholar] [CrossRef]
- Ning, F.; Cong, W.; Qiu, J.; Wei, J.; Wang, S. Additive manufacturing of carbon fiber reinforced thermoplastic composites using fused deposition modeling. Compos. Part B Eng. 2015, 80, 369–378. [Google Scholar] [CrossRef]
- Ning, F.; Cong, W.; Hu, Y.; Wang, H. Additive manufacturing of carbon fiber-reinforced plastic composites using fused deposition modeling: Effects of process parameters on tensile properties. J. Compos. Mater. 2017, 51, 451–462. [Google Scholar] [CrossRef]
- Liu, Z.; Lei, Q.; Xing, S. Mechanical characteristics of wood, ceramic, metal and carbon fiber-based PLA composites fabricated by FDM. J. Mater. Res. Technol. 2019, 8, 3741–3751. [Google Scholar] [CrossRef]
- Sa’ude, N.; Masood, S.H.; Nikzad, M.; Ibrahim, M.; Ibrahim, M.H.I. Dynamic mechanical properties of copper-ABS composites for FDM feedstock. Int. J. Eng. Res. Appl. 2013, 3, 1257–1263. [Google Scholar]
- Sanchez, D.M.; de la Mata, M.; Delgado, F.J.; Casal, V.; Molina, S.I. Development of carbon fiber acrylonitrile styrene acrylate composite for large format additive manufacturing. Mater. Des. 2020, 1941, 108577. [Google Scholar] [CrossRef]
- Yang, C.; Tian, X.; Li, D.; Cao, Y.; Zhao, F.; Shi, C. Influence of thermal processing conditions in 3D printing on the crystallinity and mechanical properties of PEEK material. J. Mater. Process. Technol. 2017, 248, 1–7. [Google Scholar] [CrossRef]
- Liao, Y.; Liu, C.; Coppola, B.; Barra, G.; Di Maio, L.; Incarnato, L.; Lafdi, K. Effect of porosity and crystallinity on 3D printed PLA properties. Polymers 2019, 11, 1487. [Google Scholar] [CrossRef] [Green Version]
- Lee, S.K.; Kim, Y.R.; Kim, S.H.; Kim, J.H. Investigation of the internal stress relaxation in FDM 3D printing: Annealing conditions. J. Korean Soc. Manuf. Process Eng. 2018, 17, 130–136. [Google Scholar] [CrossRef]
- Beniak, J.; Holdy, M.; Križan, P.; Matúš, M. Research on parameters optimization for the Additive Manufacturing process. Transp. Res. Procedia 2019, 40, 144–149. [Google Scholar] [CrossRef]
- Slavković, V.; Grujović, N.; Dišić, A.; Radovanović, A. Influence of annealing and printing directions on mechanical properties of PLA shape memory polymer produced by fused deposition modeling. In Proceedings of the 6th International Congress of Serbian Society of Mechanics Mountain Tara, Mountain Tara, Serbia, 19–21 June 2017; pp. 19–21. [Google Scholar]
- Singh, S.; Singh, M.; Prakash, C.; Gupta, M.K.; Mia, M.; Singh, R. Optimization and reliability analysis to improve surface quality and mechanical characteristics of heat-treated fused filament fabricated parts. Int. J. Adv. Manuf. Technol. 2019, 102, 1521–1536. [Google Scholar] [CrossRef]
- Wach, R.A.; Wolszczak, P.; Adamus-Wlodarczyk, A. Enhancement of mechanical properties of FDM-PLA parts via thermal annealing. Macromol. Mater. Eng. 2018, 303, 1800169. [Google Scholar] [CrossRef]
- Somireddy, M.; Singh, C.V.; Czekanski, A. Analysis of the material behavior of 3D printed laminates via FFF. Exp. Mech. 2019, 59, 871–881. [Google Scholar] [CrossRef]
- Rodríguez-Panes, A.; Claver, J.; Camacho, A.M. The influence of manufacturing parameters on the mechanical behaviour of PLA and ABS pieces manufactured by FDM: A comparative analysis. Materials 2018, 11, 1333. [Google Scholar] [CrossRef] [Green Version]
- García-Domínguez, A.; Claver, J.; Camacho, A.M.; Sebastián, M.A. Considerations on the Applicability of Test Methods for Mechanical Characterization of Materials Manufactured by FDM. Materials 2020, 13, 28. [Google Scholar] [CrossRef] [Green Version]
- Cuan-Urquizo, E.; Barocio, E.; Tejada-Ortigoza, V.; Pipes, R.B.; Rodriguez, C.A.; Roman-Flores, A. Characterization of the mechanical properties of FFF structures and materials: A review on the experimental, computational and theoretical approaches. Materials 2019, 12, 895. [Google Scholar] [CrossRef] [Green Version]
- Alsoufi, M.S.; Elsayed, A.E. Warping deformation of desktop 3D printed parts manufactured by open source fused deposition modeling (FDM) system. Int. J. Mech. Mechatron. Eng. 2017, 17, 7–16. [Google Scholar]
- Torres, J.; Cotelo, J.; Karl, J.; Gordon, A.P. Mechanical property optimization of FDM PLA in shear with multiple objectives. JOM 2015, 67, 1183–1193. [Google Scholar] [CrossRef]
- Keleş, Ö.; Blevins, C.W.; Bowman, K.J. Effect of build orientation on the mechanical reliability of 3D printed ABS. Rapid Prototyp. J. 2017, 23, 320–328. [Google Scholar] [CrossRef]
- Garg, A.; Bhattacharya, A.; Batish, A. Failure investigation of fused deposition modelling parts fabricated at different raster angles under tensile and flexural loading. Proc. Inst. Mech. Eng. Part B J. Eng. Manuf. 2017, 231, 2031–2039. [Google Scholar] [CrossRef]
- BS EN ISO 527-2:2012. Plastics—Determination of Tensile Properties–Part 2: Test Conditions for Moulding and Extrusion Plastics; British, European and International Standard: London, UK, 2012. [Google Scholar]
- BS EN ISO 2039-2: 2000 BS 2782-3: Method 365C:1992. Plastics—Determination of hardness—Part 2: Rockwell Hardness; British, European and International Standard: London, UK, 2000. [Google Scholar]
- Hart, K.R.; Dunn, R.M.; Sietins, J.M.; Mock, C.M.H.; Mackay, M.E.; Wetzel, E.D. Increased fracture toughness of additively manufactured amorphous thermoplastics via thermal annealing. Polymer 2018, 144, 192–204. [Google Scholar] [CrossRef]
- Wang, L.; Gramlich, W.M.; Gardner, D.J. Improving the impact strength of Poly (lactic acid) (PLA) in fused layer modeling (FLM). Polymer 2017, 114, 242–248. [Google Scholar] [CrossRef]
- Wang, L.; Gardner, D.J. Contribution of printing parameters to the interfacial strength of polylactic acid (PLA) in material extrusion additive manufacturing. Progr. Addit. Manuf. 2018, 3, 165–171. [Google Scholar] [CrossRef]
- Harris, A.M.; Lee, E.C. Improving mechanical performance of injection molded PLA by controlling crystallinity. J. Appl. Polym. Sci. 2008, 107, 2246–2255. [Google Scholar] [CrossRef]
- Benwood, C.; Anstey, A.; Andrzejewski, J.; Misra, M.; Mohanty, A.K. Improving the impact strength and heat resistance of 3D printed models: Structure, property, and processing correlationships during fused deposition modeling (FDM) of poly (lactic acid). ACS Omega 2018, 3, 4400–4411. [Google Scholar] [CrossRef]
- Butt, J.; Hewavidana, Y.; Mohaghegh, V.; Sadeghi-Esfahlani, S.; Shirvani, H. Hybrid manufacturing and experimental testing of glass fiber enhanced thermoplastic composites. J. Manuf. Mater. Process. 2019, 3, 96. [Google Scholar] [CrossRef] [Green Version]
- Tabi, T.; Sajó, I.E.; Szabó, F.; Luyt, A.S.; Kovács, J.G. Crystalline structure of annealed polylactic acid and its relation to processing. Express Polym. Lett. 2010, 4, 659–668. [Google Scholar] [CrossRef]
- Song, Y.; Li, Y.; Song, W.; Yee, K.; Lee, K.Y.; Tagarielli, V.L. Measurements of the mechanical response of unidirectional 3D-printed PLA. Mater. Des. 2017, 123, 154–164. [Google Scholar] [CrossRef]
- Rangisetty, S.; Peel, L.D. The effect of infill patterns and annealing on mechanical properties of additively manufactured thermoplastic composites. In Proceedings of the ASME 2017 Conference on Smart Materials, Adaptive Structures and Intelligent Systems, Burlington, VT, USA, 18–20 September 2017. [Google Scholar]
- Xinhua, L.; Shengpeng, L.; Zhou, L.; Xianhua, Z.; Xiaohu, C.; Zhongbin, W. An investigation on distortion of PLA thin-plate part in the FDM process. Int. J. Adv. Manuf. Technol. 2015, 79, 1117–1126. [Google Scholar] [CrossRef]
- Gordeev, E.G.; Galushko, A.S.; Ananikov, V.P. Improvement of quality of 3D printed objects by elimination of microscopic structural defects in fused deposition modeling. PLoS ONE 2018, 13, e0198370. [Google Scholar] [CrossRef]
- Wittbrodt, B.; Pearce, J.M. The effects of PLA color on material properties of 3-D printed components. Addit. Manuf. 2015, 8, 110–116. [Google Scholar] [CrossRef] [Green Version]
- Pérez, M.; Medina-Sánchez, G.; García-Collado, A.; Gupta, M.; Carou, D. Surface quality enhancement of fused deposition modeling (FDM) printed samples based on the selection of critical printing parameters. Materials 2018, 11, 1382. [Google Scholar] [CrossRef] [Green Version]
- Singh, D.; Singh, R.; Boparai, K.S. Investigations on hardness of investment-casted implants fabricated after vapour smoothing of FDM replicas. J. Braz. Soc. Mech. Sci. Eng. 2020, 42, 1–12. [Google Scholar] [CrossRef]
- Pei, E.; Lanzotti, A.; Grasso, M.; Staiano, G.; Martorelli, M. The impact of process parameters on mechanical properties of parts fabricated in PLA with an open-source 3-D printer. Rapid Prototyp. J. 2015, 21, 604–617. [Google Scholar]
- Zurita Hurtado, O.J.; Di Graci Tiralongo, V.C.; Aguirre, C.; Cristina, M. Effect of surface hardness and roughness produced by turning on the torsion mechanical properties of annealed AISI 1020 steel. Rev. Fac. Ing. Univ. Antioq. 2017, 84, 55–59. [Google Scholar] [CrossRef]
Figure 1.
Anet ET4 Pro 3D printer.

Figure 2.
Infill patterns showing triangles (right), lines (centre), and grid (left).

Figure 3.
Dimensions of the dog-bone sample.

Figure 4.
Ultrasonic testing of the FFF-printed samples.

Figure 5.
Dimensional change in x-axis.

Figure 6.
Dimensional change in y-axis.

Figure 7.
Dimensional change in z-axis.

Figure 8.
Significant deformation of Al-ASA at high annealing temperatures.

Figure 9.
Results from ultrasonic testing: (a) PLA material; (b) Cu-PLA material; (c) ABS material; (d) Al-ASA material.
Figure 9.
Results from ultrasonic testing: (a) PLA material; (b) Cu-PLA material; (c) ABS material; (d) Al-ASA material.

Figure 10.
Results from tensile testing: (a) PLA material; (b) Cu-PLA material; (c) ABS material; (d) Al-ASA material.
Figure 10.
Results from tensile testing: (a) PLA material; (b) Cu-PLA material; (c) ABS material; (d) Al-ASA material.

Figure 11.
Fractured samples from the four materials.

Figure 12.
Results from tensile testing with standard deviation as error bars: (a) PLA material; (b) Cu-PLA material; (c) ABS material; (d) Al-ASA material.
Figure 12.
Results from tensile testing with standard deviation as error bars: (a) PLA material; (b) Cu-PLA material; (c) ABS material; (d) Al-ASA material.

Figure 13.
SEM micrographs for PLA material: (a) control PLA; (b) annealed at 70 °C; (c) annealed at 80 °C; (d) annealed at 90 °C.
Figure 13.
SEM micrographs for PLA material: (a) control PLA; (b) annealed at 70 °C; (c) annealed at 80 °C; (d) annealed at 90 °C.

Figure 14.
SEM micrographs for Cu-PLA material: (a) control Cu-PLA; (b) annealed at 70 °C; (c) annealed at 80 °C; (d) annealed at 90 °C.
Figure 14.
SEM micrographs for Cu-PLA material: (a) control Cu-PLA; (b) annealed at 70 °C; (c) annealed at 80 °C; (d) annealed at 90 °C.

Figure 15.
SEM micrographs for ABS material: (a) Control ABS; (b) Annealed at 105 °C; (c) Annealed at 115 °C; (d) Annealed at 125 °C.
Figure 15.
SEM micrographs for ABS material: (a) Control ABS; (b) Annealed at 105 °C; (c) Annealed at 115 °C; (d) Annealed at 125 °C.

Figure 16.
SEM micrographs for Al-ASA material: (a) control Al-ASA; (b) annealed at 70 °C; (c) annealed at 80 °C; (d) annealed at 90 °C.
Figure 16.
SEM micrographs for Al-ASA material: (a) control Al-ASA; (b) annealed at 70 °C; (c) annealed at 80 °C; (d) annealed at 90 °C.

Figure 17.
Measurements taken from the control PLA sample.

Figure 18.
Hardness test results for the four materials; (a) PLA material; (b) Cu-PLA material; (c) ABS material; (d) Al-ASA material.
Figure 18.
Hardness test results for the four materials; (a) PLA material; (b) Cu-PLA material; (c) ABS material; (d) Al-ASA material.


Table 1.
Parameters for fused filament fabrication (FFF) build and annealing.
| # | Material | Nozzle Temperature (°C) | Bed Temperature (°C) | Glass Transition Temperature (°C) | Annealing Temperatures (°C) |
|---|---|---|---|---|---|
| 1 | 3D Filaprint PLA | 210 | 60 | 60–65 | 70, 80, 90 |
| 2 | FilaPrint metal copper PLA | 200 | 60 | 60–65 | 70, 80, 90 |
| 3 | 3D Filaprint ABS | 240 | 95 | 105 | 105, 115, 125 |
| 4 | ASA extrafill aluminium | 250 | 100 | 100 | 70, 80, 90, 105, 115 * |
* The reason for using five different annealing temperatures here is to show consistency with choosing the annealing temperatures with regards to the glass transition temperature. The results of 105 and 115 °C showed significant deformation of the samples and have been discussed in Section 4.1.
© 2020 by the authors. Licensee MDPI, Basel, Switzerland. This article is an open access article distributed under the terms and conditions of the Creative Commons Attribution (CC BY) license (http://creativecommons.org/licenses/by/4.0/).
Share and Cite
MDPI and ACS Style
Butt, J.; Bhaskar, R. Investigating the Effects of Annealing on the Mechanical Properties of FFF-Printed Thermoplastics. J. Manuf. Mater. Process. 2020, 4, 38. https://doi.org/10.3390/jmmp4020038
AMA Style
Butt J, Bhaskar R. Investigating the Effects of Annealing on the Mechanical Properties of FFF-Printed Thermoplastics. Journal of Manufacturing and Materials Processing. 2020; 4(2):38. https://doi.org/10.3390/jmmp4020038
Chicago/Turabian StyleButt, Javaid, and Raghunath Bhaskar. 2020. "Investigating the Effects of Annealing on the Mechanical Properties of FFF-Printed Thermoplastics" Journal of Manufacturing and Materials Processing 4, no. 2: 38. https://doi.org/10.3390/jmmp4020038