Article

Investigation of Process Control Influence on Tribological Properties of FLM-Manufactured Components

Chair of Plastics Technology, TU Dortmund University, Leonhard-Euler-Str. 5, D-44227 Dortmund, Germany
*
Author to whom correspondence should be addressed.
J. Manuf. Mater. Process. 2020, 4(2), 37; https://doi.org/10.3390/jmmp4020037
Submission received: 31 March 2020 / Revised: 17 April 2020 / Accepted: 23 April 2020 / Published: 27 April 2020
(This article belongs to the Special Issue Additive Manufacturing and Device Applications)

Abstract

:
In recent years, additive manufacturing methods such as Fused Layer Modeling have been continuously improved by industry and research institutions. In many cases, the influence of process control on the mechanical component properties is being investigated. Influencing parameters include the infill and its orientation as well as patterns. Extrusion parameters such as the volume flow, which can be influenced by the speed, the line width, and the layer thickness, and the temperatures, which determine the interlaminar bonding between the lines and layers, are relevant as well. In this contribution, the influence of process control on the tribological properties of cylindrical tribo-test specimens made of polybutylene terephthalate is investigated. Using a reciprocating pin-on-plate tribo-tester, the static and dynamic friction forces as well as the linear wear is determined. The results show a significant influence of the orientation and density of the infill on the tribological properties. Due to the process-specific large degrees of freedom, the advantage of a load-compatible individualisation and consequently the optimisation of tribologically exposed components is given compared to conventional manufacturing processes.

1. Introduction

Fused Layer Modeling (FLM) is an additive manufacturing process that has been the subject of current research projects for several years. For this reason, it is being integrated more and more into the industrial value chain. In the FLM process, a plastic filament is plasticised in an extruder and sequentially deposited as a melt strand on a heated printing bed. In this way, a component is created layer by layer. The CAD file of the component is transferred by a CAM software (slicer) to the most widely used numerical control (NC) programming language G-code to realise the layered building process. Nowadays, a large range of plastics are available for the FLM process as commercially available filaments. Since the process is pressureless, mainly plastics with low shrinkage potential such as polylactic acid (PLA) and acrylonitrile butadiene styrene (ABS) are used already for example regarding the mechanical properties or the tolerances characterised [1,2,3,4]. Using tempered building chambers, plastics such as polyamides (PA), thermoplastic elastomers (TPE), short-fibre-reinforced plastics or even high-temperature plastics such as polyetherimides (PEI) or polyether ether ketone (PEEK) can be handled [5,6,7,8].
The aim of these developments is the extension of application fields to components with function integration, the increase of mechanical strength, or the production of components with tight tolerances. The use of additive manufactured components in tribological applications is currently not very widespread. In [9], complex, tribologically exposed components are described in the context of high material and maintenance costs, so that the flexibility of the FLM process could enable material use and cost optimisation in various specific cases. The tribological properties of FLM-manufactured test specimens are tested in various studies using the pin-on-disc method. In [10,11], cylindrical pins made of ABS and a composite of PA6 and aluminium oxide powder (Al2O3) are additively manufactured. At different normal forces and test speeds, the frictional force and wear are measured and lower values for the PA6 composite are determined. A PA6-Al2O3 composite is also examined in [12]. In this case, the additivation is particularly interesting, since the Al2O3 content is varied in order to influence the rheological properties. Based on this, test specimens manufactured in the FLM process are tested using the pin-on-disc method and exhibit improved tribological properties compared to pure PA6 under the criterion of optimised rheological properties. The FLM process parameters are not varied during the preparation of the test samples. Such investigations are described in [13,14,15]. Using tribo-pins made of ABS, the influence of different FLM process parameters is determined at varying normal forces and test speeds. The varied parameters include the infill pattern, the infill orientation relative to the test direction, the infill density as well as the line width and layer thickness. The air gap, the width of the infill lines, and the infill orientation are described as significantly affecting. However, it has been shown that ABS samples show much higher wear than, for example, PA6-AL2O3 composites. This is confirmed in [16] in the pin-on-disk test using injection moulded test specimens by comparing ABS with PA6 and is applicable to both dry and conditioned test specimens. A comparison between FLM and injection moulded test specimens is shown in [17] using PA6 with aramid fibres. An influence of the infill orientation and the nevertheless better tribological properties of the injection-moulded reference are observed. In [18], a filament-extruded composite of polyether ether ketone (PEEK) and 30 wt % carbon fibre (CF) is applied as a wear layer to a PEEK substrate. Based on the fibre orientation, which in the FLM process has a preferred direction along the extruded strand, it is determined in a plate-on-ring test that the fibre orientation and thus the direction as well as orientation of the strand deposition have a significant influence on the tribological characteristics.
Another established plastic for tribological applications is polybutylene terephthalate (PBT) [19]. PBT has a low wear and friction coefficient and, even unreinforced, it exhibits high stiffness and strength. For example, this is shown, in [20] in block-on-ring tests with injection-moulded specimens for pure PBT and in [21,22] for different PBT composites. In [23], the influences of the injection-moulding process on a fibre-reinforced PBT are evaluated in the ball-on-plane test. In this context, the process-related fibre orientation is of interest, which can have different directions within a component from the boundary layers to the core. The relative fibre orientation changes due to the tribological exposure and advancing wear. This results in tribological parameters that are dependent on the level of wear. In the field of additive manufacturing, no tribological investigations are known up to now for PBT. Furthermore, no tribological studies of PBT in the pin-on-plate test have been published to date.
In all these works the result is that no universal optimum exists in the case of FLM-manufactured specimens. Depending on the combination of FLM process parameters and considered test parameters, friction and wear coefficients can either increase or decrease. Therefore, the component design must be individually adapted to the load case in order to optimise the aimed target values. With regard to the reciprocating pin-on-plate test, there are currently no studies on FLM-manufactured test specimens and the process-specific influences on the friction and wear behaviour. Especially the influence of FLM-specific structures and surfaces on static friction as well as the combined case of static and sliding friction open up novel approaches to component design and extend the state of the art. These studies are presented below using PBT as an example material.

2. Materials and Methods

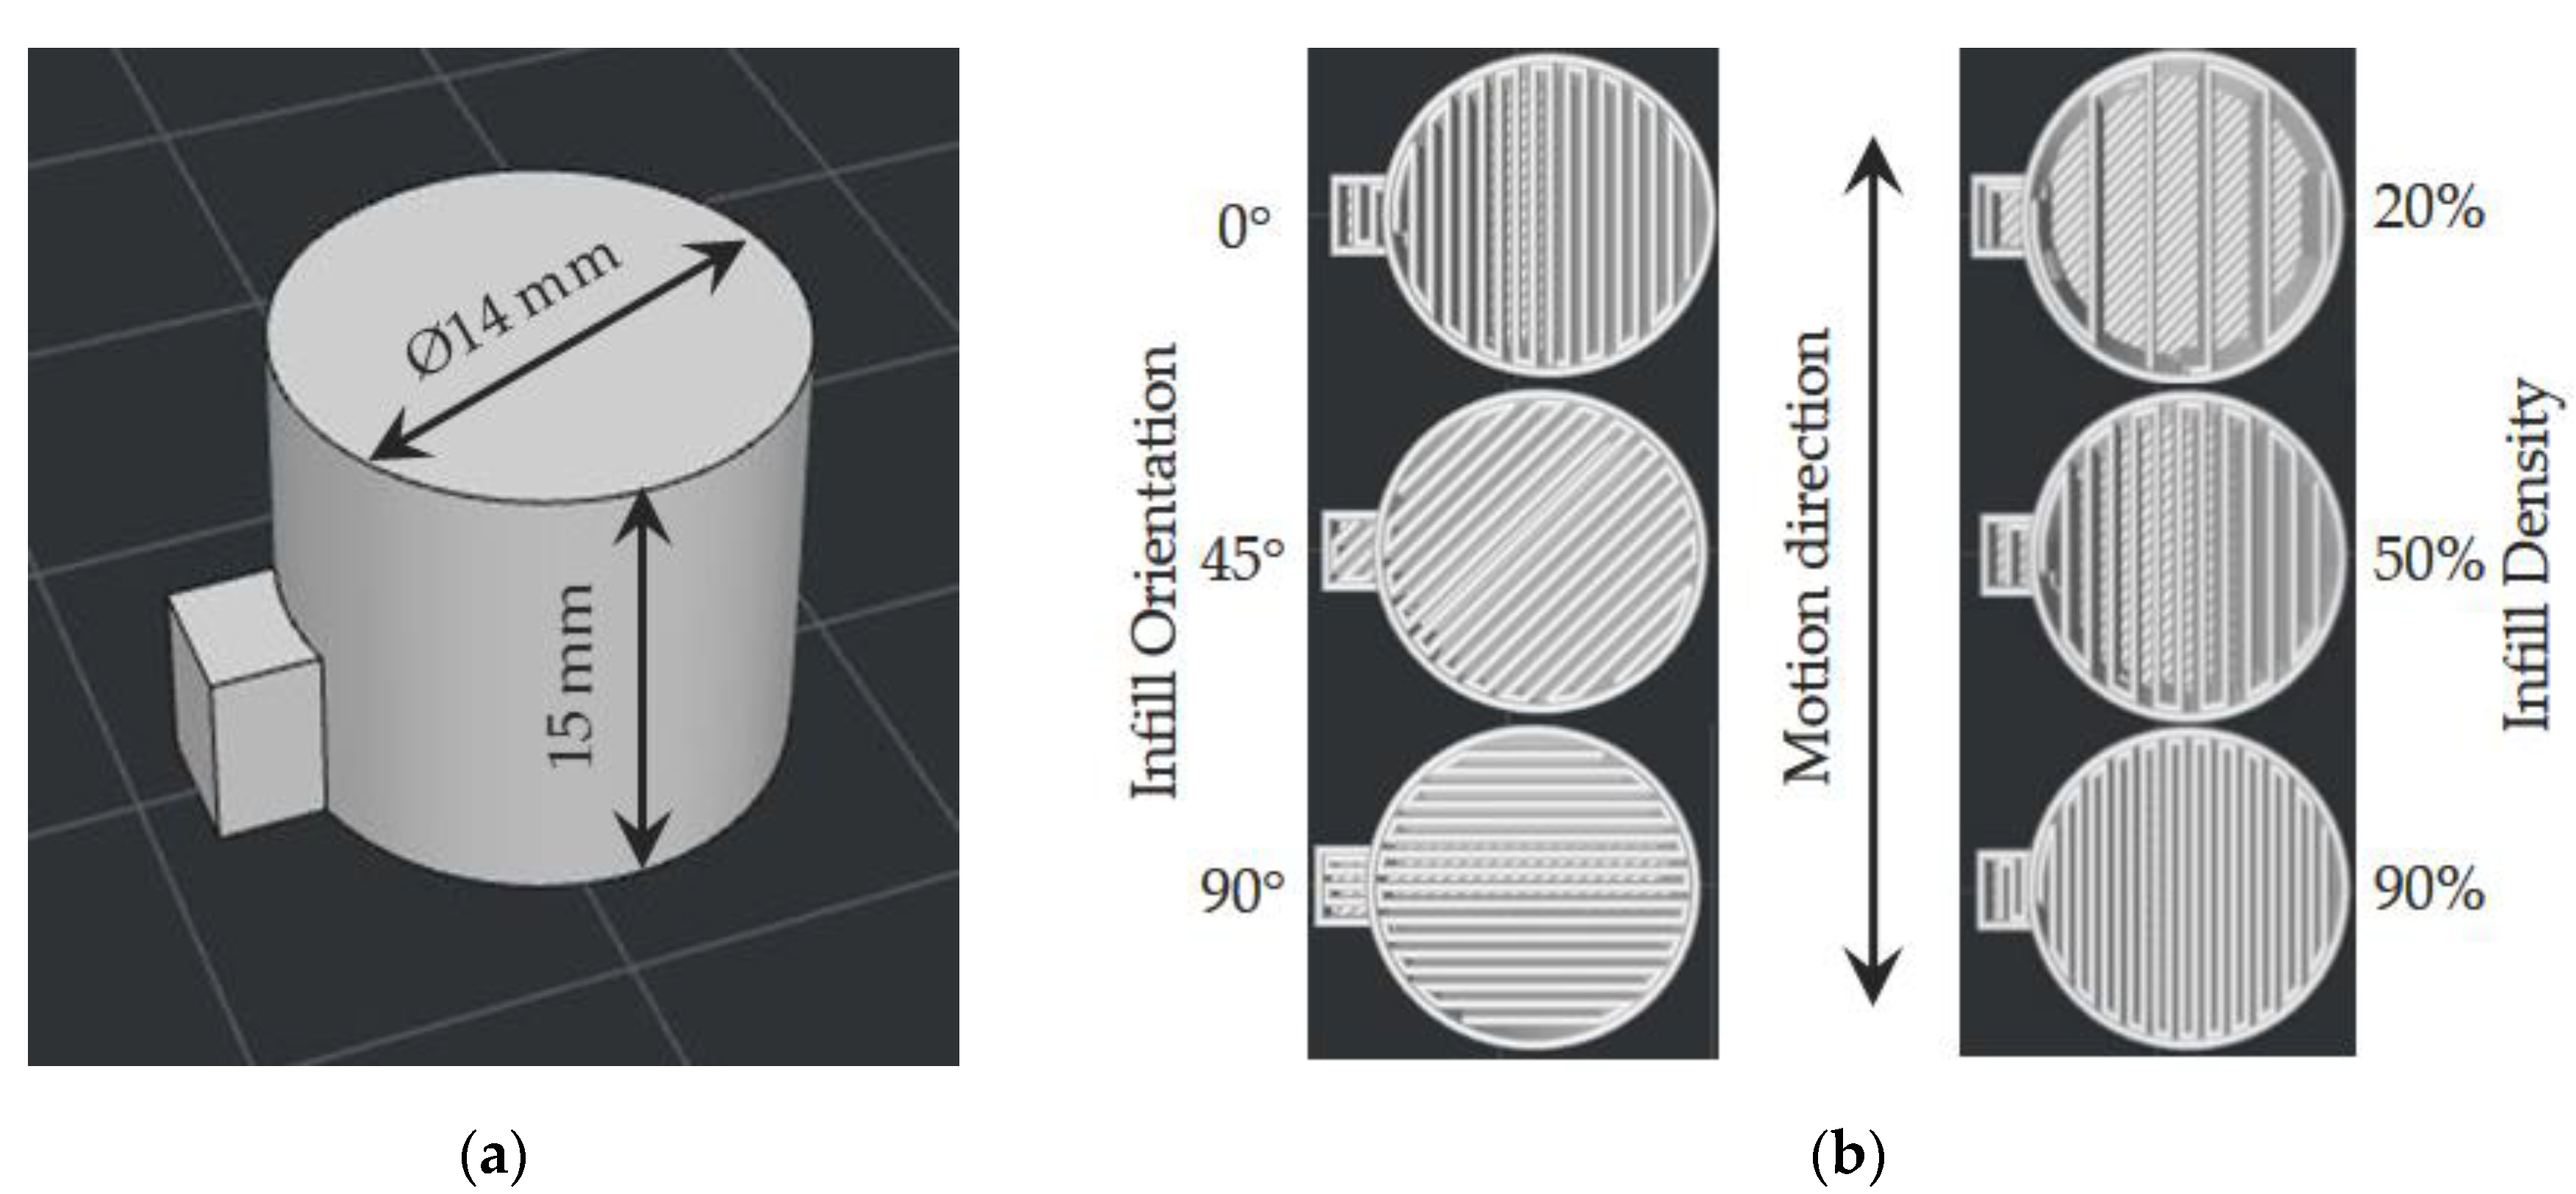
2.1. Additively Manufactured PBT Tribo-Test Specimens

The specimens of the following tests were prepared from PBT, which is commercially not available as filament at present. Therefore, the PBT material Pocan B1305 (Lanxess Deutschland GmbH, Cologne, Germany) has been extruded as filament with a diameter of 1.75 mm using the twin-screw extruder OS Rheomex PTW16 (Thermo Fisher Scientific Inc., Waltham, MA, USA). Using the FLM machine Pro2 (Raise3D Technologies Inc., Irvine, CA, USA) and a nozzle with a diameter of 0.4 mm, the material was processed into cylindrical test specimens with a diameter of 14 mm and a height of 15 mm (Figure 1). All specimens are manufactured with only one shell and bottom layers with a total height of 1 mm. The final top layer is not used due to the investigations. An orientation aid has been designed on the outer surface, which ensures a defined orientation of the specimens relative to the direction of movement by means of a stop in the specimen holder. In this work, 120 of these test specimens have been manufactured, resulting in 24 variants, with five specimens per variant.
The variants are used for three studies. These are based on the changes of common FLM parameters, which can be set in the slicing software IdeaMaker (Raise3D Technologies Inc., Irvine, CA, USA). The first two preliminary studies investigate basic influences on the tribological properties and serve as the definition of the tribo-system. As a result of the known influence of the infill orientation and the fact that grinded metal bodies are application-related, our investigation of the orientation of the grinding is varied. The angle between the infill and the grinding is at a constant 45°, whereas the grinding orientation is varied in two stages from the direction of movement (0°) to 45°. The infill orientation is varied vice versa, which is possible with an infill pattern called ‘Rectilinear’. The second preliminary study investigates the influence of infill density on the tribological parameters. For this purpose, test specimens with an infill density of 20% to 100% are produced in nine stages. The infill orientation remains constant in this case with the infill pattern ‘Rectilinear’ arranged in the direction of movement (0°). The specimens of both preliminary studies are built with a nozzle temperature of 250 °C and a layer height of 0.20 mm. Even though it is unusual in practice to produce an additively manufactured component without an outer surface layer, these experiments are intended to simulate the potential for the individual shaping of tribo-contact surfaces using additive manufacturing processes. In this context, it would also be conceivable to influence the surface topology of a tribologically exposed outer surface layer of the FLM component. This preliminary investigation is motivated by the dependence of the tribological properties on the surface pressure described in [19].
The variation of the infill density at constant normal force is equivalent to the variation of the surface pressure. The preliminary test is used to define a meaningful range of infill densities with regard to tribological properties for the subsequent definitive screening design (DSD) on the influence of FLM process control. By means of the screening test, it is examined which parameters influence the tribological parameters and which are negligible in this respect. The varied parameters are the infill density, taking into account the results of the second preliminary test (70–90%), the orientation of the infill relative to the direction of movement (0–90°), the nozzle temperature during test specimen production (250–290 °C), and the layer height of the extruded layers (0.15–0.25 mm). The temperature range results from the manufacturer’s specifications and preliminary tests on the FLM machine regarding the processability of the filament. These four parameters are varied in three steps. All parameters of the three tests are shown in Table 1.

2.2. Determination of the Tribo-Contact Area

The infill density describes the percentage of the filled area inside the sample. The contact area of the tribo-contact consists of the infill layer and a single outer shell. With the applied normal force and this infill-dependent area, a simplified surface pressure calculation can be obtained for the corresponding tribo-contact. The resulting surface pressure values based on the infill densities are shown in Table 2.
The determination of the real tribologically exposed contact areas for the determination of the surface pressure is carried out using an opto-digital microscope of the type DSX 500 (Olympus K.K., Tokyo, Japan). Due to shrinkage and the accuracy of the FLM machine, the real surface deviates from the ideal surface and is therefore more representative (Figure 2). The microscopic picture on the right shows several threads due to the wear that gathers in the gaps between the printed structures.
For a closer examination of the effects of the infill density on the coefficients of friction and the wear rate, a variation of infill in the range of 20% to 100% and nine equidistant steps is carried out in the first test series. The remaining process parameters are kept constant. During this variation, the infill orientation is set to 0°, so that the linear filling is oriented in the direction of movement. The layer thickness of the pins is set to 0.20 mm, and the nozzle temperature is set to 250 °C.

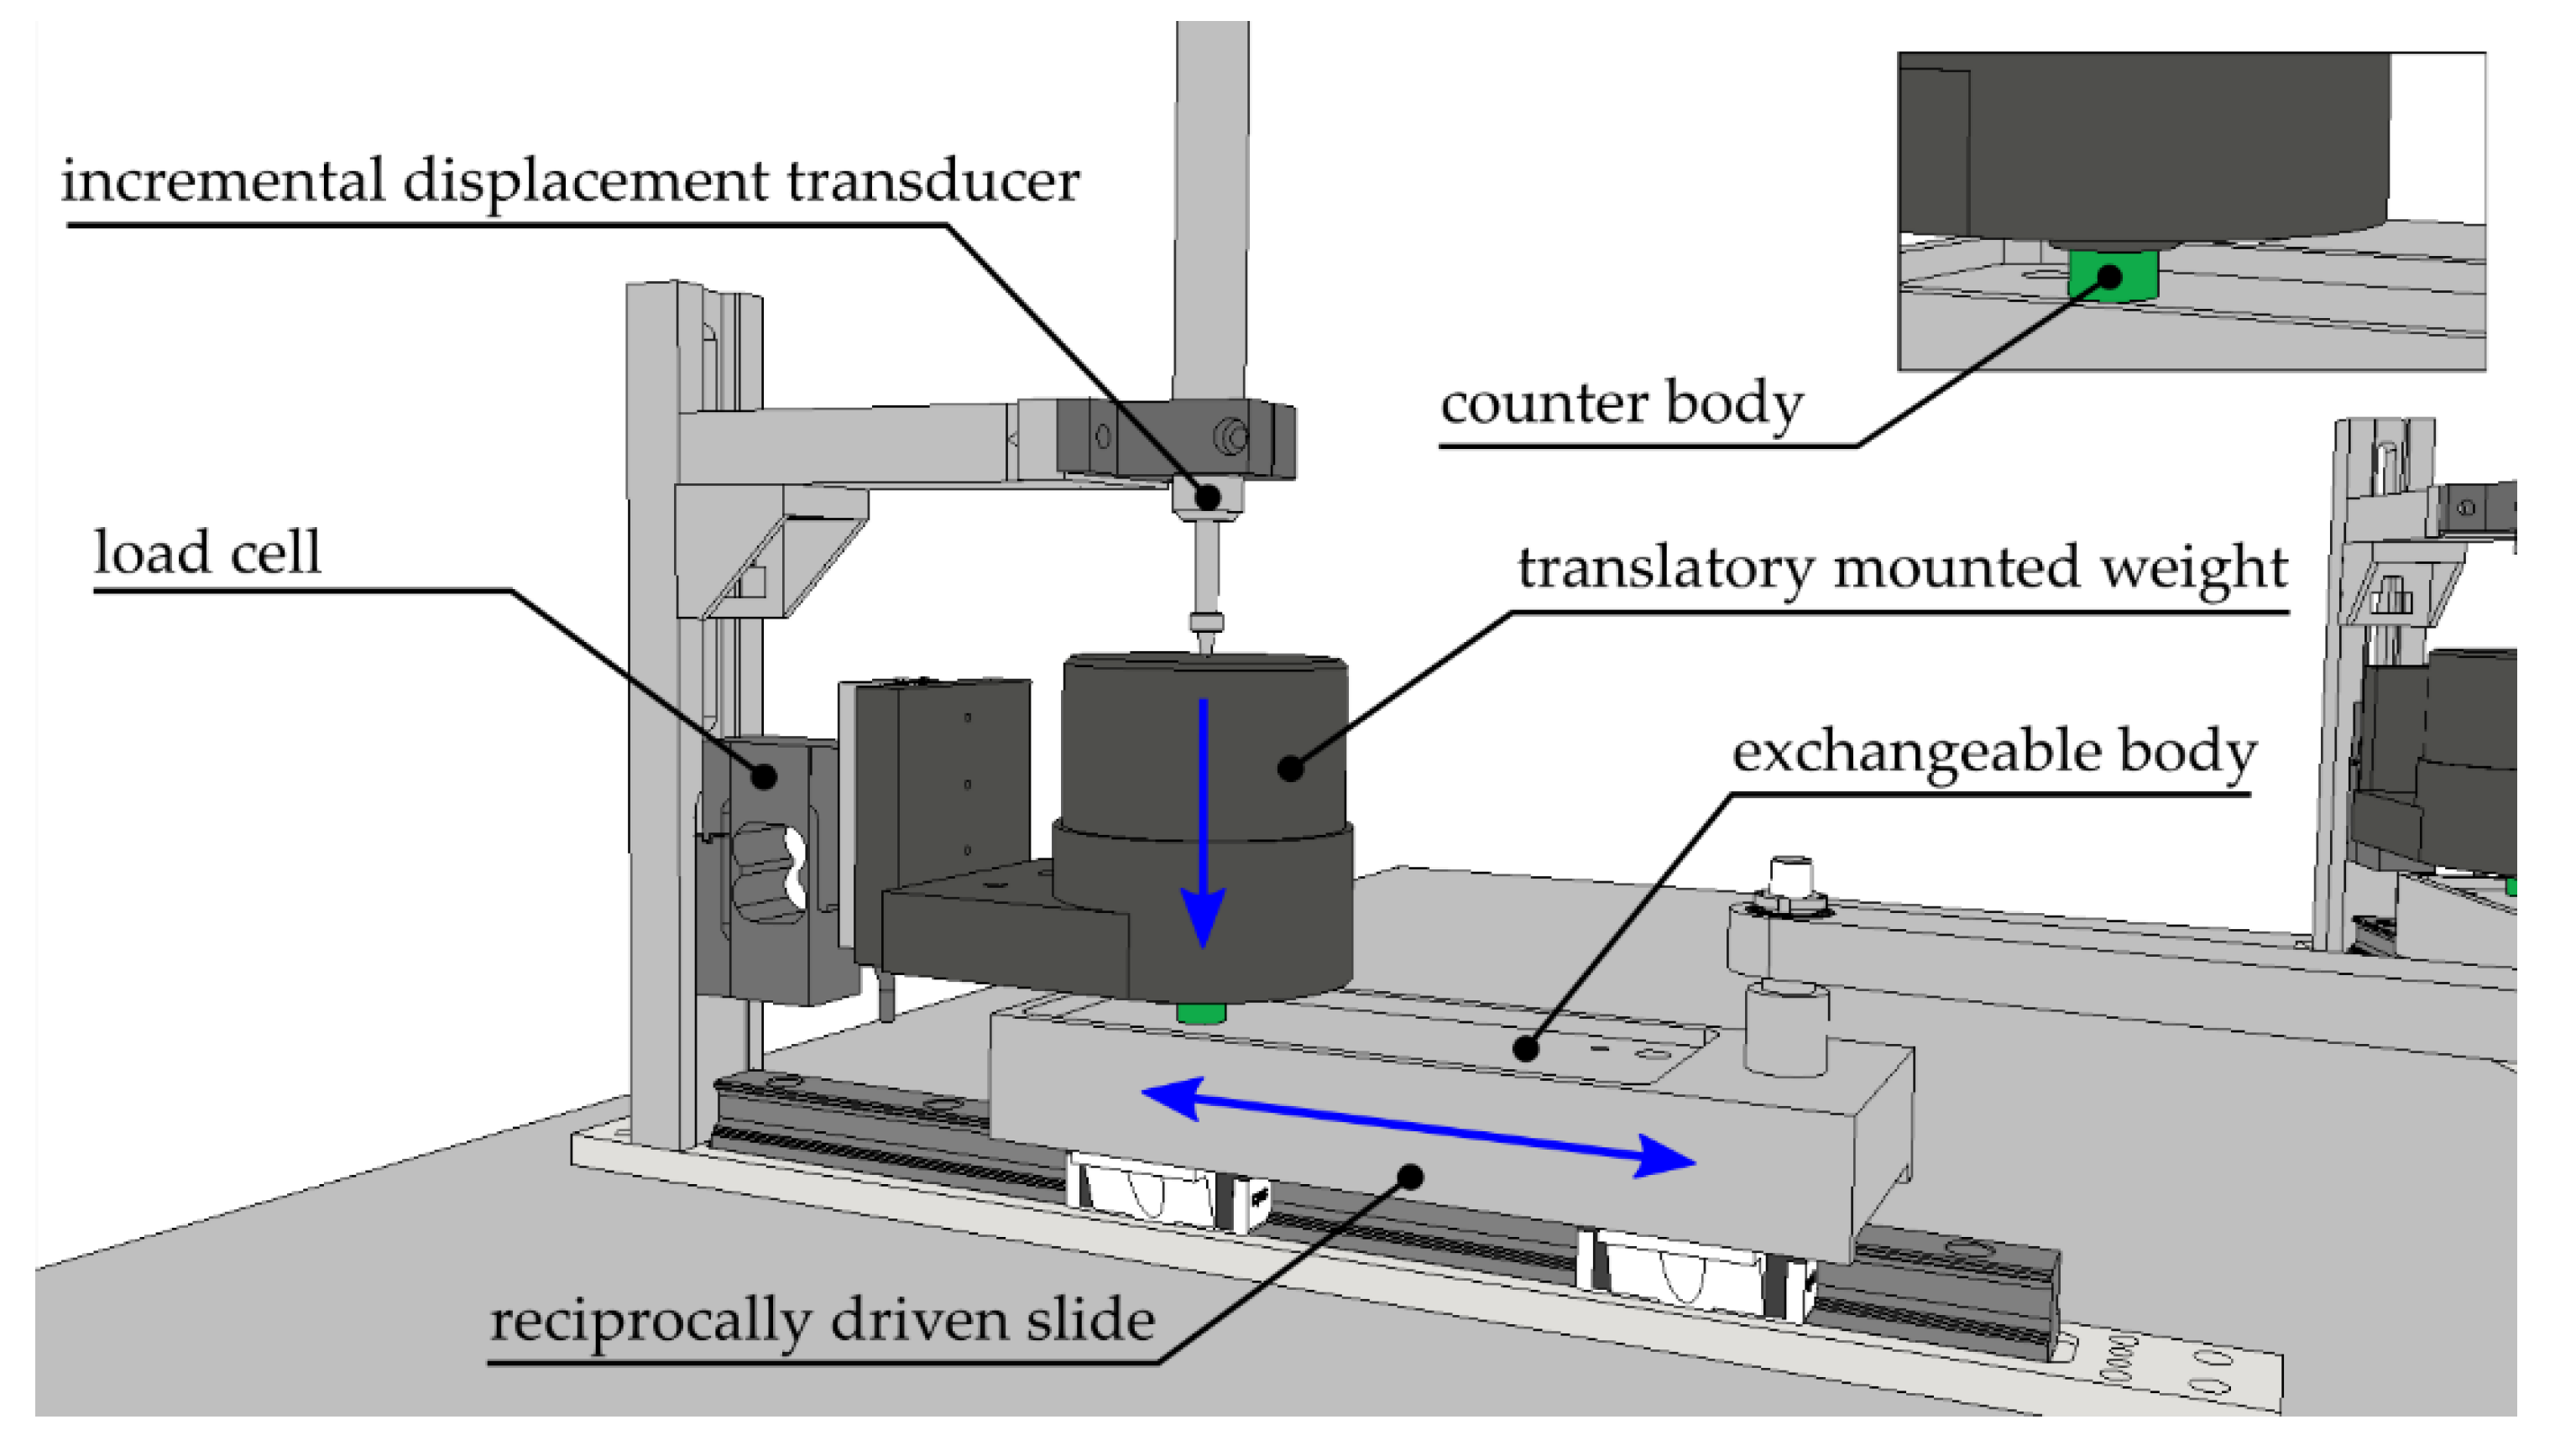
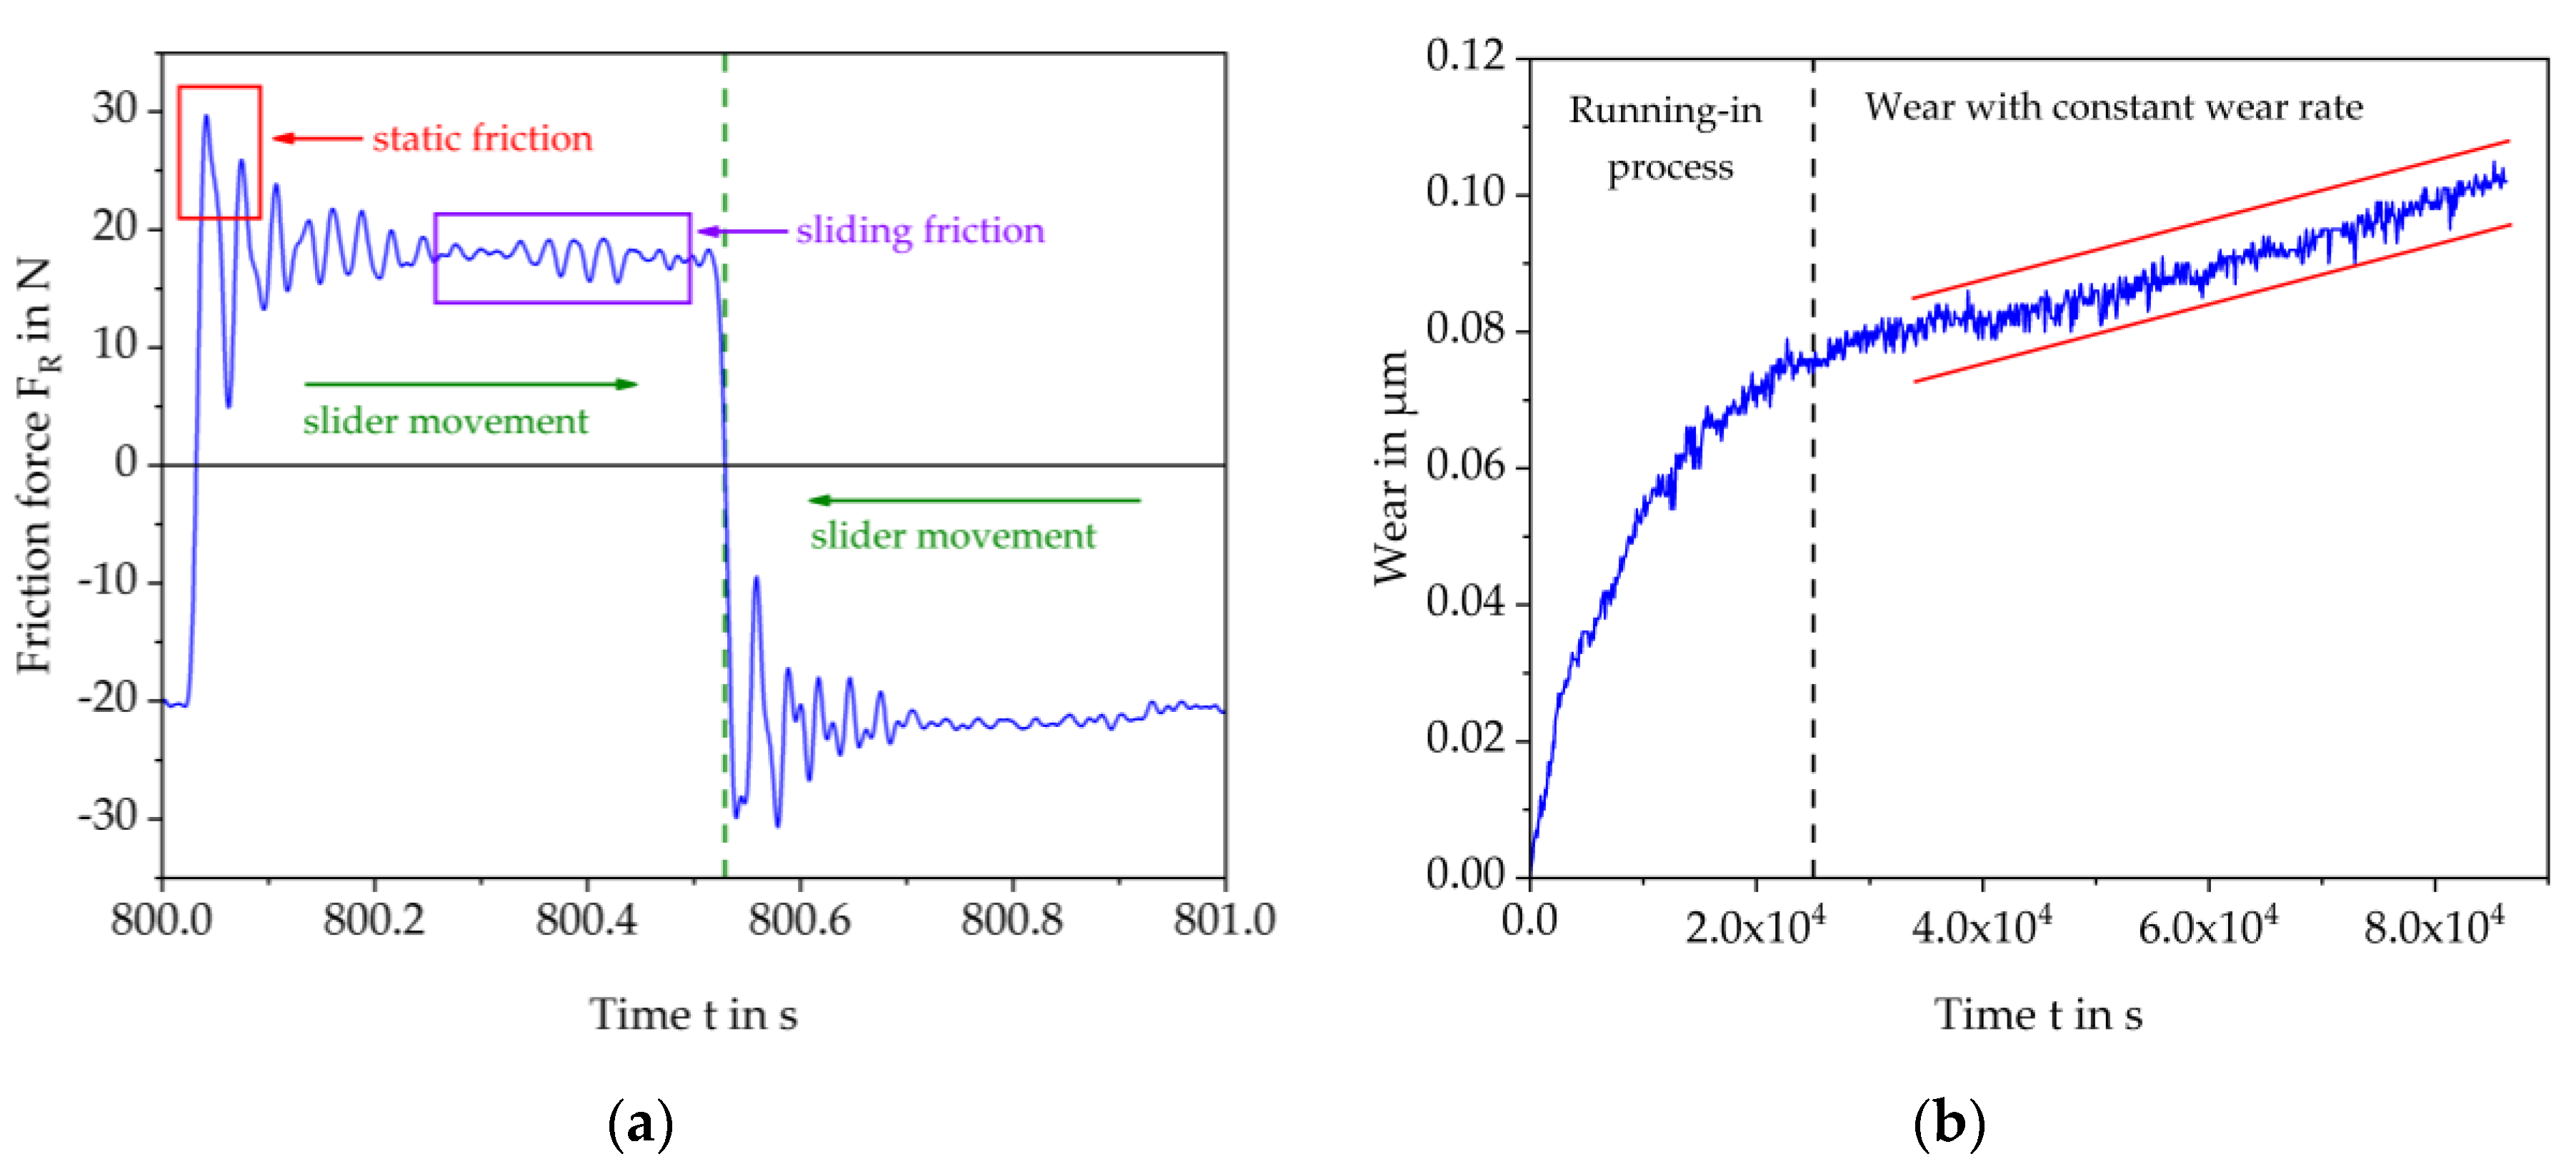
2.3. Quintuple Reciprocating Pin-On-Plate Tribo-Tester

The tribological characterisation is carried out using a specially developed quintuple reciprocating pin-on-plate tribo-tester (Figure 3). The five pin-on-plate measuring units consist of a reciprocally translatory movable slide, a module for positioning the specimen to be characterised, and a displacement measurement unit for determining the wear of the specimen. The slides, which are mounted on linear guides, are connected by rods to a hub, which is positioned eccentrically on a central drive axis. The kinematics of the illustrated actuator system is comparable to that of a radial engine. The rotational movement of the driving unit is transformed into five oscillating translatory movements with a phase shift of 72°. The deflection from bottom to top dead centre measures 100 mm. The body of the tribo-contact is integrated into the slide and can be exchanged for application-specific requirements and, if necessary, equipped with a contact temperature measurement.
As shown in Figure 4, the module for positioning the counter body (plastic test specimen) is connected to a frame structure through a load cell of the type S2M/100N (Hottinger Baldwin Messtechnik GmbH, Darmstadt, Germany) with an accuracy class of 0.02. It is loaded with a weight in order to apply a normal force. Tribological tests can be carried out up to a normal force of 100 N. A miniature precision linear guide arranged between this module and the load cell enables a translational displacement of the pin and weight holder perpendicular to the slide movement. Such displacement occurs when the tested plastic wears and the height of the test specimen decreases. The displacement of the holder is measured by means of a displacement transducer of type 8738-DK25PR5 (Burster Präzisionsmesstechnik GmbH & Co. KG, Gernsbach, Germany) with a resolution of 0.5 µm and an accuracy of 2 µm. The wear in µm is continuously determined over the entire test duration by means of the height decrease of the test specimen. The latter allows not only the evaluation of an absolute total wear, but also the analysis of running-in processes. The frictional force occurring between the body and the counter body during the movement of the slide, which is dependent on the normal force, is directly transferred to the load cell via the pin holder and recorded by the measurement acquisition system consisting of a Q.gate, Q.bloxx A107 and Q.bloxx D101 module (Gantner Instruments Test & Measurement GmbH, Darmstadt, Germany) with a sampling rate of 1000 Hz. Before starting the measurement, the load cells are tared in a load-free state with a switched-off drive.
The sinusoidal motion profile of the reciprocally driven slides results in frictional force curves, as shown in Figure 5a. The measuring signal can be separated into a positive and a negative component, which can be assigned to the two directions of movement of the body. Within these signals, both the static friction at the dead centres as well as the sliding friction during the slide movement are represented. Figure 5a shows a motion cycle with a length of 1 s, which is obtained at a test frequency of 1 Hz.
The coefficient of static friction (static COF) is determined within each cycle by a maximum and minimum value query. The coefficient of sliding friction (sliding COF) is determined by averaging the measured values within a defined time frame of 0.2 s both within the positive and negative edge of the signal. In addition to the determination of the coefficients of friction, the tribological investigation includes an evaluation of wear by means of continuous measurement of the height decrease of the test specimen (Figure 5b). In relation to the test time respective to the sliding distance, a wear rate for the tribo-contact is calculated as the wear amount, referring to the sliding distance in µm/km [24]. In almost all cases, after a material-specific running-in phase, which additionally depends on the initial surface condition of the body and counter body, a wear process with constant wear rate occurs. This parameter can be used as a further characteristic value to describe the tribo-contact. Based on the above-mentioned structural boundary conditions of the tribo-tester, the test parameters summarised in Table 3 are obtained for the tribological characterisation described in the following sections.

3. Results and Discussion

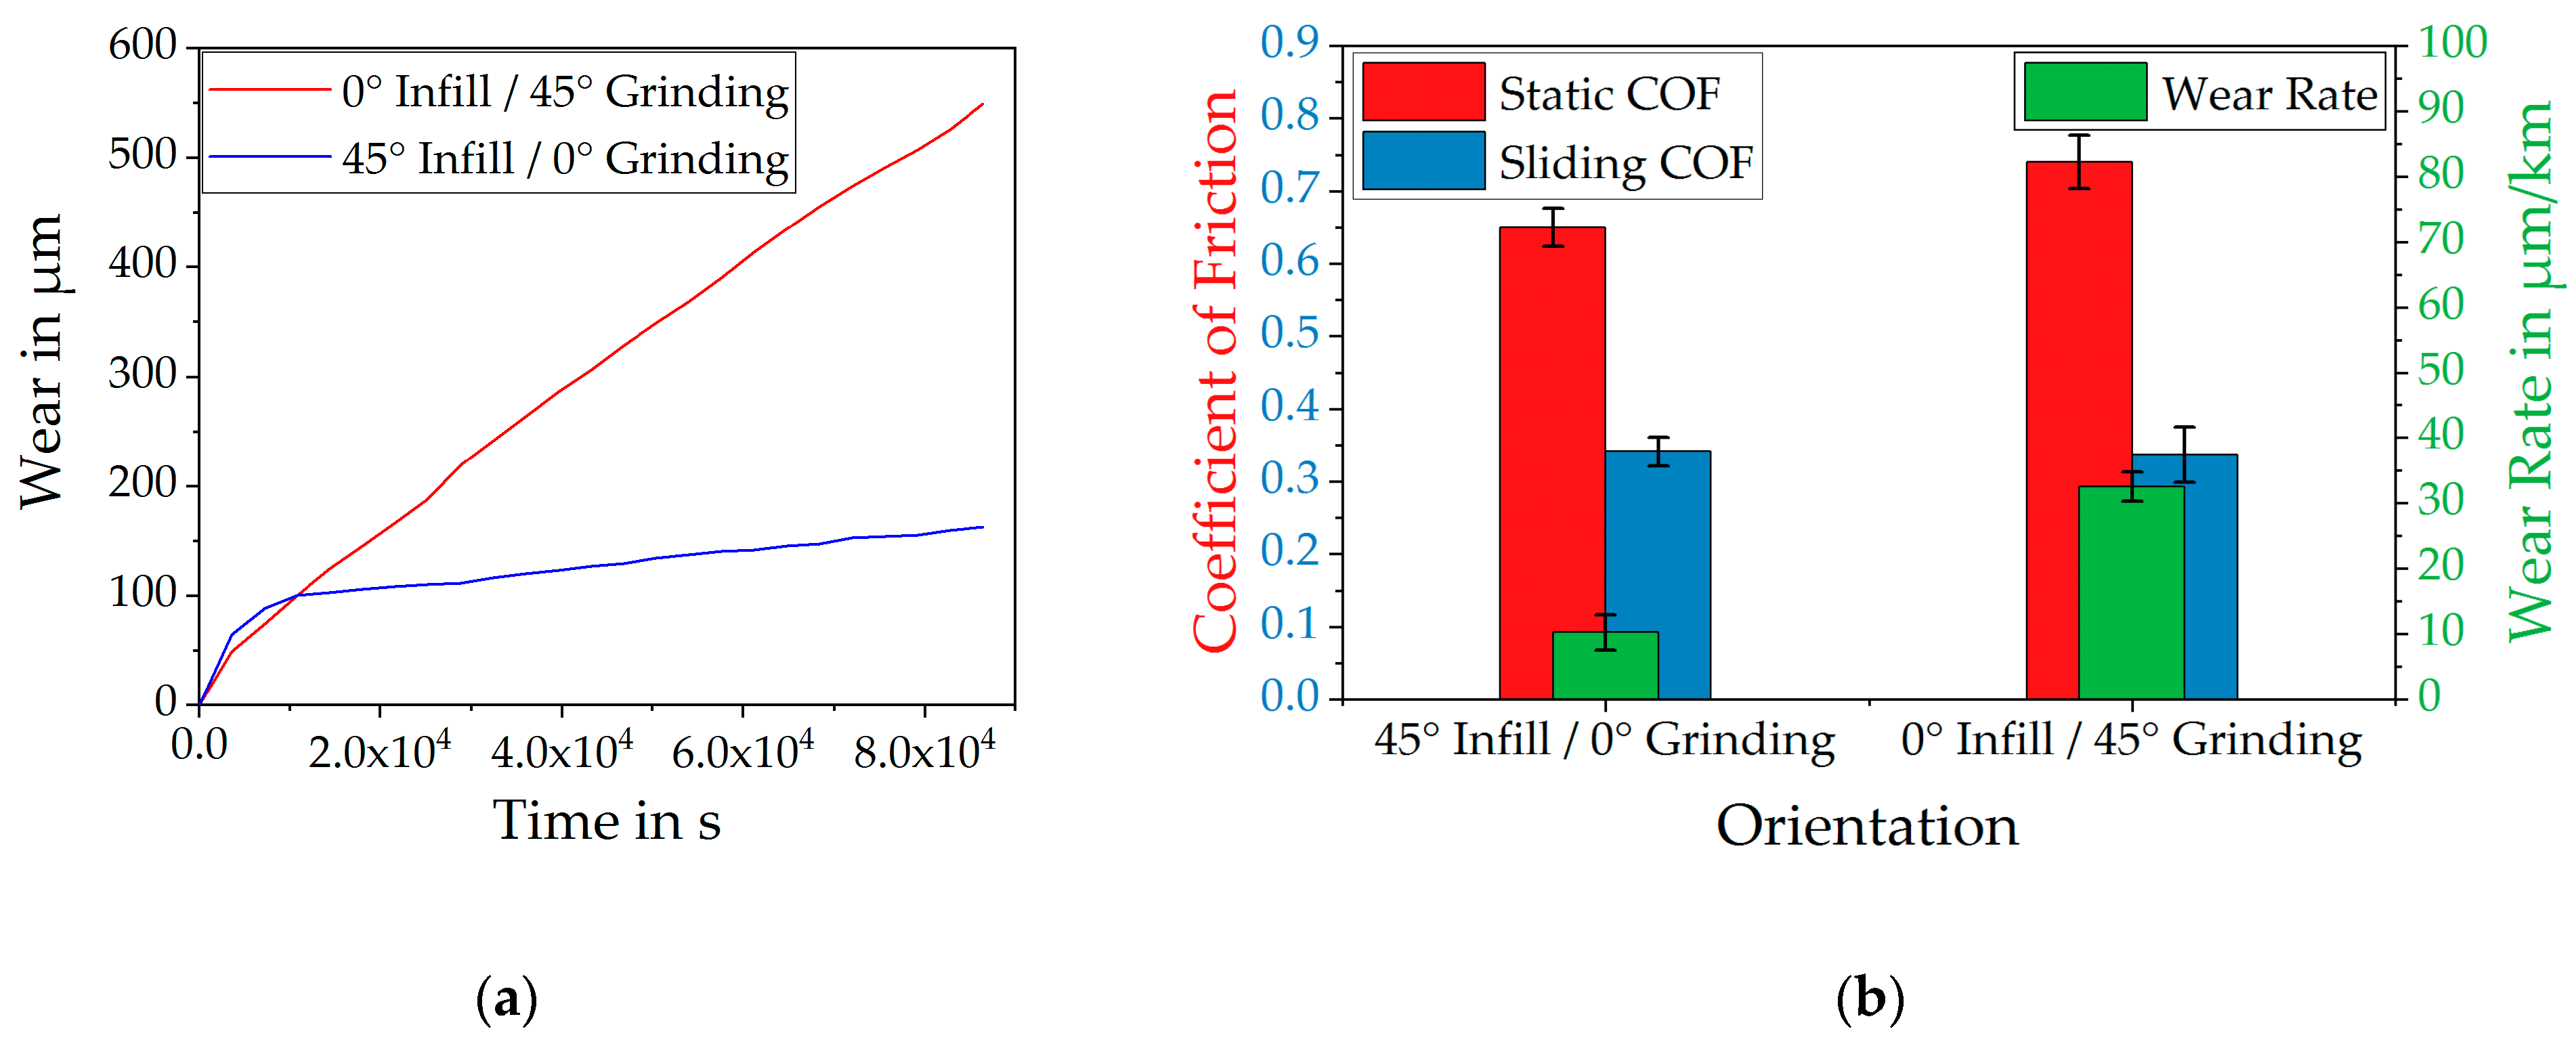
3.1. Influence of Grinding Direction of the Metal Body and the Infill Orientation

Before the results of the preliminary test concerning the infill density as well as the definitive screening design are presented in the following paragraphs, a special aspect of the tribo-contact with an additive manufactured plastic component should be mentioned. In investigations, which are not further dealt with in this contribution, it has been shown that the orientation of the grinding direction of the metal body as well as that of the infill related to the direction of movement of the pin-on-plate experiment has a distinct influence on the resulting tribological properties. As shown in Figure 6, this situation is exemplified by a test with two 45° rotated orientation modes. The test specimens used for this investigation were prepared with an infill density of 60%, a nozzle temperature of 250 °C, and a layer height of 0.2 mm. The metal body shows a profile roughness Rz as the maximum profile height of 8 measured perpendicular to the grinding direction with an opto-digital microscope of the type DSX 500.
Although the relative orientation of the grinding direction of the metal body compared to the infill orientation of the counter body remains unchanged, a strong influence of the wear can be seen when taking into account the orientation of the test direction (Figure 7a).
After a test period of 24 h, the wear rate was found to be three times higher for the tribo-contact with a 0° orientation of the test specimen infill and a 45° orientation of the grinding direction of the metal body in relation to the direction of movement (tribo-contact shown in red). The friction coefficients of the two tribo-contacts also differ significantly, as shown in Figure 7b. However, there is a reduction in the coefficients of static friction for the tribo-contact with a 45° infill orientation and a 0° grinding orientation, while the coefficients of sliding friction seem not to be influenced by this variation.
This can be explained on the basis of the different running-in processes that can be seen in Figure 7a. In the case of the 0° grinding orientation, the plastic sample runs in along the grooves, whereby the process changes to a stationary process after the initially discontinuous course. In the case of the 45° grinding orientation, no running-in process can be measured. Instead, the sample wears out at a constant rate from the start of measurement. The plastic sample passes the extremes of the grooves and wears abrasively. This does not happen when the samples move along the direction of the grooves.
For the following investigations, this results in the requirement of a uniform arrangement of the grinding and infill orientation on all pin-on-plate measurement units. Otherwise, the above-mentioned significant differences will result in increased standard deviations, which are not caused by metrological scattering, but due to the fact that two different tribological systems are considered.

3.2. Influence of the Infill Density on Tribological Properties

The results from Section 3.1 show the sensitivity of tribological systems. In order to be able to make as consistent statements as possible about the tribological behaviour of the test specimens manufactured with FLM, the wear mechanisms, for example, must be identical. For this reason, all parameters besides the varied infill density have been kept constant and are performed at a grinding and infill orientation of 0°.
Figure 8 shows the results of the preliminary test for the variation of the infill density. Depending on the infill density (a) and the surface pressure (b), the friction coefficients of static and sliding friction are shown on the left ordinate and the wear rate on the right ordinate axis. A non-linear dependency of all three parameters regarding surface pressure respective to the infill density can be observed. In most tribological applications, the motivation is to minimise the tribological parameters of a tribo-system, although they sometimes change in the opposite way when an influencing variable is manipulated. In this context, it is often necessary to weigh up which of these parameters is more important for the given application. In the case of the preliminary investigation presented here, a minimum can be defined for all three parameters. The static friction assumes a minimum at a surface pressure of 0.359 MPa (90% infill density), where it amounts to about 0.65. The sliding friction becomes minimal at a surface pressure of 0.370 MPa (70% infill density) with an amount of 0.33. The wear rate shows a larger range of smallest values, but reaches, also considering the standard deviation, the minimum of 17.18 µm/km at a surface pressure of 0.362 MPa (80% infill density).
Such minima are known from the literature (see [19]), but they have been tested from pin-on-disk tests and polished metallic bodies with a profile roughness Rz of 0.3 and therefore do not show identical results. The minima of coefficients of sliding friction have often been measured at surface pressures of about 0.1 MPa. The minima themselves result from the fact that at low surface pressures, no polymer film is formed, resulting in high sliding friction coefficients. Increasing the surface pressure causes this film to form as a result of wear and reduces the sliding COF until the surface pressure becomes too high and increasing abrasion leads to higher characteristic values [19]. Due to the 26 times higher roughness of the grinded metal plates used here, it is expected that the higher surface pressures are necessary to enrich and build up the plastic layer in the rougher metallic surface. For the boundary conditions used here, a surface pressure of 0.36 to 0.37 MPa thus exhibits the lowest tribological parameters. Besides, higher surface pressures show the same behaviour as known from the literature. In Figure 8, a local maximum for the static COF can be observed as well in the range of 50% to 60% infill density or a surface pressure of 0.461 to 0.409 MPa. In this context, opposing trends in the coefficients of friction and wear rate can be seen with decreasing infill density and increasing surface pressure, respectively. It could be expected that the static COF would also increase with increasing surface pressure. This is not the case, as it can be assumed that for the tests described here, the stress on the material increases with an increasing reduction of the infill density and that the shear strength of the PBT is exceeded below 50% infill density. This correlates with the significant increase in the wear rate, which is also below 50% infill density.
It can also be expected that an increase in surface pressure due to a reduction in infill density will lead to higher contact temperatures, which in turn will have an influence on the mechanical properties of the plastic. This leads to the consequence that in tribological investigations of plastics, the resulting tribological properties (static and sliding COF, wear rate) cannot be considered, excluding the thermomechanical and viscoelastic properties of the material. For example, this fact is discussed in [25] with regard to the temperature influence and in [26] with regard to the long-term behaviour (creep, relaxation). With reference to the results of Figure 8 and the fact that in most engineering applications the aim is to minimise the tribological parameters, the variation of the infill density is limited to the range of 70% to 90% for the following test series based on a definitive screening design.

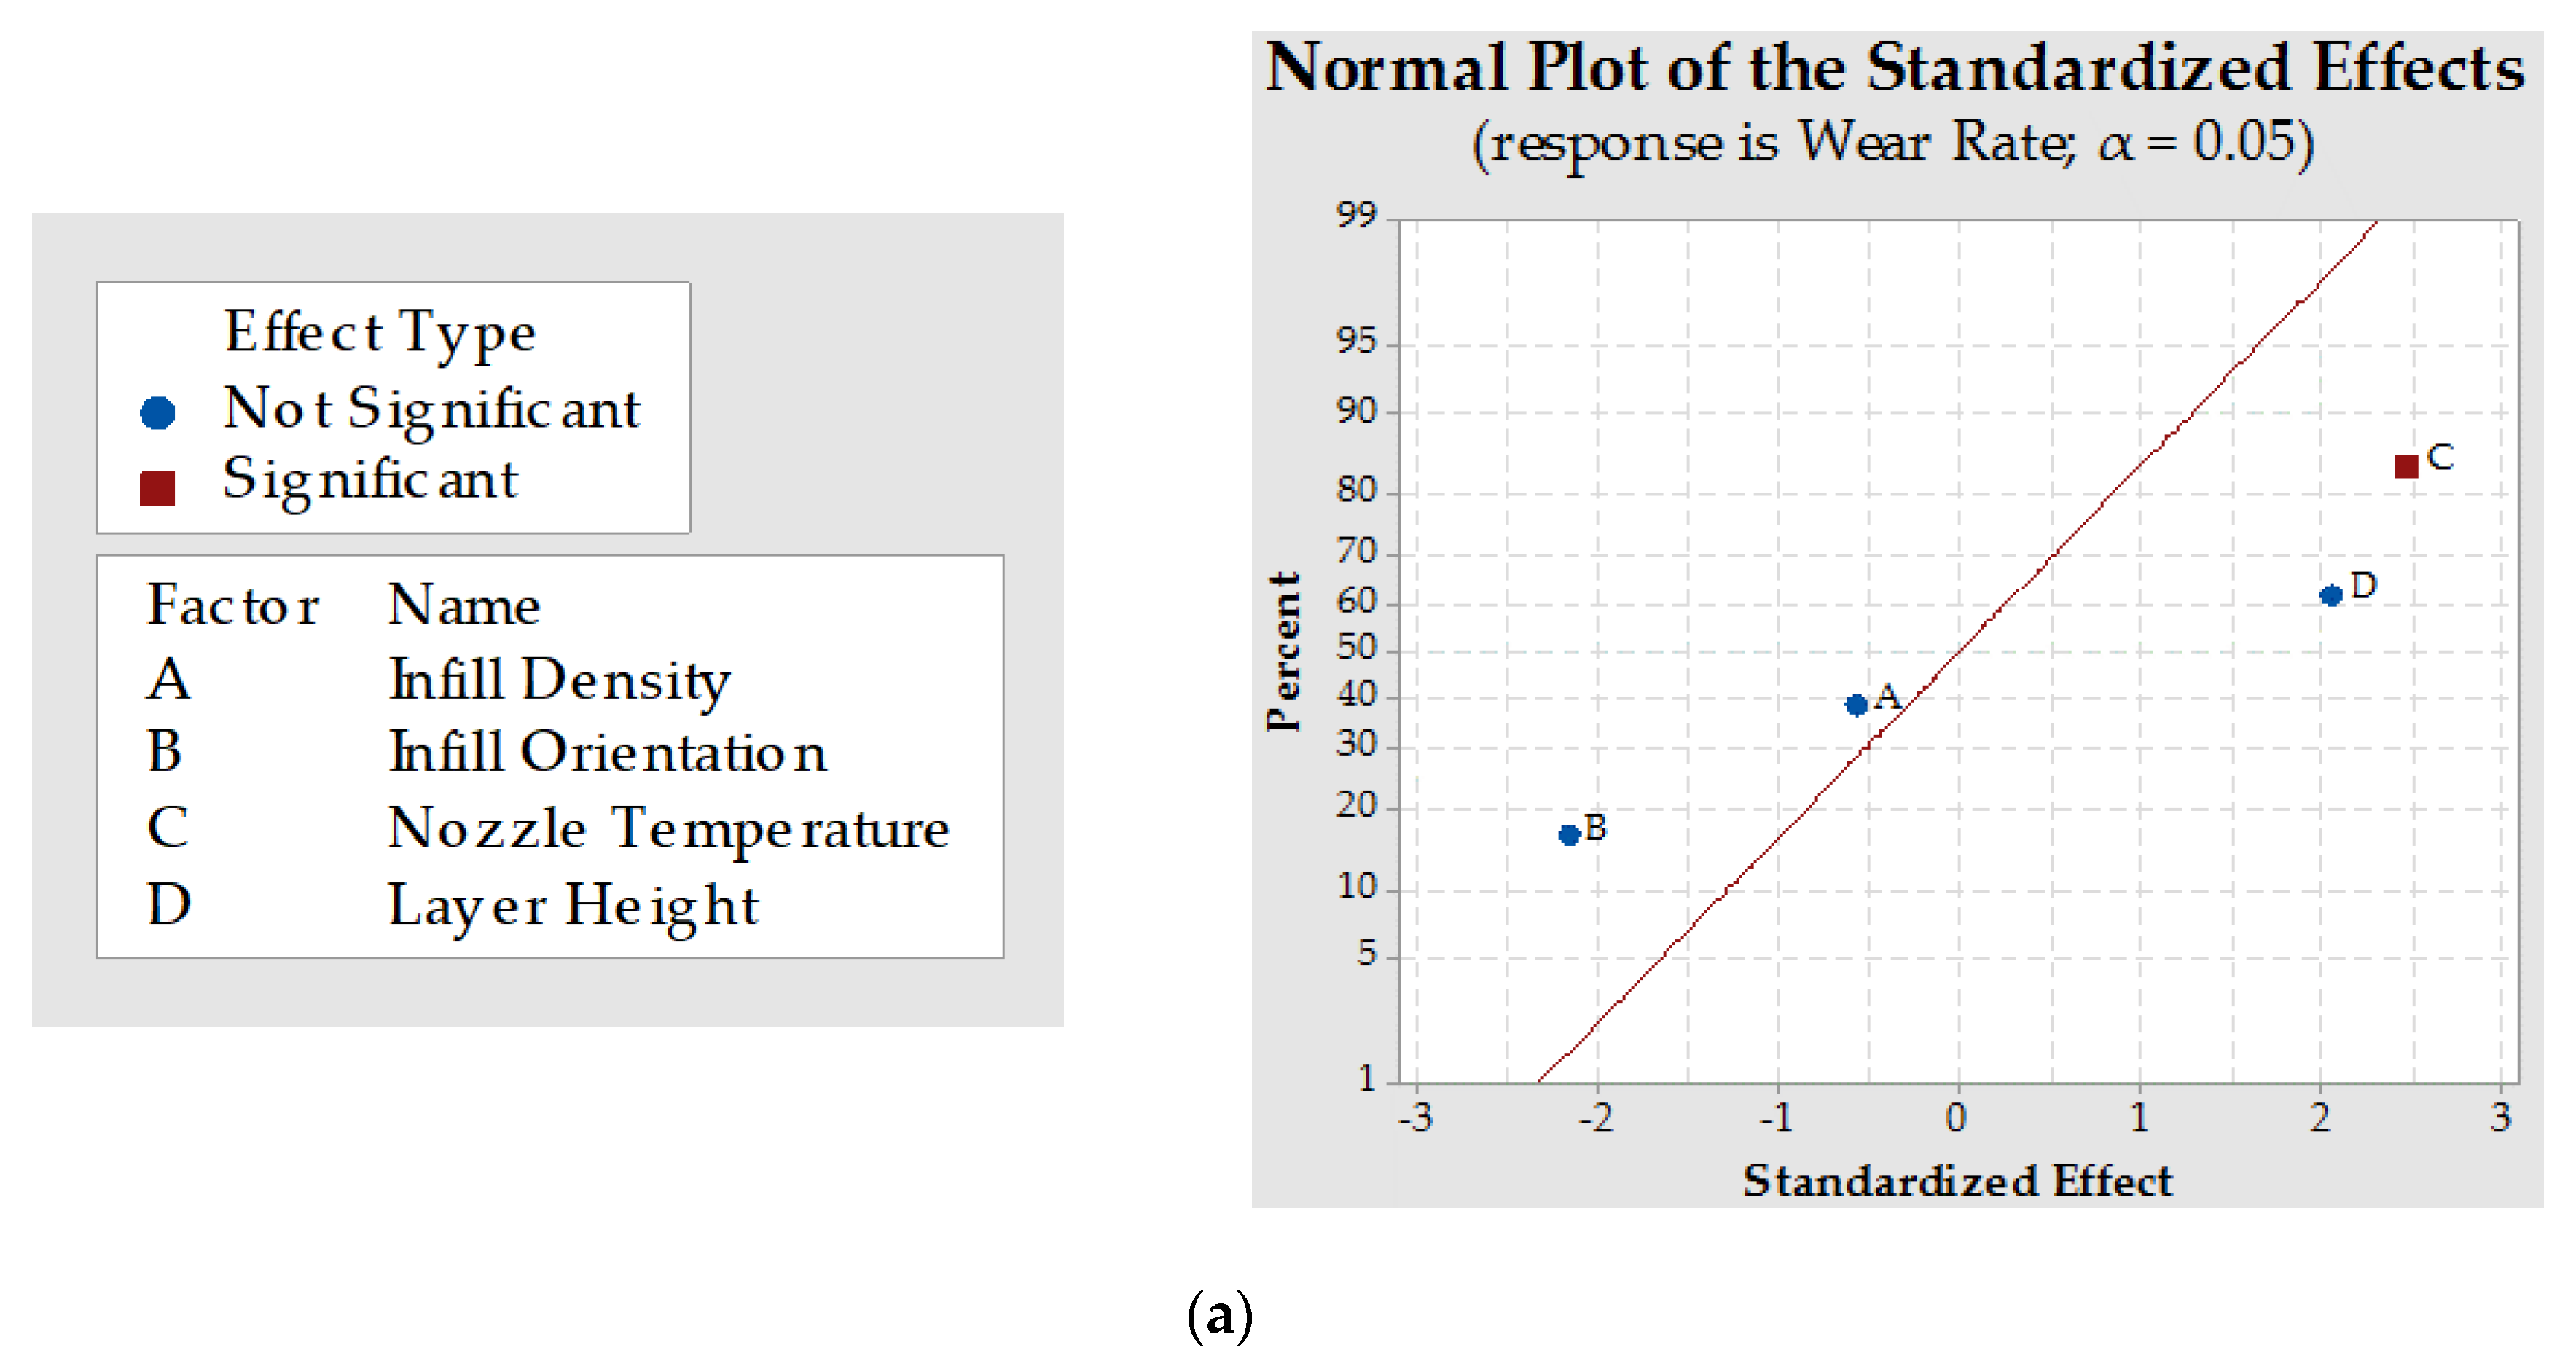
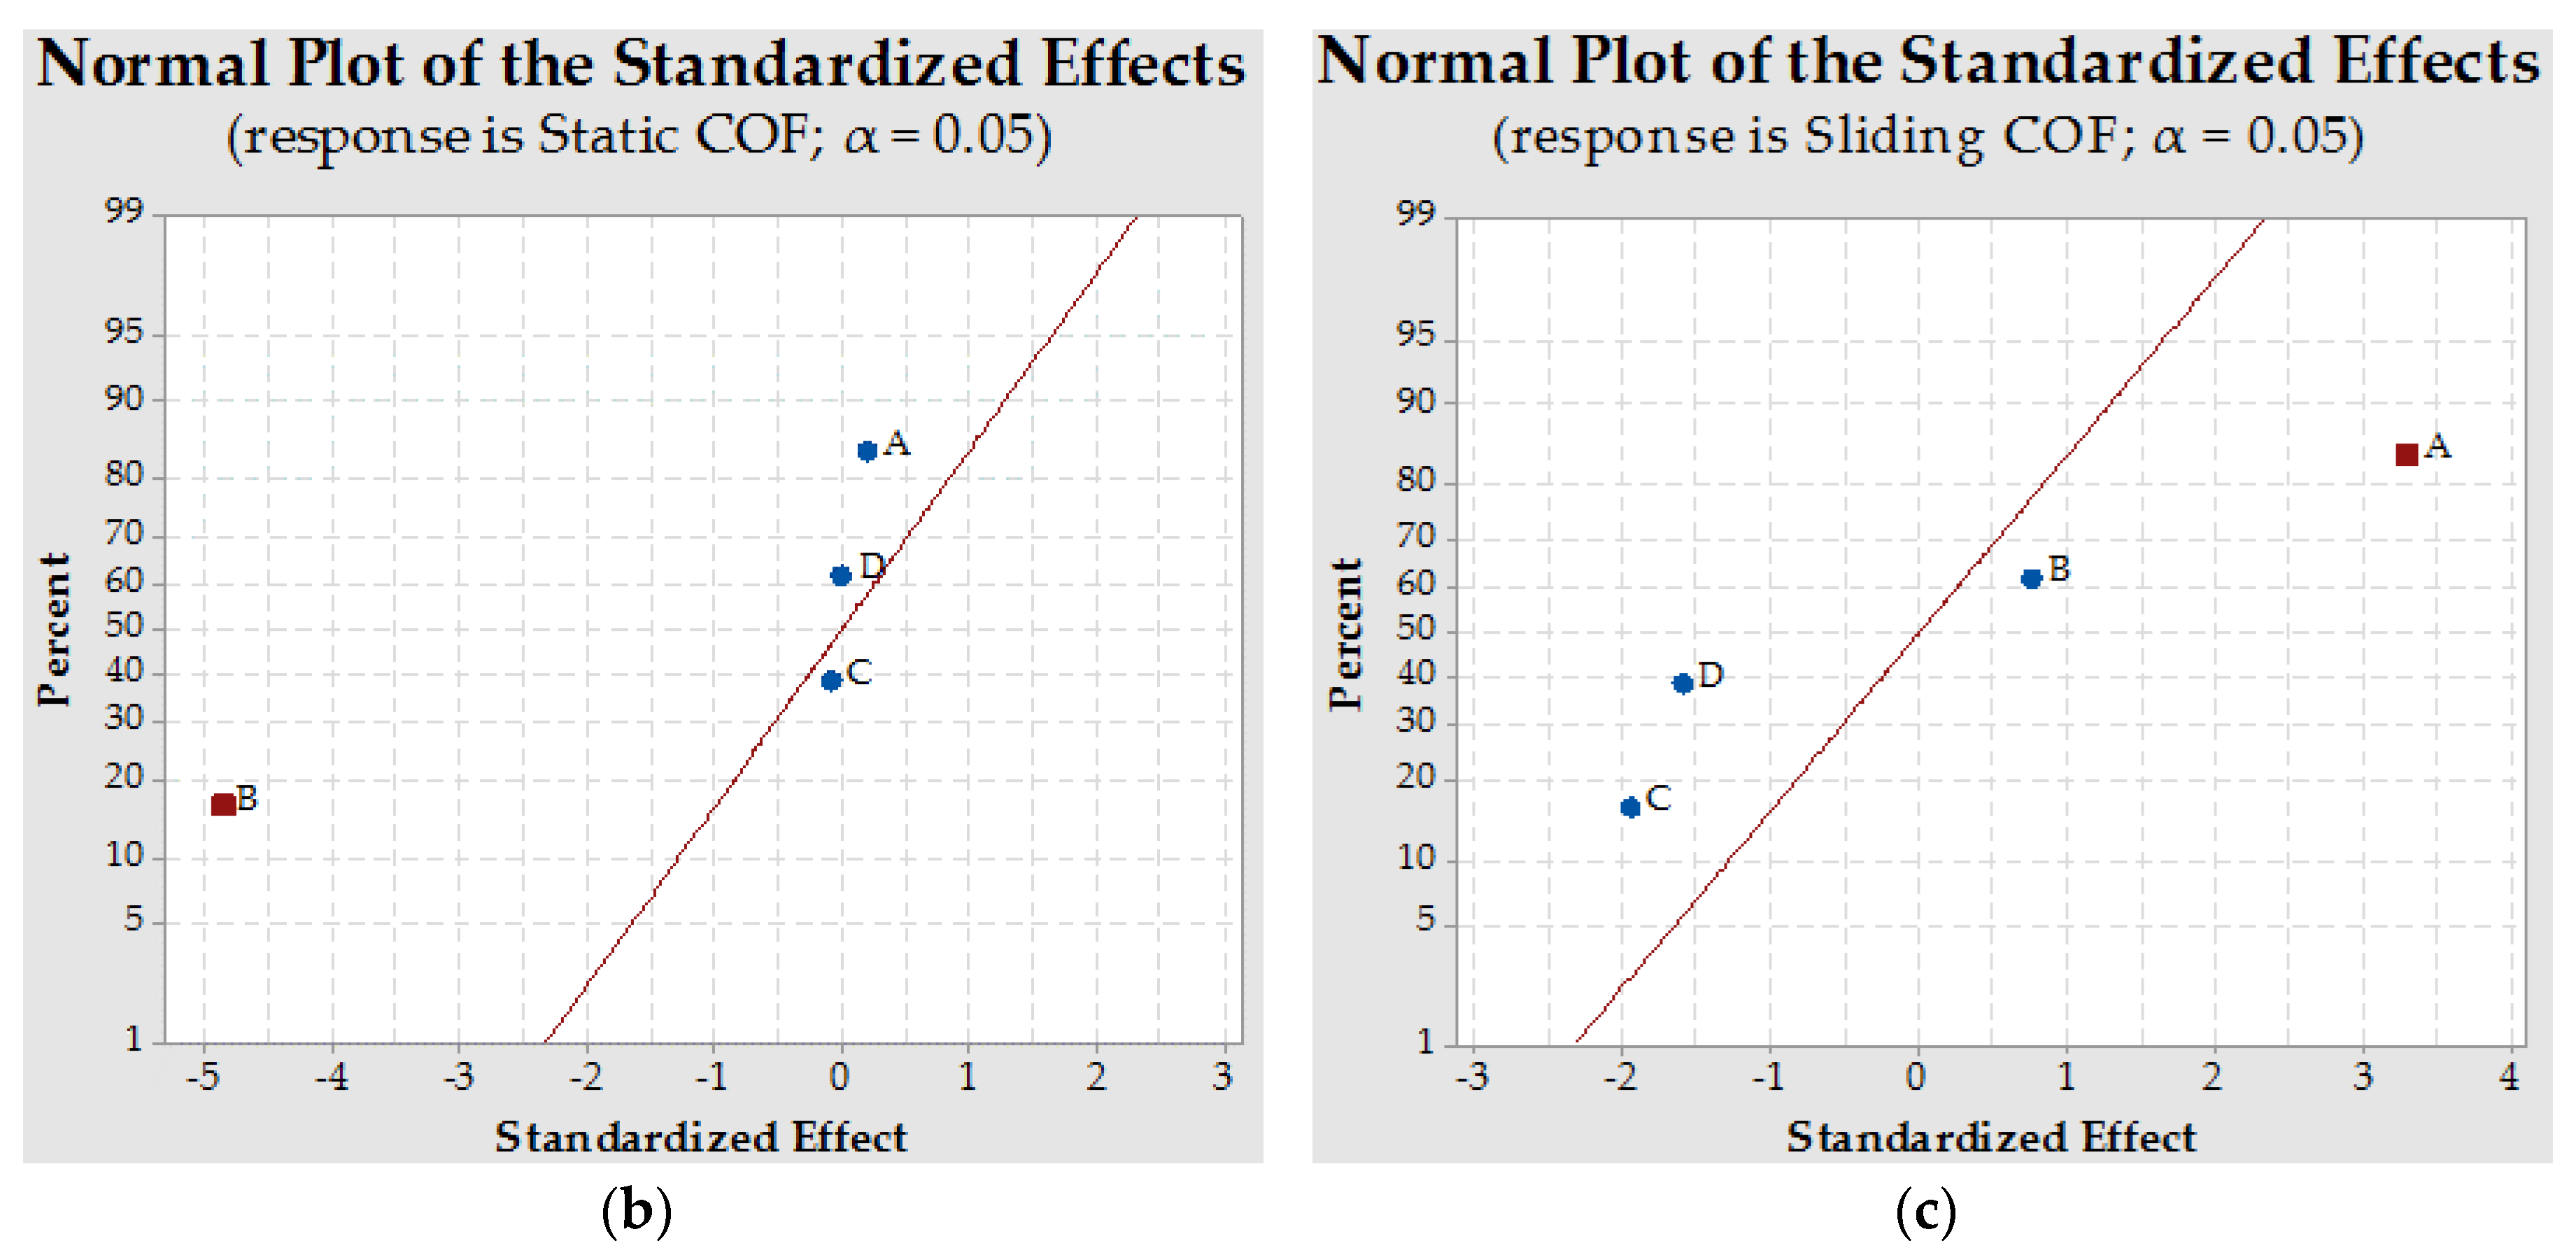
3.3. Results of the Definitive Screening Design

A definitive screening experimental design offers the possibility of investigating different process variables with regard to their influence on the target variables. The four process parameters of infill density, infill orientation, nozzle temperature, and layer thickness are varied in three steps. Since all parameters often influence each other, the significance of an influence is evaluated within the scope of a screening. Optimised production conditions are not the result of such a design of experiments and have to be determined afterwards based on the variations of the significant process parameters. The parameters and levels depicted in Table 1 are summarised in Table 4 for the definitive screening experimental design. In 13 test procedures, the measured variables’ wear rate and the coefficients for static and kinetic friction are evaluated. During the variation, the wear rate assumes values of 9.83 to 30.15 µm/km, the coefficient for static friction is 0.52 to 0.71, and the coefficient for kinetic friction is 0.31 to 0.38.
For an initial evaluation of statistical significance, a Pareto chart is drawn up. In this diagram, the absolute values of the standardised effects are shown and arranged according to the size of their effect. The reference line drawn in the diagram is used to assess whether an effect is statistically significant. If the absolute value of a standardised effect is larger than the reference value indicated by the reference line, the effect is considered statistically significant. The reference line for determining statistical significance depends on the significance level α, which can be determined by the confidence level. Using the Pareto chart, it is possible to provide a prediction of the magnitude of the effect. However, the diagram does not provide any information about which effect is responsible for increasing or decreasing a response variable. For such an assessment, it is necessary to use normal probability plots of the standardised effects, as shown below. These can be used to determine the size and direction of the individual effects. The standardised effect is shown in relation to a distribution fitting line. The distribution fitting line represents the case for which all effects are zero. A positive effect means that the response variable increases when switching from the low to the high effect level. The situation is different for negative effects. For negative effects, the response variable decreases when switching from the low to the high effect level. The further away an effect is from zero in the diagram, the higher the amount and the influence of the effect and the higher the statistical significance of the considered effect. To distinguish between significant and non-significant effects, the two effect types are differentiated by colour. Figure 9 shows three normal probability plots for standardised effects of the wear rate and friction coefficients as response variables to the significance level α = 0.05. This level results in a criterion that factors with a standardised effect greater than the absolute value of 2.3 are highlighted as significant effects.
In the normal probability plot of Figure 9a, the response variable wear rate is investigated. The nozzle temperature is shown to have a significant influence on this analysis. This is to the right of the reference line, which means that the wear rate increases when the nozzle temperature is increased. The other factors show a tendency towards a negative or positive influence on the wear rate, but they are not significant although they are close to the criterion of standardised effects of ±2.3 with B = 2.2 and D = 2.1. Considering the standard deviations of the tests, it is possible that the effects B and D could also be significant. Consequently, a reduced layer thickness or an increased infill orientation could result in a reduction of the wear rate. As already shown in Figure 5, the infill density has almost no influence on the wear rate in the considered range, which does not change significantly even if different effects are superimposed.
The results for the response variable static friction are shown in Figure 9b. The coefficient of static friction is determined at the point where the movement stops and the direction is reversed at dead centre. In order to put the test specimen back into motion, the static adhesive force must be exceeded. Regarding the influences on the coefficient of static friction, it can be seen that only the infill orientation causes an effect. The other parameters are relatively close to the distribution fitting line and thus not significant. If the angle is increased from 0 to 90°, the infill orientation has a reducing influence on the coefficient of static friction. This means that in case of an infill orientation of 90°, the static friction coefficient is the lowest. In this case, the printed lines of the infill lie perpendicular to the direction of movement and to the grinding direction.
Finally, the results of the design of experiments for the sliding friction coefficient are shown in Figure 9c. In this case, only the infill density factor is highlighted as statistically significant. With a decrease in infill density from 90% to 70%, the sliding friction coefficient thus decreases. In this context, the occurring standard deviation of this parameter must be taken into account, so that the significance of the nozzle temperature cannot be excluded for future investigations at this point. However, infill orientation and layer height do not significantly influence the coefficient of sliding friction.
Based on the results and in addition to the already known influence of the infill density, the infill orientation and nozzle temperature are shown as parameters for changing the tribological properties. The enormous influence of infill orientation on the coefficient of static friction can be attributed to a direction-dependent friction, which is also known as friction anisotropy [27]. The anisotropic surface of the sample due to the varied infill orientation results in anisotropic tribological parameters, which mainly affect the static friction. In [28], it is observed analogous to this screening that structures in the direction of movement lead to higher coefficients of static friction compared to those oriented perpendicular to them, although the contact areas are the same. The greater an uninterrupted static friction length L is, the closer the stick force reaches its maximum. Due to the increasing angular deviation of the infill orientation from the direction of movement, the static friction length becomes shorter, and the static friction is correspondingly lower (Figure 10). The characteristic of this relationship is described in [29], as the often negligible influence of the entire contact surface, which confirms the observations made in this DSD regarding the infill density (Figure 9b). Furthermore, this correlation is only observed in the area of the stick-slip effect at the transition from sticking to sliding and not during the sliding phase, which is consistent with the results of this work.
The dependence of additive manufactured components on the manufacturing temperature is sufficiently known with regard to the mechanical properties. Higher temperatures usually lead to a stronger adhesive bond between the lines and layers, but they can also lead to premature damage due to thermally induced aging. Whether these observations also apply to additive manufactured test specimens made of PBT cannot be concluded from the state of the art, which is why no final statement can be made regarding the effects on wear rate.

4. Conclusions

Within the scope of this contribution, it could be shown that the process parameters of the FLM process have a significant influence on the resulting tribological properties of an FLM component. The investigations carried out in this work are initially limited to a mostly macroscopic view of the tribo-contact and the potential for individualised design of tribo-contact surfaces. The design flexibility of the FLM process allows a purposeful conceptual design of tribological systems according to application-specific requirements. The potential of surface structuring of FLM components in tribological applications is demonstrated by means of special test specimens whose contact surface consists of FLM-manufactured infill structures. By influencing the effective contact area (infill density and therefore surface pressure) as well as the orientation of surface structures, the characteristic values of a tribo-system, such as friction coefficients or wear rate, can be selectively reduced or, in situations where this is required, increased to a maximum. These observations have not yet been written down for reciprocating tribological loads, thus extending the state of the art. However, the investigations of this contribution also show that the analysis of a tribo-system consisting of FLM components is highly complex and requires further detailed experimental investigations. For example, the thermomechanical and viscoelastic properties of the FLM material and their influence on the tribological properties must also be considered in future work. The transferability to other plastic materials must also be checked here. In this context, a modification of the metallic basic body is also to be considered, which is to be carried out both as a material change or as a different surface structuring and a different roughness. Other aspects of the FLM process should not be neglected as well. For example, the influence of the nozzle diameter and the resulting changed flow of the melt and strand geometry could be investigated. It is also frequently shown in the literature that the filament diameter and the melting behaviour dependent on it have an influence on the mechanical properties. Therefore, it is still unclear whether the filament diameter also influences the tribological properties. Finally, the transferability of the results to alternative additive manufacturing processes such as selective laser sintering and their individual process characteristics should not be forgotten.

Author Contributions

Conceptualisation, D.H., M.S. (Michael Stanko), P.H. and M.S. (Markus Stommel); methodology, D.H., M.S. (Michael Stanko) and P.H.; software, D.H., M.S. (Michael Stanko) and P.H.; investigation, D.H. and P.H.; Development of the quintuple reciprocating pin-on-plate tribo-tester, M.S. (Michael Stanko) and D.H.; writing—original draft preparation, D.H., M.S. (Michael Stanko) and M.S. (Markus Stommel); writing—review and editing, D.H. and M.S. (Michael Stanko); visualization, D.H. and M.S. (Michael Stanko); supervision, M.S. (Markus Stommel). All authors have read and agreed to the published version of the manuscript.

Funding

This research received no external funding.

Acknowledgments

The authors acknowledge the financial support by the German Research Foundation (DFG) and TU Dortmund University within the funding program “Open Access Publishing”. The authors would like to thank Murtfeldt Kunststoffe GmbH & Co. KG for making the measurement sensor technology available.

Conflicts of Interest

The authors declare no conflict of interest.

References

  1. Lee, J.; Huang, A. Fatigue analysis of FDM materials. Rapid Prototyp. J. 2013, 19, 291–299. [Google Scholar] [CrossRef]
  2. Tymrak, B.M.; Kreiger, M.; Pearce, J.M. Mechanical properties of components fabricated with open-source 3-D printers under realistic environmental conditions. Mater. Des. 2014, 58, 242–246. [Google Scholar] [CrossRef]
  3. Lanzotti, A.; Grasso, M.; Staiano, G.; Martorelli, M. The impact of process parameters on mechanical properties of parts fabricated in PLA with an open-source 3-D printer. Rapid Prototyp. J. 2015, 21, 604–617. [Google Scholar] [CrossRef] [Green Version]
  4. Durgun, I.; Ertan, R. Experimental investigation of FDM process for improvement of mechanical properties and production cost. Rapid Prototyp. J. 2014, 20, 228–235. [Google Scholar] [CrossRef]
  5. Kotlinski, J. Mechanical properties of commercial rapid prototyping materials. Rapid Prototyp. J. 2014, 20, 499–510. [Google Scholar] [CrossRef]
  6. Cuan-Urquizo, E.; Barocio, E.; Tejada-Ortigoza, V.; Pipes, R.B.; Rodriguez, C.A.; Roman-Flores, A. Characterization of the Mechanical Properties of FFF Structures and Materials: A Review on the Experimental, Computational and Theoretical Approaches. Materials 2019, 12, 895. [Google Scholar] [CrossRef] [Green Version]
  7. Wu, W.; Geng, P.; Li, G.; Zhao, D.; Zhang, H.; Zhao, J. Influence of Layer Thickness and Raster Angle on the Mechanical Properties of 3D-Printed PEEK and a Comparative Mechanical Study between PEEK and ABS. Materials 2015, 8, 5834–5846. [Google Scholar] [CrossRef]
  8. Tanikella, N.G.; Wittbrodt, B.; Pearce, J.M. Tensile strength of commercial polymer materials for fused filament fabrication 3D printing. Addit. Manuf. 2017, 15, 40–47. [Google Scholar] [CrossRef] [Green Version]
  9. Findik, F. Latest progress on tribological properties of industrial materials. Mater. Des. 2014, 57, 218–244. [Google Scholar] [CrossRef]
  10. Boparai, K.; Singh, R.; Singh, H. Comparison of tribological behaviour for Nylon6-Al-Al 2 O 3 and ABS parts fabricated by fused deposition modelling. Virtual Phys. Prototyp. 2015, 10, 59–66. [Google Scholar] [CrossRef]
  11. Singh Boparai, K.; Singh, R.; Singh, H. Wear behavior of FDM parts fabricated by composite material feed stock filament. Rapid Prototyp. J. 2016, 22, 350–357. [Google Scholar] [CrossRef]
  12. Singh, R.; Singh, S.; Fraternali, F. Development of in-house composite wire based feed stock filaments of fused deposition modelling for wear-resistant materials and structures. Compos. Part. B: Eng. 2016, 98, 244–249. [Google Scholar] [CrossRef]
  13. Gurrala, P.K.; Regalla, S.P. Friction and wear behavior of abs polymer parts made by fused deposition modeling (FDM). Technol. Lett. 2014, 1, 13–17. [Google Scholar]
  14. Mohamed, O.A.; Masood, S.H.; Bhowmik, J.L.; Somers, A.E. Investigation on the tribological behavior and wear mechanism of parts processed by fused deposition additive manufacturing process. J. Manuf. Process. 2017, 29, 149–159. [Google Scholar] [CrossRef]
  15. Sood, A.K.; Equbal, A.; Toppo, V.; Ohdar, R.K.; Mahapatra, S.S. An investigation on sliding wear of FDM built parts. Cirp J. Manuf. Sci. Technol. 2012, 5, 48–54. [Google Scholar] [CrossRef]
  16. Kulkarni, M.V.; Elangovan, K.; Reddy, K.H.; Basappa, S.J. Tribological behaviours of abs and pa6 polymer-METAL sliding combinations under dry friction, water absorbed and electroplated conditions. J. Eng. Sci. Technol. 2016, 11, 68–84. [Google Scholar]
  17. Nagendra, J.; Ganesha Prasad, M.S. Comparison of tribological behavior of nylon aramid polymer composite fabricated by fused deposition modeling and injection molding process. Int. J. Mech. Mech. Eng. Technol. 2018, 9, 720–728. [Google Scholar]
  18. Lin, L.; Ecke, N.; Huang, M.; Pei, X.-Q.; Schlarb, A.K. Impact of nanosilica on the friction and wear of a PEEK/CF composite coating manufactured by fused deposition modeling (FDM). Compos. Part B Eng. 2019, 177, 107428. [Google Scholar] [CrossRef]
  19. Czichos, H.; Habig, K.-H. Tribologie-Handbuch; Springer Fachmedien Wiesbaden: Wiesbaden, Germany, 2015; ISBN 978-3-8348-1810-2. [Google Scholar]
  20. Georgescu, C.; Stefanescu, I.; Botan, M.; Deleanu, L. Friction and Wear of Polybutylene Terephthalate Against Steelin Block-on-ring-tests. Mater. Plast. 2012, 49, 151–156. [Google Scholar]
  21. Georgescu, C.; Botan, M.; Deleanu, L. Influence of Adding Materials in PBT on Tribological Behaviour. Mater. Plast. 2013, 51, 351–354. [Google Scholar]
  22. Lin, L.; Schlarb, A.K. The roles of rigid particles on the friction and wear behavior of short carbon fiber reinforced PBT hybrid materials in the absence of solid lubricants. Tribol. Int. 2018, 119, 404–410. [Google Scholar] [CrossRef]
  23. Jeng, M.-C.; Fung, C.-P.; Li, T.-C. The study on the tribological properties of fiber-reinforced PBT composites for various injection molding process parameters. Wear 2002, 252, 934–945. [Google Scholar] [CrossRef]
  24. Czichos, H.; Saito, T.; Smith, L.R. Springer Handbook of Materials Measurement Methods; Springer: Berlin/Heidelberg, Germany, 2006; ISBN 9783540207856. [Google Scholar]
  25. Martínez, F.J.; Canales, M.; Bielsa, J.M.; Jiménez, M.A. Relationship between wear rate and mechanical fatigue in sliding TPU–metal contacts. Wear 2010, 268, 388–398. [Google Scholar] [CrossRef]
  26. Mnif, R.; Ben Jemaa, M.C.; Kacem, N.H.; Elleuch, R. Impact of Viscoelasticity on the Tribological Behavior of PTFE Composites for Valve Seals Application. Tribol. Trans. 2013, 56, 879–886. [Google Scholar] [CrossRef]
  27. Casey, M.; Wilks, J. The friction of diamond sliding on polished cube faces of diamond. J. Phys. D Appl. Phys. 1973, 6, 1772–1781. [Google Scholar] [CrossRef]
  28. Stupkiewicz, S.; Lewandowski, M.J.; Lengiewicz, J. Micromechanical analysis of friction anisotropy in rough elastic contacts. Int. J. Solids Struct. 2014, 51, 3931–3943. [Google Scholar] [CrossRef] [Green Version]
  29. Yu, C.; Yu, H.; Liu, G.; Chen, W.; He, B.; Wang, Q.J. Understanding Topographic Dependence of Friction with Micro- and Nano-Grooved Surfaces. Tribol. Lett. 2014, 53, 145–156. [Google Scholar] [CrossRef]
Figure 1. Specimen design (a); visualisation of the infill orientation and infill density (b).
Jmmp 04 00037 g001
Figure 2. Comparison of the ideal, sliced, and the real, manufactured specimen for the measurement of the contact area after the tribological tests.
Jmmp 04 00037 g002
Figure 3. Quintuple reciprocating pin-on-plate tribo-tester with eccentrically mounted driving unit.
Jmmp 04 00037 g003
Figure 4. Structure of a reciprocal pin-on-plate measuring unit with wear measuring system.
Jmmp 04 00037 g004
Figure 5. Exemplary illustration of the raw data of the tribo-tester measurement acquisition system: (a) Friction force during the foreward and backward movement of the slide within one test cycle; (b) Wear measurement based on the test specimen height for a test duration of 24 h.
Jmmp 04 00037 g005
Figure 6. Illustration of two tribo-contacts with different arrangements of the grinding and infill orientation in relation to the direction of movement of the pin-on-plate experiment.
Jmmp 04 00037 g006
Figure 7. Wear (a) as well as wear rate and friction coefficients (b) of two tribo-contacts with different grinding (metal body) and infill orientations (test specimen).
Jmmp 04 00037 g007
Figure 8. Coefficients of static and sliding friction and wear rate resulting from the variation of infill densities from 20% to 100% respectively for the surface pressures from 0.951 to 0.355 MPa. Scaled according to the equidistant steps of infill density (a) and the equivalent surface pressure (b).
Jmmp 04 00037 g008
Figure 9. Normal probability plots of the effects for interpreting the significance on a level of 0.05 of the four factors infill density, infill orientation, nozzle temperature, and layer height on the three responses wear rate (a) and the coefficients of static (b) and sliding (c) friction.
Jmmp 04 00037 g009aJmmp 04 00037 g009b
Figure 10. Change of the static friction length L depending on the orientation angle of the infill from 0 to 90° in relation to the direction of movement.
Jmmp 04 00037 g010
Table 1. Selected process parameters and respected levels for all experimental designs.
Process ParameterValue
UnitSymbolLevel
Preliminary TestsScreening DSD
12LowCentreHigh
Infill Density%A6020–100708090
Infill OrientationdegB45-0004590
Nozzle Temperature°CC250250250270290
Layer HeightmmD0.200.200.150.200.25
Grinding Orientationdeg 0-450000
Table 2. Conversion of the infill density into the corresponding surface pressure.
Infill DensityContact AreaSurface Pressure
20%51.88 mm20.951 MPa
30%75.66 mm20.646 MPa
40%92.38 mm20.526 MPa
50%105.78 mm20.461 MPa
60%119.19 mm20.409 MPa
70%130.82 mm20.370 MPa
80%134.70 mm20.362 MPa
90%136.56 mm20.359 MPa
100%138.04 mm20.355 MPa
Table 3. Boundary conditions of the measurements.
Test ParameterValue
Test Conditions23 °C and 50% humidity (climate-controlled lab)
Test Frequency1 Hz
Test Speed0.2 m/s
Normal Force50 N
Table 4. Overview of the experimental design and measured tribological parameters. Static COF: coefficient of static friction, Sliding COF: coefficient of sliding friction.
RunA %B degC °CD mmWear Rate µm/kmStatic COFSliding COF
170902500.2011.20 ± 1.380.52 ± 0.020.31 ± 0.04
270452500.2511.87 ± 1.090.62 ± 0.010.32 ± 0.03
370902900.1511.71 ± 0.330.54 ± 0.050.31 ± 0.03
48002500.1514.43 ± 1.210.68 ± 0.030.33 ± 0.02
590902500.1510.58 ± 0.950.61 ± 0.020.38 ± 0.03
690902700.259.83 ± 2.050.58 ± 0.020.34 ± 0.03
780452700.2010.87 ± 1.210.60 ± 0.020.33 ± 0.03
87002900.2530.15 ± 1.380.68 ± 0.070.31 ± 0.02
99002900.2020.94 ± 1.940.66 ± 0.030.32 ± 0.01
107002700.1515.52 ± 1.930.71 ± 0.040.33 ± 0.02
1190452900.1513.22 ± 1.870.59 ± 0.020.33 ± 0.04
129002500.2517.76 ± 1.490.65 ± 0.010.34 ± 0.01
1380902900.2524.86 ± 4.250.60 ± 0.040.32 ± 0.02

