

Exploring the Effects of Laser Surface Modification on AISI 301LN Steel: A Micro-Mechanical Study


1
Center for Structural Integrity, Micromechanics and Reliability of Materials (CIEFMA), Department of Materials Science and Engineering, Universitat Politecnica de Catalunya—BarcelonaTECH, 08019 Barcelona, Spain
2
Barcelona Research Center in Multiscale Science and Engineering, Universitat Politecnica de Catalunya—BarcelonaTECH, 08019 Barcelona, Spain
*
Author to whom correspondence should be addressed.
J. Manuf. Mater. Process. 2023, 7(6), 191; https://doi.org/10.3390/jmmp7060191
Submission received: 27 September 2023
/
Revised: 17 October 2023
/
Accepted: 24 October 2023
/
Published: 26 October 2023
(This article belongs to the Topic Laser Processing of Metallic Materials)
Abstract
:This article investigates the surface hardening capability of a metastable austenitic TRansformation Induced Plasticity (TRIP) stainless steel, particularly on AISI 301LN, by laser texturing. This technology produces microstructural surface changes in terms of both phase transformation and grain size modification and, as a direct consequence, the laser influences the surface characteristics, mainly hardness and roughness. In this sense, the key parameters (laser power, scanning speed and position of the focal length) were investigated by using a Design of Experiments (DoE) in detail to better understand the correlation between texturing parameters, microstructural and mechanical changes, always at the superficial level. From all the aforementioned information, the results show that the maximum surface hardening is obtained by increasing the laser power and decreasing the scanning speed. Furthermore, by reducing the focal distance, the depth of the microstructural evolution layer is more significant, while the width is less affected. Finally, a suitable model was developed to correlate the processing parameters here investigated with the resulting surface integrity, in terms of mechanical properties, by means of a regression equation.
1. Introduction
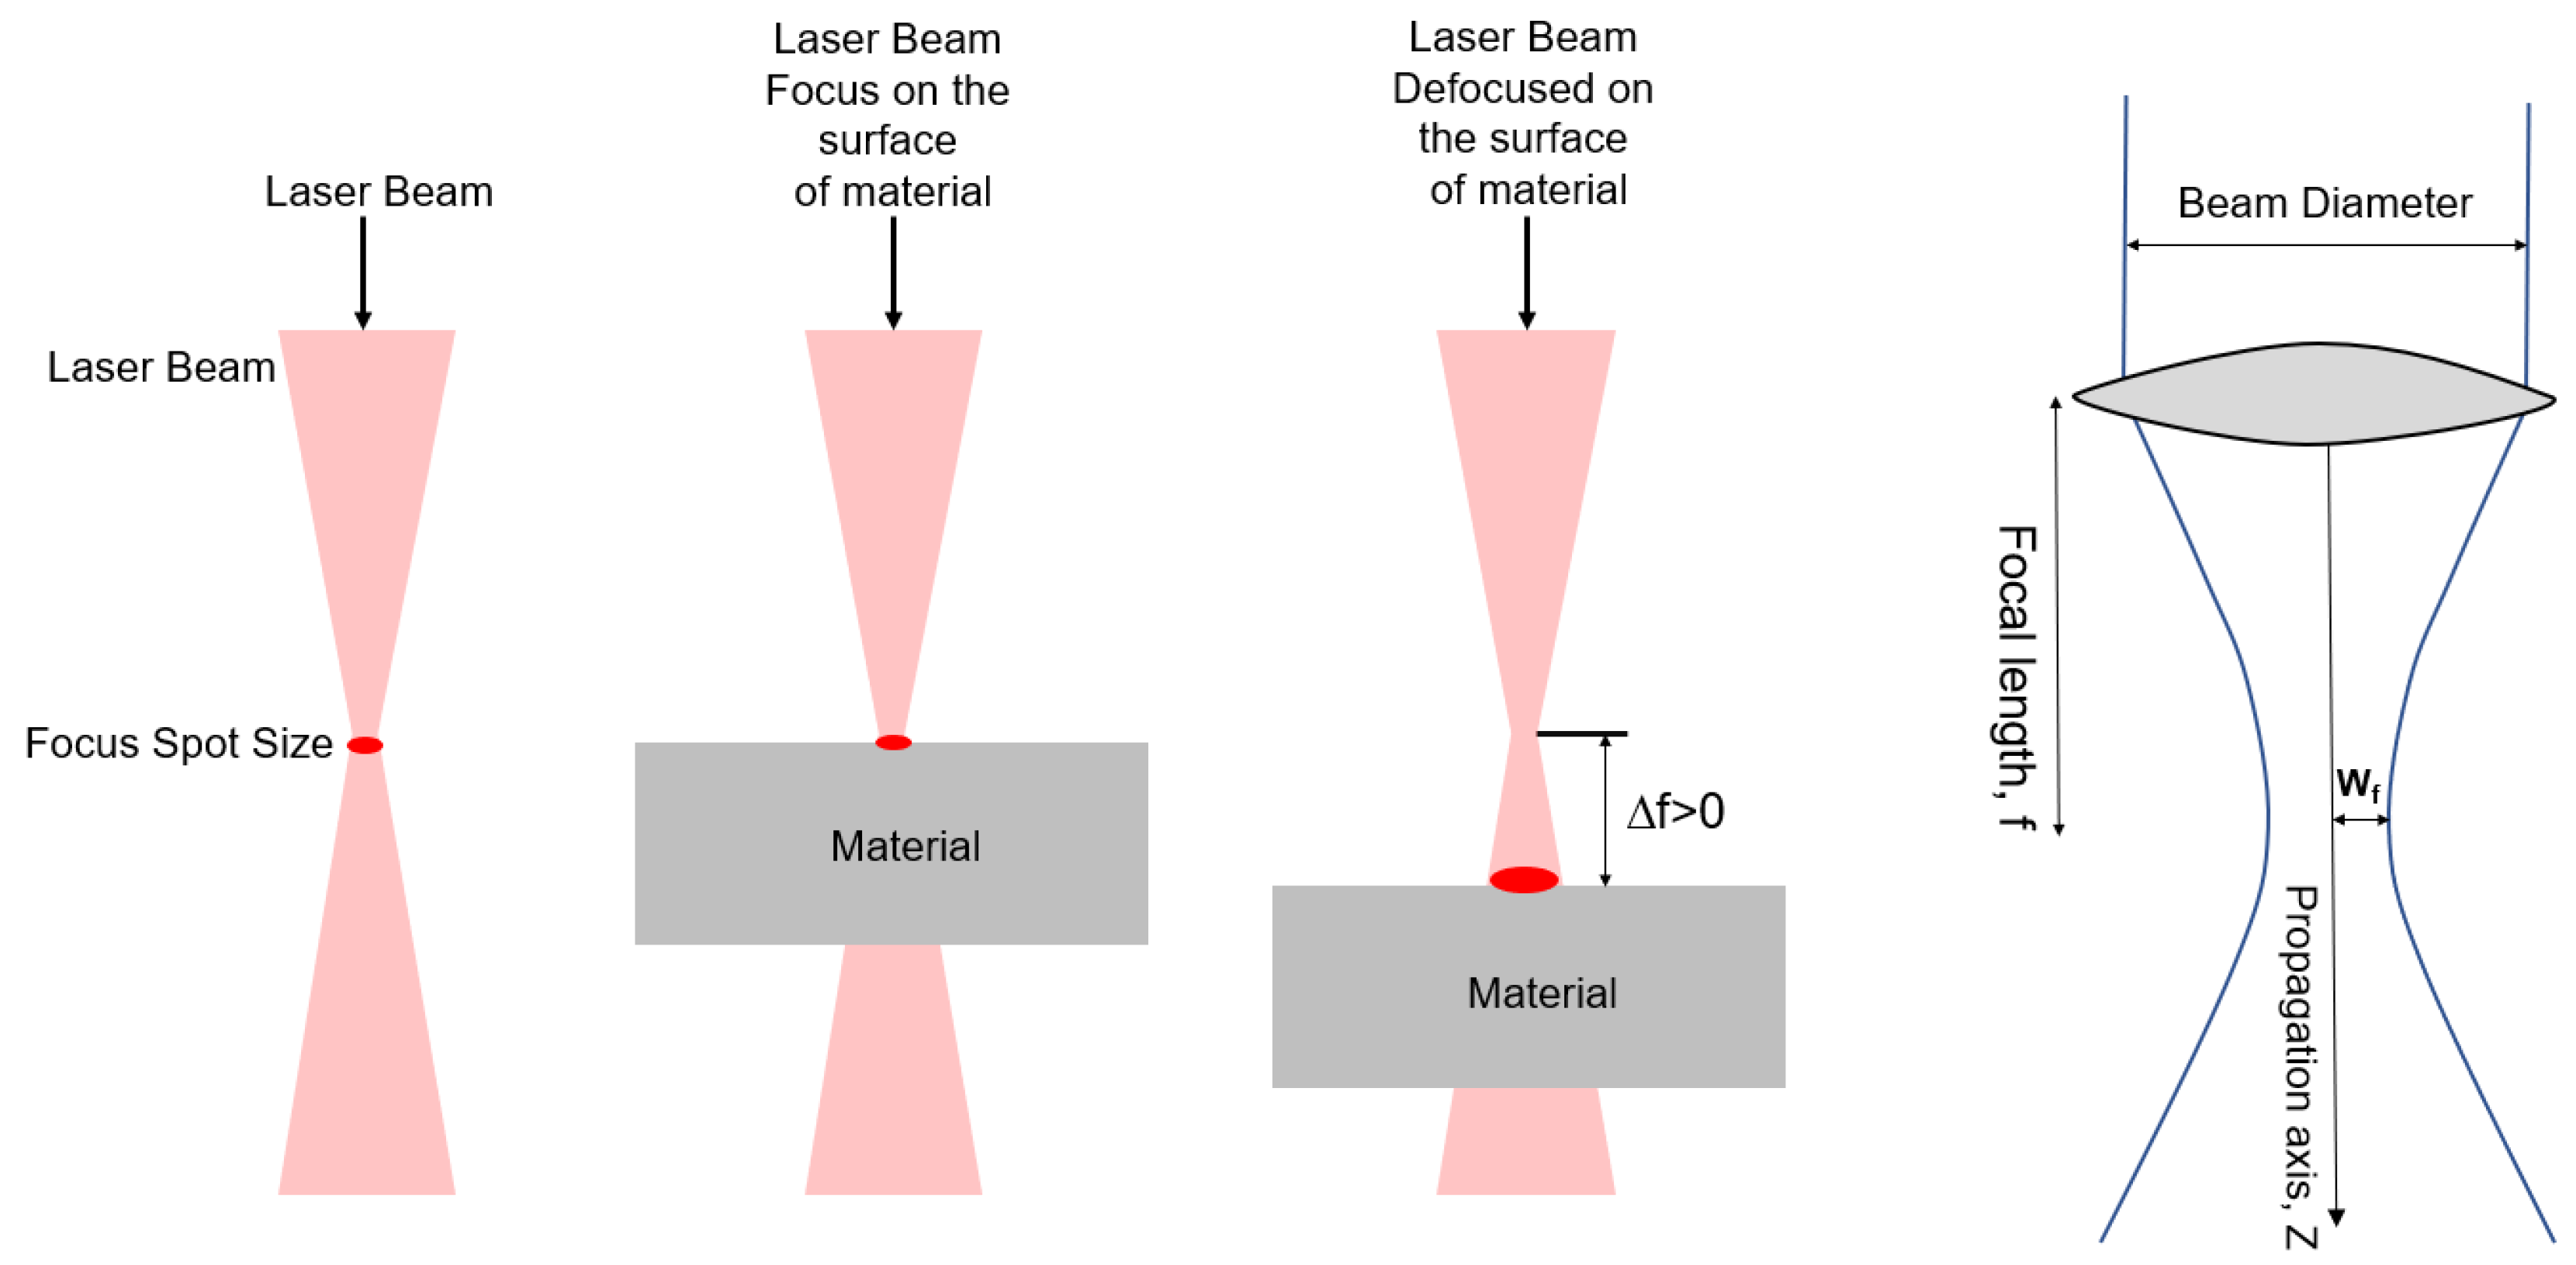
Laser processing is nowadays widely employed in several industrial sectors for operations such as texturing [1], drilling [2,3], cutting [4,5,6], welding [7,8] and 3D printing [9,10]. This technology usually leads to a texturing and hardening effect at the superficial level. As a direct consequence, the lifetime under service-like working conditions increases due to the improvement of surface integrity in terms of mechanical and tribological properties. In contrast, the sub-superficial part of the specimen, which has not been thermally affected, remains both microstructural and mechanically unaltered. Within this context, nanosecond (ns-)lasers have proved to be a suitable choice to conduct surface texturing or localized heat treatments (Figure 1) [11]. On one hand, the very short duration of the pulse leads to good control and allows for predicting the material modifications. On the other hand, the average power output leads to the processing of large areas, making them suitable for macro-processing applications. Additionally, ns-lasers are often more cost-effective and readily available compared to ultrafast laser systems [12]. Over the last decade, there have been many advances in this field of research. Daido et al. [13] presented high-power diode lasers that superficially modify the surface of the treated material by increasing its hardness. Moreover, the geometric dimensions of the modified layer were greater than those created with solid-state lasers. The impact of surface texture was investigated by subjecting low-carbon steel to neodymium-doped yttrium aluminum garnet (Nd: YAG) and CO2 laser beam irradiation within the energy range of 200 to 600 mJ [14]. The findings revealed that the extent of the affected zone is primarily governed by laser power and scanning speed, resulting in the creation of a superficial layer characterized by a uniform material thickness of approximately 2 mm. Consequently, this process led to a localized doubling of surface hardness [15].
The investigation of laser surface texture by modelling [16] and especially by using heat transfer equations, approximation of laser radiation absorption and temperature-dependent thermal properties, shows that with increasing laser power, the hardened layer becomes thicker. Various simulation models were built for two AISI 420 stainless steels (EN 1.4021 and 1.4034) to predict the mechanical response at the macroscopic length scale on textured materials [17]. The investigation centered on examining the influence of laser beam distribution and shape—namely, the top-hat distribution in diode lasers and the Gaussian distribution in Nd:YAG lasers—on various parameters, including microhardness, geometric dimensions of the hardened region (depth and width), as well as microhardness deviation (MHD) within the base metal across both width and depth. The results showed that due to the shorter wavelength of the diode laser (~808 nm) compared to Nd:YAG (~1064 nm), which leads to more absorption of laser energy, the diode laser produces a higher surface hardness, and also bigger depth and width of hardened zone than the Nd: YAG laser. Moreover, it creates more MHD depth and width than Nd: YAG laser [18]. However, scarce information related to this topic is available in the literature regarding metastable austenitic stainless steel (MASS) and, in particular, by using the Nd:YLF laser to conduct superficial texture and/or patterns at the superficial level [19]. Mutua et al. studied alloyed steel response to laser surface treatment as a function of the main key texturing parameters (i.e., power density, scanning speed, laser spot diameter and laser energy absorption due to radiation). By optimizing these parameters, it is possible to reach a high hardness level [20].
Design of Experiments (DoE) is a systematic and efficient method that enables scientists and engineers to study the relationships between multiple input and output variables, known as alias factors and responses, respectively [21,22]. Various Design of Experiments (DoE) methods can be employed to discern the independent and combined impacts of different factors that have the potential to influence measurement outcomes [10,23,24]. DoE can also be applied to gain knowledge by estimating the best operating conditions and, as a direct consequence, reduce the operation time and save money [25].
In the context of the preceding information, an in-depth investigation was undertaken to scrutinize the impact of fundamental laser parameters, including laser power, laser scanning speed, and laser focal distance position, on the material affected by surface structuring (MASS). This comprehensive analysis integrates Design of Experiments (DoE) as a pivotal tool to systematically assess and optimize these laser parameters. The research objectives encompass not only an exploration of the profound influences of laser settings but also an extensive evaluation of microstructural and mechanical attributes at the surface level. This multifaceted examination is facilitated by the utilization of state-of-the-art characterization techniques, designed to yield precise and comprehensive insights into the interplay between laser texturing parameters and surface integrity. With these objectives in view, the study endeavors to establish robust correlations and unveil the nuanced relationships that underlie the surface modification process, ultimately contributing to a deeper understanding of the interdependencies among laser parameters, material behavior, and surface integrity.
2. Methods and Experiments
2.1. Samples Preparation and Surface Texturing
The chemical composition of MASS AISI 301LN used in the research is summarized in Table 1. Samples with dimensions of 15 × 15 × 1.5 mm were cut from the 1.5 mm thick sheets produced by Outokumpu (Finland).
The surface texturing on commercial 301LN was conducted using a nanosecond (ns-) solid-state laser (Spectra-Physics, Stahnsdorf, Germany) with a grain medium of Neodymium-doped yttrium lithium fluoride (Nd:YLF), which has a wavelength of 349 nm, without using gas. The maximum pulse energy of this laser beam was held constant at 120 mJ and, as a consequence, there was a constant frequency of 1000 Hz. The beam diameter of this laser is about 0.145 ± 0.02 mm, which allows the creation of spots of about 3.0 ± 0.5 mRad. The dimensions of the used laser head nozzle (L × W × H) were about 165 × 95 × 76 mm. Table 2 shows the main characteristics of the laser equipment employed in this study.
Figure 2 shows the schematic representation of the position of the workpiece concerning the location of the laser beam. Furthermore, the key parameters are represented with their symbols, as well as the laser beam profile visible on the laser line. As can be seen from the Gaussian profile of the laser beam F(r), there is more heat in the central part of the beam, and with the distance from the center, the intensity of the laser beam slightly decreases. Additional details regarding the equations governing the principles of laser operation are provided in Appendix A.
The specimens underwent cross-sectioning, and the resulting samples were embedded in Bakelite to assess the sub-surface damage resulting from laser texturing from a microstructural perspective. Before conducting microstructural characterization, the cross-section was polished using chemo-mechanical methods until it achieved a mirror-like surface. Subsequently, it was examined using advanced characterization techniques. Confocal Laser Scanning Microscopy (CLSM, Olympus Lext OLS30, Tokyo, Japan) was employed to analyze the surface state after being treated with the ns-laser. Furthermore, in order to obtain more detail of the resulting microstructure, a Field Emission Scanning Electron Microscope (FESEM, Carl Zeiss Merlin, Oberkochen, Germany) was used. For comparison purposes, the microstructure was also investigated by electron backscatter diffraction (EBSD) conducted on the cross-sections below the ns-textured surface of the samples prepared by using Focused Ion Beam (FIB, Jeol, JIB-4610F, Tokyo, Japan). Two different sets of spot sizes were employed, 1 and 0.2 μm, in order to obtain a low and high microstructural magnification, respectively. The analysis of phase composition and microstructural features through Electron Backscatter Diffraction (EBSD) images represents a pivotal aspect in comprehending the ramifications of laser treatment on material properties [26,27]. EBSD serves as an invaluable tool for delineating the crystallographic structure and phase transformations occurring within the material matrix [28]. Through meticulous examination of EBSD images, researchers can discern distinct phases, notably the alpha-prime martensitic phase, while concurrently assessing their spatial distribution and crystallographic orientation within the microstructure. This granular insight is instrumental in establishing robust correlations between microstructural alterations and the resultant mechanical properties. It thereby fosters a more profound comprehension of how various laser parameters, including power, scanning speed, and focal distance, engender specific phase formations and consequent mechanical characteristics. Furthermore, EBSD analysis yields a wealth of empirical data for future investigations and process optimization, elevating the overall scientific rigor of laser texturing inquiries.
Microhardness tests were performed on the cross-section surface below the treated area with a DuraScan G5 (EMCO-TEST Prüfmaschinen GmbH, Kuchl, Austria), under loading control mode, with loads from 1 up to 10 kgf. The loading cycle was conducted at 5 N·s−1 until the attainment of the maximum load. Afterwards, it was held constant for 10 s and subsequently unloaded at the same speed. The test was performed 50 µm below the surface and by 10 indents in the parallel form. In order to microstructurally investigate the hardened area, the cross-section was chemically etched by using Adlers etchant’s (45 g Ferric chlorides, 9 g Copper ammonium chloride, 150 mL Hydrochloric acids, and 75 mL distilled water) for 15 s and subsequently was cleaned by immersing the specimen on acetone in an ultrasonic bath for 5 min.
2.2. Statistical Response Surface Methodology
Design of Experiment (DoE) examines the effects of multiple variables on an external variable response. These tests include a series of experiments that purposefully and meaningfully create input or response variables and collect data in each field. Other DoE tests comprise an investigation or a series of experiments that consciously make changes in the input variables of the process to be observed and identified through the number of changes in the output response of the process.
The response procedure is a set of mathematical and statistical techniques that are used for modelling and analyzing problems where the desired response is affected by several variables, and its purpose is to optimize this desired response [22]. In most issues related to the response surface methodology, the relationship between the response and the independent variables is unknown. Therefore, the first step in the response procedure is to find a suitable approximation for the proper relationship between the response and the set of independent variables. Usually, low-order polynomials are used in a range of values of the independent variables. Suppose the response is well modelled by a linear function of the independent variables. In that case, the function approximate for the first order model is in the form of a relationship as shown in Equation (1) as follows:
If there is a curvature in the system, higher order polynomials, such as the second order model, should be modeled by using the following equation:
Almost all answer procedure problems use one or both approximate polynomials. The least squares method estimates the parameters in the approximation of polynomials. After that, the analysis of the response method is performed according to the best determined procedure. If the desired method is roughly equivalent to the analysis, a sufficient approximation to the actual response function, then the elegant method is the analysis of the natural system. For the present study, Table 3 summarizes the independent process parameters with design levels, the three input variables of the DoE employed, their coded values as well as the actual levels (low level: −1, and high level: +1). The minimum and maximum values for the key-parameters are: 80 to 120 mW for the laser power, from 2 to 6 mm/s for the laser scanning speed and from 125 to 145 mm for the focal distance position.
3. Results and Discussion
3.1. Characterization and Experimental Model
Table 4 shows the different sets of experiments conducted along this research after using the DoE by combining the information summarized in Table 3. A total of 17 specimens were investigated and, in this table, the following information is summarized: the HV10, the depth of the microstructural evolution, and the width of the laser track.
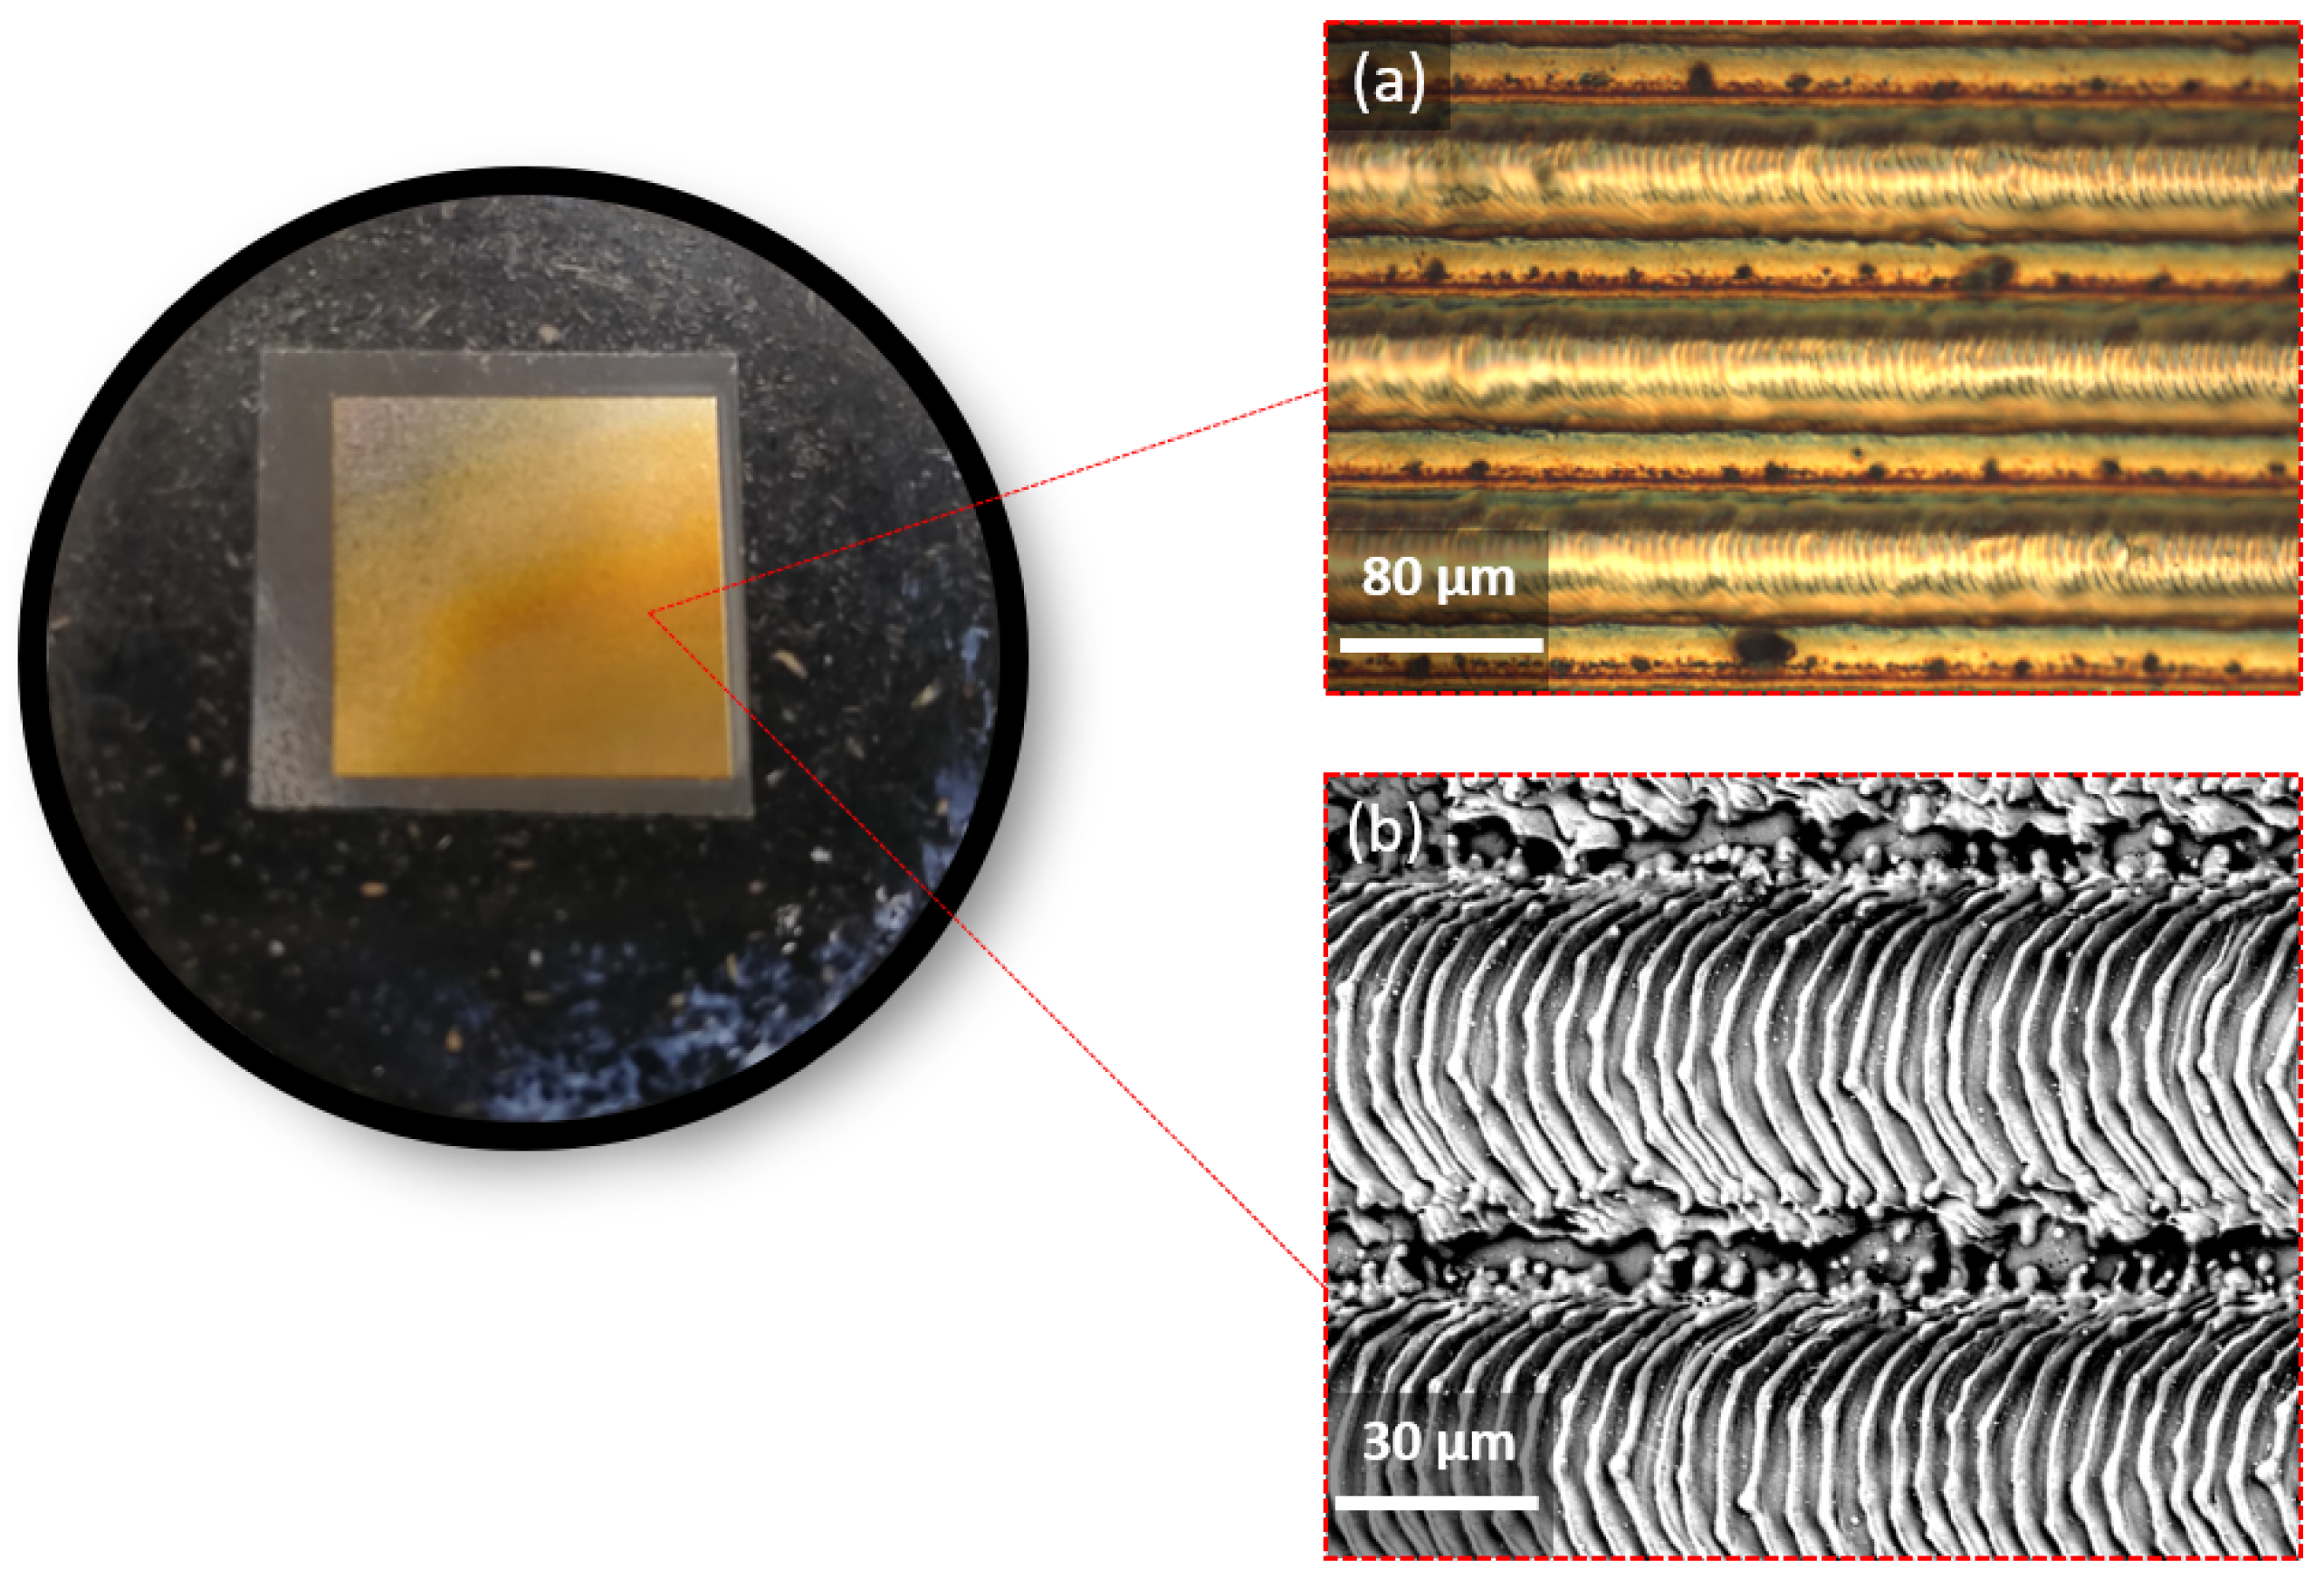
Figure 3 shows the optical microscopy (OM) and the SEM micrographs of the material after being superficially modified.
Figure 4a,b show the low and high magnification phase maps for the cross-section region, respectively, obtained through EBSD to investigate the phase transformation effect.
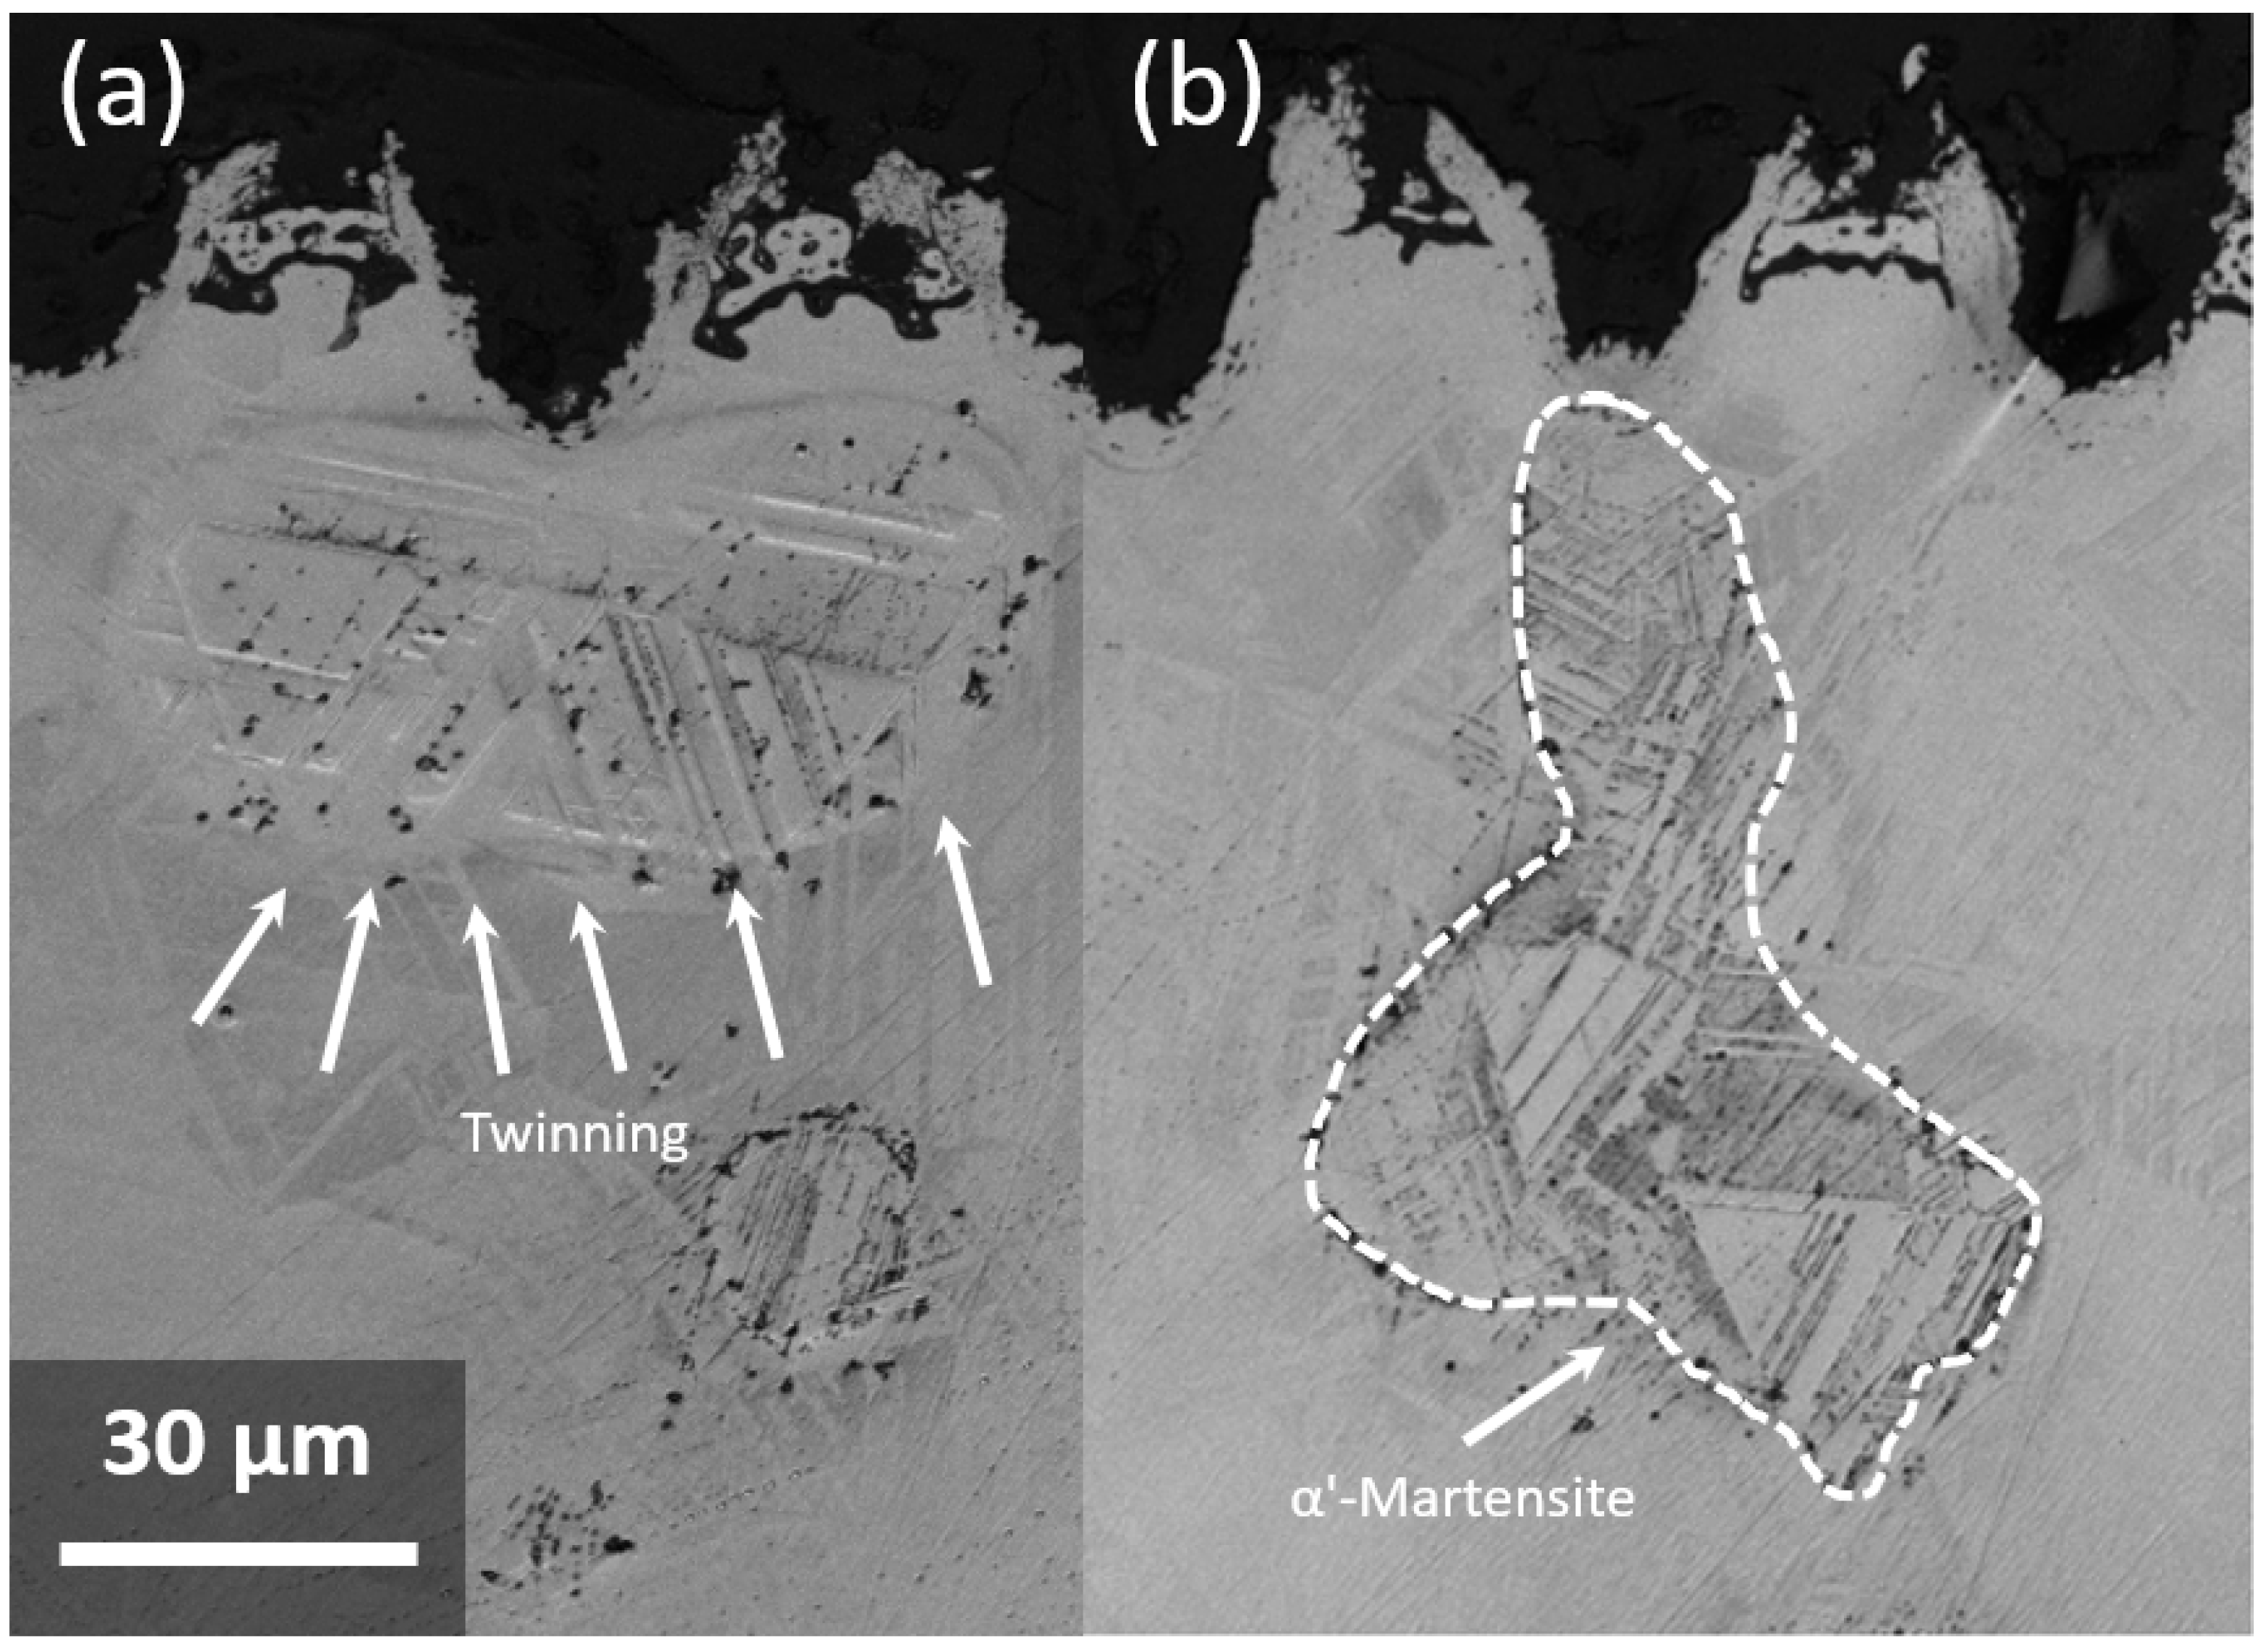
As shown in Figure 4, the α′-martensite is heterogeneously distributed along the entire cross-section. However, two different effects are visible on the region directly affected by the ns-laser on the investigated specimen: (1) γ-grain refinement and, (2) in some regions, slightly higher density of the α′-phase. Figure 5 exhibits the SEM micrographs of the resulting pattern where two different events are visible: (1) a resolidification layer (also known as the hardening layer) with a high density of pores created around the textured pattern and (2) thermal twins at 45° of misorientation created during the texturing and subsequent cooling process.
The induced α′-phase, as well as the plastic deformation induced during the laser-texturing process, have a direct affected on the mechanical integrity, as will be described in the following section [19].
3.2. Superficial Hardness Evolution
The parameter specification, P, is the practical value of 1 in the process, so the parameter is effective whenever its value is less than 0.05. According to the analysis of variance for the maximum hardness values summarized in Table 5, it can be seen that all the key parameters investigated here are effective. It is necessary to highlight that the second-order term is the adequate parameter in terms of the key parameters investigated here. Furthermore, the ineffective parameters of the constitutive model were removed and the constitutive equation was rewritten, as shown in Equation (3). The resulting regression equation is effective, and disproportionality is expressed as an ineffective parameter.
Maximum Hardness (HV10) = 259.038 + 12.438 S + 0.187 P + 0.063 FDP − 3.040 S2 + 3.875 S·P + 6.375 P·FDP
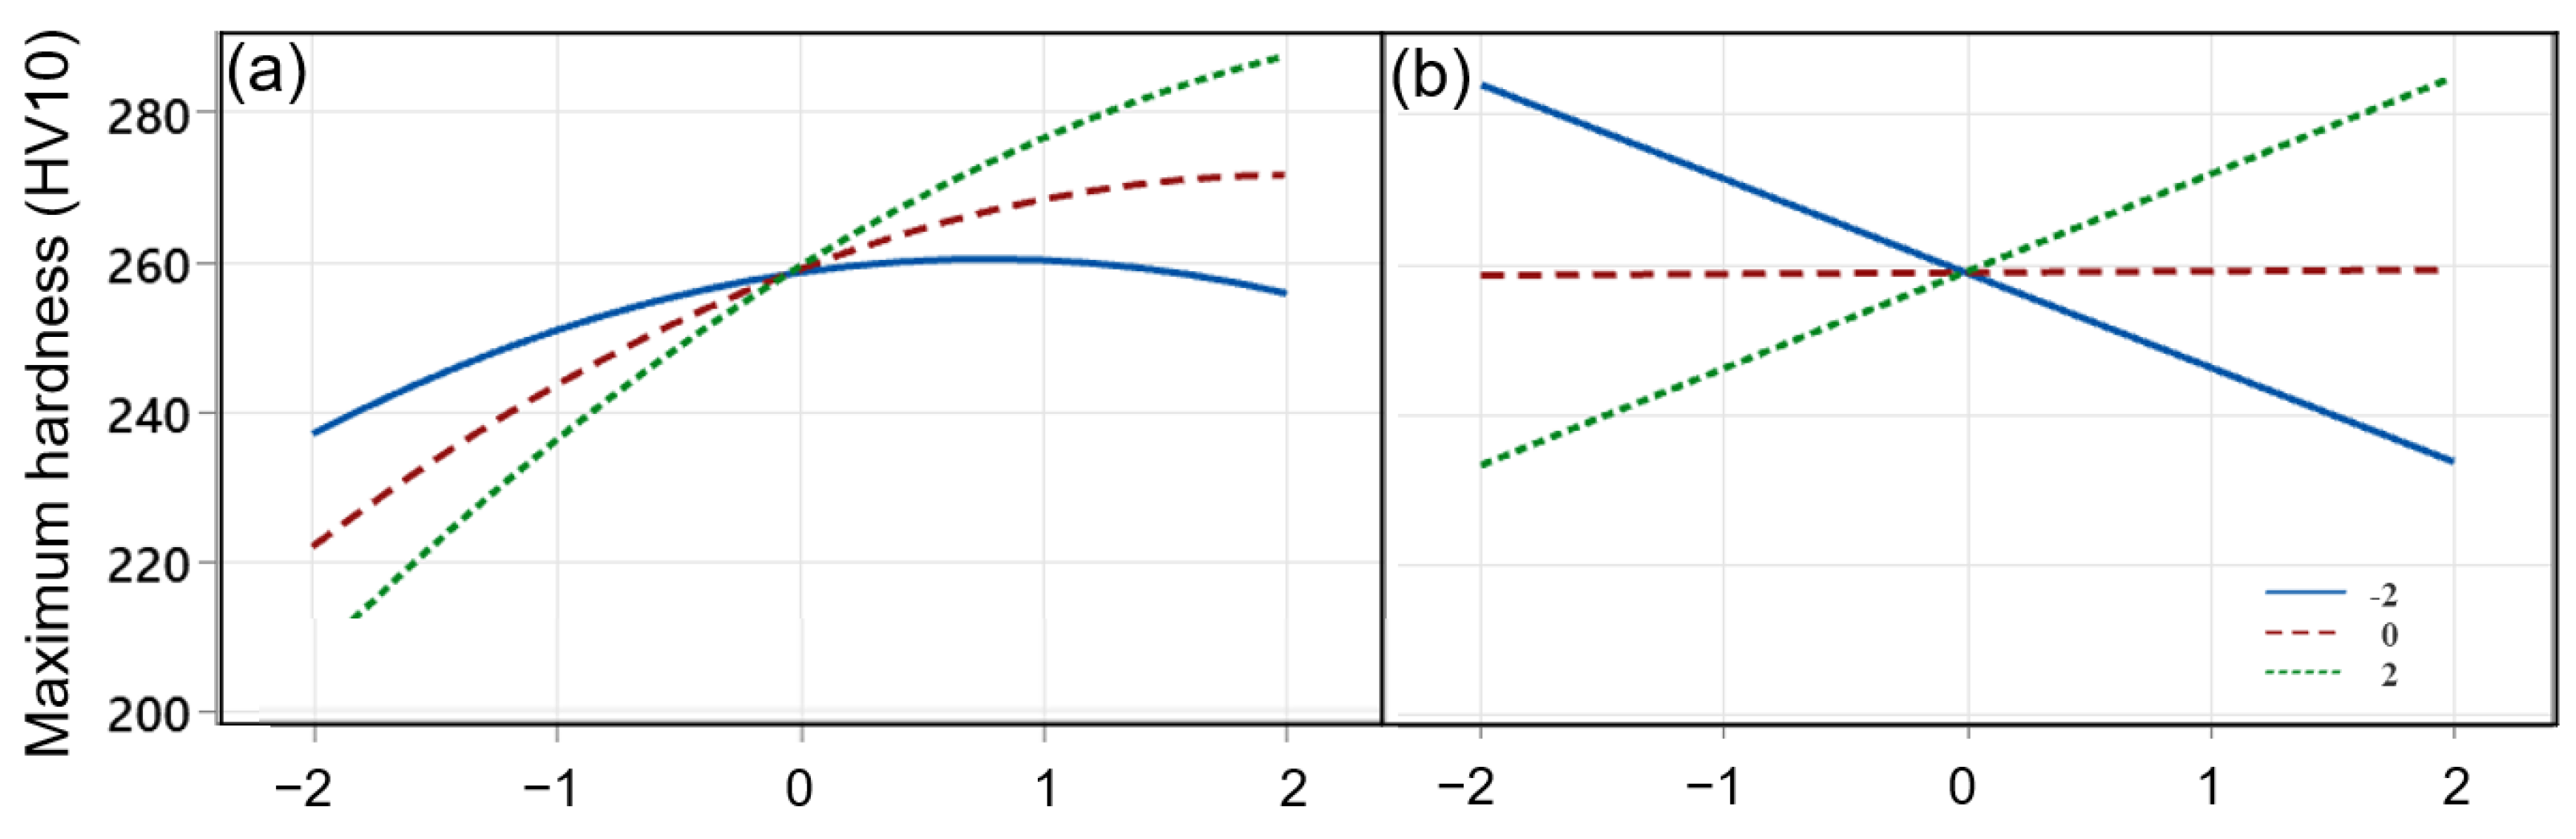
Figure 6 exhibits the evolution of the main parameters investigated here. The x- and y-axis correspond to the input and output parameters of the process, respectively. Fitting the parameters represented in Figure 6 leads to obtain the slope between the input and output. On one hand, when the obtained slope is high, it can be considered adequate. On the other hand, if the slope is below 0.05, the model can be considered as ineffective or as having little effect.
When the effect of one factor depends on another, it is possible to employ the interaction diagrams between the key parameters to show the possible interaction between them, as well as the interaction between the different investigated parameters during the laser texturing. Two different behaviors are appreciated: (1) if the drawn lines cross each other, it indicates the effectiveness of the interaction between the key parameters, and (2) if the drawn lines are parallel, it indicates the ineffectiveness of the interaction between the key parameters.
In relation to the interactions of the maximum Vickers hardness (HV) value with the investigated key parameters (Figure 6), it can be seen from the diagrams that the scanning speed and the laser power present a parabolic relationship as a function of the maximum HV obtained. Meanwhile, the relationship between laser power and the focal distance position changes linearly with the investigated parameter. This trend is due to the low effect of the focal distance position in the product of laser power and focal distance position, which indicates a lower total effect.
2D-contour diagrams (Figure 7) show the relationship between maximum HV, as an independent variable, and the investigated key parameters, as three dependent variables. These diagrams highlight that by increasing the scanning speed and the laser power (Figure 7a), hardness rises, which is in concordance with the surface integrity modification at the surface level induced during the ns-laser texturing. Increasing the scanning speed can prevent the reversion process of martensitic grains to austenite, and increasing the laser power can induce phase transformation from γ- to α′- phase. As depicted in Figure 7b, both processes increase the surface integrity in terms of mechanical properties at the micrometric length scale. By relocating the focal distance to a distant point from the surface, the efficiency of the laser beam is reduced, leading to a diminished manifestation of its effects. Consequently, negligible alterations are observed on the surface of AISI 301LN.
The amount of hardness increase that occurred on the near surface level is directly related to the scanning speed and laser energy, as shown in Figure 8a. Reducing the speed of the laser induces a greater local concentration of thermal energy, and since the percentage of overlapping of each laser spot keeps constant, it can induce an overlapping process in terms of energy concentration and heat at the same point, in concordance with [29,30,31]. Due to all these above-mentioned factors being presented, the thermal reversion treatment takes place at the mentioned point. In this sense, by reducing the laser power by at least a factor of two, the input of the laser energy is around 80 mW, which is not in the threshold range to produce a phase transformation from γ- to α′- phase [32,33,34]. As a direct consequence of this effect, the resulting superficial HV does not increase.
Since the focal distance in level 2 is about 145 mm, this value is considered the best distance for performing surface laser texturing, as shown in Figure 8b. In this representation, it is confirmed that when the focal point and the laser speed are around 2, the surface presents the highest HV value. On the other hand, by modifying the focal level and the laser power to 2 and −2, respectively, the expected HV near the surface cannot be reached as shown in Figure 8c. This effect may be attributed to the amount of incoming heat, which is confined enough near the surface level to induce the α′-phase transformation in agreement with [1,35]. Furthermore, at low laser power and high focal distance position, a larger spot diameter on the surface is created. In this sense, the induced spot presents lower energy density and, as a direct consequence, it induces less of a hardening effect. On the other hand, at the low level, sufficient laser energy is applied to the surface of the investigated sample to induce the martensitic transformation. Therefore, the induced energy is not high enough to melt the surface of the investigated TRIP steel, and the α′-phase reverts to the initial state, this being the austenitic phase which causes a hardening effect at the near-surface level.
Figure 9a shows the change in the laser beam diameter with the laser focal distance position. As expected, increasing the focal length creates a larger laser spot on the surface. By applying the highest laser intensity (level 2), the incoming heat goes deeper into the surface and in a larger diameter. Then, the heat-affected zone becomes larger. Furthermore, the width of the laser-hardened zone was very narrow, even for the high scanning speed with a beam diameter of 0.296 mm, which may be beneficial to enhance the hardness at the superficial level, since the width of the hardened zone is the main factor responsible for increasing the static tensile strength [36]. Despite very high cooling rates produced at higher laser intensity, the hardness at the surface level increases only slightly. This property does not change significantly if the spot size is smaller. Furthermore, due to the low carbon content present in 301LN (see Table 1), the maximum HV was significantly higher than the critical hardness value. Moreover, in the case of faster scanning speeds and higher laser intensity, the HV value reached a maximum threshold of around 272 HV10.
The pulse coverage and the laser scanning speed present an indirect relationship in a linear way, as depicted in Figure 9b. By increasing the laser scanning speed, the laser spots cover a wide region and change the superficial microstructure of the steel. Reducing the coverage of the laser spots can prevent excessive heat concentrated at the superficial level, which prevents the reversion process from occurring. By increasing the laser speed, the coverage of the laser spots decreases significantly, but on the other hand, this effect increases the quenching rate. Both modifications have a direct relationship by changing the microstructure at the superficial level and therefore the surface integrity in terms of HV.
3.3. Hardening Evolution Induced by Laser Texturing
Table 6 shows the analysis of the variance of the modified model as a function of the affected depth of the resulting ns-laser texturing. The impact of the ns-laser on the investigated TRIP steel’s microstructure in depth is widely acknowledged. This, in turn, directly leads to induced phase transformation from γ-phase to α′-phase, which subsequently influences the surface’s mechanical properties and integrity.
The observed trend indicates that as the scanning speed is heightened, the induced microstructural alterations during laser texturing lead to a substantial decrease in the depth of the microstructural evolution. Within this consideration, the interaction time of the laser with the surface of the hardened area increases and this surface is exposed to a higher temperature. Consequently, the interaction depth of the hardened layer increases due to the temperature reaching the threshold to induce the phase transformation, from γ- to α′-phase.
According to the analysis, the resulting equation to predict the depth of the microstructural evolution can be described as follows:
Depth of the microstructural evolution = 692.94 + 88.75 S − 25.00 S·P
Furthermore, the HV does not change by decreasing the position of the focal distance. What is clear from this representation is that the depth of the microstructural evolution zone has a direct relationship with the laser power. In this sense, due to the part being exposed to the HAZ region and the surface absorbing more energy, the affected depth in terms of microstructure increases and, as a direct consequence, the HV, due to this region presenting a huge density of defects in terms of plastic deformation mechanisms, in terms of dislocation, and also a huge amount of α′-phase induced due to the thermal stress as shown in Figure 10.
By increasing the scanning speed of the ns-laser, the surface of the workpiece is exposed to a lower temperature, and the maximum depth value of about 860 µm is obtained. When the interaction time of the ns-laser with the surface of the workpiece decreases and the laser power drops sharply, less thermal energy approaches the surface of the investigated sample.
It is clear that the depth of the microstructural evolution area increases by decreasing both the laser scanning speed and the position of the focal distance, but this value is not of note due to the interaction region being several micrometers. This effect occurs because as the position of the focal distance decreases, the distance from the workpiece to the energy focus area decreases and the laser energy irradiated to the γ-phase steel surface increases. As a result, this factor contributes to an augmented depth of the microstructural evolution. Additionally, decreasing the laser scanning speed leads to an extended interaction time between the laser and the workpiece. As a result, more energy is absorbed by the surface to be textured, increasing the depth of the microstructural evolution-induced layer (Figure 11a). Regarding the effect of the laser power on the interaction depth in terms of the HV, it is very logical that with the increase in laser power, the depth of the affected zone just below the textured region significantly increases, producing a microstructural change on TRIP steels (by inducing higher density of α′-phase and/or more amount of plastic deformation defects as thermal twins and/or forest dislocations). Figure 11b precisely anticipates these values prior to performing the experimental texturing tests. This, in turn, enables an assessment of mechanical integrity within the impacted depth.
3.4. Width of the Laser Track
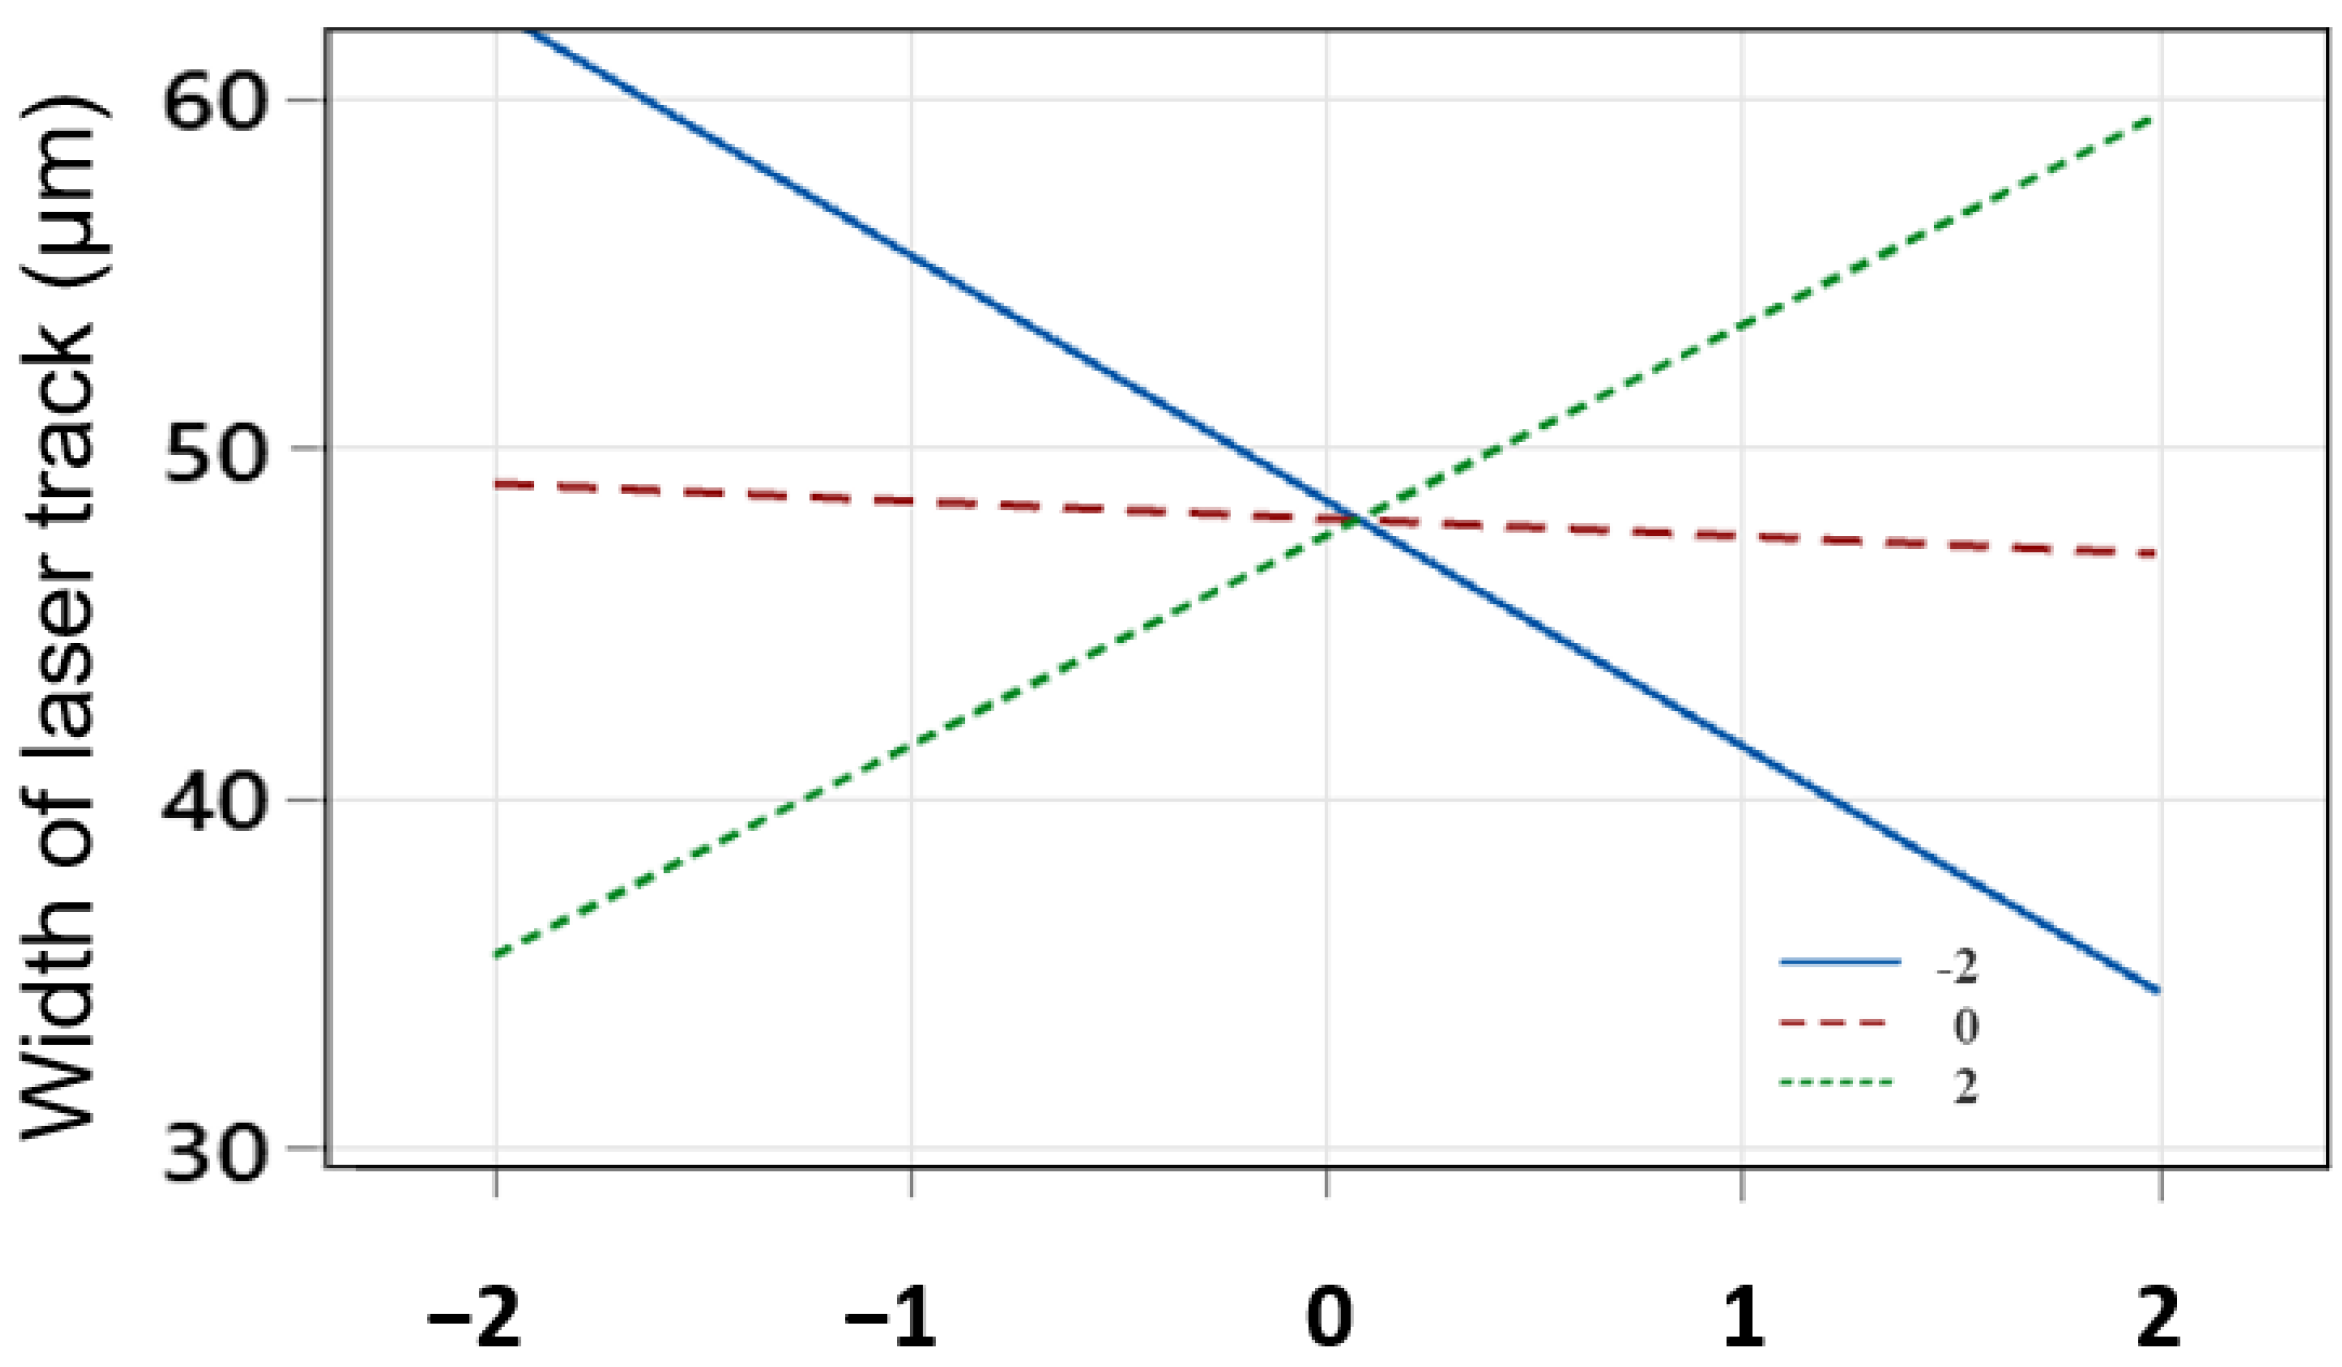
The width of the hardened layer induces during the laser texturing process is of great importance because the width of the laser will determine the coverage rate of the laser beam on the surface of the material. According to the variance analysis of hardened path width, Table 7, the effective parameters exhibit a linear progression in relation to both scan speed and laser power. Simultaneously, the interplay between laser power and laser focal point exerts a notable influence on the width of the laser-induced crack.
Figure 12 depicts the graphical illustration of the laser track width concerning the variables of laser power and focal length. In this context, the peak value, in relation to the analyzed parameters, is achieved when both factors synergistically align at the central point (designated as level 0). According to the diagram (Figure 12), the maximum width of the laser track is obtained at the highest laser power value and the lowest laser scanning speed, which is about 65 µm.
Based on the statistical analysis, the regression equation is presented in terms of the values of the coded and real variables, summarized as follows:
Width of laser track (μm) = 48.000 + 7.500 S − 0.500 P − 0.250 FDP+ 3.250 P × FDP
Increasing the laser power gives the laser beam the ability to create big grooves in the surface at low scanning speeds because the laser power density increases cumulatively, and the concentration of incoming heat in one point increases. On the other hand, as the nozzle head approaches the surface of the sample up to 145 μm, the waist of the laser beam (The beam waist is the point in the propagation direction where the laser beam diameter converges to a minimum) increases and makes a bigger spot on the surface, which increases the width of the laser track.
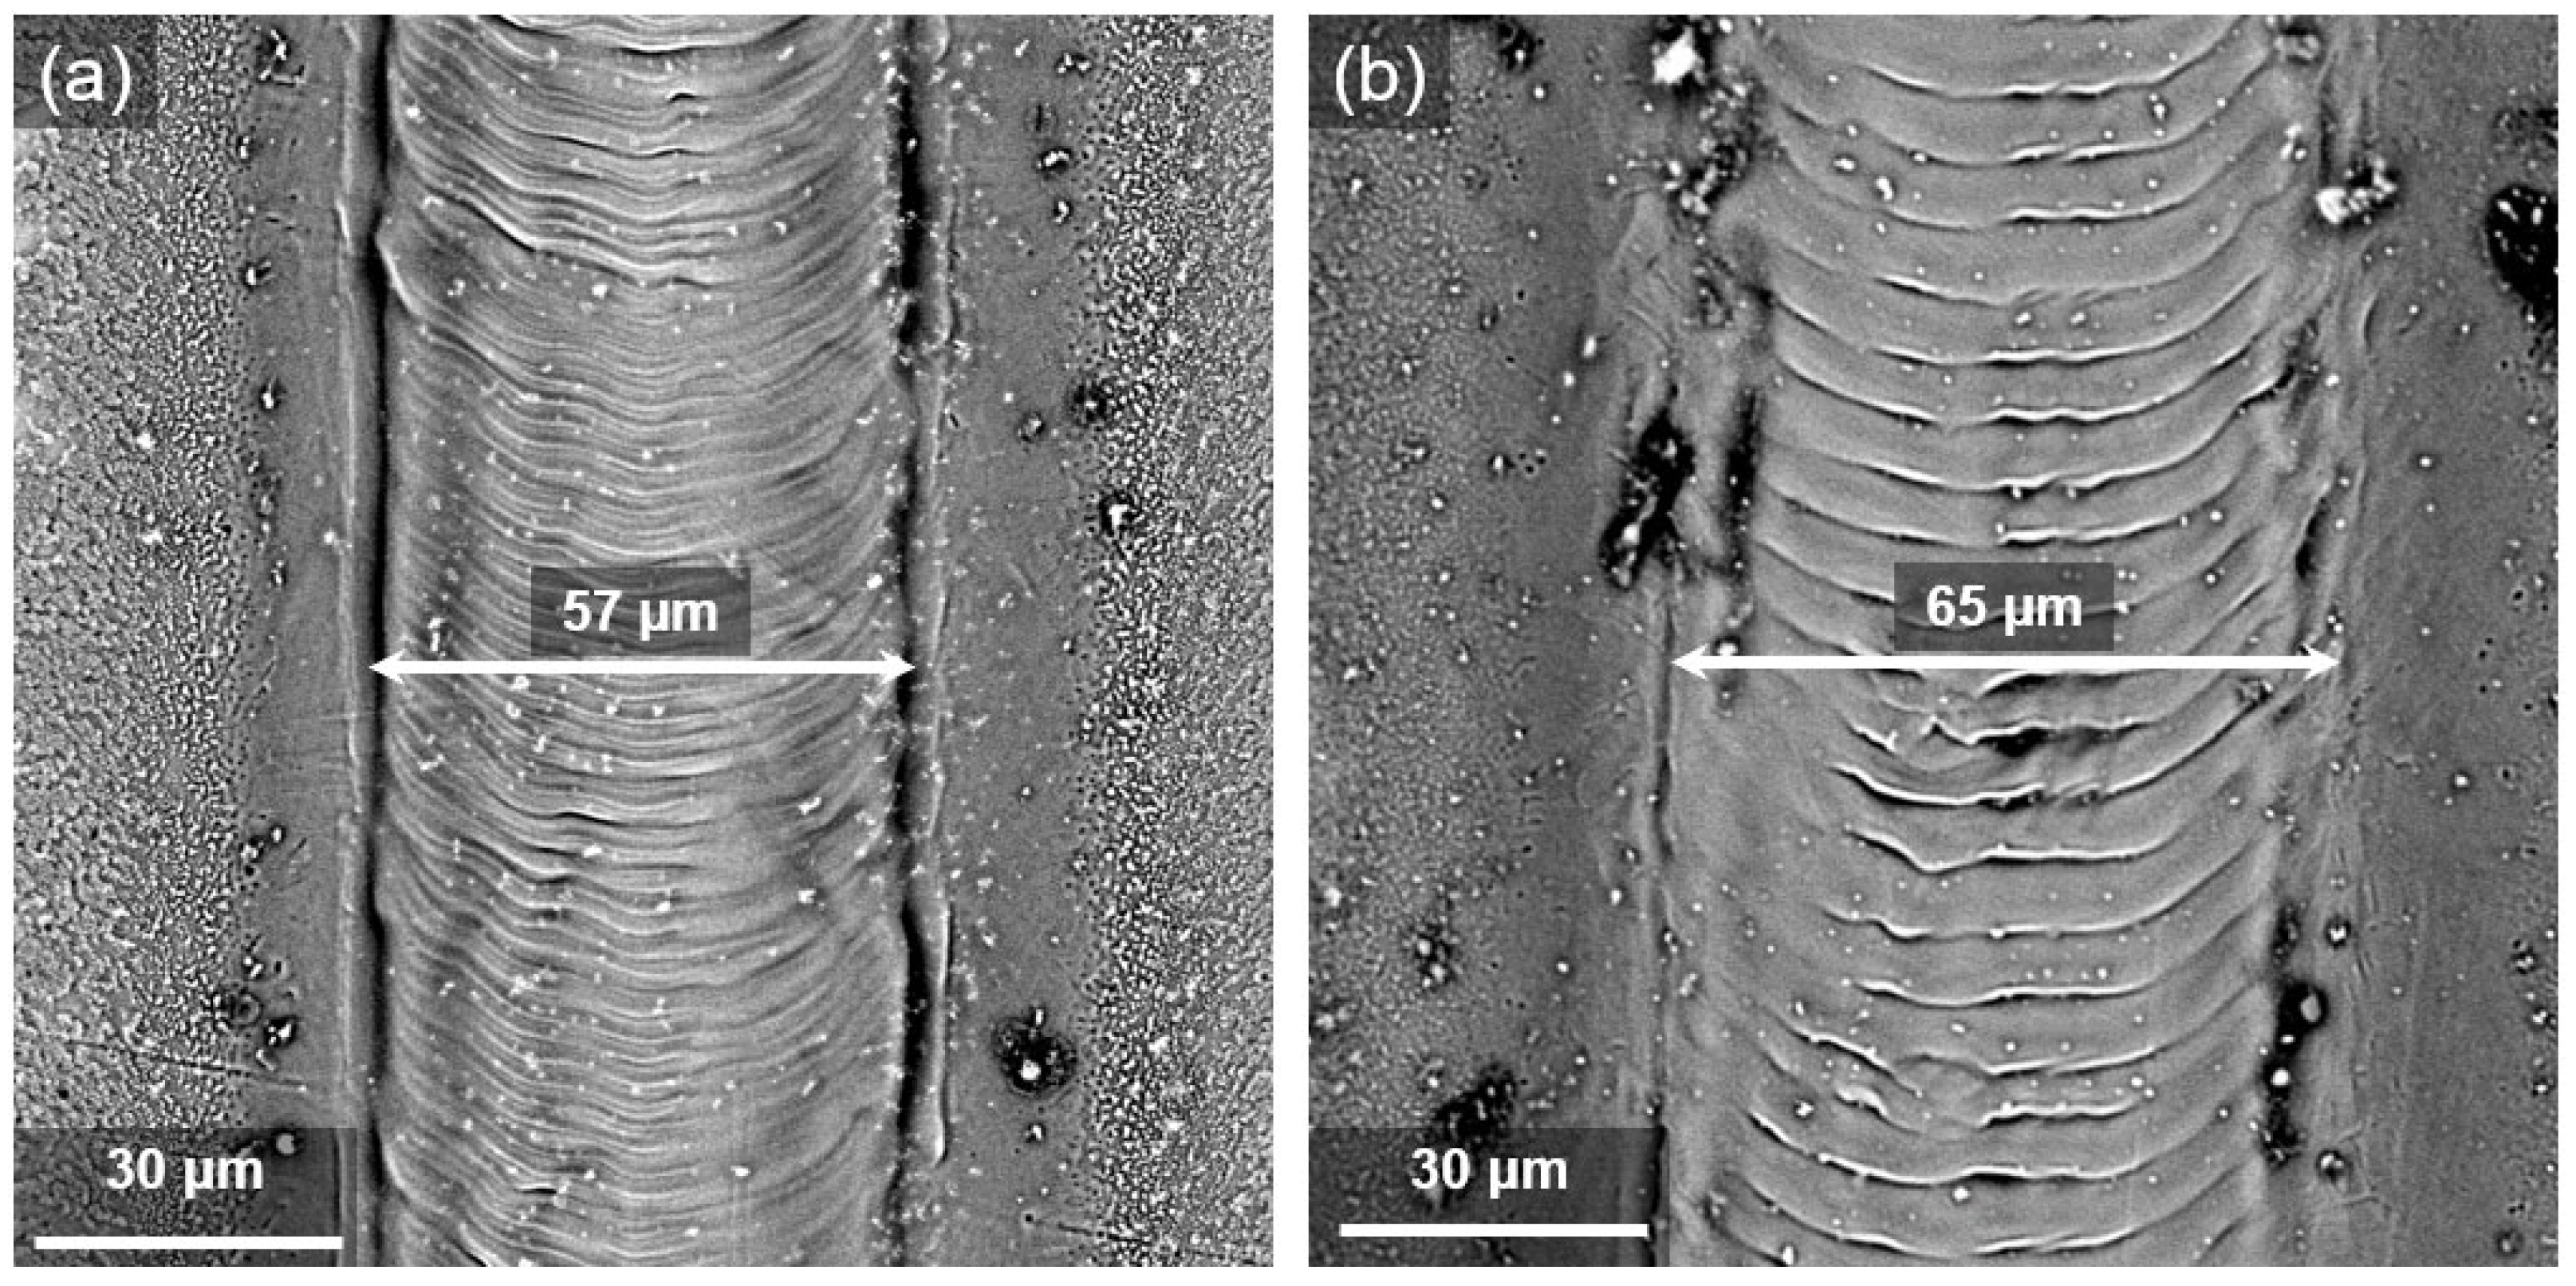
By increasing the focal distance position and laser power to level 2, it can be seen that the width of the laser track increases (Figure 13). By increasing the focal distance position to maximum (level 2) from the surface of the investigated sample, the diameter of the laser beam spots changes, and they become bigger. On the other hand, by increasing the laser power at the same time, the thermal concentration and density of laser thermal energy in this spot increases noticeably, and the incoming heat reaches the surface of the sample sufficiently and melts it as shown in Figure 14. The biggest speckle effect that can be created is in the mode where there is more focal distance position and laser power.
4. Conclusions
The effect of the ns-laser treatment on the surface properties of AISI 301LN steels was investigated and the following conclusions can be drawn:
- By increasing the laser power and decreasing the scanning speed and the focal distance position, due to the increase in the laser energy, the heat input to the surface of the workpiece rises and the phase transformation happens faster. Then, more α′-martensite is present near the surface. As a result, the hardness and depth of the microstructural evolution area increase due to the area near the surface being slightly modified by increasing the among of defects.
- The depth of the microstructural evolution has a direct relationship with laser power, and with increasing it, a larger part of the substrate undergoes the α′-phase transformation because the accumulation of laser energy is concentrated in one point. Thus, the hardened depth reaches about 860 µm.
- As the power of the laser increases, due to the accumulation of heat input, a wider laser track is created. Increasing the focal distance of the laser causes the diameter of the laser spot on the surface to become larger, and in this case, increasing the laser energy causes enough heat to melt the surface. As a result, the width of the laser increases and reaches 65 µm in the maximum state.
- The influence of the laser power parameter on the maximum hardness, depth and width, is more significant than the parameters of focal distance position and scanning speed, due to the application of more concentrated energy on the surface.
- Considering the percentage coverage of the parameters obtained by the regression equation and the correspondence of the regression equation and analysis of variance with the remaining graphs, experimental modelling with the response surface method is a suitable model for investigating the effects of steel surface hardening with cost and time-saving.
Author Contributions
Conceptualization, M.R.; Validation, J.J.R.; Investigation, M.R.; Writing—original draft, M.R.; Writing—review and& editing, J.J.R. and A.M.; Supervision, J.J.R. and A.M.; Project administration, A.M. All authors have read and agreed to the published version of the manuscript.
Funding
This research was funded by AGAUR, Agency for Administration of University and Research (Agència de Gestió d’Ajuts Universitaris i de Recerca), grant number FI-SDUR 2020.
Data Availability Statement
Data is available in the request.
Acknowledgments
The authors would like to express their special gratitude to the Center for Structural Integrity, Micromechanics, and Reliability of Materials (CIEFMA), Department of Materials Science and Engineering, for their technical support. M. Rezayat acknowledges the AGAUR (FI-SDUR-2020) of the Generalitat de Catalunya for its financial support.
Conflicts of Interest
The authors have no conflict of interest to declare. All co-authors have seen and agree with the contents of the manuscript, and there is no financial interest to report. We certify that the submission is original work and is not under review at any other publication.
Appendix A
In each pulse, the laser beam engraves a spot on the surface of the sample, which creates an overlap area with the previous spot. In this study, the overlap area of each laser pulse, which is known as Pulse Overlapping (PO) and determined as follows [37]:
where is the scanning speed, the circular focus diameter and the repetition rate.
The diameter of the laser beam is constantly changing along its optical path until it hits the sample surface (Figure A1). Considering the ideal state for the laser beam, the beam radius (W) along the z-axis can be calculated with the following formula:
where W0 is the beam waist (the smallest radius of the Gaussian beam), a Gaussian beam with a lens of focal length (f). The beam diameter is simply twice the beam radius and can be measured anywhere along the propagation axis.
Figure A1.
Schematic representation of the Laser Beam diameter and focal position.
References
- Rezayat, M.; Roa, J.J.; Mateo, A. Phase Transformation and Residual Stresses after Laser Surface Modification of Metastable Austenitic Stainless Steel. Proc. AIP Conf. Proc. 2023, 2848, 020005. [Google Scholar]
- Sobih, M. Laser-Based Machining—An Advanced Manufacturing Technique for Precision Cutting. In Advanced Machining and Finishing; Elsevier: Amsterdam, The Netherlands, 2021; pp. 417–450. [Google Scholar] [CrossRef]
- Kumar, V.; Verma, R.; Kango, S.; Sharma, V.S. Recent Progresses and Applications in Laser-Based Surface Texturing Systems. Mater. Today Commun. 2021, 26, 101736. [Google Scholar] [CrossRef]
- Stankevič, V.; Čermák, A.; Mikalauskas, S.; Kožmín, P.; Indrišiūnas, S.; Račiukaitis, G. Processing of Ultra-Hard Materials with Picosecond Pulses: From Research Work to Industrial Applications. J. Laser Appl. 2018, 30, 32202. [Google Scholar] [CrossRef]
- Murzin, S.P.; Kazanskiy, N.L.; Stiglbrunner, C. Analysis of the Advantages of Laser Processing of Aerospace Materials Using Diffractive Optics. Metals 2021, 11, 963. [Google Scholar] [CrossRef]
- He, Y.; Xie, H.; Ge, Y.; Lin, Y.; Yao, Z.; Wang, B.; Jin, M.; Liu, J.; Chen, X.; Sun, Y. Laser Cutting Technologies and Corresponding Pollution Control Strategy. Processes 2022, 10, 732. [Google Scholar] [CrossRef]
- Mao, K.S.; Sun, C.; Liu, X.; Qu, H.J.; French, A.J.; Freyer, P.D.; Garner, F.A.; Shao, L.; Wharry, J.P. Effect of Laser Welding on Deformation Mechanisms in Irradiated Austenitic Stainless Steel. J. Nucl. Mater. 2020, 528, 151878. [Google Scholar] [CrossRef]
- Mansur, V.M.; de Figueiredo Mansur, R.A.; de Carvalho, S.M.; de Siqueira, R.H.M.; de Lima, M.S.F. Effect of Laser Welding on Microstructure and Mechanical Behaviour of Dual Phase 600 Steel Sheets. Heliyon 2021, 7, e08601. [Google Scholar] [CrossRef]
- Wickramasinghe, S.; Do, T.; Tran, P. FDM-Based 3D Printing of Polymer and Associated Composite: A Review on Mechanical Properties, Defects and Treatments. Polymers 2020, 12, 1529. [Google Scholar] [CrossRef]
- Moradi, M.; Karamimoghadam, M.; Meiabadi, S.; Casalino, G.; Ghaleeh, M.; Baby, B.; Ganapathi, H.; Jose, J.; Abdulla, M.S.; Tallon, P.; et al. Mathematical Modelling of Fused Deposition Modeling (FDM) 3D Printing of Poly Vinyl Alcohol Parts through Statistical Design of Experiments Approach. Mathematics 2023, 11, 3022. [Google Scholar] [CrossRef]
- Rezayat, M.; Aboutorabi Sani, A.; Talafi Noghani, M.; Saghafi Yazdi, M.; Taheri, M.; Moghanian, A.; Mohammadi, M.A.; Moradi, M.; Mateo, A.; Besharatloo, H. Effect of Lateral Laser-Cladding Process on the Corrosion Performance of Inconel 625. Metals 2023, 13, 367. [Google Scholar] [CrossRef]
- Rezayat, M.; Moradi, M.; Mateo, A. Nanosecond Pulsed Laser Surface Processing of AISI 301LN Steel: Effect on Surface Topography and Mechanical Properties. Int. J. Adv. Manuf. Technol. 2023, 128, 3025–3040. [Google Scholar] [CrossRef]
- Daido, H.; Nishiuchi, M.; Pirozhkov, A.S. Review of Laser-Driven Ion Sources and Their Applications. Rep. Prog. Phys. 2012, 75, 056401. [Google Scholar] [CrossRef]
- Bensalem, K.; Barka, N.; Sattarpanah Karganroudi, S.; Sadeghian, A.; Mouradi, M. Effects of Laser Process Parameters on the Hardness Profile of AISI 4340 Cylindrical Samples: Statistical and Experimental Analyses. Int. J. Adv. Manuf. Technol. 2022, 122, 2849–2867. [Google Scholar] [CrossRef]
- Babu, P.D.; Balasubramanian, K.R.; Buvanashekaran, G. Laser Surface Hardening: A Review. Int. J. Surf. Sci. Eng. 2011, 5, 131. [Google Scholar] [CrossRef]
- Jerniti, A.G.; El Ouafi, A.; Barka, N. Single Track Laser Surface Hardening Model for AISI 4340 Steel Using the Finite Element Method. Model. Numer. Simul. Mater. Sci. 2016, 6, 17–27. [Google Scholar] [CrossRef]
- Liverani, E.; Fortunato, A.; Ascari, A.; Sorgente, D.; Scintilla, L.D.; Palumbo, G. A Thermal Model for Laser Hardening Simulation. Volume 1: Processing. In Proceedings of the ASME 2015 International Manufacturing Science and Engineering Conference, Charlotte, NC, USA, 8–12 June 2015. [Google Scholar] [CrossRef]
- Alsaddah, M.; Khan, A.; Groom, K.; Mumtaz, K. Use of 450-808 Nm Diode Lasers for Efficient Energy Absorption during Powder Bed Fusion of Ti6Al4V. Int. J. Adv. Manuf. Technol. 2021, 113, 2461–2480. [Google Scholar] [CrossRef]
- Rezayat, M.; Karamimoghadam, M.; Moradi, M.; Casalino, G.; Roa Rovira, J.J.; Mateo, A. Overview of Surface Modification Strategies for Improving the Properties of Metastable Austenitic Stainless Steels. Metals 2023, 13, 1268. [Google Scholar] [CrossRef]
- Mutua, J.; Nakata, S.; Onda, T.; Chen, Z.-C. Optimization of Selective Laser Melting Parameters and Influence of Post Heat Treatment on Microstructure and Mechanical Properties of Maraging Steel. Mater. Des. 2018, 139, 486–497. [Google Scholar] [CrossRef]
- Hegazy, D.; Tag, R.; Habib, B.A. Statistical Sequential Experimentation: Preliminary Mixed Factorial Design, I-Optimal Mixture Design Then Finally Novel Design Space Expansion for Optimization of Tazarotene Cubosomes. Int. J. Nanomed. 2022, 17, 1069–1086. [Google Scholar] [CrossRef]
- Rezayat, M.; Karamimoghadam, M.; Yazdi, M.S.; Moradi, M.; Bodaghi, M. Statistical Analysis of Experimental Factors for Synthesis of Copper Oxide and Tin Oxide for Antibacterial Applications. Int. J. Adv. Manuf. Technol. 2023, 127, 3017–3030. [Google Scholar] [CrossRef]
- Stigler, S.M. Mathematical Statistics in the Early States. Ann. Stat. 1978, 6, 239–265. [Google Scholar] [CrossRef]
- Hacking, I. Telepathy: Origins of Randomization in Experimental Design. Isis 1988, 79, 427–451. [Google Scholar] [CrossRef]
- Gaffke, N.; Heiligers, B. 30 Approximate Designs for Polynomial Regression: Invariance, Admissibility, and Optimality. In Handbook of Statistics; Elsevier: Amsterdam, The Netherlands, 1996; pp. 1149–1199. [Google Scholar] [CrossRef]
- Wang, C.; Li, J.; Wang, T.; Chai, L.; Deng, C.; Wang, Y.; Huang, Y. Microstructure and Properties of Pure Titanium Coating on Ti-6Al-4V Alloy by Laser Cladding. Surf. Coat. Technol. 2021, 416, 127137. [Google Scholar] [CrossRef]
- Dai, J.; Xia, J.; Chai, L.; Murty, K.L.; Guo, N.; Daymond, M.R. Correlation of Microstructural, Textural Characteristics and Hardness of Ti–6Al–4V Sheet β-Cooled at Different Rates. J. Mater. Sci. 2020, 55, 8346–8362. [Google Scholar] [CrossRef]
- Chen, L.-Y.; Xu, T.; Wang, H.; Sang, P.; Lu, S.; Wang, Z.-X.; Chen, S.; Zhang, L.-C. Phase Interaction Induced Texture in a Plasma Sprayed-Remelted NiCrBSi Coating during Solidification: An Electron Backscatter Diffraction Study. Surf. Coat. Technol. 2019, 358, 467–480. [Google Scholar] [CrossRef]
- Ma, Z.; Hanson, T.E.; Ho, Y. Flexible Bivariate Correlated Count Data Regression. Stat. Med. 2020, 39, 3476–3490. [Google Scholar] [CrossRef]
- Omi, T.; Numano, K. The Role of the CO2 Laser and Fractional CO2 Laser in Dermatology. Laser Ther. 2014, 23, 49–60. [Google Scholar] [CrossRef]
- Singh, S.C.; Guo, C. Femtosecond Laser-produced Optical Absorbers for Solar-thermal Energy Harvesting. EcoMat 2021, 4, e12161. [Google Scholar] [CrossRef]
- Ren, Q.; Chen, C.; Lu, Z.; Wang, X.; Lu, H.; Yin, S.; Liu, Y.; Li, H.; Wang, J.; Ren, Z. Effect of a Constant Laser Energy Density on the Evolution of Microstructure and Mechanical Properties of NiTi Shape Memory Alloy Fabricated by Laser Powder Bed Fusion. Opt. Laser Technol. 2022, 152, 108182. [Google Scholar] [CrossRef]
- Wang, X.; Jiang, J.; Xia, C.; Yu, Y. Macroscopic and Microstructural Features of Metal Thin-Wall Fabricated by Laser Material Deposition: A Review. Coatings 2022, 12, 1104. [Google Scholar] [CrossRef]
- Wang, X.; Jiang, J.; Tian, Y. A Review on Macroscopic and Microstructural Features of Metallic Coating Created by Pulsed Laser Material Deposition. Micromachines 2022, 13, 659. [Google Scholar] [CrossRef] [PubMed]
- Bolgár, M.K.; Nagy, E.; Daróczi, L.; Benke, M.; Mertinger, V.; Beke, D.L. Acoustic Emission During Austenite → ε Martensitic Phase Transformation in TWIP/TRIP Steels. Metall. Mater. Trans. A 2019, 50, 3495–3501. [Google Scholar] [CrossRef]
- Lu, J.Z.; Luo, K.Y.; Yang, D.K.; Cheng, X.N.; Hu, J.L.; Dai, F.Z.; Qi, H.; Zhang, L.; Zhong, J.S.; Wang, Q.W.; et al. Effects of Laser Peening on Stress Corrosion Cracking (SCC) of ANSI 304 Austenitic Stainless Steel. Corros. Sci. 2012, 60, 145–152. [Google Scholar] [CrossRef]
- Schnell, G.; Duenow, U.; Seitz, H. Effect of Laser Pulse Overlap and Scanning Line Overlap on Femtosecond Laser-Structured Ti6Al4V Surfaces. Materials 2020, 13, 969. [Google Scholar] [CrossRef]
Figure 1.
Schematic representation of the laser hardening effect in nanosecond (ns-) pulse laser.
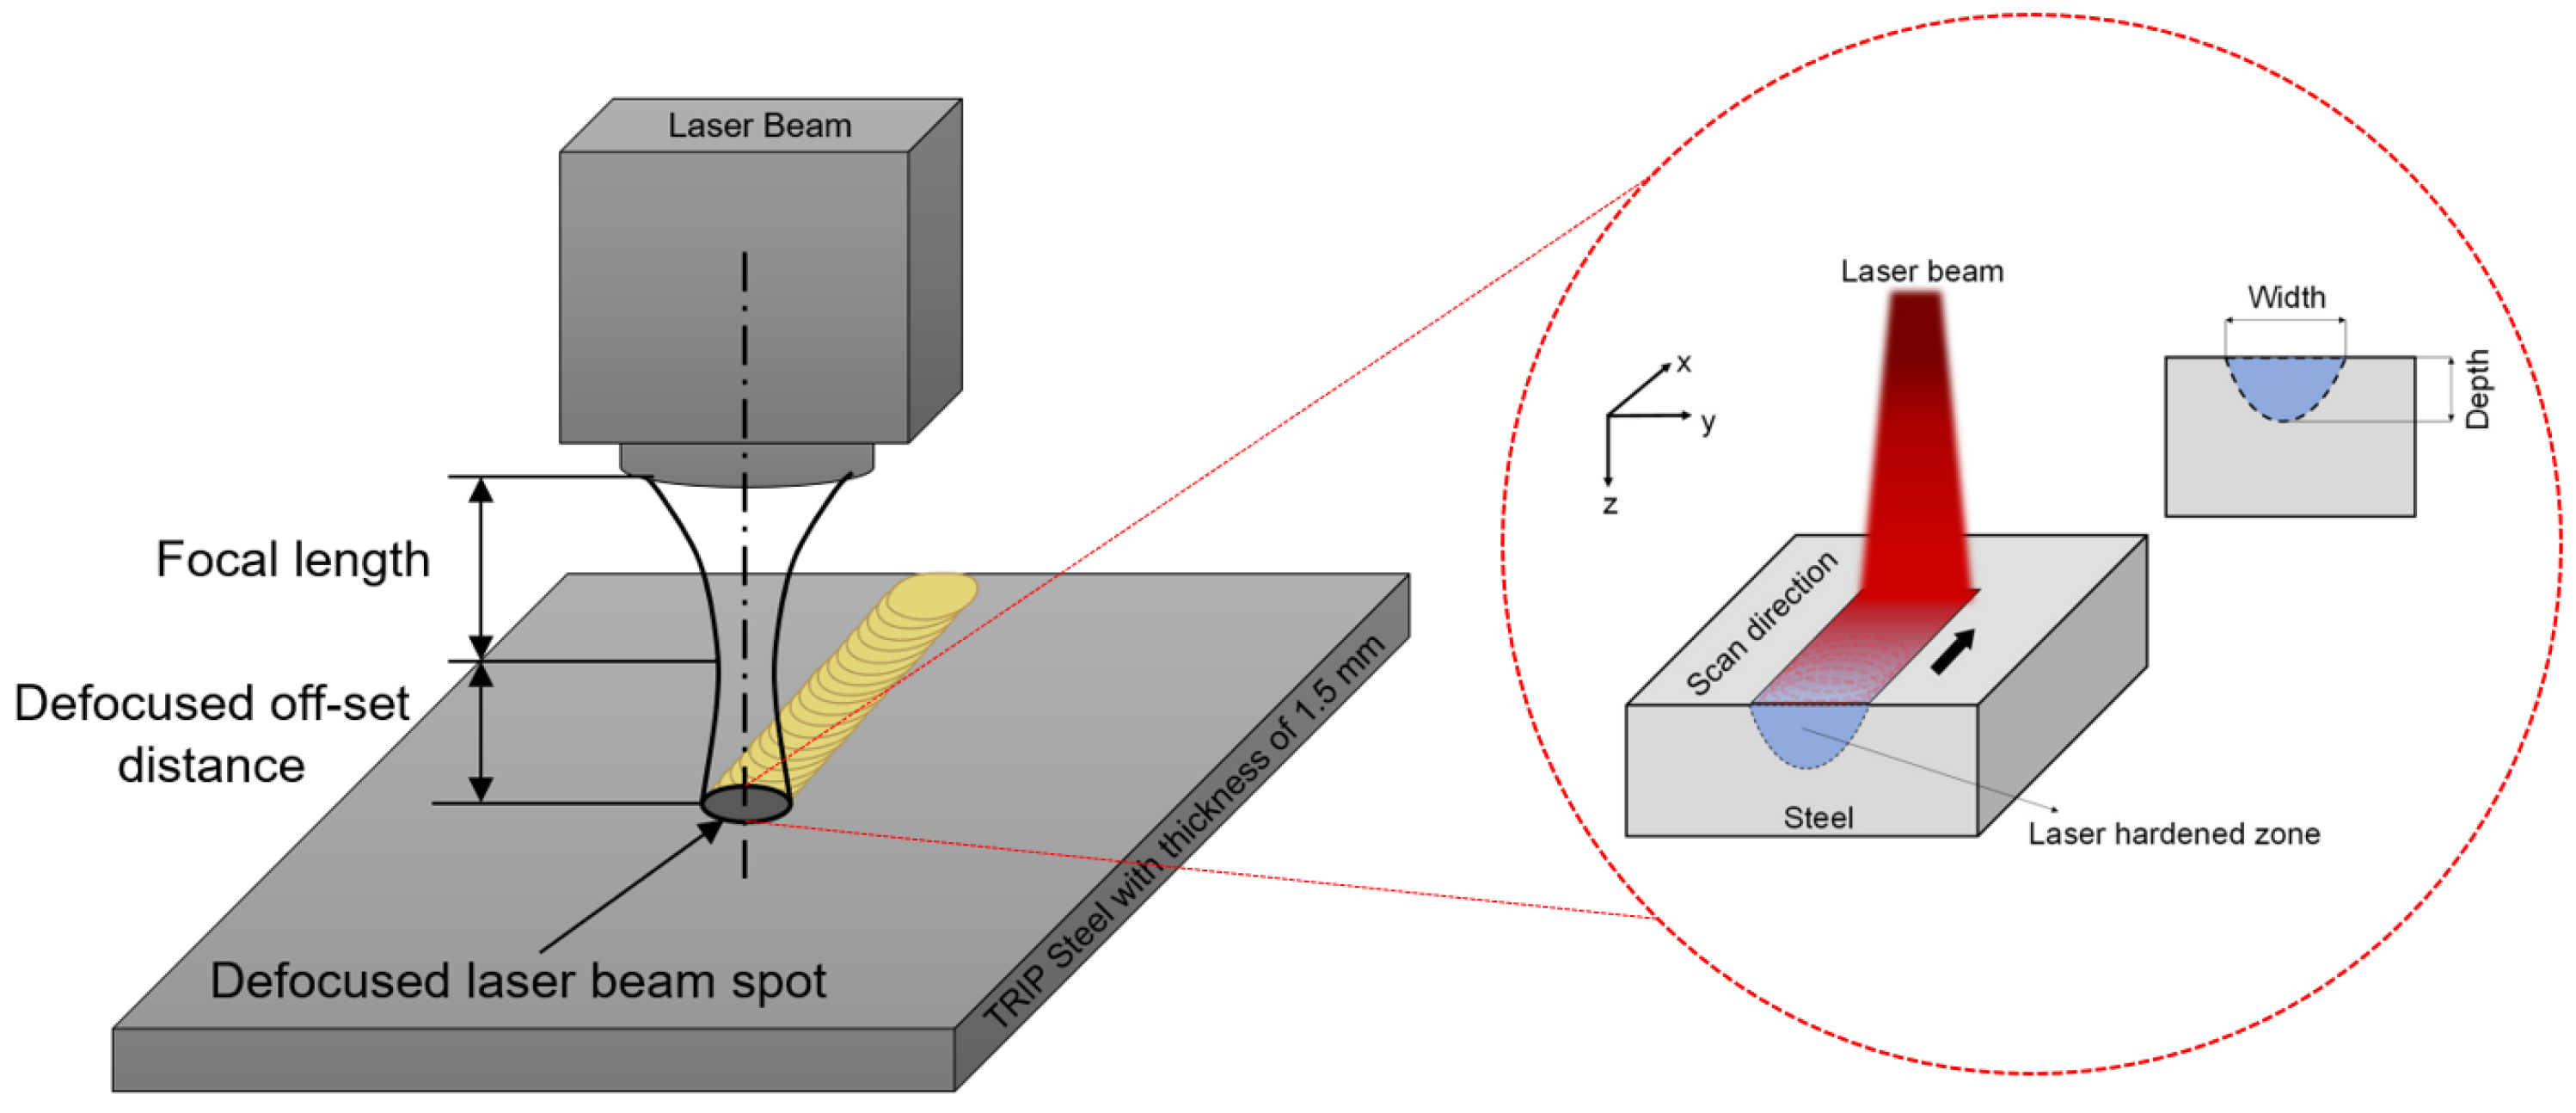
Figure 2.
Schematic representation of the position of the workpiece regarding the location of the laser beam nozzle and the process conducted by using a ns-laser. Furthermore, the main characteristic parameters are presented in this representation.
Figure 2.
Schematic representation of the position of the workpiece regarding the location of the laser beam nozzle and the process conducted by using a ns-laser. Furthermore, the main characteristic parameters are presented in this representation.
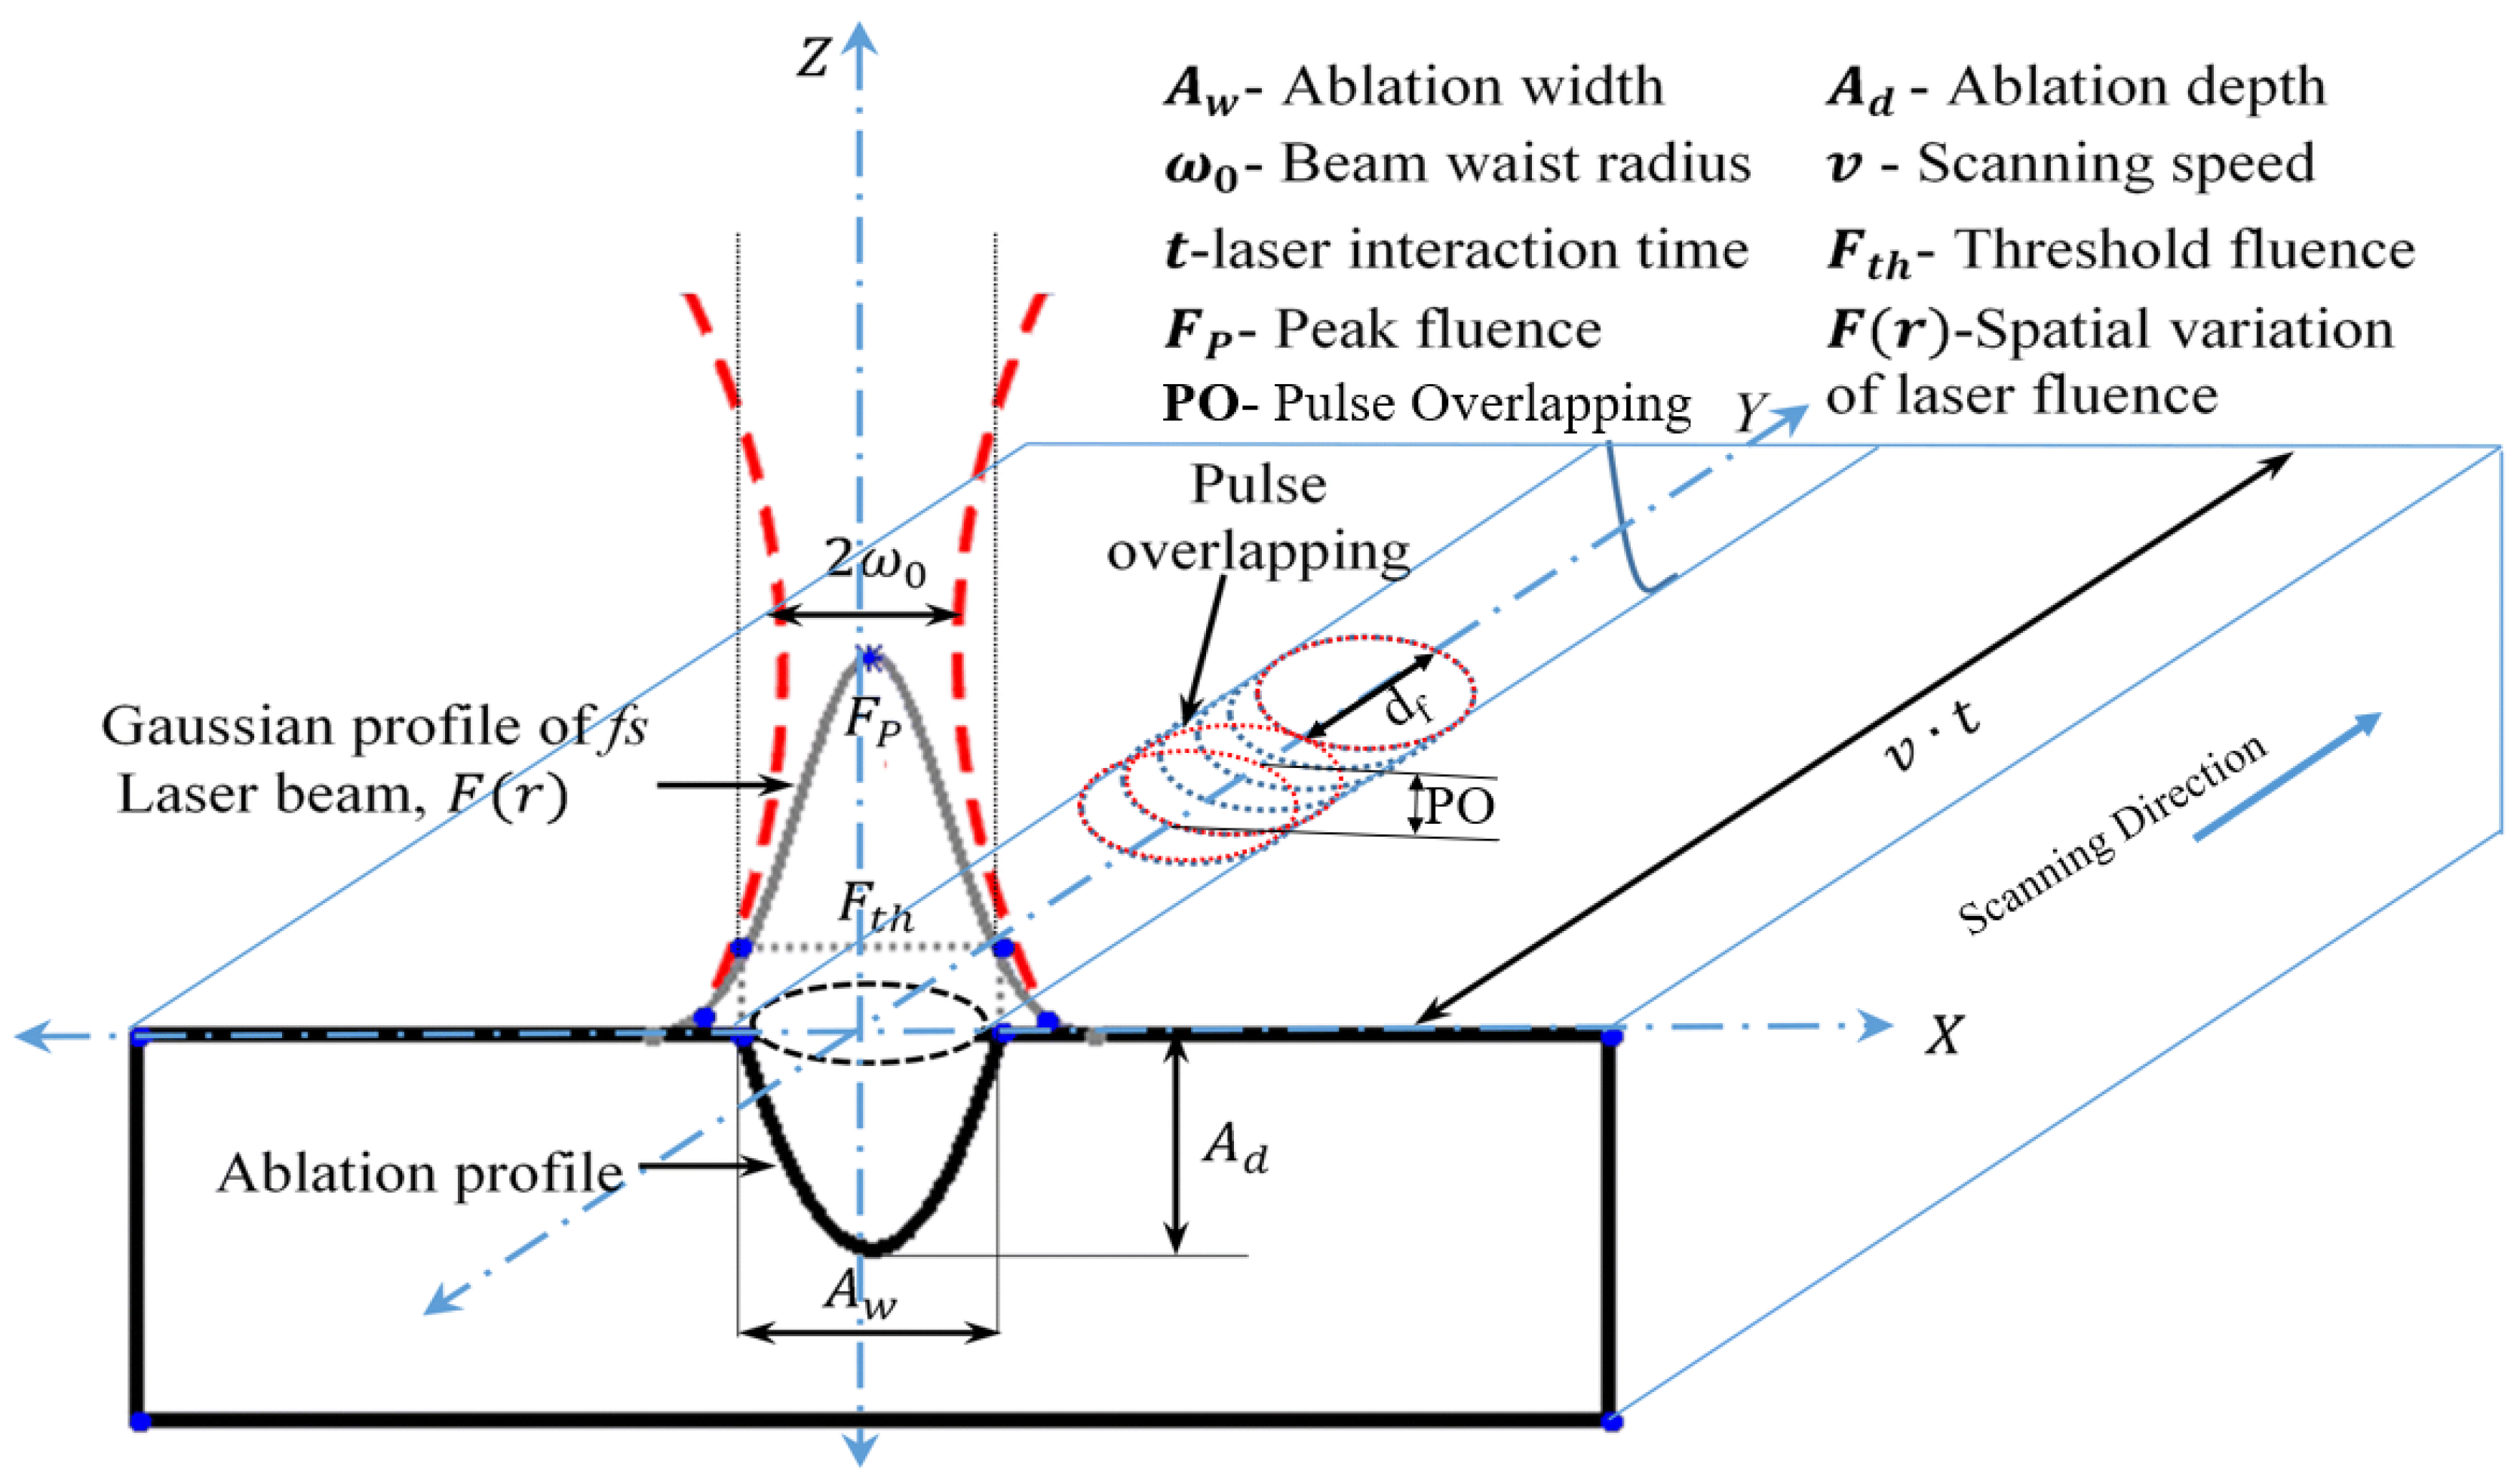
Figure 3.
Image of laser-treated surface sample (left image): (a) OM and (b) SEM micrograph of the investigated region.
Figure 3.
Image of laser-treated surface sample (left image): (a) OM and (b) SEM micrograph of the investigated region.

Figure 4.
EBSD micrographs under the hardened zone: (a) 1 µm and (b) 0.2 µm spot size.
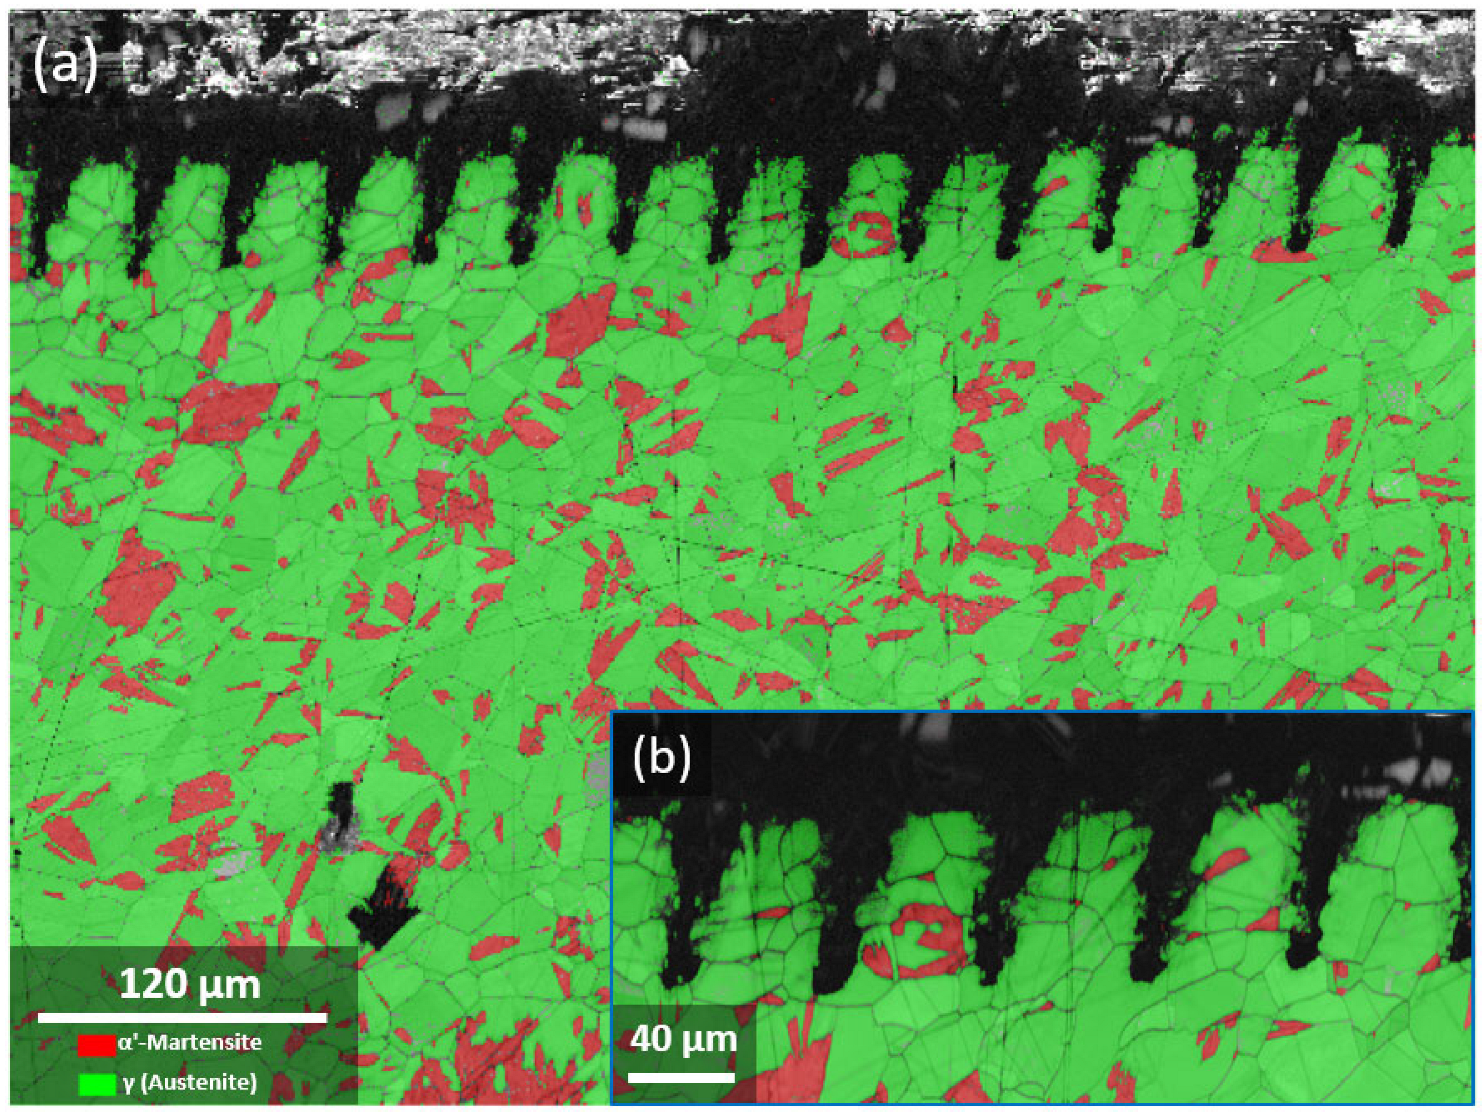
Figure 5.
SEM micrographs conducted at the cross-section after the laser-texturing process. The arrows (a) and the dash line (b) shows the twins and α′-martensite formation, respectively.
Figure 5.
SEM micrographs conducted at the cross-section after the laser-texturing process. The arrows (a) and the dash line (b) shows the twins and α′-martensite formation, respectively.
Figure 6.
Diagram representation of the interaction to get the maximum HV as a function of the main key parameters; (a) scanning speed–laser power, and (b) laser power–focal distance position (x-axis: DOE modelling levels).
Figure 6.
Diagram representation of the interaction to get the maximum HV as a function of the main key parameters; (a) scanning speed–laser power, and (b) laser power–focal distance position (x-axis: DOE modelling levels).

Figure 7.
Predicted representation of the 2D-contour plot of the maximum HV vs. (a) scanning speed—laser power and (b) scanning speed—focal distance position.
Figure 7.
Predicted representation of the 2D-contour plot of the maximum HV vs. (a) scanning speed—laser power and (b) scanning speed—focal distance position.
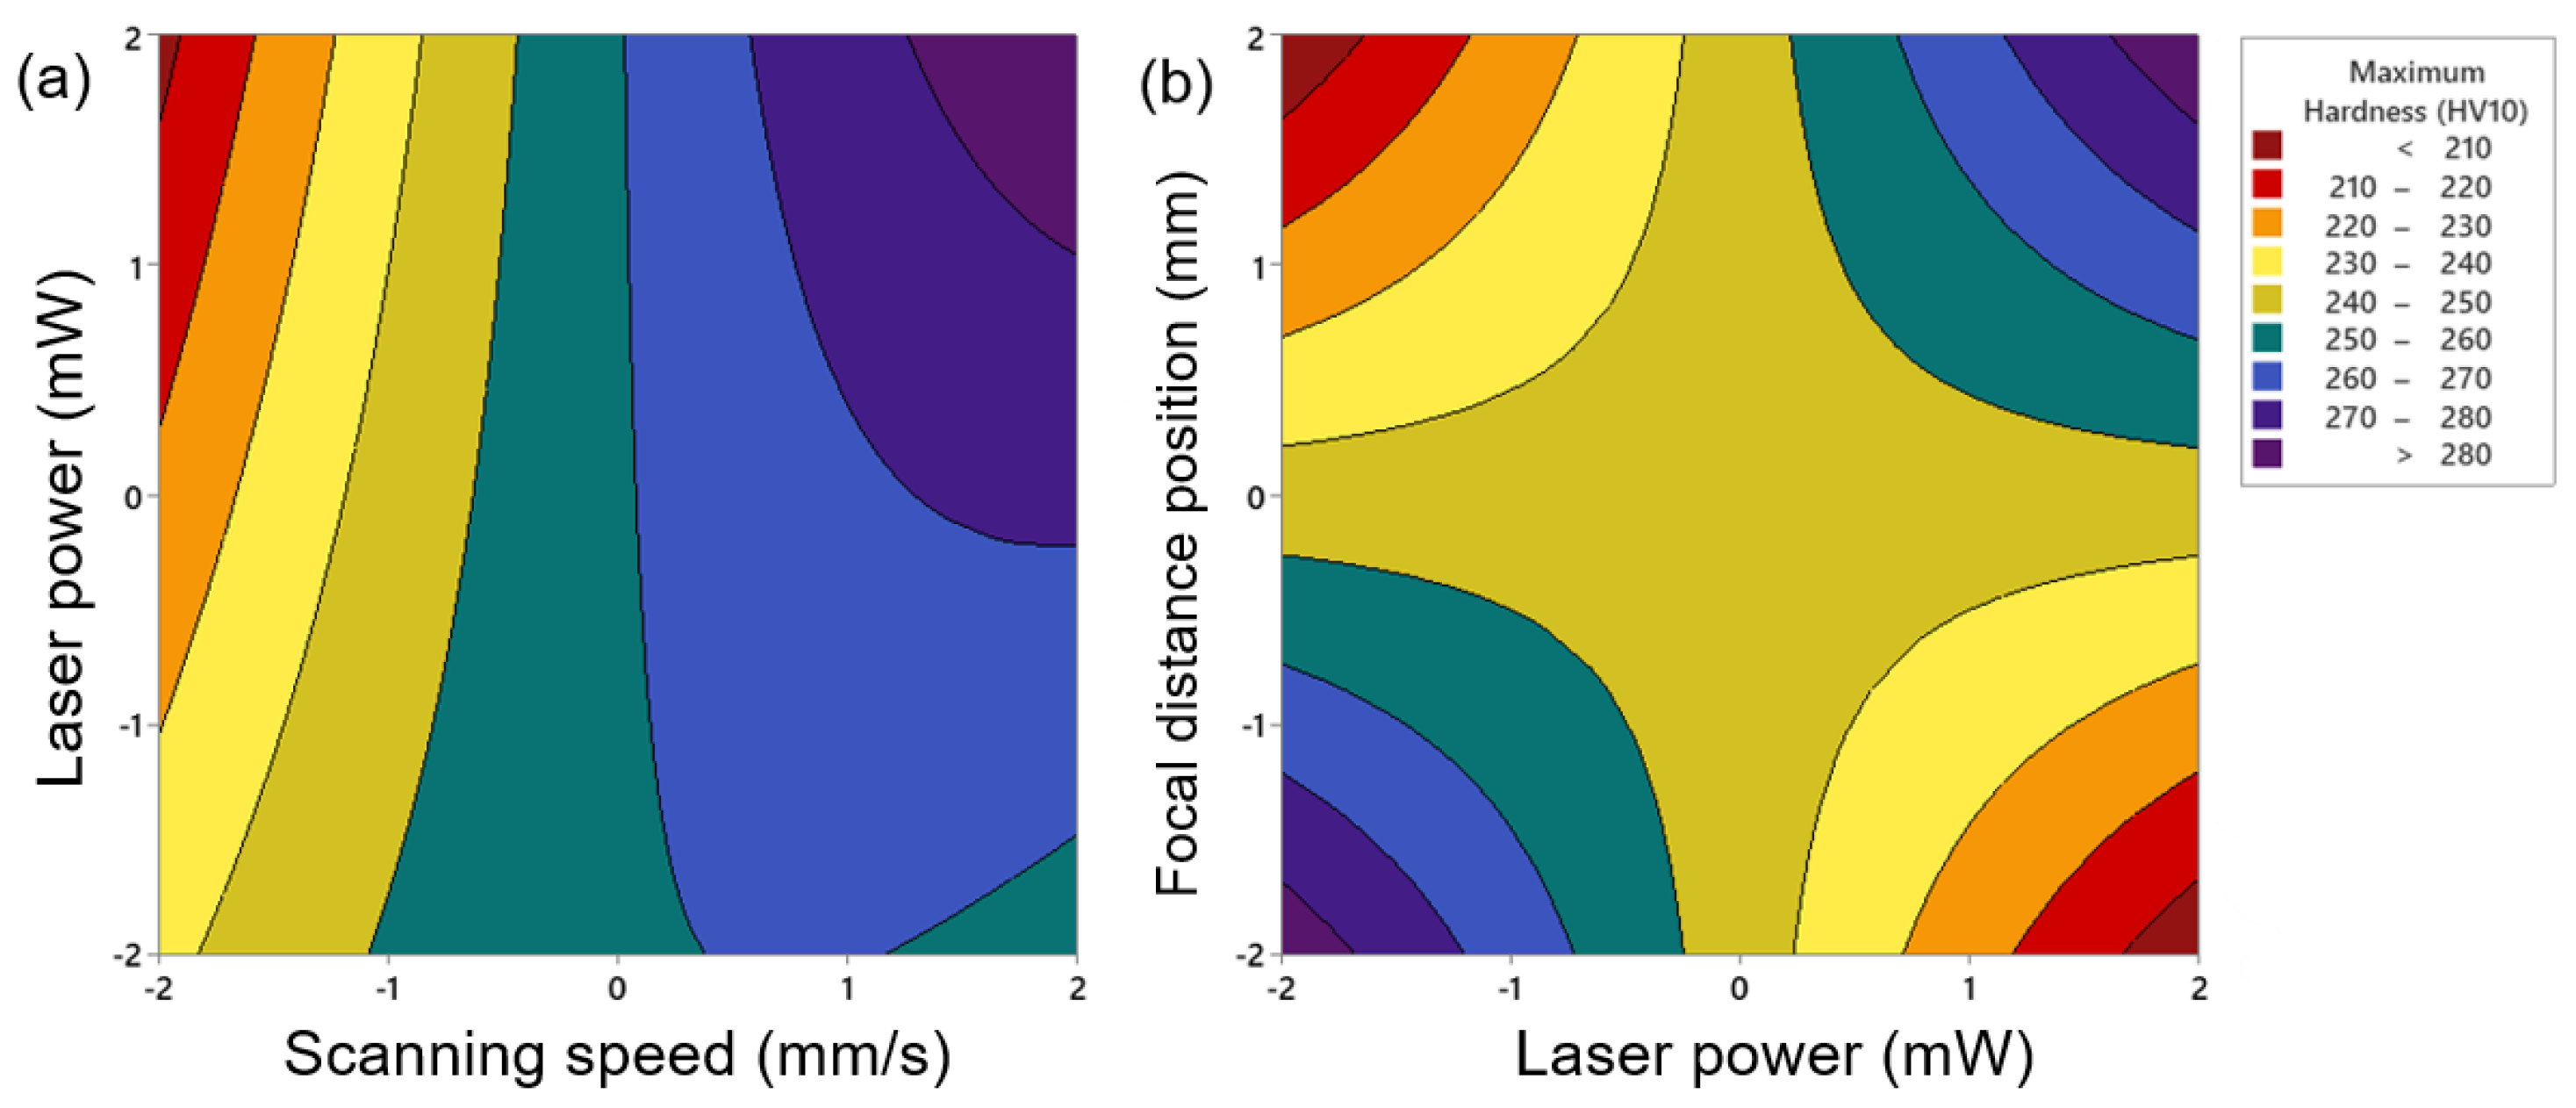
Figure 8.
The surface plot representation of the maximum HV as a function of (a) scanning speed—laser Power, (b) scanning speed–focal distance position, and (c) laser power–focal distance position.
Figure 8.
The surface plot representation of the maximum HV as a function of (a) scanning speed—laser Power, (b) scanning speed–focal distance position, and (c) laser power–focal distance position.

Figure 9.
(a) Evolution of the laser beam diameter as a function of the focal distance point, (b) Pulse overlapping representation as a function of the scanning speed.
Figure 9.
(a) Evolution of the laser beam diameter as a function of the focal distance point, (b) Pulse overlapping representation as a function of the scanning speed.
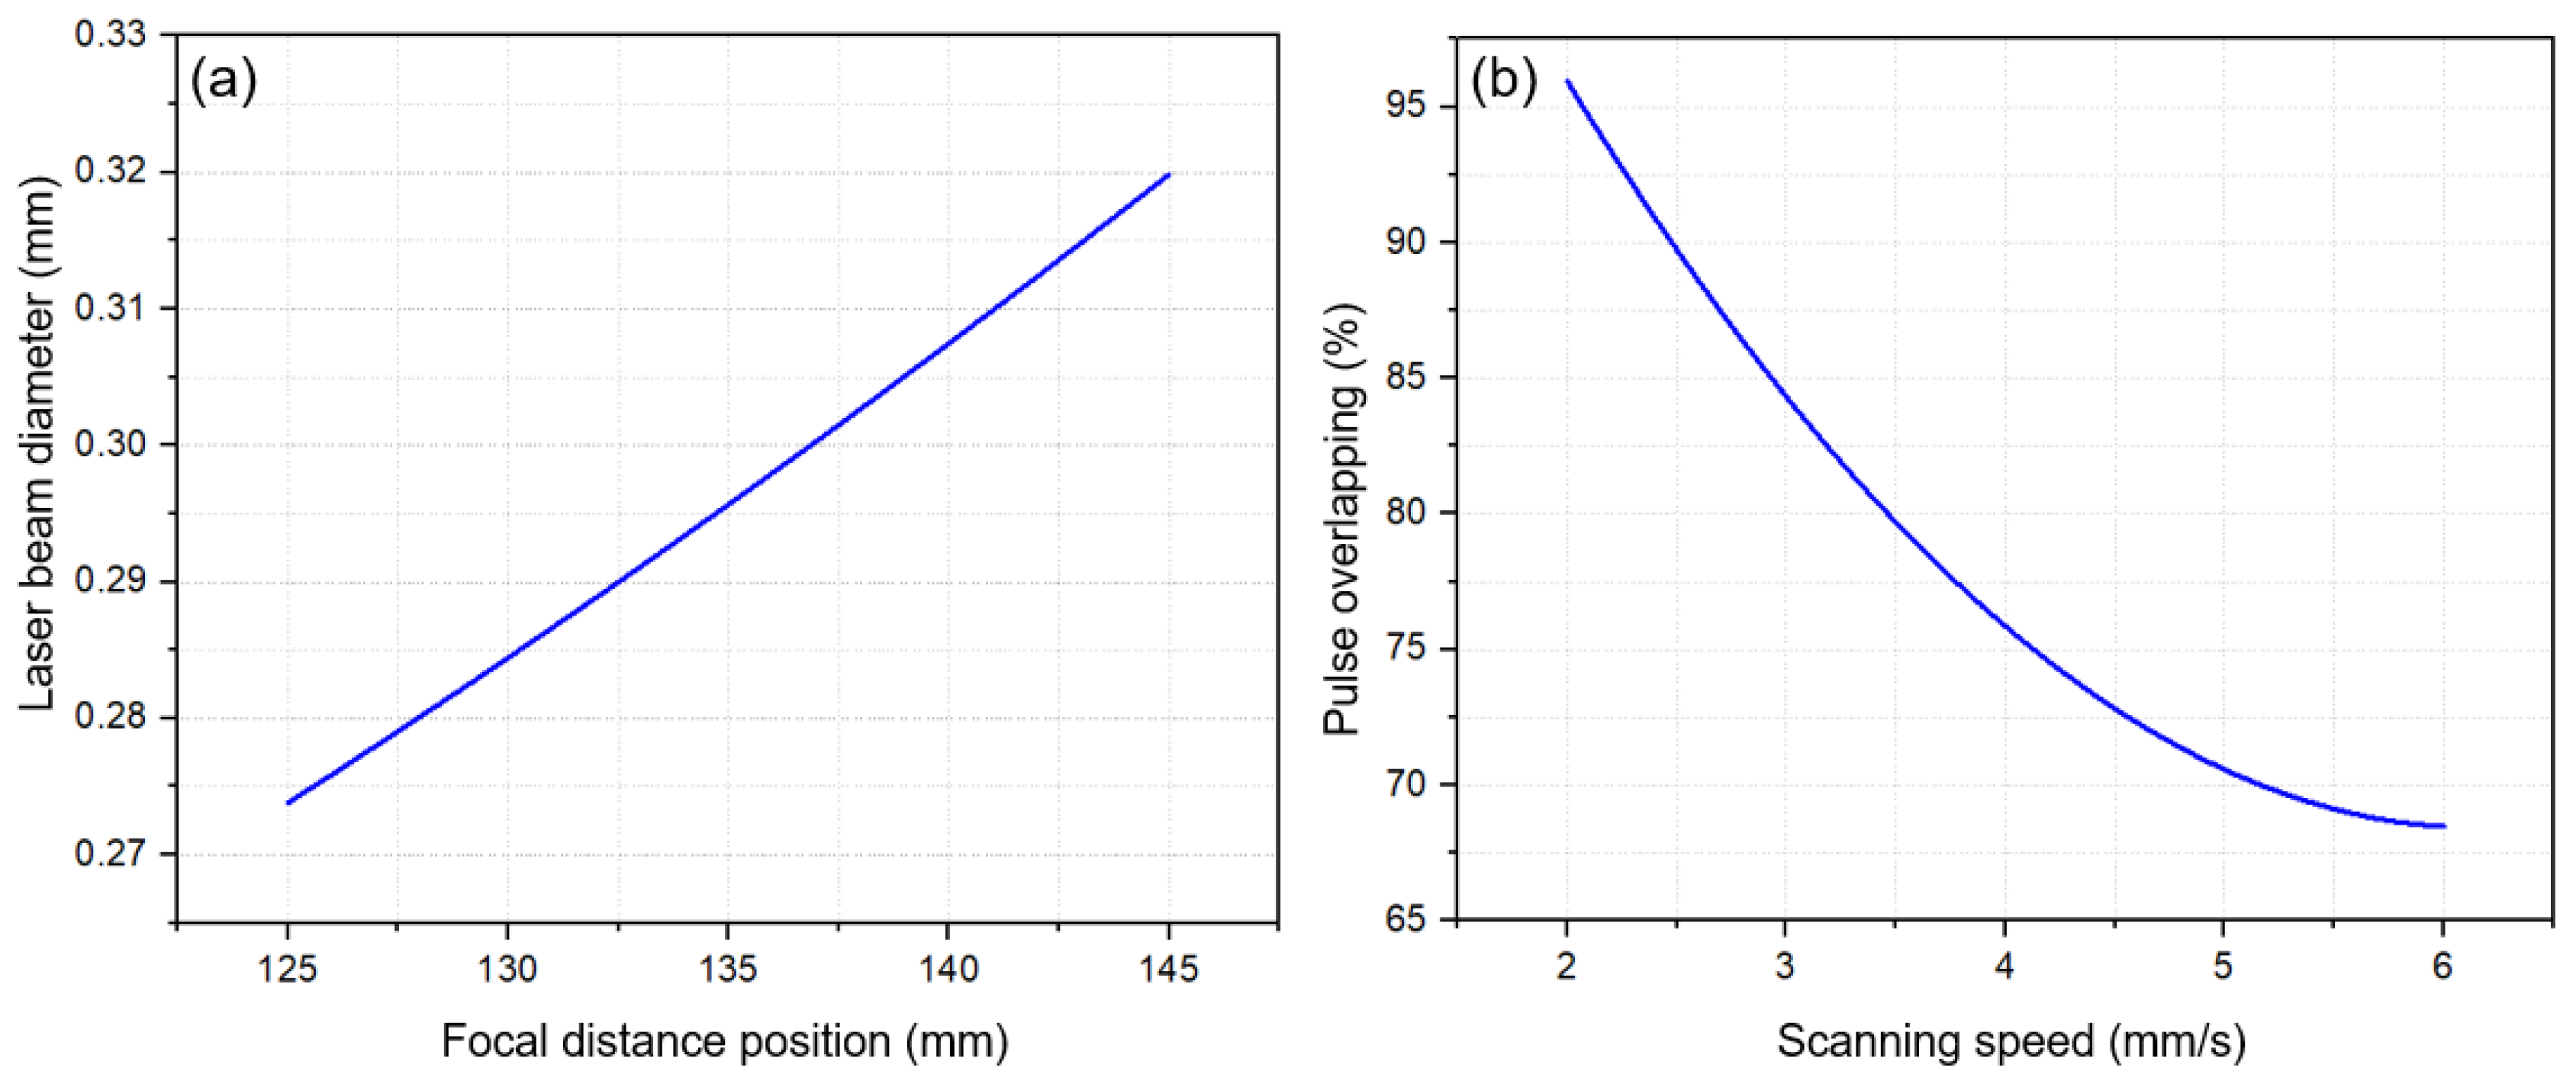
Figure 10.
Cross-section SEM micrograph after apply the ns-laser on the surface: (a) low laser power (level −2) and (b) high laser power (level 2).
Figure 10.
Cross-section SEM micrograph after apply the ns-laser on the surface: (a) low laser power (level −2) and (b) high laser power (level 2).
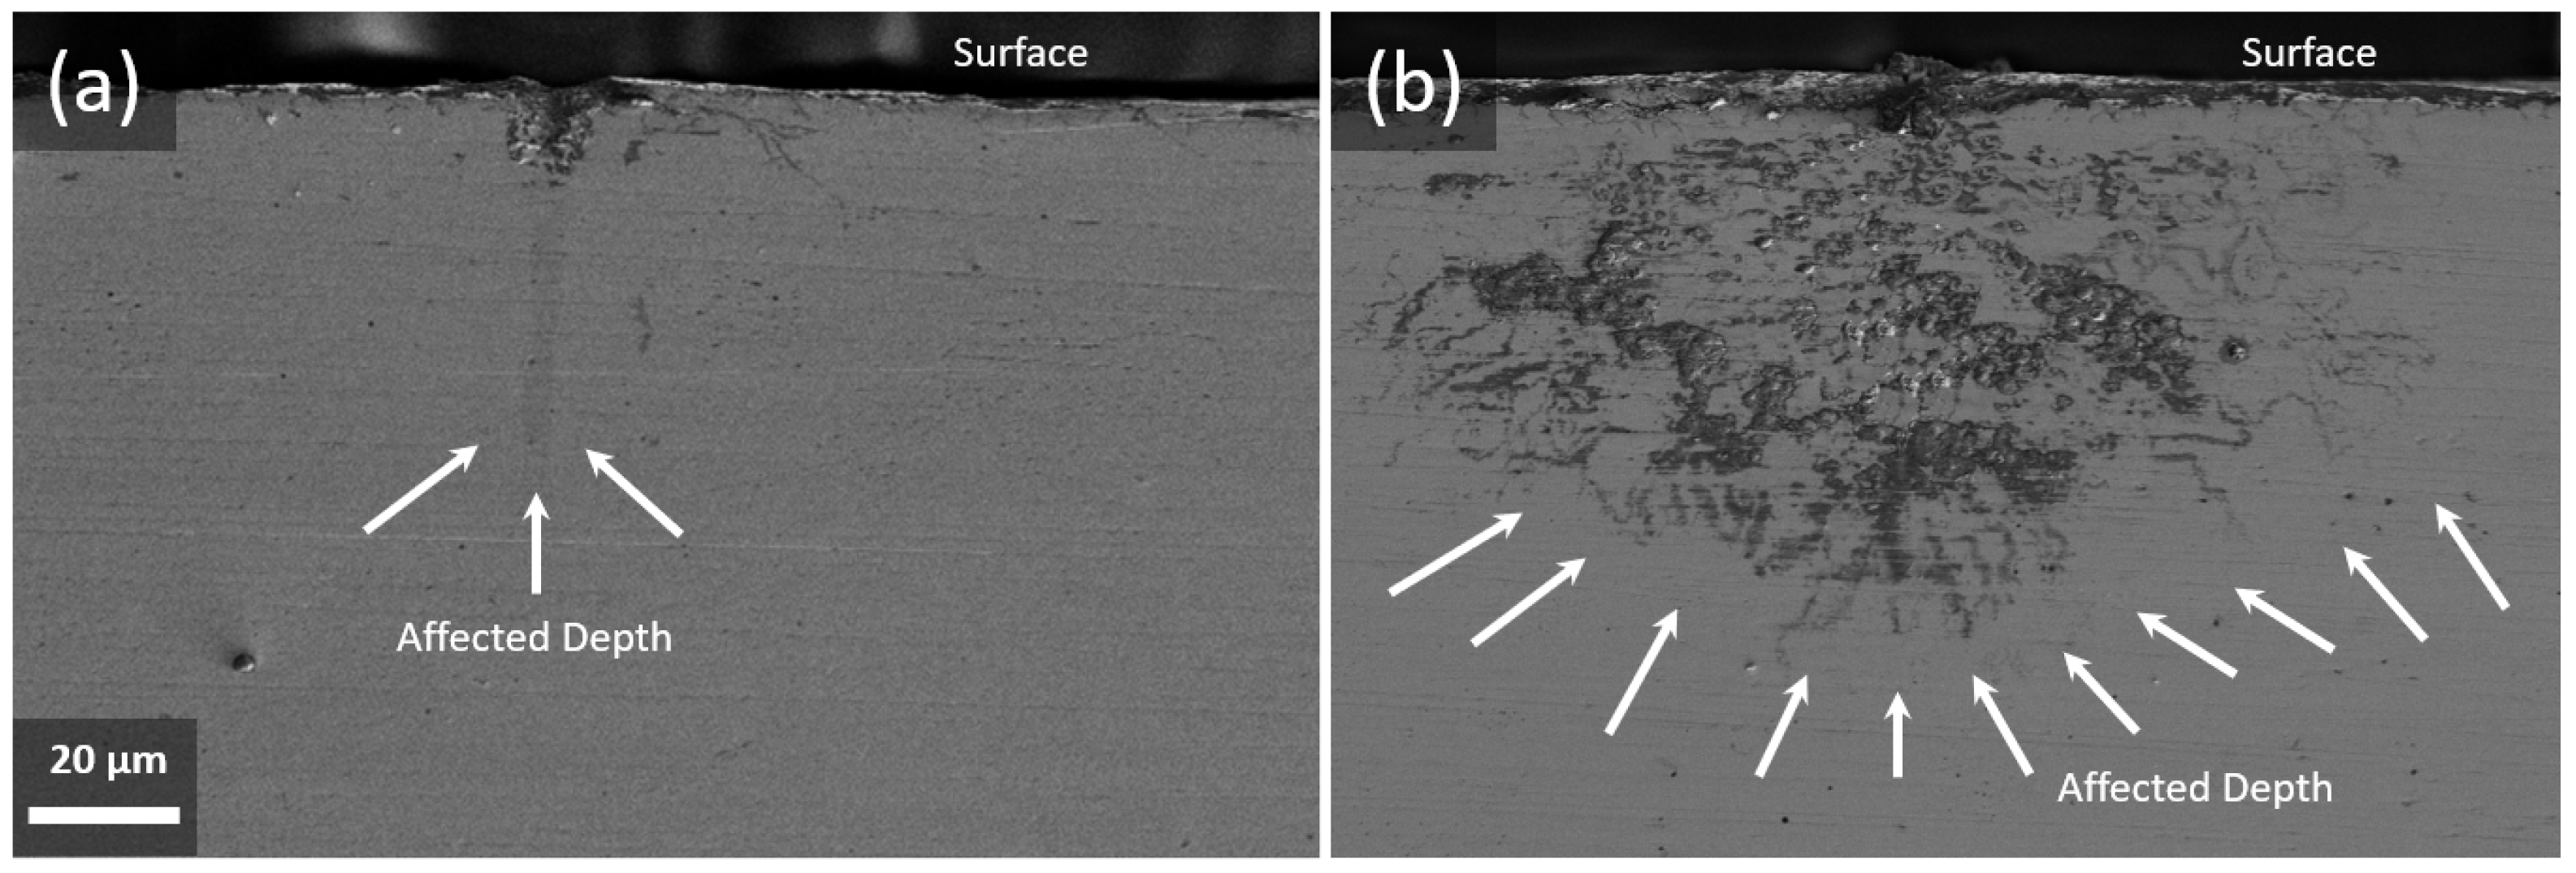
Figure 11.
(a) The surface plot of the depth of the microstructural evolution vs. scanning speed, laser power, and (b) Predicted representation of the 2D-contour plot of the depth of the microstructural evolution vs. scanning speed–laser power.
Figure 11.
(a) The surface plot of the depth of the microstructural evolution vs. scanning speed, laser power, and (b) Predicted representation of the 2D-contour plot of the depth of the microstructural evolution vs. scanning speed–laser power.

Figure 12.
Diagram representation of the width of laser track as a function of the main key parameters; laser power and the focal distance position.
Figure 12.
Diagram representation of the width of laser track as a function of the main key parameters; laser power and the focal distance position.
Figure 13.
(a) The surface plot of width of laser track representation vs. laser power, focal distance position, and (b) predicted representation of the 2D-contour plot of the width of the laser track vs. laser power, focal distance position.
Figure 13.
(a) The surface plot of width of laser track representation vs. laser power, focal distance position, and (b) predicted representation of the 2D-contour plot of the width of the laser track vs. laser power, focal distance position.
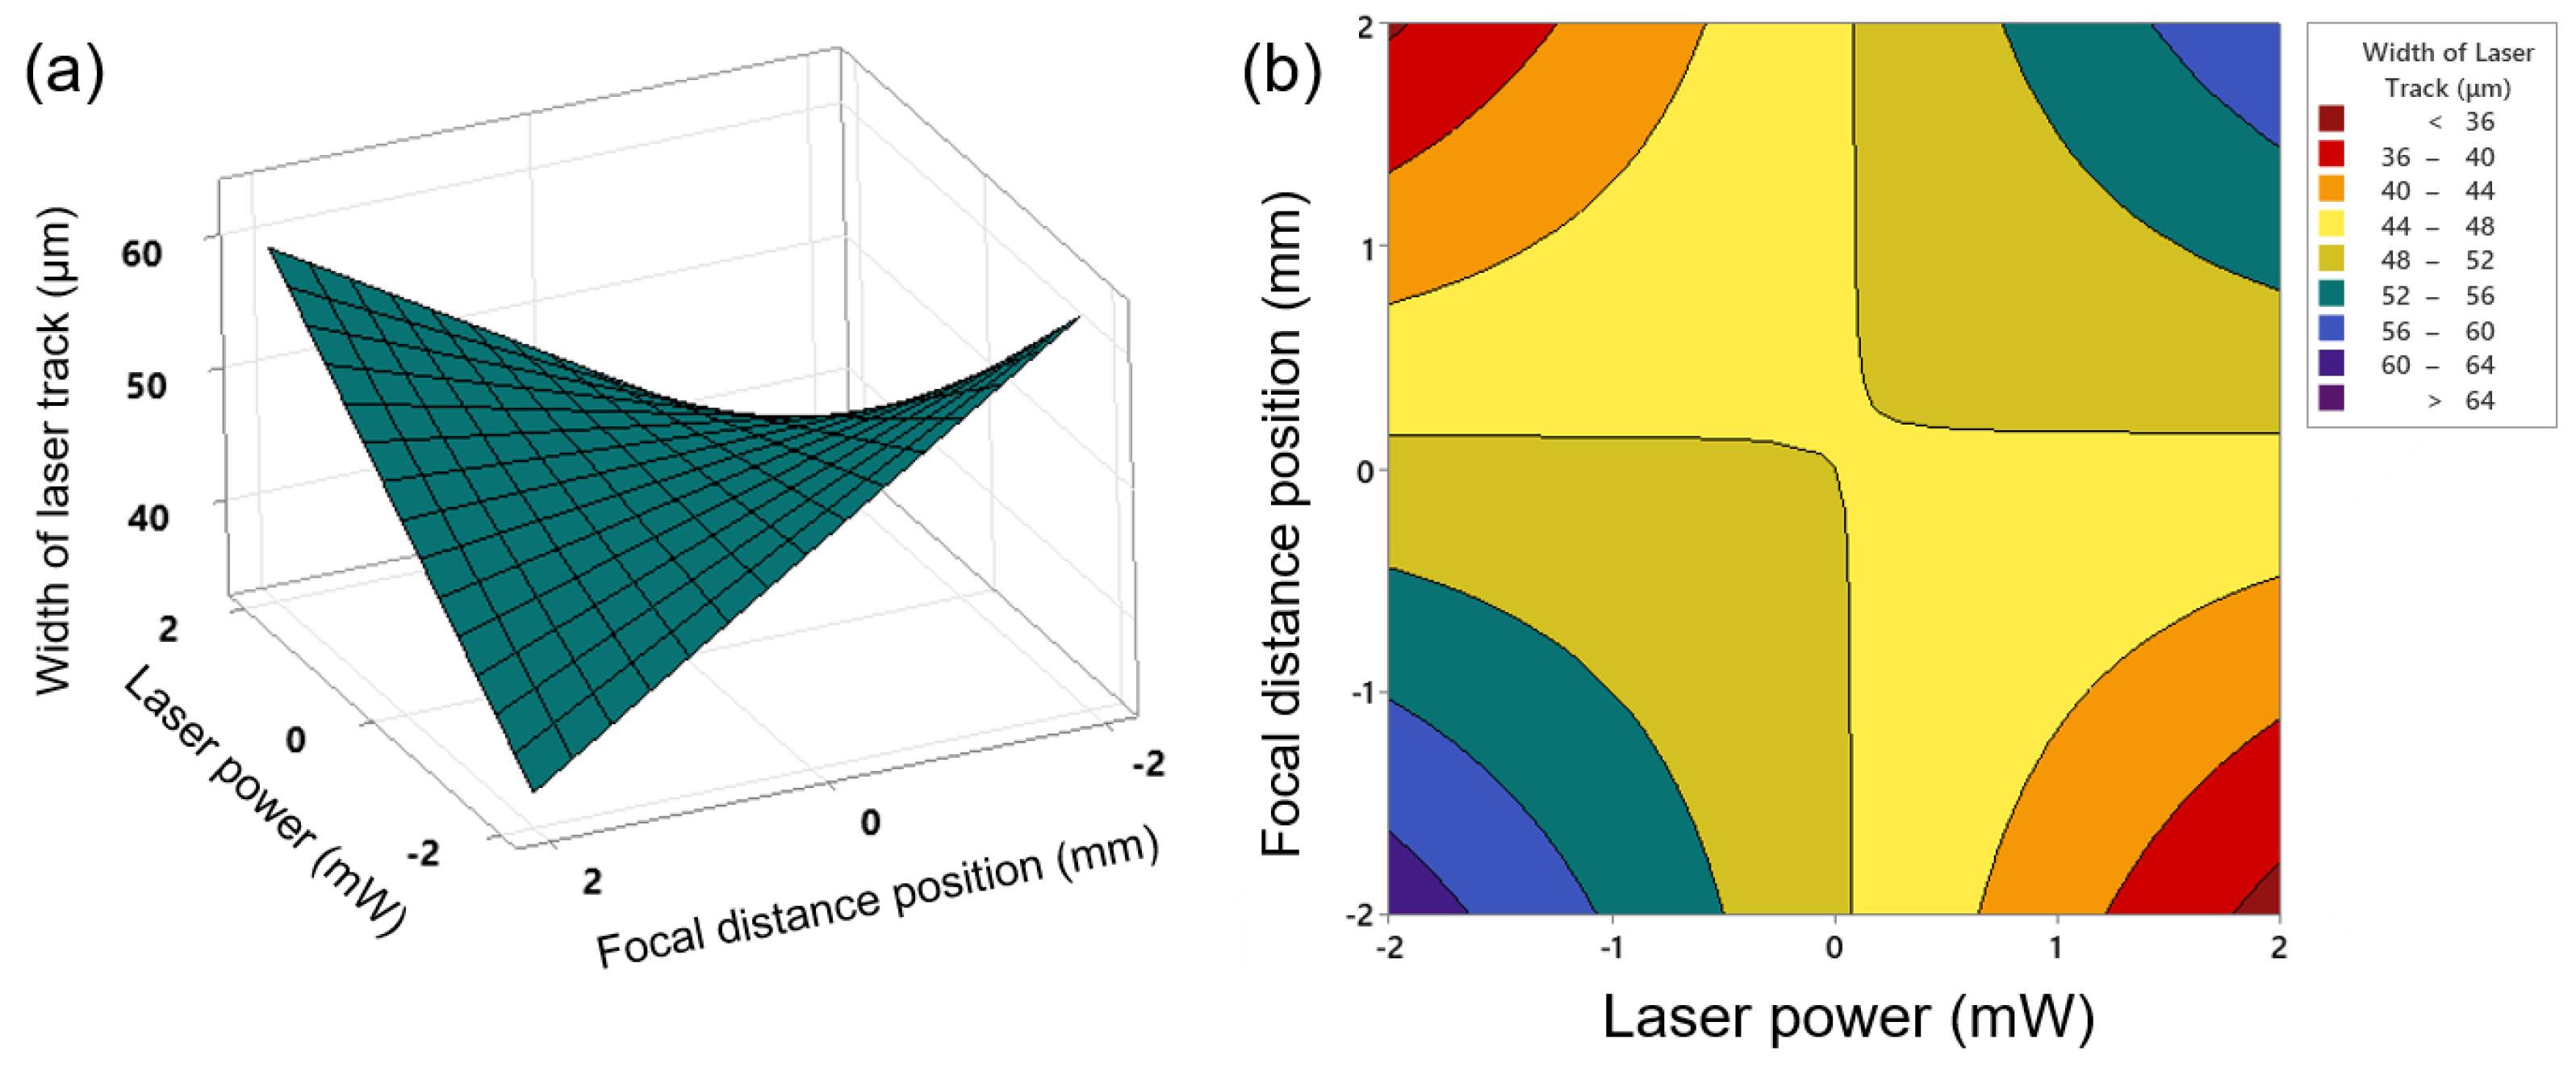
Figure 14.
SEM micrographs from surface after laser modification. (a) laser power and focal distance position, and (b) high laser power and focal distance position.
Figure 14.
SEM micrographs from surface after laser modification. (a) laser power and focal distance position, and (b) high laser power and focal distance position.

Table 1.
Chemical composition of AISI 301LN stainless steel (wt. %).
| Cr | Ni | Mn | Si | N | Mo | C | Fe |
|---|---|---|---|---|---|---|---|
| 17.6 | 6.50 | 1.13 | 0.42 | 0.17 | 0.04 | 0.02 | Bal. |
Table 2.
Characteristics of the ns-Nd:YLF laser equipment employed in this research.
| Wavelength (nm) | Gain Medium | Pulse Energy@ kHz (µJ) | Output Power @kHz (mW) | Pulse Width (FWHM) (ns) | Beam Diameter at the Waist (1/e2) (mm) | Beam Divergence, Full Angle (1/e2) (mRad) |
|---|---|---|---|---|---|---|
| 349 | Nd:YLF | 120 µJ | 120 | 5 | 0.145 ± 0.02 | 3.0 ± 0.5 |
Table 3.
Independent process parameters with design levels.
| Variable | Symbol | Units | −2 | −1 | 0 | 1 | 2 |
|---|---|---|---|---|---|---|---|
| Scanning speed | S | mm/s | 2 | 3 | 4 | 5 | 6 |
| Laser power | P | mW | 80 | 90 | 100 | 110 | 120 |
| Focal distance position | FDP | mm | 125 | 130 | 135 | 140 | 145 |
Table 4.
Experimental input parameters investigated in this research.
| Input Parameters | Output Parameters | |||||||
|---|---|---|---|---|---|---|---|---|
| Sample | Laser Power (mW) | Scanning Speed (mm/s) | Focal Distance Position (mm) | Maximum Hardness (HV10) | Depth of the Microstructural Evolution (μm) | Width of Laser Track (μm) | Laser Beam Diameter (mm) | Pulse Overlapping (%) |
| 1 | 0 | 0 | 0 | 263 | 720 | 52 | 0.296 | 74.3 |
| 2 | 0 | 0 | −2 | 260 | 690 | 49 | 0.273 | 74.3 |
| 3 | −1 | 1 | −1 | 269 | 830 | 59 | 0.285 | 71.2 |
| 4 | 1 | −1 | 1 | 248 | 590 | 41 | 0.307 | 84.6 |
| 5 | −1 | 1 | 1 | 256 | 790 | 43 | 0.317 | 71.2 |
| 6 | 0 | 0 | 0 | 259 | 690 | 46 | 0.295 | 74.3 |
| 7 | 0 | −2 | 0 | 223 | 520 | 34 | 0.296 | 95.1 |
| 8 | −2 | 0 | 0 | 264 | 710 | 50 | 0.297 | 74.3 |
| 9 | 0 | 0 | 0 | 261 | 680 | 51 | 0.296 | 73.2 |
| 10 | 0 | 2 | 0 | 273 | 860 | 59 | 0.301 | 68.1 |
| 11 | 1 | −1 | −1 | 231 | 640 | 33 | 0.285 | 84.6 |
| 12 | 2 | 0 | 0 | 257 | 730 | 47 | 0.299 | 74.3 |
| 13 | 0 | 0 | 2 | 261 | 680 | 46 | 0.322 | 75.4 |
| 14 | 1 | 1 | −1 | 268 | 740 | 55 | 0.284 | 71.2 |
| 15 | −1 | −1 | 1 | 234 | 580 | 34 | 0.309 | 84.6 |
| 16 | 1 | 1 | 1 | 276 | 760 | 61 | 0.311 | 71.2 |
| 17 | −1 | −1 | −1 | 252 | 570 | 43 | 0.283 | 84.6 |
Table 5.
Modified variance analysis to get the maximum Vickers hardness at the near surface (loading control mode conducted at 1 kgf).
Table 5.
Modified variance analysis to get the maximum Vickers hardness at the near surface (loading control mode conducted at 1 kgf).
| Source of Variation | Degree of Freedom | Sum of Squares | Mean Squares | F-Value | T-Value | p-Value |
|---|---|---|---|---|---|---|
| Model | 6 | 3151.45 | 525.24 | 78.37 | - | 0.000 |
| Linear | 3 | 2475.69 | 825.23 | 123.13 | - | 0.000 |
| Scanning speed (mm/s) | 1 | 2475.06 | 2475.06 | 369.29 | 19.22 | 0.000 |
| Laser power (mW) | 1 | 0.56 | 0.56 | 0.08 | 0.29 | 0.050 |
| Focal distance position (mm) | 1 | 0.06 | 0.06 | 0.01 | 0.10 | 0.925 |
| Square | 1 | 230.51 | 230.51 | 34.39 | - | 0.000 |
| Scanning Speed (mm/s) × Scanning Speed (mm/s) | 1 | 230.51 | 230.51 | 34.39 | -5.86 | 0.000 |
| 2-Way Interaction | 2 | 445.25 | 222.62 | 33.22 | - | 0.000 |
| Scanning Speed (mm/s) × Laser Power (mW) | 1 | 120.13 | 120.13 | 17.92 | 4.23 | 0.002 |
| Laser Power (mW) × Focal Distance Position (mm) | 1 | 325.12 | 325.12 | 48.51 | 6.96 | 0.000 |
| Error | 10 | 67.02 | 6.70 | - | ||
| Lack-of-Fit | 8 | 59.02 | 7.38 | 1.84 | - | 0.399 |
| Pure Error | 2 | 8.00 | 4.00 | |||
| Total | 16 | 3218.47 | ||||
| R-Sq = 97.92% | R-Sq(adj) = 96.67% | |||||
Table 6.
Summary of the main parameters related to the modified variance analysis for Depth of the microstructural evolution.
Table 6.
Summary of the main parameters related to the modified variance analysis for Depth of the microstructural evolution.
| Source of Variation | Degree of Freedom | Sum of Squares | Mean Squares | F-Value | T-Value | p-Value |
|---|---|---|---|---|---|---|
| Model | 3 | 131,025 | 43,675 | 99.12 | - | 0.000 |
| Linear | 2 | 126,025 | 63,013 | 143.01 | - | 0.000 |
| Scanning Speed (mm/s) | 1 | 126,025 | 126,025 | 286.02 | 16.91 | 0.000 |
| Laser Power (mW) | 1 | 0 | 0 | 0.00 | −0.00 | 1.000 |
| 2-Way Interaction | 1 | 5000 | 5000 | 11.35 | - | 0.005 |
| Scanning Speed (mm/s) × Laser Power (mW) | 1 | 5000 | 5000 | 11.35 | −3.35 | 0.005 |
| Error | 13 | 5728 | 441 | - | ||
| Lack-of-Fit | 11 | 4861 | 442 | 1.02 | - | 0.594 |
| Pure Error | 2 | 867 | 433 | |||
| Total | 16 | 136,753 | ||||
| R-Sq = 95.81% | R-Sq(adj) = 94.84% | |||||
Table 7.
Summary of the modified variance analysis for the width of laser track (μm).
| Source of Variation | Degree of Freedom | Sum of Squares | Mean Squares | F-Value | T-Value | p-Value |
|---|---|---|---|---|---|---|
| Model | 4 | 989.50 | 247.375 | 31.41 | - | 0.000 |
| Linear | 3 | 905.00 | 301.667 | 38.31 | - | 0.000 |
| Scanning Speed (mm/s) | 1 | 900.00 | 900.000 | 114.29 | 10.69 | 0.000 |
| Laser Power (mW) | 1 | 4.00 | 4.000 | 0.51 | −0.71 | 0.0490 |
| Focal Distance Position (mm) | 1 | 1.00 | 1.000 | 0.13 | −0.36 | 0.728 |
| 2-Way Interaction | 1 | 84.50 | 84.500 | 10.73 | - | 0.007 |
| Laser Power (mW) ×·Focal Distance Position (mm) | 1 | 84.50 | 84.500 | 10.73 | 3.28 | 0.007 |
| Error | 12 | 94.50 | 7.875 | |||
| Lack-of-Fit | 10 | 73.83 | 7.383 | 0.71 | 0.709 | |
| Pure Error | 2 | 20.67 | 10.333 | |||
| Total | 16 | 1084.00 | ||||
| R-Sq = 91.28% | R-Sq(adj) = 88.8% | |||||
Disclaimer/Publisher’s Note: The statements, opinions and data contained in all publications are solely those of the individual author(s) and contributor(s) and not of MDPI and/or the editor(s). MDPI and/or the editor(s) disclaim responsibility for any injury to people or property resulting from any ideas, methods, instructions or products referred to in the content. |
© 2023 by the authors. Licensee MDPI, Basel, Switzerland. This article is an open access article distributed under the terms and conditions of the Creative Commons Attribution (CC BY) license (https://creativecommons.org/licenses/by/4.0/).
Share and Cite
MDPI and ACS Style
Rezayat, M.; Mateo, A.; Roa, J.J. Exploring the Effects of Laser Surface Modification on AISI 301LN Steel: A Micro-Mechanical Study. J. Manuf. Mater. Process. 2023, 7, 191. https://doi.org/10.3390/jmmp7060191
AMA Style
Rezayat M, Mateo A, Roa JJ. Exploring the Effects of Laser Surface Modification on AISI 301LN Steel: A Micro-Mechanical Study. Journal of Manufacturing and Materials Processing. 2023; 7(6):191. https://doi.org/10.3390/jmmp7060191
Chicago/Turabian StyleRezayat, Mohammad, Antonio Mateo, and Joan Josep Roa. 2023. "Exploring the Effects of Laser Surface Modification on AISI 301LN Steel: A Micro-Mechanical Study" Journal of Manufacturing and Materials Processing 7, no. 6: 191. https://doi.org/10.3390/jmmp7060191