
Temperature Evaluation of Cladding Beads and the Surrounding Area during the Laser Metal Deposition Process
Abstract
:1. Introduction
2. Experimental Procedures
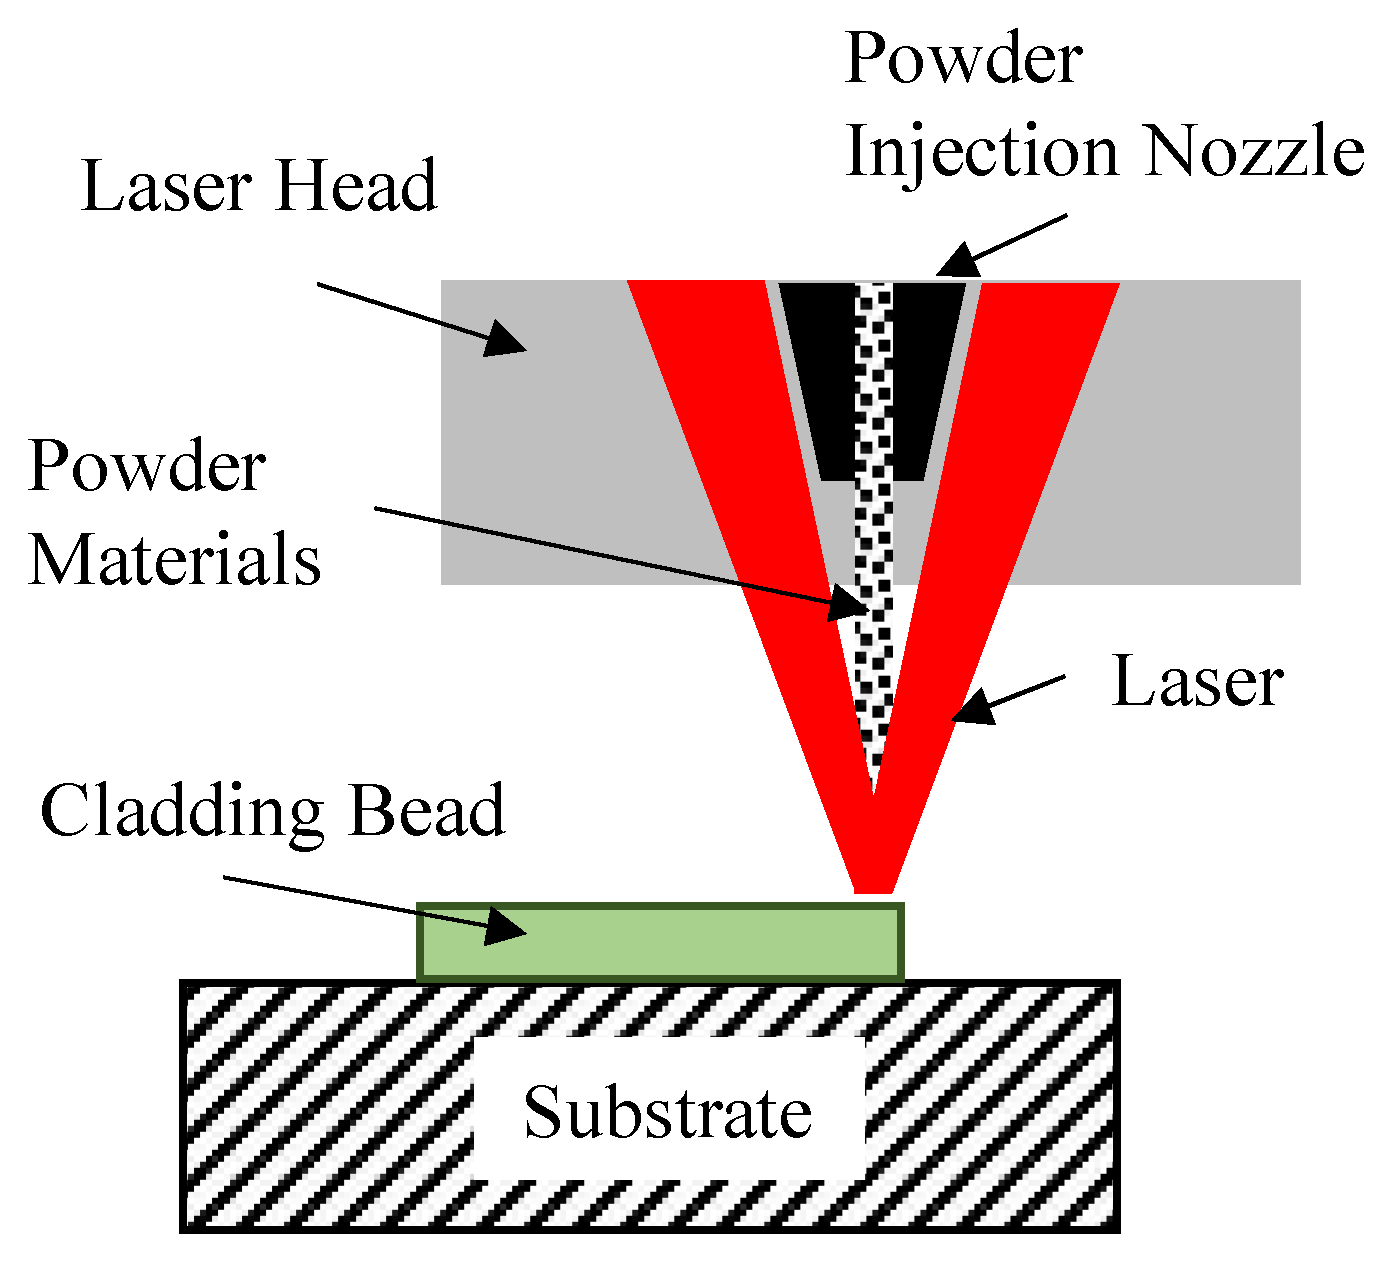
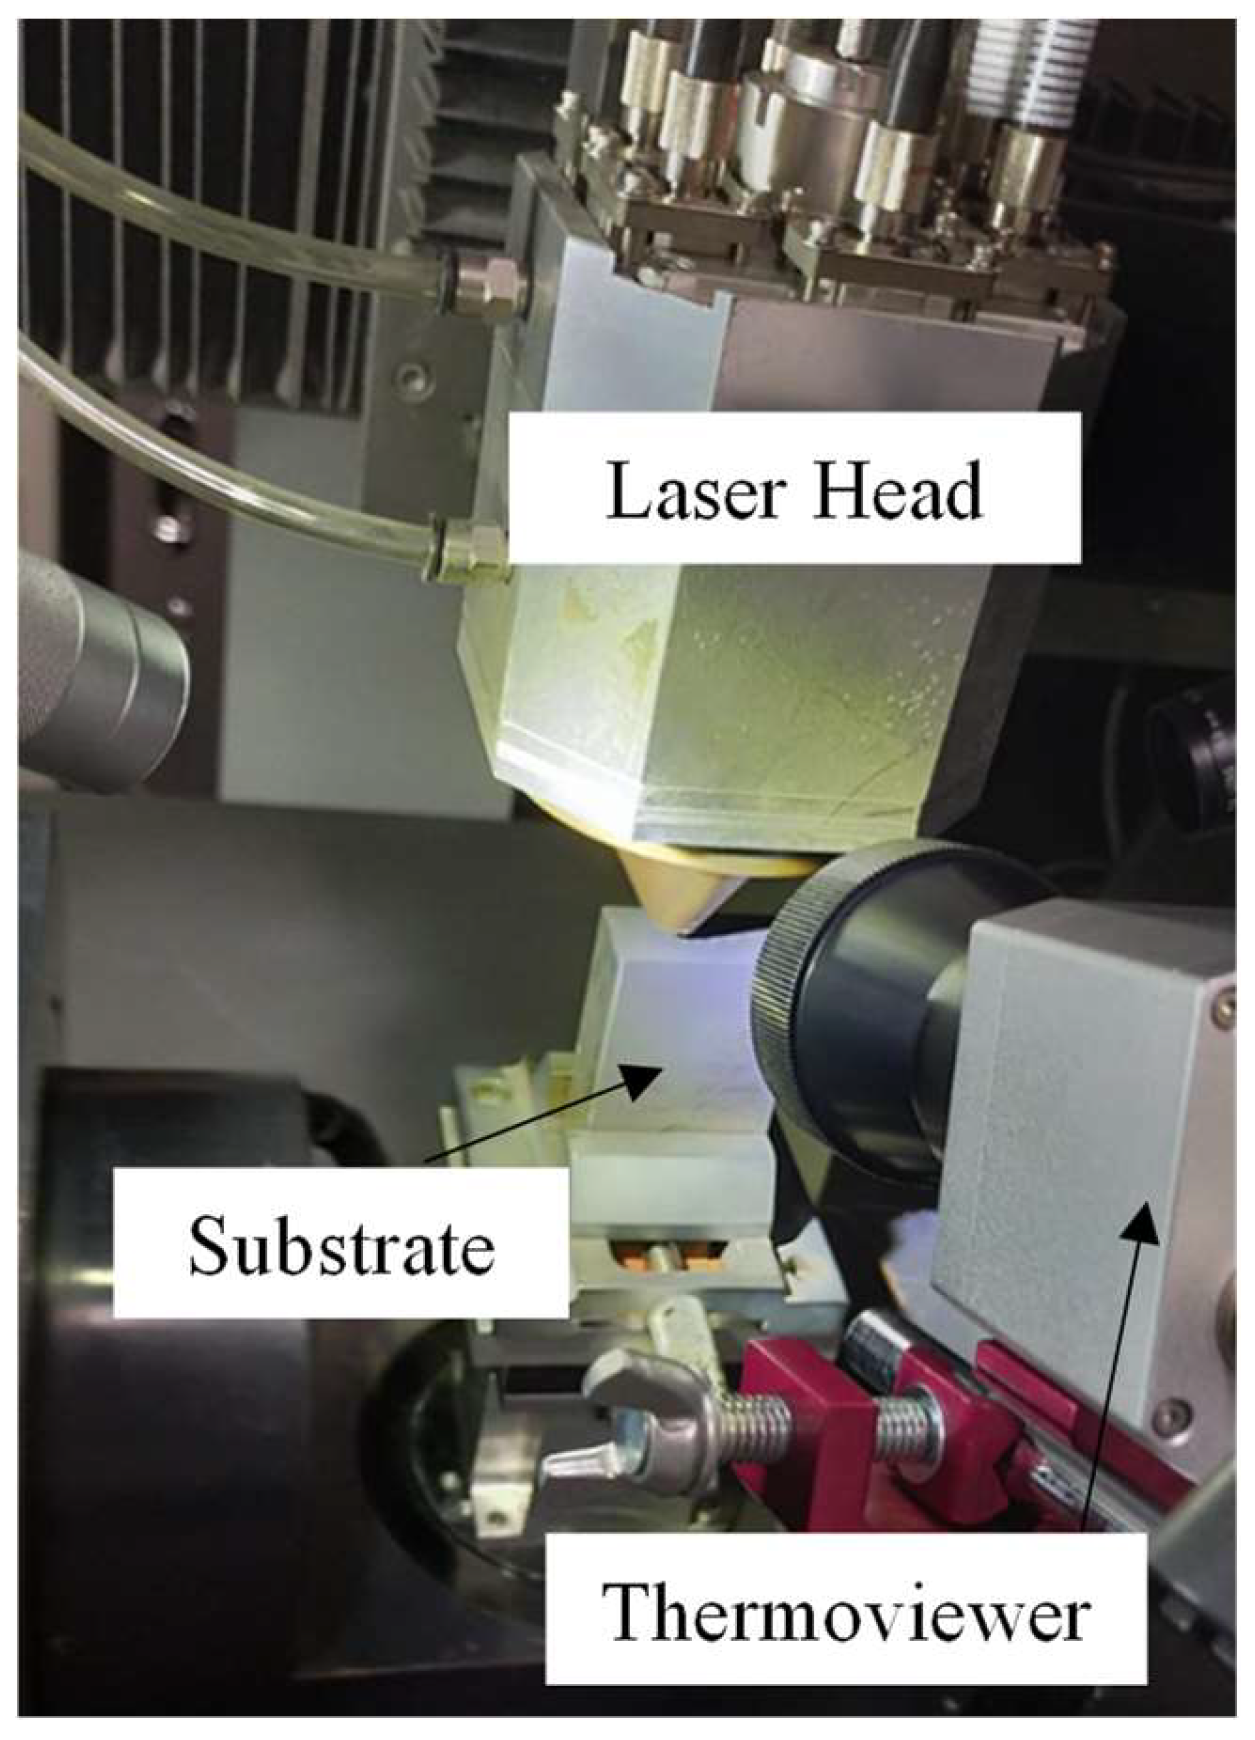
2.1. Laser Metal Deposition
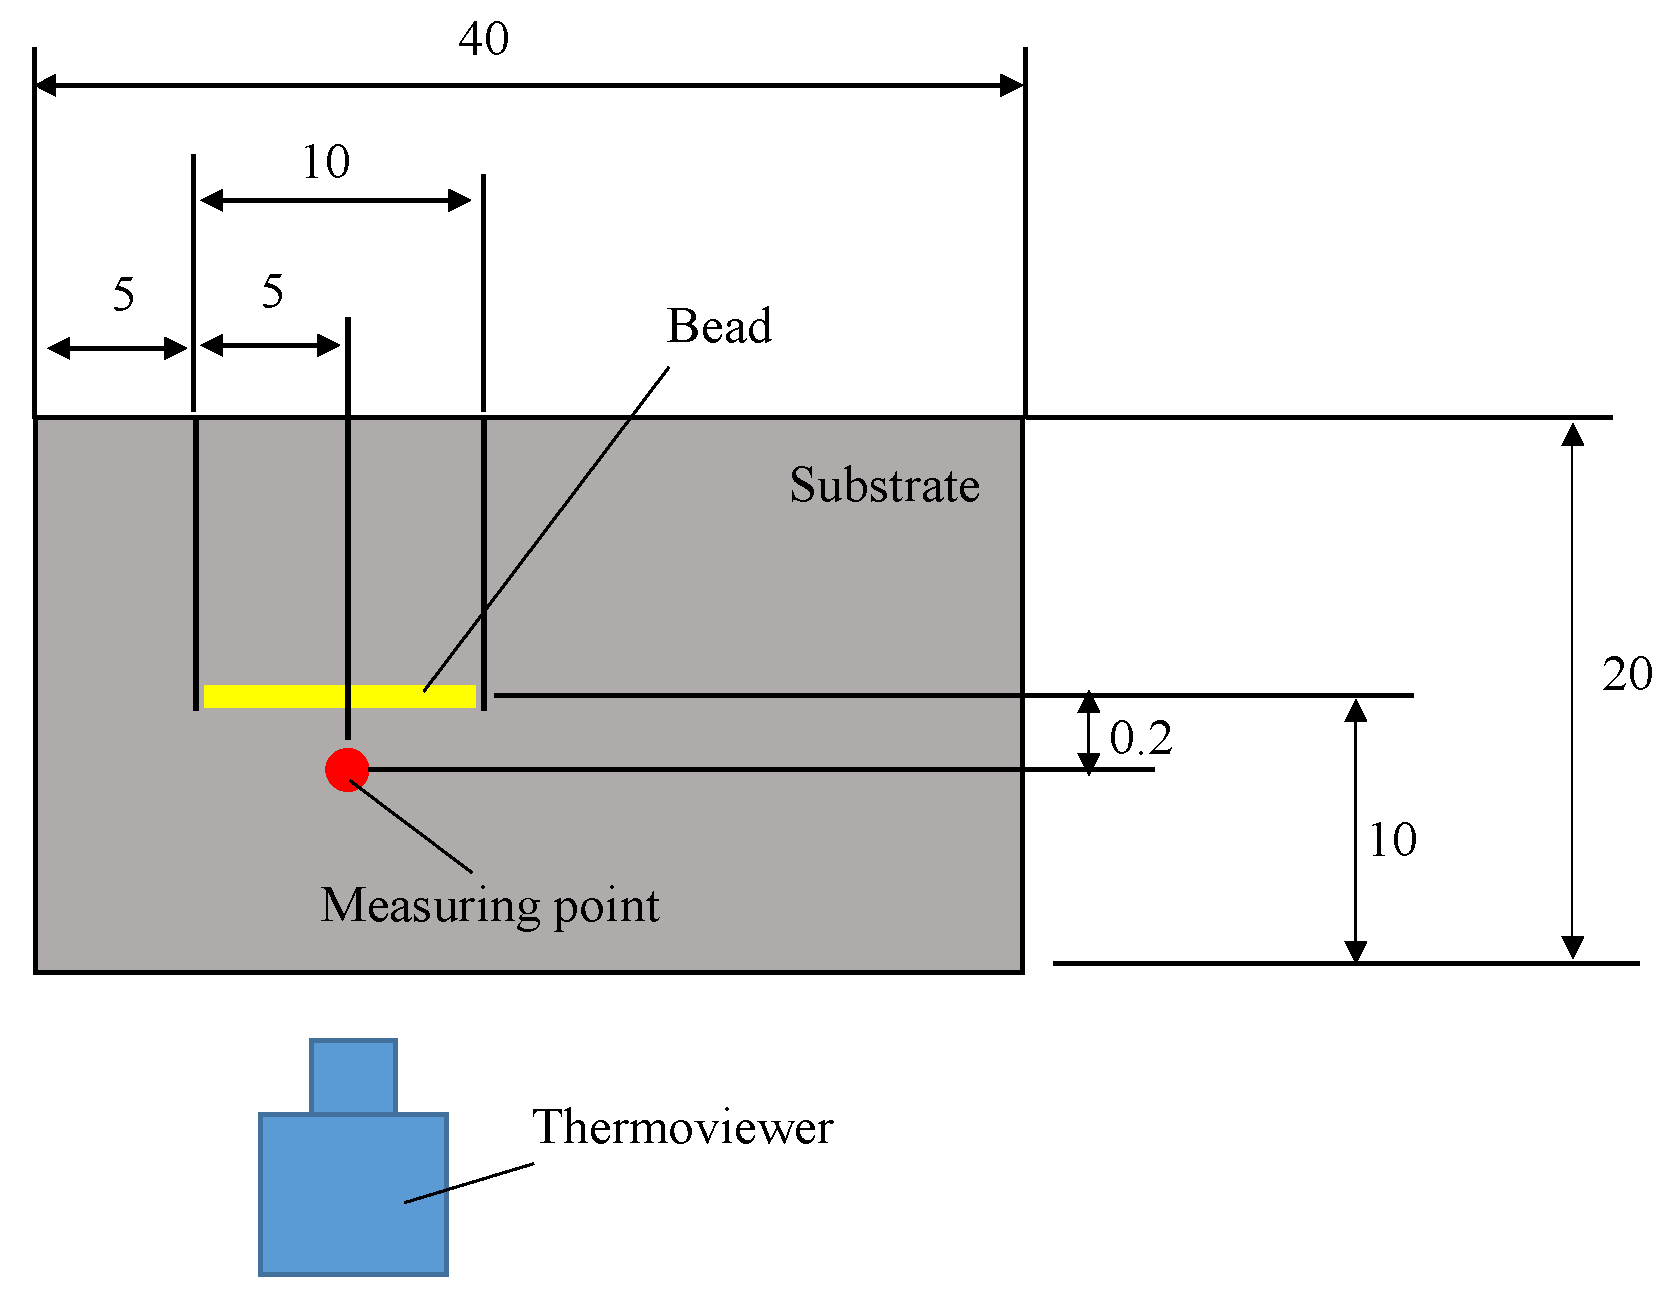
2.2. Temperature Measurement by Thermoviewer
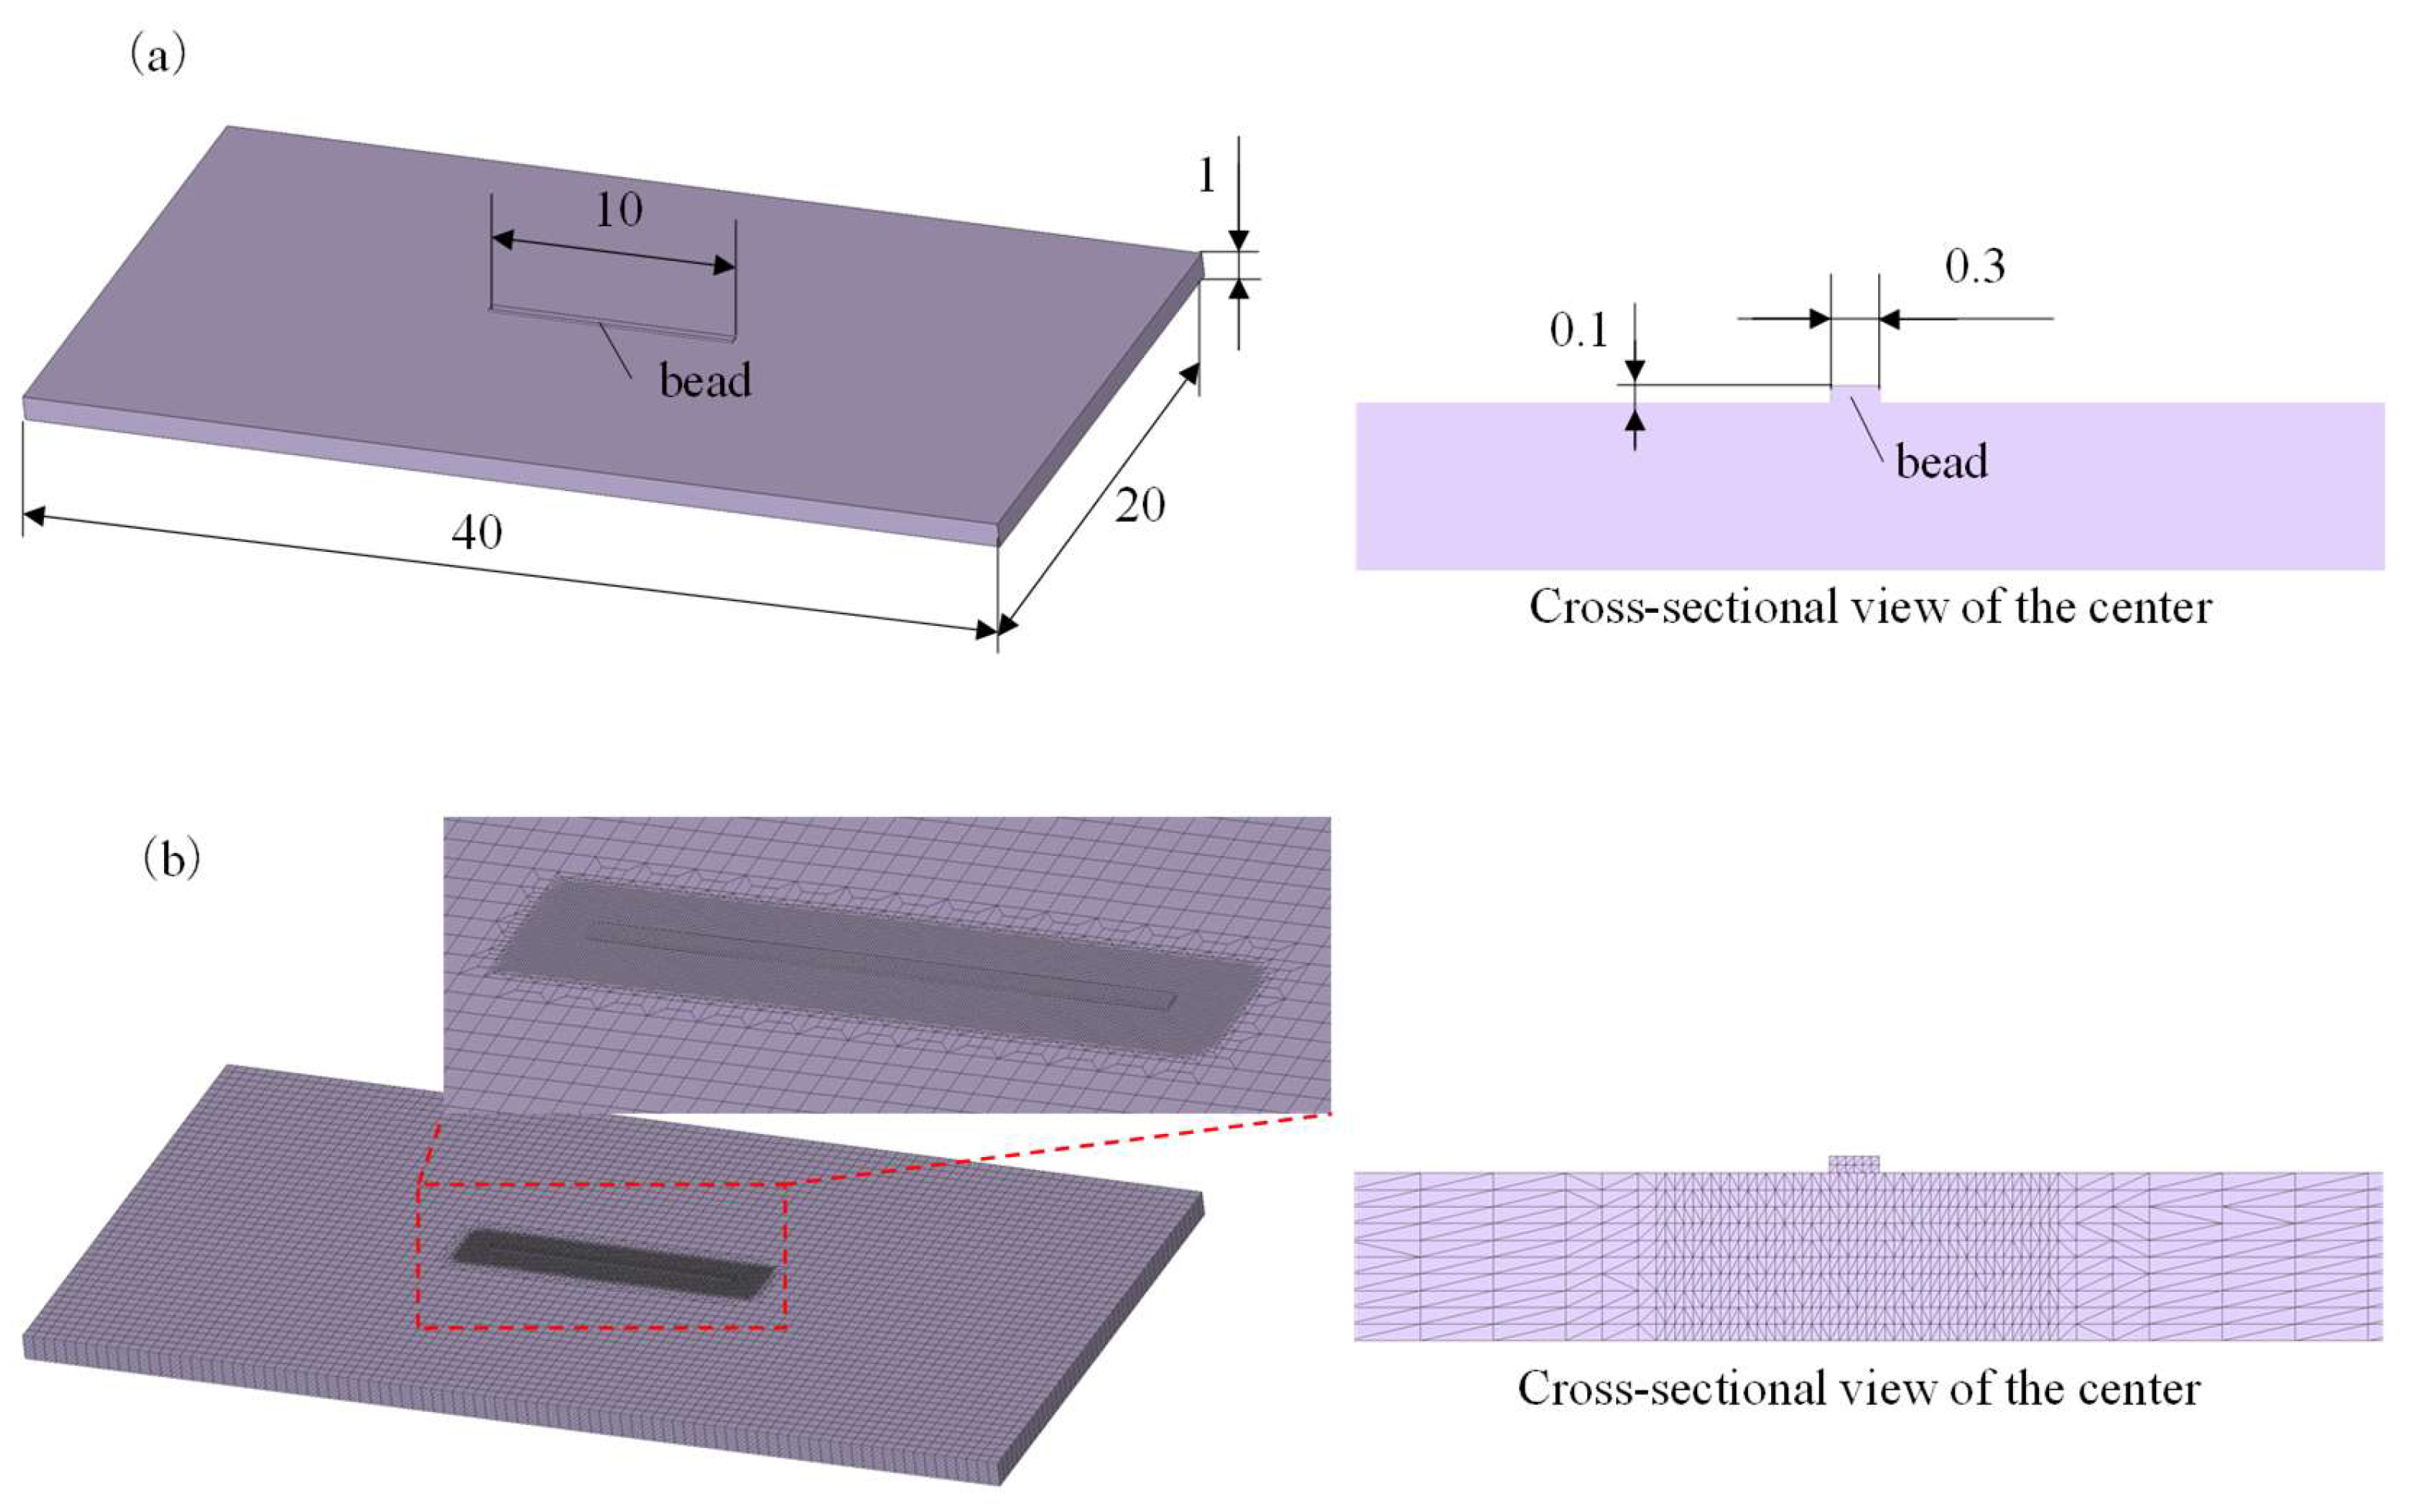
2.3. Temperature Estimation by Simulation
3. Results and Discussion
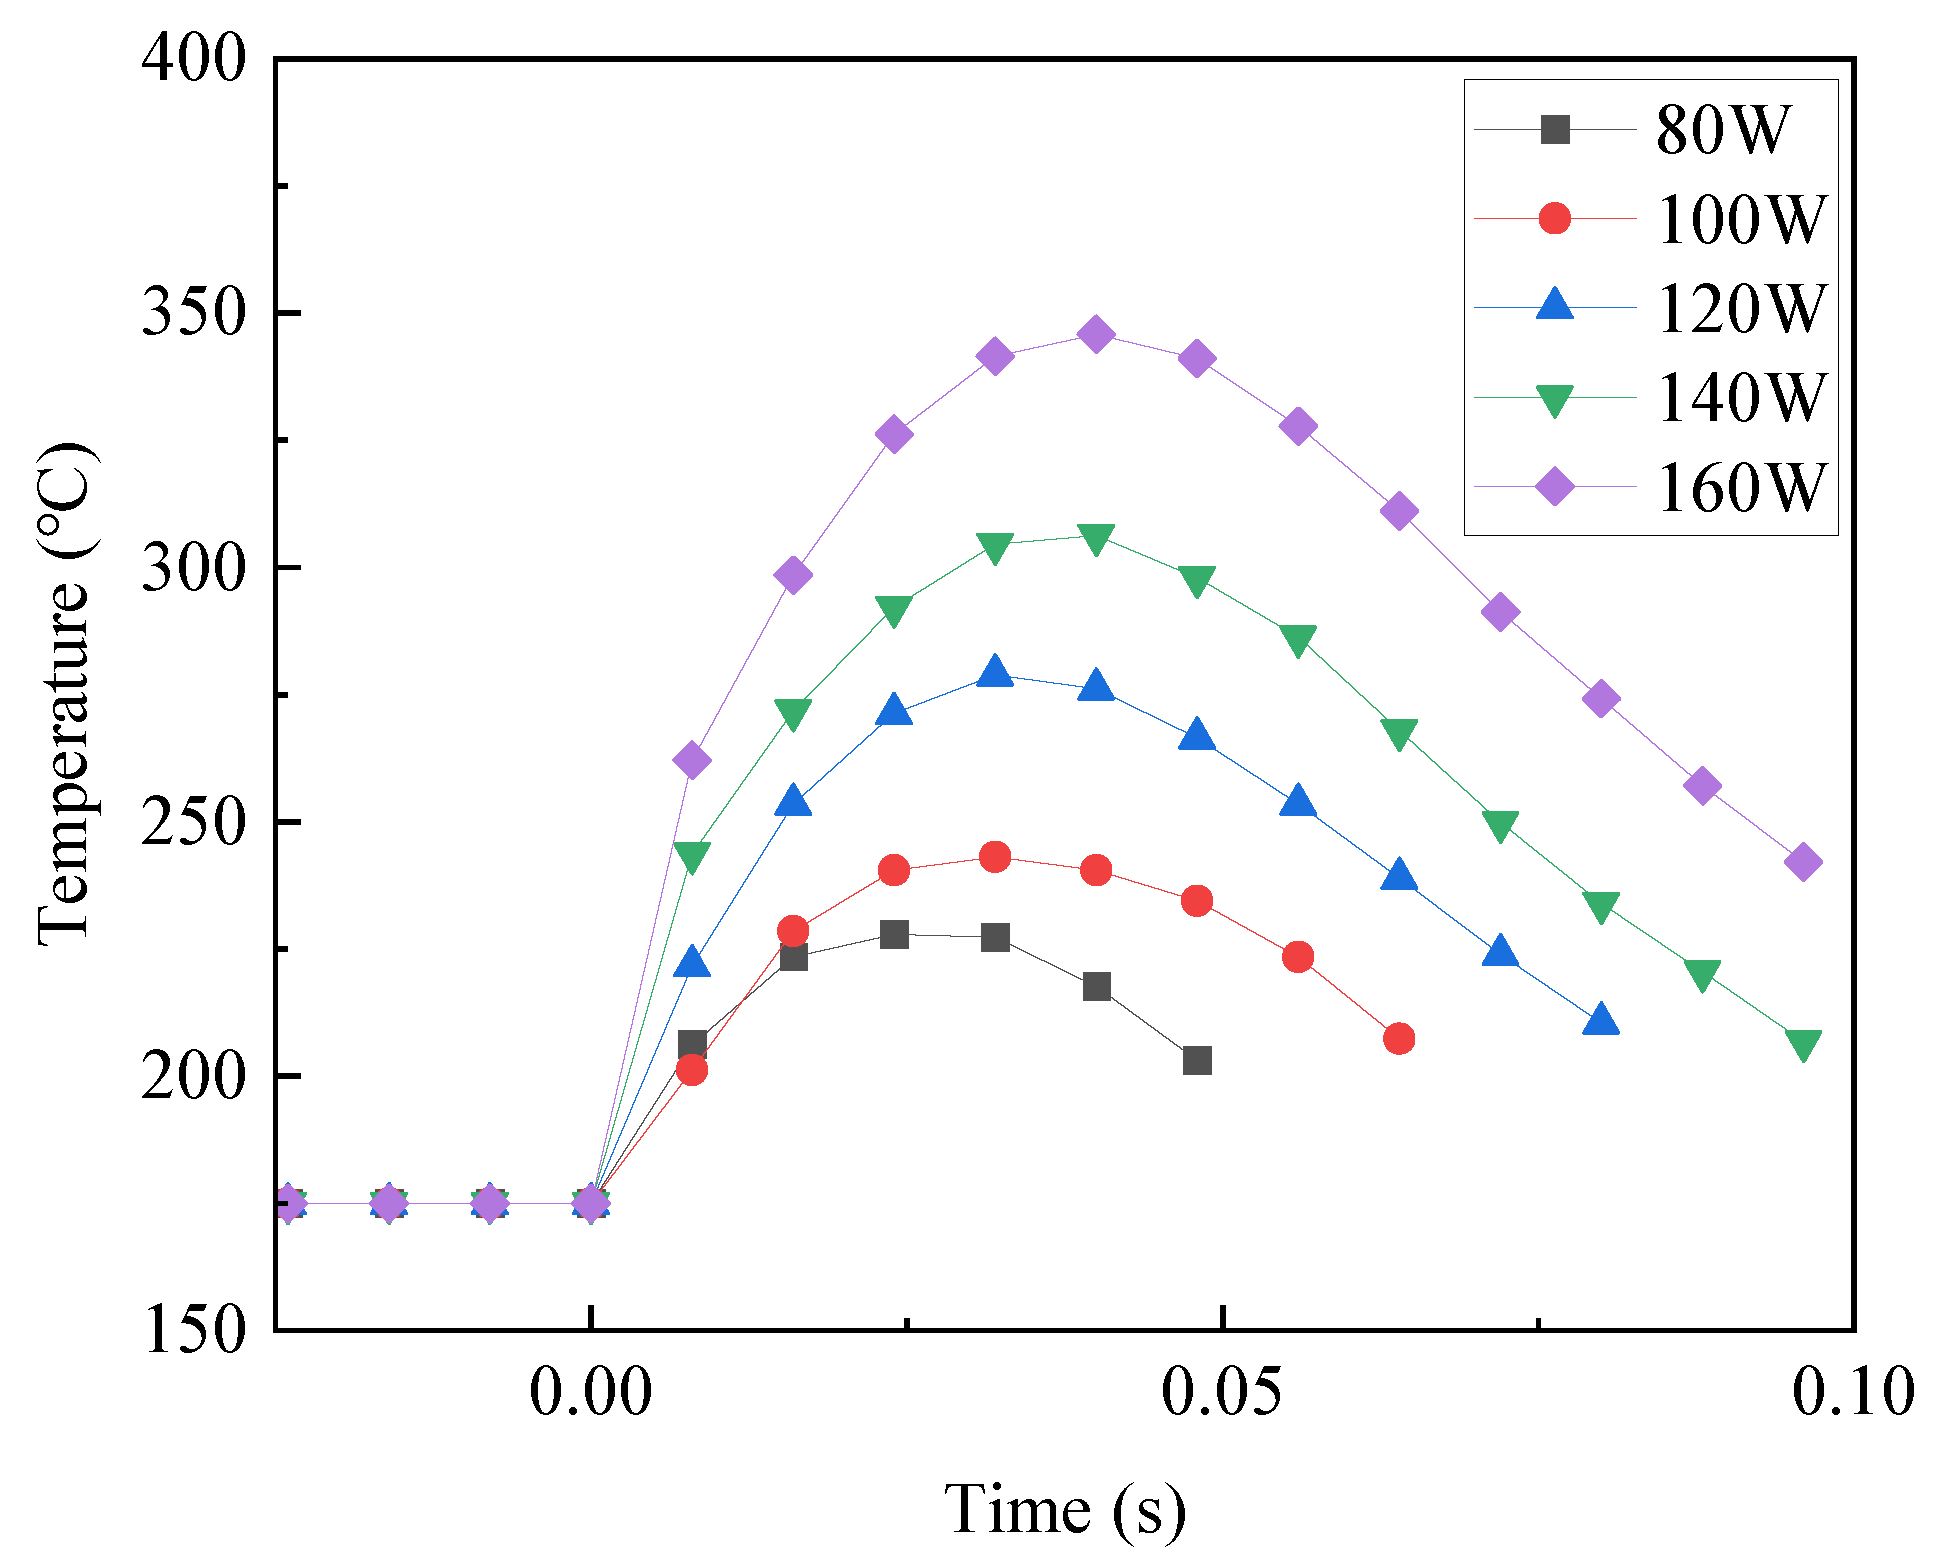
3.1. Temperature around the Bead Measured by the Thermoviewer
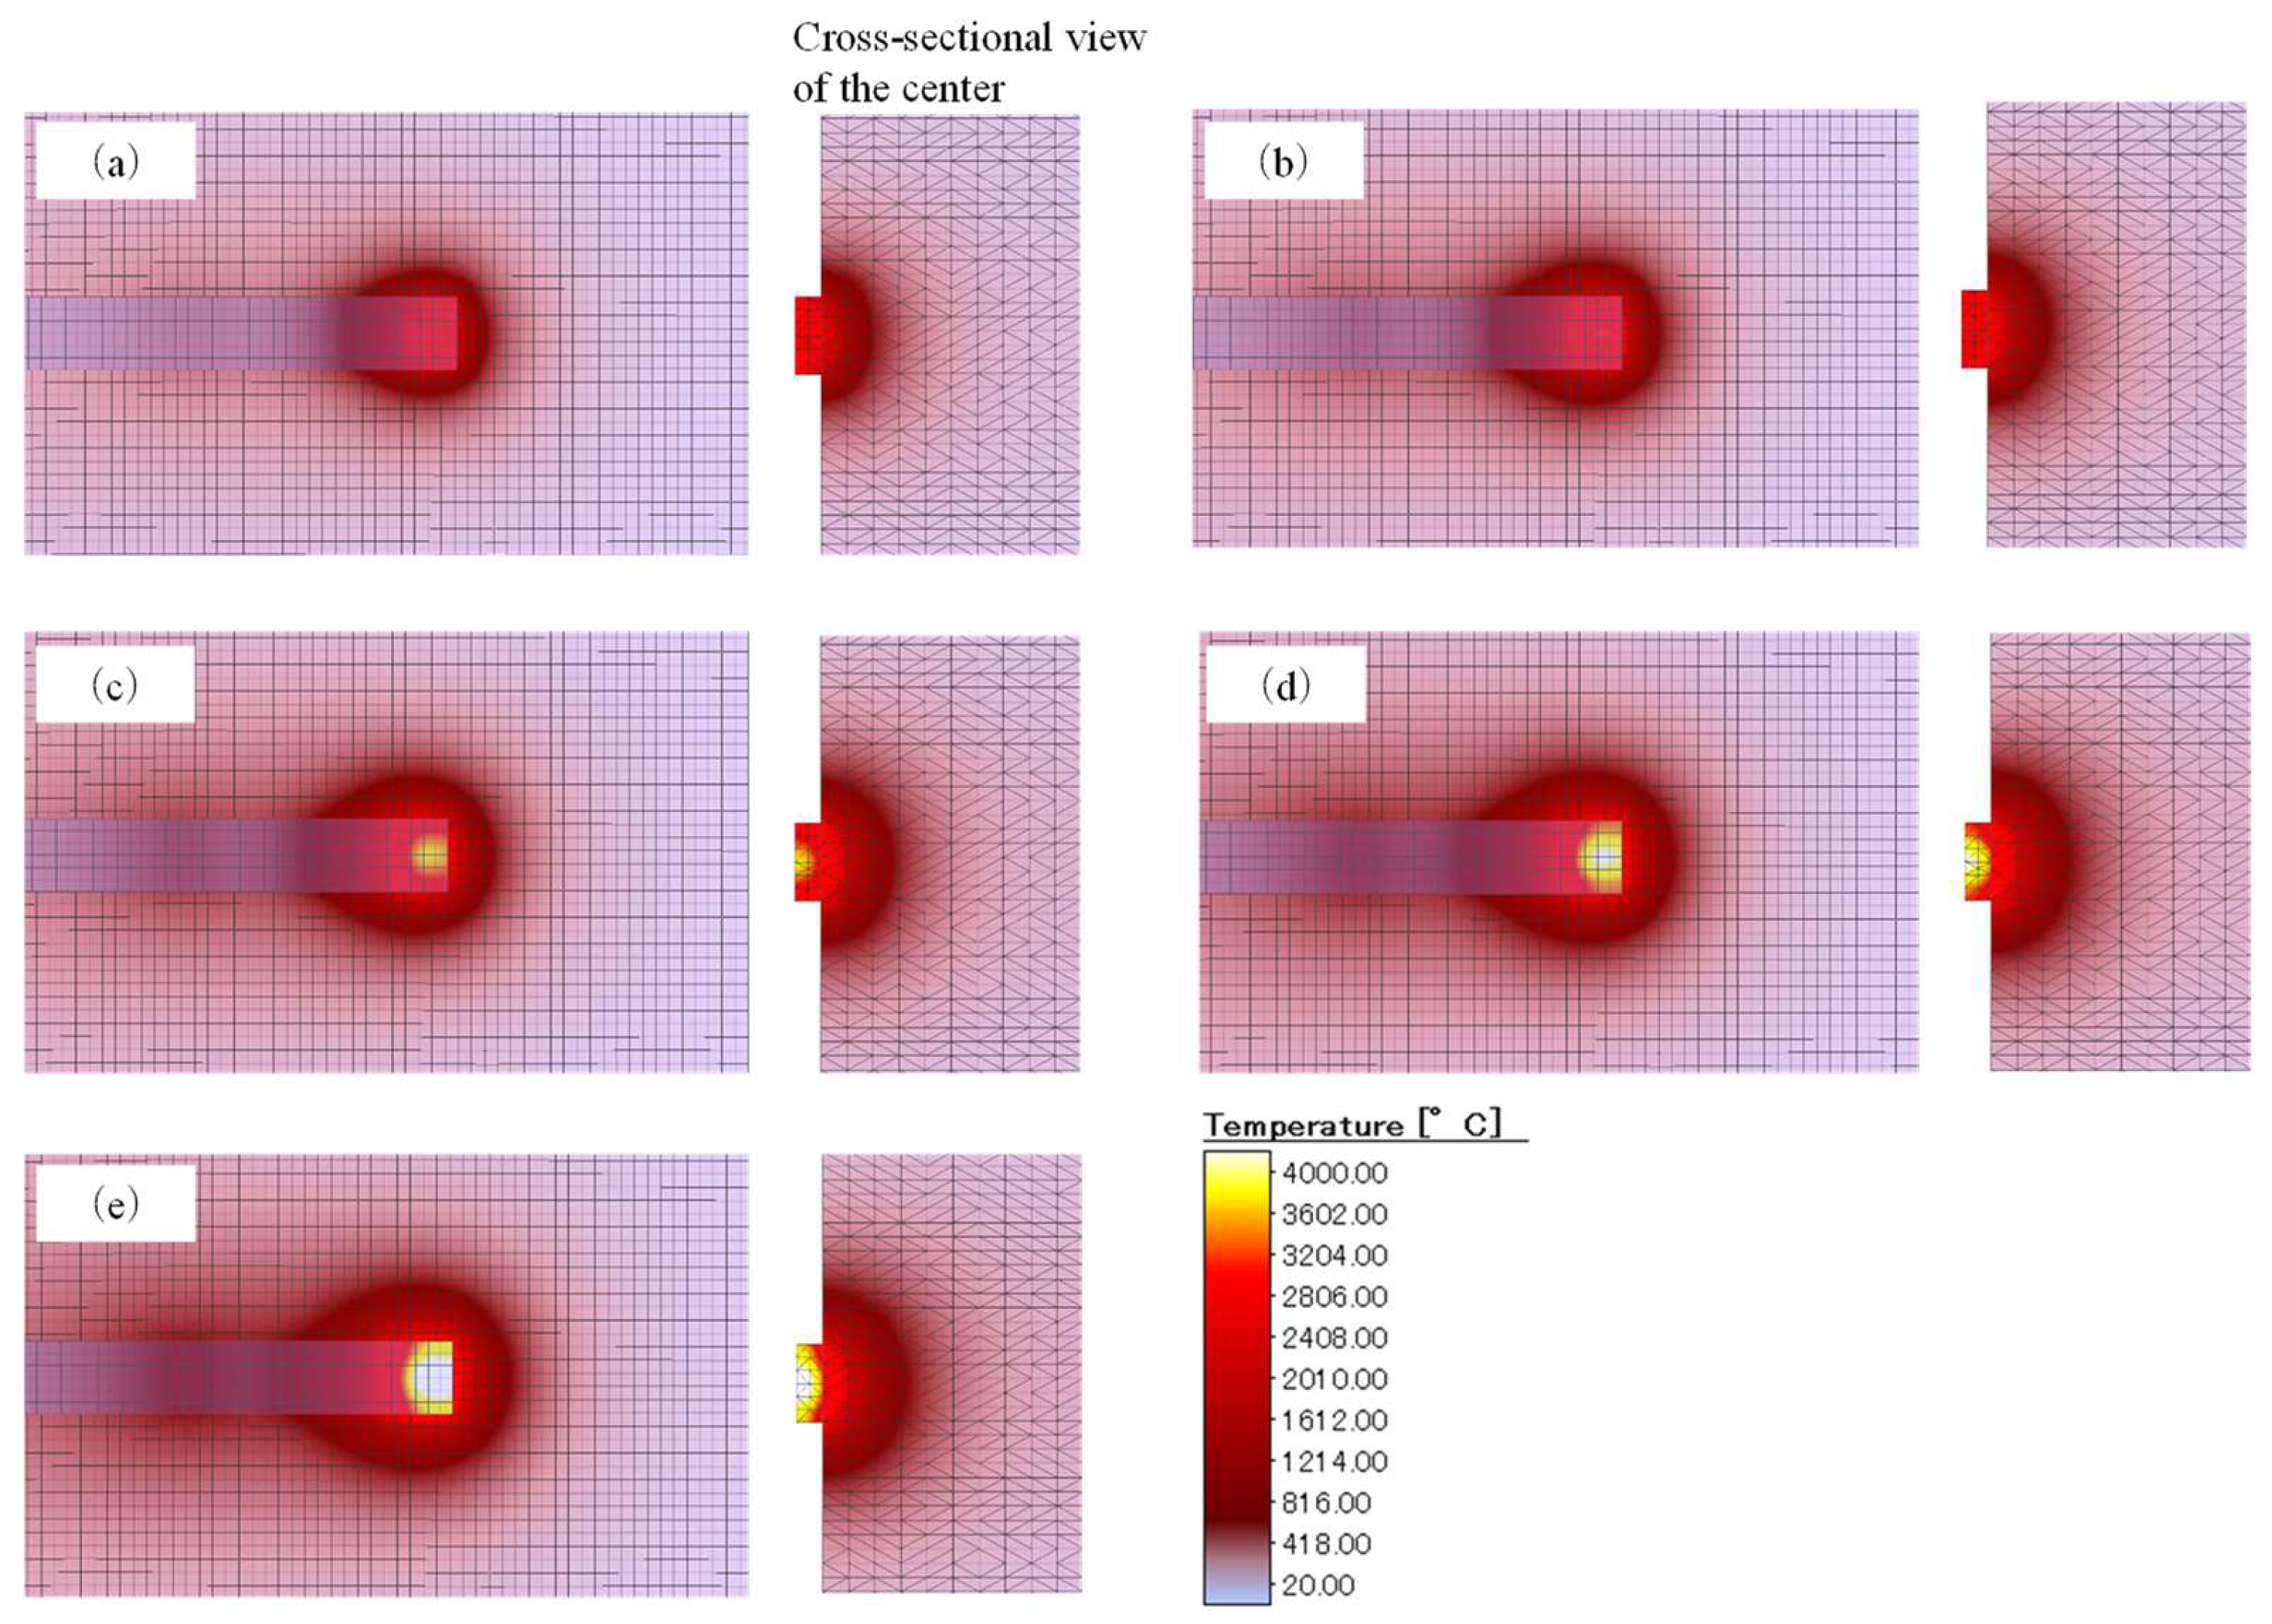
3.2. Temperature Prediction by the Simulation
4. Conclusions
- (1)
- An increase in laser power leads to an increase in substrate temperature. The substrate temperatures at a point located 0.2 mm away from the center of the bead area, with a scanning speed of 20 mm/s and laser powers of 80 W and 160 W, were found to be 229 °C and 341 °C, respectively.
- (2)
- Based on the simulation results obtained using the thermal conduction analysis software, at a laser absorption coefficient of 0.35, temperatures of the bead area were predicted to be approximately 2433 °C at a laser power of 80 W and 4491 °C at a laser power of 160 W, at a scanning speed of 20 mm/s. However, the simulated maximum temperatures at a position of 0.2 mm from the center of the bead area using the laser absorption coefficient of 0.35 did not match the experimental results obtained by thermoviewer. Considering the melting point of substrate and formed microstructures of the beads, it was suggested that the simulation results using laser absorption coefficients between 0.1 and 0.2 may indicate more accurate temperatures of the beads.
- (3)
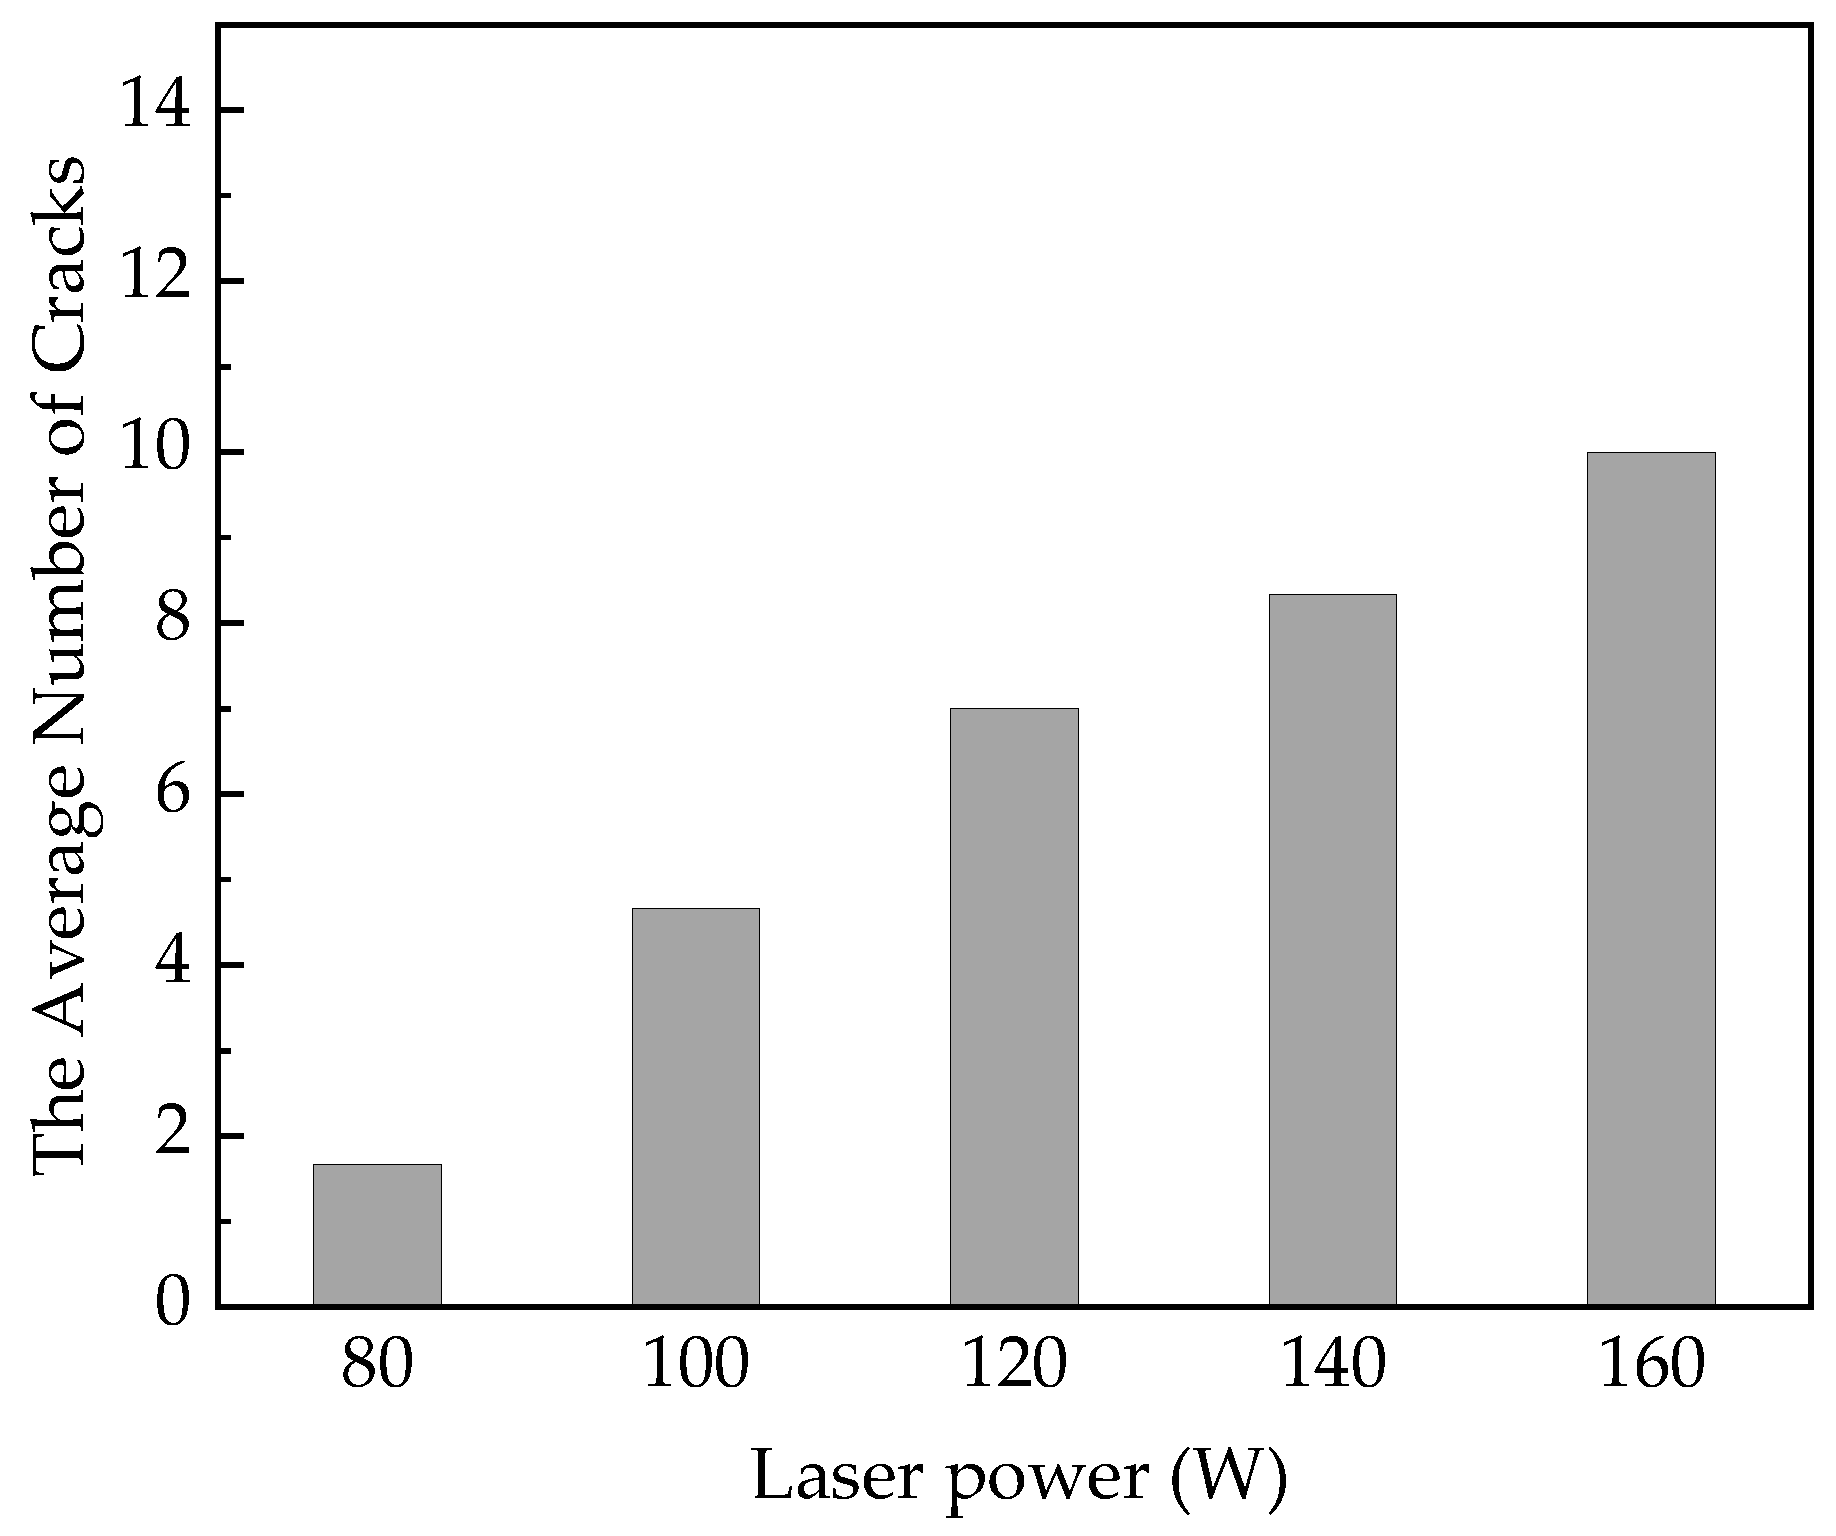
- At a laser power of 80 W, angular grains of WC phase and dendritic structures composed of M6C phase were observed in the formed bead. With the increase in laser power, the volume fraction of the WC grains decreased. In addition, it can be confirmed that the grain growth of the dendritic structures of M6C phase progressed as the laser output increased.
Author Contributions
Funding
Data Availability Statement
Acknowledgments
Conflicts of Interest
References
- Yaoita, S.; Watanabe, T.; Sasaki, T. Brazing of Cemented Carbides at Lower Temperatures. Adv. Mater. Res. 2011, 409, 865–870. [Google Scholar] [CrossRef]
- Wu, X.; Li, L.; He, N.; Zhao, G.; Shen, J. Experimental Investigation on Direct Micro Milling of Cemented Carbide. Micromachines 2019, 10, 147. [Google Scholar] [CrossRef] [PubMed]
- Algarni, M. Mechanical Properties and Microstructure Characterization of AISI ‘D2′ and ‘O1′ Cold Work Tool Steels. Metals 2019, 9, 1169. [Google Scholar] [CrossRef]
- Yamashita, Y.; Funada, Y.; Kunimine, T.; Sato, Y.; Tsukamoto, M. Formation of cemented tungsten carbide layer with compositional gradient processed by directed energy deposition. Mater. Sci. Forum 2021, 1016, 1676–1681. [Google Scholar] [CrossRef]
- Wanjara, P.; Backman, D.; Sikan, F.; Gholipour, J.; Amos, R.; Patnaik, P.; Brochu, M. Microstructure and Mechanical Properties of Ti-6Al-4V Additively Manufactured by Electron Beam Melting with 3D Part Nesting and Powder Reuse Influences. J. Manuf. Mater. Process. 2022, 6, 21. [Google Scholar] [CrossRef]
- Zhang, L.C.; Chen, L.Y.; Zhou, S.; Luo, Z. Powder bed fusion manufacturing of beta-type titanium alloys for biomedical implant applications: A review. J. Alloys Compd. 2023, 936, 168099. [Google Scholar] [CrossRef]
- Calignano, F.; Galati, M.; Iuliano, L. A Metal Powder Bed Fusion Process in Industry:Qualification Considerations. Machines 2019, 7, 72. [Google Scholar] [CrossRef]
- Kotadia, H.R.; Gibbons, G.; Das, A.; Howes, P.D. A review of Laser Powder Bed Fusion Additive Manufacturing of aluminium alloys: Microstructure and properties. Addit. Manuf. 2021, 46, 102155. [Google Scholar] [CrossRef]
- Silbernagel, C.; Gargalis, L.; Ashcroft, I.; Hague, R.; Galea, M.; Dickens, P. Electrical resistivity of pure copper processed by medium-powered laser powder bed fusion additive manufacturing for use in electromagnetic applications. Addit. Manuf. 2019, 29, 100831. [Google Scholar] [CrossRef]
- Qi, H.; Mazumder, J.; Ki, H. Numerical Simulation of Heat Transfer and Fluid Flow in Coaxial Laser Cladding Process for Direct Metal Deposition. J. Appl. Phys. 2006, 33, 101175. [Google Scholar] [CrossRef]
- Pereira, J.C.; Aguilar, D.; Tellería, I.; Gómez, R.; Sebastian, M.S. Semi-Continuous Functionally Graded Material Austenitic to Super Duplex Stainless Steel Obtained by Laser-Based Directed Energy Deposition. J. Manuf. Mater. Process. 2023, 7, 150. [Google Scholar] [CrossRef]
- Shishkovsky, I.; Kakovkina, N.; Nosova, E.; Khaimovich, A. Laser In Situ Synthesis of Gradient Fe-Ti Composite during Direct Energy Deposition Process. J. Manuf. Mater. Process. 2023, 7, 66. [Google Scholar] [CrossRef]
- Sato, Y.; Tsukamoto, M.; Shobu, T.; Funada, Y.; Yamashita, Y.; Hara, T.; Sengoku, M.; Sakon, Y.; Ohkubo, T.; Yoshida, M.; et al. In situ X-ray observations of pure-copper layer formation with blue direct diode lasers. Appl. Surf. Sci. 2019, 480, 861–867. [Google Scholar] [CrossRef]
- Saboori, A.; Aversa, A.; Marchese, G.; Biamino, S.; Lombardi, M.; Fino, P. Application of Directed Energy Deposition-Based Additive Manufacturing in Repair. Appl. Sci. 2019, 9, 3316. [Google Scholar] [CrossRef]
- Kunimine, T.; Miyazaki, R.; Yamashita, Y.; Funada, Y. Effects of Laser-Beam Defocus on Microstructural Features of Compositionally Graded WC/Co-Alloy Composites Additively Manufactured by Multi-Beam Laser Directed Energy Deposition. Sci. Rep. 2020, 10, 1–11. [Google Scholar] [CrossRef] [PubMed]
- Adachi, S.; Yamaguchi, T.; Ueda, N. Formation and Properties of Nitrocarburizing S-Phase on AISI 316L Stainless Steel-Based WC Composite Layers by Low-Temperature Plasma Nitriding. Metals 2021, 11, 1538. [Google Scholar] [CrossRef]
- Ranjan, R.; Das, A.K. Improving the Resistance to Wear and Mechanical Characteristics of Cladding Layers on Titanium and Its Alloys: A Review. Tribol. Ind. 2023, 45, 136–152. [Google Scholar] [CrossRef]
- Yamashita, Y.; Nakamura, M.; Sakai, M.; Kunimine, T.; Sato, Y.; Funada, Y.; Tsukamoto, M. In Situ Evaluation of Crack Generation Using Acoustic Emission Technique during Laser Cladding of WC-Co Cemented Carbide via Multi-Beam Laser Metal Deposition. Mater. Sci. Forum 2023, 1083, 153–158. [Google Scholar] [CrossRef]
- Brückner, F.; Lepski, D.; Beyer, E. Modeling the Influence of Process Parameters and Additional Heat Sources on Residual Stresses in Laser Cladding. J. Therm. Spray Technol. 2007, 16, 355–373. [Google Scholar] [CrossRef]
- Shi, Y.; Zhou, X.; Wang, X.; Feng, X.; Peng, L. Effects of Electromagnetic Fields on the Microstructure of Laser Cladding. Materials 2022, 15, 4198. [Google Scholar] [CrossRef]
- Itagaki, H.; Yachi, T.; Ogiso, H.; Sato, H.; Yamashita, Y.; Yasuoka, J.; Funada, Y. DC Arc Plasma Treatment for Defect Reduction in WC-Co Granulated Powder. Metals 2020, 10, 975. [Google Scholar] [CrossRef]
- Mazzarisi, M.; Campanelli, S.L.; Angelastro, A.; Palano, F.; Dassisti, M. In situ monitoring of direct laser metal deposition of a nickel-based superalloy using infrared thermography. J. Adv. Manuf. Technol. 2021, 112, 157–173. [Google Scholar] [CrossRef]
- Funada, Y.; Yamashita, Y.; Sakon, Y.; Tsukamoto, M. Development and Bead Formation Properties of Multiple Laser Coating Technology with Centered Powder Feeding. J. Smart Process. 2019, 8, 19–24. [Google Scholar] [CrossRef]
- Samsonov, G.V.; Vinitskii, I.M. Handbook of Refractory Compounds; IFI/Plenum Data Company: New York, NY, USA, 1980. [Google Scholar]
- Greenwood, N.N.; Earnshaw, A. Chemistry of the Elements, 2nd ed.; Butterworth-Heinemann: Oxford, UK, 1997. [Google Scholar]
- Buch, A. Pure Metals Properties. In A Scientific-Technical Handbook, 1st ed.; ASM International and Freund Publishing House Ltd.: Materials Park, OH, USA, 1999. [Google Scholar]
- RiuNet UPV. Available online: https://riunet.upv.es/bitstream/handle/10251/113733/ANEXO_15329653939736146149195128546168.pdf?isAllowed=y&sequence=2 (accessed on 31 July 2023).
- Ochiai, H.; Ukai, T. Weld Residual Stress Analysis of WC-Ni Cemented Carbide Using Thermo-Elastoplasticity. J. Jpn. Soc. Des. Eng. 2005, 40, 410–415. [Google Scholar]
- Gietzelt, T.; Eichhorn, L. Mechanical Micromachining by Drilling, Milling and Slotting; Kahrizi, M., Ed.; IntechOpen: Rijeka, Croatia, 2012; pp. 159–183. [Google Scholar]
- Kruth, J.P.; Wang, X.; Laoui, T.; Froyen, L. Lasers and materials in selective laser sintering. Assem. Autom. 2003, 23, 357–371. [Google Scholar] [CrossRef]
- Weber, M.J.; Dotsenko, A.V.; Glebov, L.B.; Tsekhomsky, V.A. Handbook of Optical Materials; CRC Press LCC: Washington, DC, USA, 2002; Volume 40. [Google Scholar]
- Yang, Y.; Zhang, C.; Wang, D.; Nie, L.; Wellmann, D.; Tian, Y. Additive manufacturing of WC-Co hardmetals: A review. Int. J. Adv. Manuf. Technol. 2020, 108, 1653–1673. [Google Scholar] [CrossRef]


| Parameter | Unit | Value | ||||
|---|---|---|---|---|---|---|
| Laser power | W | 80 | 100 | 120 | 140 | 160 |
| Scanning speed | mm/s | 20 | ||||
| Powder feeding rate | mg/s | 20 | ||||
| Laser wavelength | nm | 975 | ||||
| Laser focusing spot diameter | mm | 0.3 | ||||
| Specification Items | Unit | Value |
|---|---|---|
| Resolution | pixel | 640 × 120 |
| Sensitivity | K | 0.075 |
| Viewing angle | degree | 12 × 9 |
| Temperature range | °C | 200~1500 |
| Frame rate | Hz | 125 |
| Properties | Unit | SKH51 | WC | Co | WC-12mass%Co |
|---|---|---|---|---|---|
| Thermal conductivity | W/(m·K) | 22 | 29.3 | 99.2 | 35.1 |
| Specific heat capacity | J/(g·K) | 0.52 | 0.18 | 0.42 | 0.20 |
| Density | g/cm3 | 8.2 | 15.8 | 8.9 | 14.5 |
| Melting temperature | K | 1703 | 3058 | 1767 | 2823 |
| Latent heat for melting | J/kg | 272,500 | 445,000 | 260,000 | 422,800 |
| Parameter | Unit | Value | ||||
|---|---|---|---|---|---|---|
| Laser power | W | 80 | 100 | 120 | 140 | 160 |
| Scanning speed | mm/s | 20 | ||||
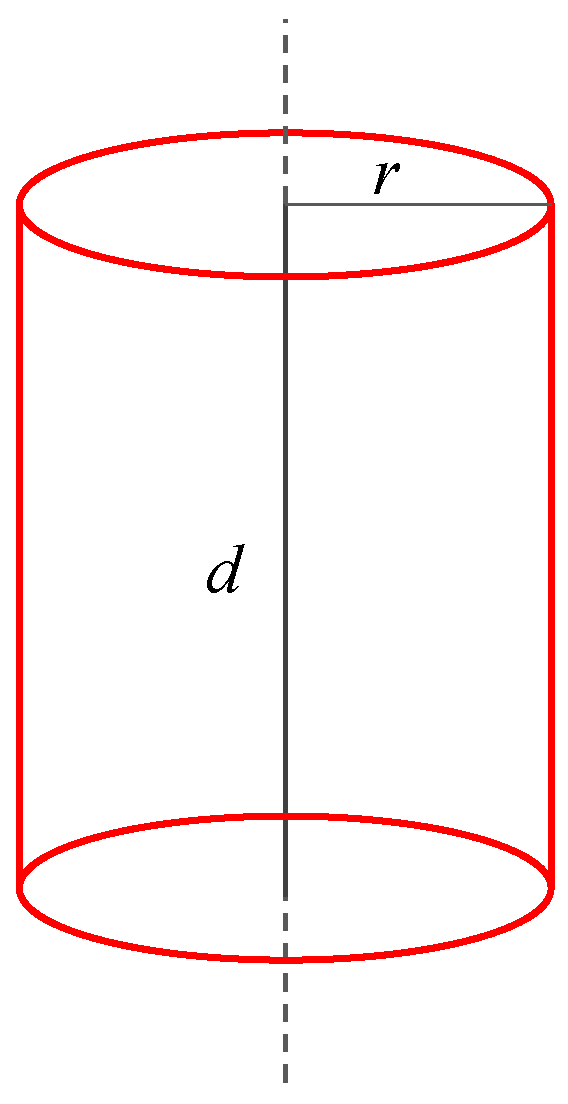
| Cylindrical heat source radius, r | mm | 0.15 | ||||
| Cylindrical heat source depth, d | mm | 0.1 | ||||
Disclaimer/Publisher’s Note: The statements, opinions and data contained in all publications are solely those of the individual author(s) and contributor(s) and not of MDPI and/or the editor(s). MDPI and/or the editor(s) disclaim responsibility for any injury to people or property resulting from any ideas, methods, instructions or products referred to in the content. |
© 2023 by the authors. Licensee MDPI, Basel, Switzerland. This article is an open access article distributed under the terms and conditions of the Creative Commons Attribution (CC BY) license (https://creativecommons.org/licenses/by/4.0/).
Share and Cite
Yamashita, Y.; Ilman, K.A.; Kunimine, T.; Sato, Y. Temperature Evaluation of Cladding Beads and the Surrounding Area during the Laser Metal Deposition Process. J. Manuf. Mater. Process. 2023, 7, 192. https://doi.org/10.3390/jmmp7060192
Yamashita Y, Ilman KA, Kunimine T, Sato Y. Temperature Evaluation of Cladding Beads and the Surrounding Area during the Laser Metal Deposition Process. Journal of Manufacturing and Materials Processing. 2023; 7(6):192. https://doi.org/10.3390/jmmp7060192
Chicago/Turabian StyleYamashita, Yorihiro, Kholqillah Ardhian Ilman, Takahiro Kunimine, and Yuji Sato. 2023. "Temperature Evaluation of Cladding Beads and the Surrounding Area during the Laser Metal Deposition Process" Journal of Manufacturing and Materials Processing 7, no. 6: 192. https://doi.org/10.3390/jmmp7060192