Article

Role of Li and Sc Additions and Machining Conditions on Cutting Forces on Milling Behavior of A7075-Based Alloys

1
Department of Mechanical Engineering, École de Technologie Supérieure, Montreal, QC H3C 1K3, Canada
2
Department of Mechanical Engineering, Ecole Normale Supérieure de l’Enseignement Technique (ENSET), 210 Avenue des Grandes Écoles, Libreville 3989, Gabon
*
Author to whom correspondence should be addressed.
J. Manuf. Mater. Process. 2024, 8(2), 83; https://doi.org/10.3390/jmmp8020083
Submission received: 30 March 2024 / Revised: 11 April 2024 / Accepted: 14 April 2024 / Published: 19 April 2024

Abstract

:
The present study focuses on the dry and wet end milling of three distinct Aluminum 7075 alloys: A7075, A7075–Sc (with a 0.18% Sc addition), and A7075–Li–Sc (containing 2.2% Li and 0.18% Sc additions). The main objective is to explore how cutting parameters (cutting speed and feed rate), heat treatment, alloy composition, and cooling methods influence A lcutting force. In the initial phase of the investigation, all three alloys underwent heat treatment. Subsequently, the machining process centered on the softest and hardest conditions, aiming at analyzing the impact of hardness on machinability behavior of the three studied alloys, using the same milling tool and a consistent depth of cut under both dry and wet conditions. The investigations also highlight the role of Li and Sc additions on the quality of surface finish, as well as burr and chip formation. In total, a sum of 108 operations have been performed on the present alloys.

1. Introduction

Three steps are involved in precipitation hardening: (i) solution heat treating; (ii) rapidly quenching the solution heat-treated sample to a lower temperature, followed by (iii) aging (natural aging or artificial aging at a specific temperature and for a specified duration). During solution heat treatment, the alloy is heated to a temperature at which the alloying elements dissolve in the alloy. To keep the alloying elements trapped in solution, the solution-treated alloy is rapidly quenched to room temperature. Quenching is followed by the aging process, in which dissolved alloying elements start to form fine particles, leading to an enhancement of the alloy hardness. The main reason why these fine particles increase the alloy hardness is that they create obstacles preventing dislocation movement. Natural aging and artificial aging are two possible aging processes for aluminum alloys. In the natural aging of Al alloys, precipitation takes place at room temperature, usually after a long period of time, while artificial aging is accomplished through heating to a predetermined temperature for a certain amount of time [1,2,3,4].
The hardness and strength of aluminum 7075 alloys can be attributed to several strengthening mechanisms that occur during the heat treatment process, including solid solution strengthening, precipitation hardening, grain refinement, and cold working. A combination of these mechanisms can lead to a significant increase in the hardness and strength of the alloy, making it suitable for high-stress applications in the aerospace, automotive, and defense industries [5,6]. Aluminum-lithium (Al-Li) alloys are a family of lightweight alloys that have been developed to meet the high-performance requirements of aerospace and defense applications. These alloys typically have a higher strength-to-weight ratio and stiffness compared to conventional aluminum alloys [7]. In other words, each additional weight percent of lithium results in a density reduction of about 3% and an increase in Young’s modulus of about 6%.
In the research conducted by Suresh et al. [8], it was demonstrated that the addition of Sc and Zr elements to thermo-mechanically processed AA2195 Al-Li alloy resulted in the formation of Al3(Sc,Zr) particles. These particles played a crucial role in grain refinement and had a notable impact on the stability of the sub-grain structure. In addition, adding Ag and Zn to the alloy resulted in a marked increase in the alloy strength. In the case of Ag-containing alloys, T and η phases were observed in the microstructure. It is suggested that the precipitation sequence can be expressed as SSS → η–type cluster → GP zone → η′ → η → T, since Ag promotes the precipitation of the T-phase [9].
Milling is a fundamental machining process used in die, aerospace, automotive, and machinery design, as well as in manufacturing industries, to remove metal and obtain milled surfaces, which are widely used to mate with other parts [10]. In the milling operation, a rotating cutting tool provides the cutting action, while the movement of the workpiece clamped on a table performs the feed action. The shapes of milling cutters and the number of their cutting edges (teeth) vary, depending on the application. Each tooth cuts away an arc-shaped segment whose thickness is determined by the feed or tooth load.
Although feeds in this operation are typically light, ranging between 0.025 mm and 0.25 mm, the metal removal rate is relatively high due to the high cutting speed and the large number of teeth involved. The output variables that are identified as dependent variables or responses can be classified as process variables and effect variables. Process variables emerge during the process; therefore, they are detectable and measurable only during the machining process. Cutting force, chip formation zone temperature, and acoustic emissions are some of the well-known outputs of this category. After machining, effect variables can be measured for different elements, including the workpiece (dimension accuracy, surface roughness), the tool (wear), the machine tool (increase in temperature, wear), and the cutting fluids (increase in temperature) [11]. The use of cutting lubricants can significantly affect the contact length and cutting forces. At very low cutting speeds, the lubricant can prevent seizure and greatly reduce the forces. Although at higher speeds, seizure cannot be prevented near the edge, liquid or gaseous lubricants can restrict the area of seizure to a small region by penetrating from the periphery [12].
Another aspect to be considered is the need to establish a means to assess sustainability with a proposed three-tiered categorization—identifying energy-efficient solutions from energy-saving and health issues perspectives [13]. The work of Astakhov [14] explains main areas for improving sustainability of machining operations, in terms of modeling the cutting process and in the design of practical machining operations. Lubrication during milling is also an area of great importance. Implementation of MQL (minimum quantity lubrication) demonstrated an improvement in tool life and surface finish by minimizing heat generation in the cutting zone, thereby reducing environmental issues and costs [15]. However, application of nano fluids would be difficult to employ as a sustainable coolant from an economic point of view. Therefore, in these circumstances, the MQL/hybrid MQL should be a strong candidate for lubrication.
The purpose of this research is to develop a comprehensive understanding of the fundamental machining of Aluminum 7075 alloys, including A7075, A7075–Sc (with a 0.1% Sc addition), and A7075–Li–Sc (2.2% Li and 0.18% Sc addition).
The specific objectives of this study are as follows:
(1)
To investigate how precipitation hardening, with variations in aging times and temperatures, and alloying with lithium affect the mechanical properties of A7075 alloys.
(2)
To investigate cutting forces during the machining of A7075 alloys and analyze how the specified inputs influence cutting forces in these specific alloys.

2. Experimental Procedure

The methodology of this study involves the use of a multi-level full factorial design of the experiment. This study aims to investigate the effect of various factors on the machining of three A7075 alloys, namely, A7075, A7075-Sc, and A7075-Li-Sc. Table 1 lists the chemical compositions of the used alloys. The alloys were subjected to solution heat treatment at 8 h @ 47 °C, followed by two distinct aging heat treatments at 8 h @ 280 °C and 24 h @ 120 °C, respectively (see Table 2, depicting the details of aging treatment). The experiments were conducted under dry and wet milling conditions. Figure 1 depicts the cutting tool configuration. Table 3 lists the experimental variables and their levels.
This study investigated 12 different conditions. These conditions were obtained by using a Cartesian multiplication of three distinct variables, namely, material, heat treatments, and dry or wet conditions, resulting in 3 × 2 × 2 = 12 unique combinations. For each of the 12 conditions, nine tool paths were implemented, determined by varying the cutting speed and feed rate parameters, resulting in 3 × 3 = 9 unique tool paths for each condition. Therefore, a total of 108 experiments were conducted. Table 4 provides the test parameters for the nine tool paths, which were repeated for each of the 12 conditions. The dimensions of the workpiece were 23 × 75 × 100 mm.
Following heat treatment, the samples were mounted using an automatic mounting press (Struers CitoPress-5, Champigny, France). The mounted samples were then subjected to grinding (sanding) using silicon carbide waterproof papers. The order of grit sizes was 120/P120, 240/P280, 320/P400, 400/P800, and 600/P1200. The grinder used was the Pace Technologies Nano 2000T grinder. Subsequently, 3 μm and 1 μm monocrystalline diamond suspension from Met Lab Corporation were utilized to polish the samples, followed by a finishing step using 0.06 μm colloidal silica blue (10 pH) from Met Lab Corporation. A load of 100 g (0.9807 N) was applied to all samples during the measurement. Each sample was measured at ten different points and the average was calculated as the final microhardness value for that sample.
In total, 108 experimental tests were conducted in the context of dry and wet milling, utilizing a 3-axis CNC machine tool featuring the following specifications: a power output of 50 kW, a rotational speed of 28,000 rpm, and a torque of 50 Nm. Milling was performed using uncoated carbide end milling cutting tools with a three-flute design (with z = 3) and a 10 mm diameter. The measurement of the three cutting force components (Fx, Fy, and Fz) was carried out during the machining process utilizing a 3-axis dynamometer (Kistler, model 9255-B), which was mounted in the milling machine. A sampling frequency of 12 kHz was used to acquire the cutting force signals. In the cutting plane, the Kistler 9255B three-axis dynamometer can measure forces ranging from −20 KN to 200 KN, and in the vertical plane, it can measure forces from −10 KN to 40 KN.

3. Results and Discussion

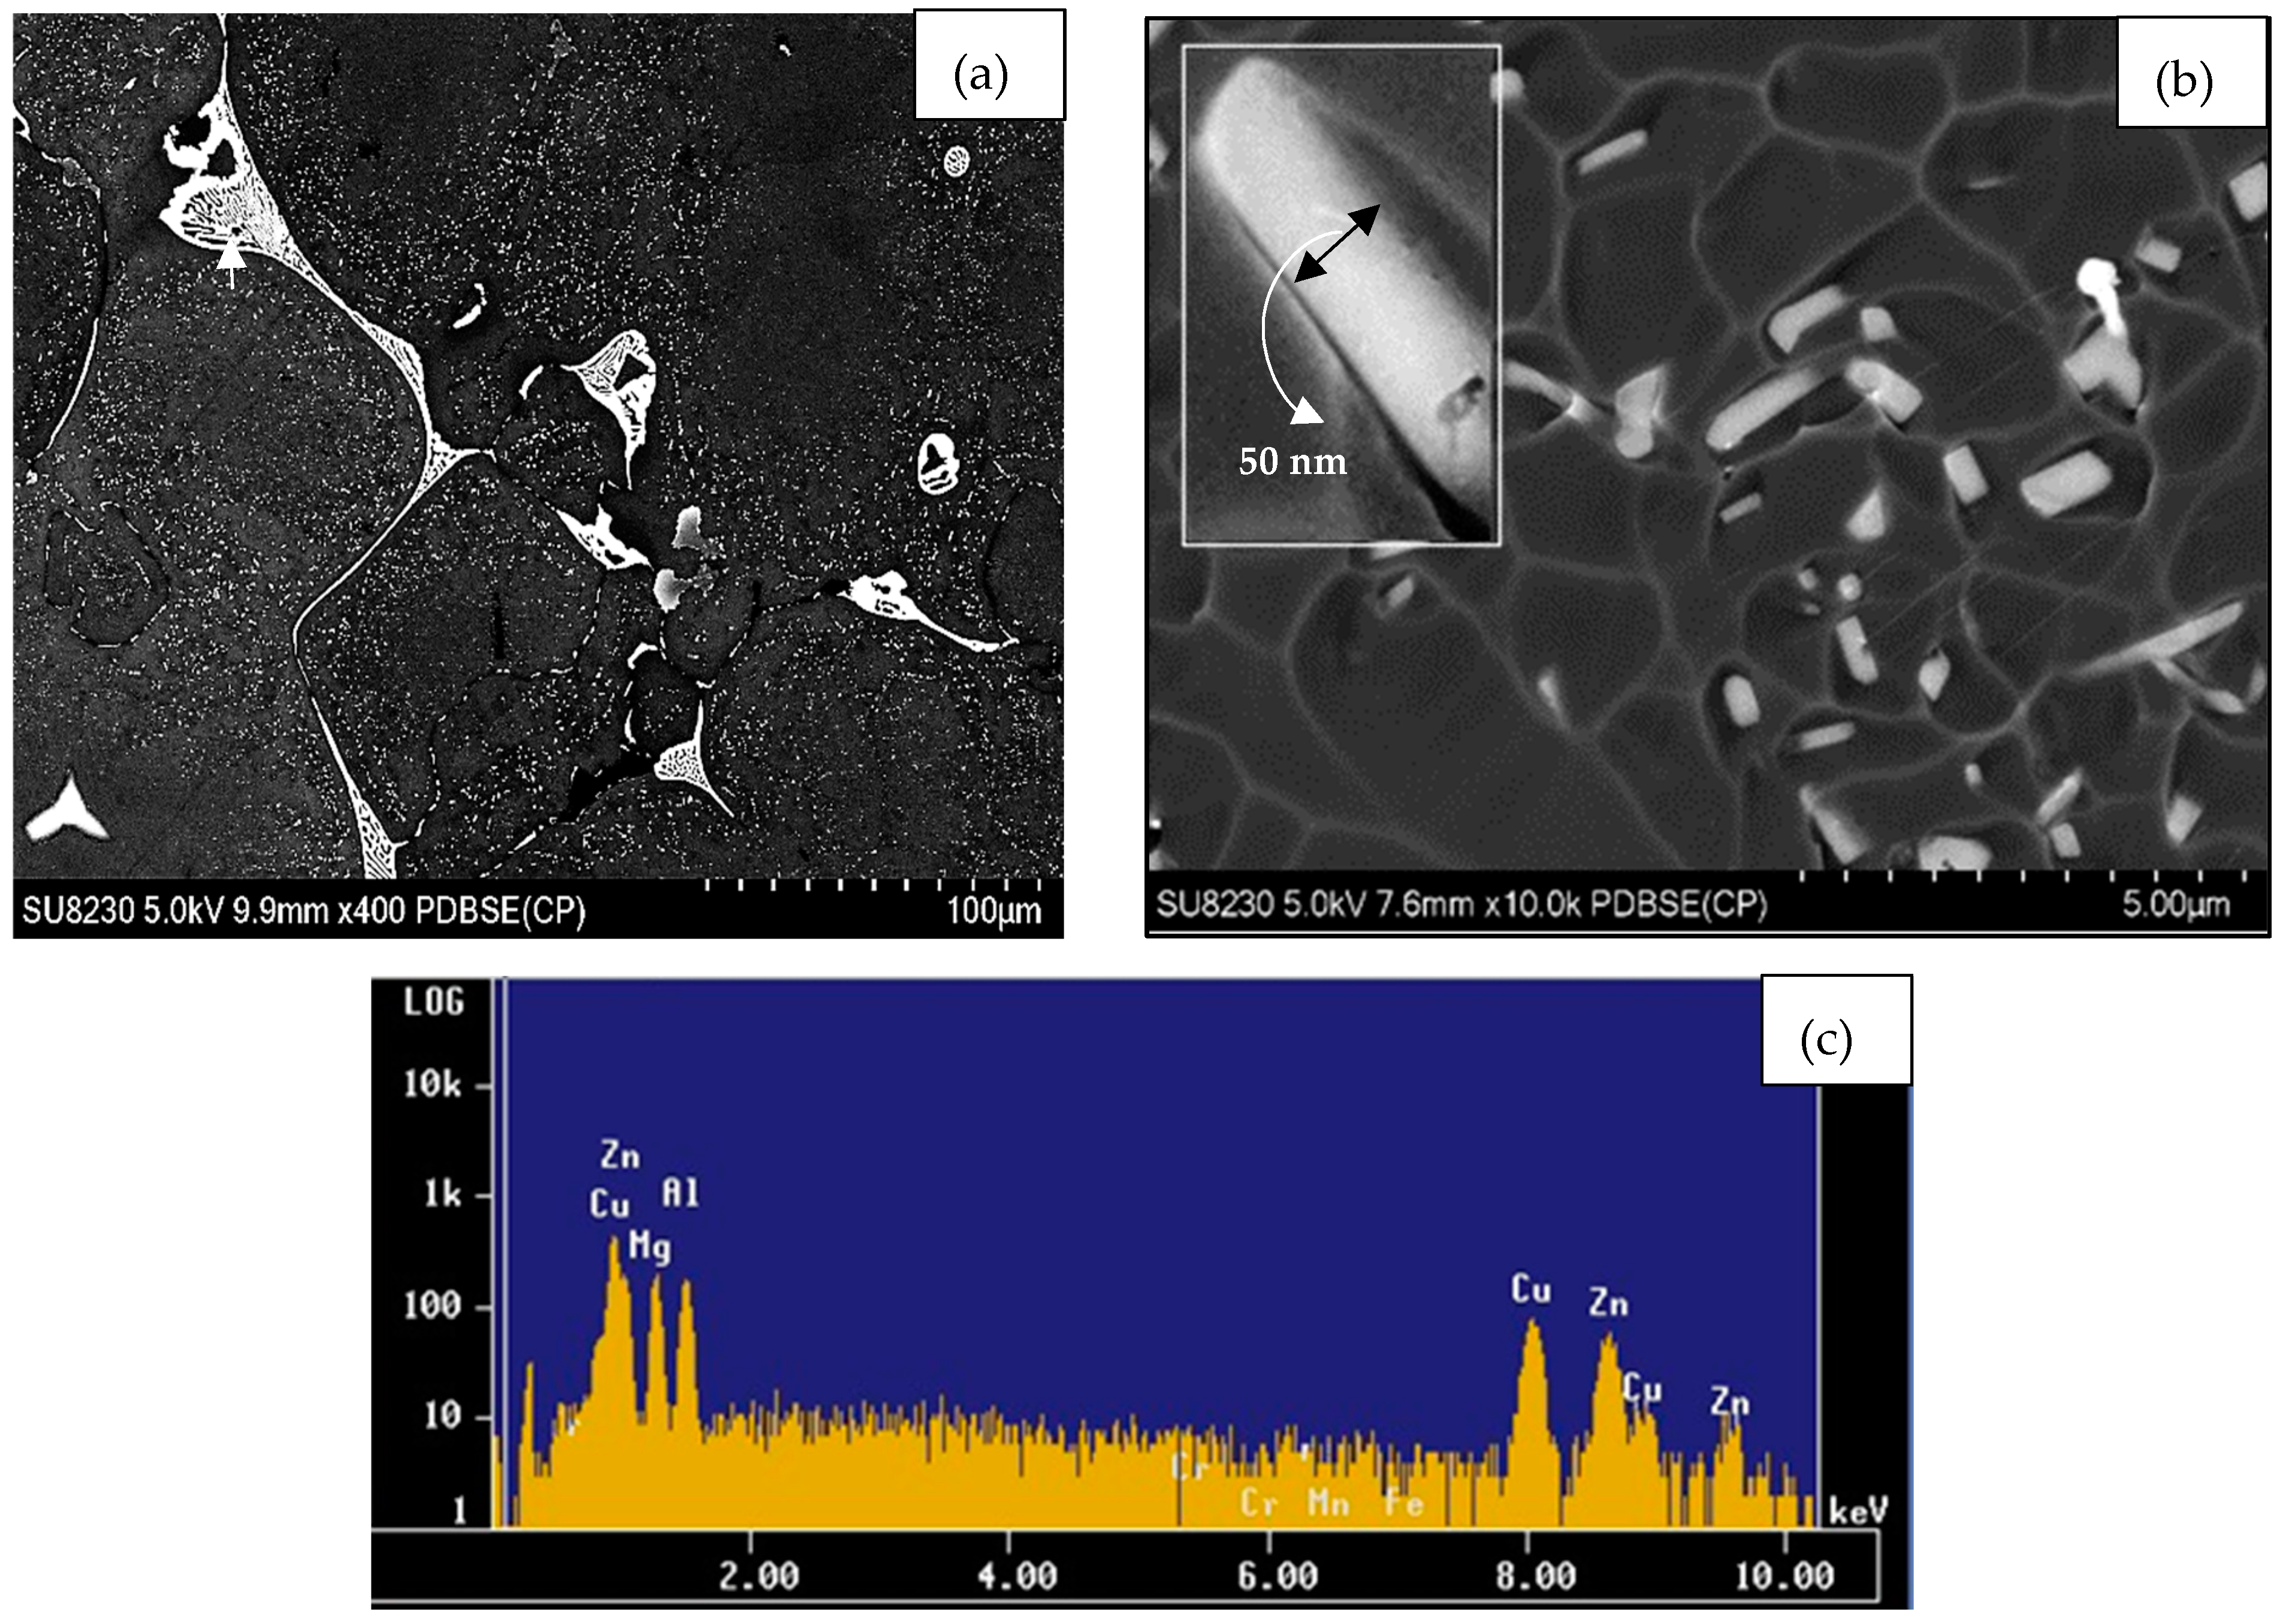
3.1. Microhardness and Microstructural Characterization

The measured microhardness results for the A7075 alloy are summarized in Table 5. An examination and analysis of the corresponding microstructures using SEM/EDS, as discussed in subsequent sections, will shed further light on the reasons behind the observed microhardness values.
Lithium is characterized by low density (0.534 g/cm3), compared to the density of pure aluminum (2.7 g/cm3). Thus, the lightweight and high strength of Al-Li alloys would enhance performance in aerospace applications [15]. Furthermore, during the applied heat treatment processes, both alloys exhibited almost no difference in their microhardness. When alloys were aged at 120 °C for 24 h, the microhardness of the base A7075 alloy recorded 198 VHN, almost 22 units higher than that of A7075–Sc alone, due to the formation of small, uniformly dispersed precipitates [16].
Figure 2 depicts the variation in the grain size of as-cast alloys as a function of alloy composition. The base alloy, Figure 2a, exhibits the grain size distribution in the base alloy A7075 (the average grain size is in vicinity of 300 µm). With the addition of 0.18% Sc (A7075+Sc alloy), the average grain size was dropped to about 70 µm, representing a reduction of about 75% in the grain size of the base alloy (Figure 2b). This observation indicates the strong refining effect of Sc-rich precipitates (dispersoids) in restricting grain growth [17,18,19,20,21,22,23,24]. Hall and Petch suggested that alloy strength (σ) varies with the inverse square root of the grain size (d):
σ = σ0 + kd−0.5
where k is the stress required to initiate plastic flow at a grain boundary, and σ0 is the resistance to dislocation motion [25,26,27,28,29].
The source of the grain-refining efficiency of L12 Al3Sc for α-Al may be explained in terms of the identical crystal structures of Al3Sc and α-Al, in addition to the very low lattice misfit between the two phases (~1.5%) [30,31]. Krug et al. [32] examined the distributions of precipitates in heat-treated Al-Li-Sc and Al-Li-Sc-Yb alloys, and found that nano-sized α-Al3(Li,Sc,Yb)(L12) precipitates were formed after isothermal aging at 325 °C, during which, at times, δ’-Al3Li(L12) shells also formed on these precipitates after further aging at 170 °C. Figure 2c displays the effectiveness of Sc as a grain refiner, as inferred from the EBSD technique. The interaction between Li and Sc results in coarser grains in the A7075+Li+Sc alloy, compared to those in A7075+Sc alloy. Figure 2d–f depict the variation in the grain distribution as a function of the added Li and (Li+Sc). The histogram exhibits a skewed distribution pattern towards the low values of grain size in the B alloy, followed by spreading across the total range when Sc is added to the Al-Li alloy, due to the Li-Sc interaction in the A7075-Li-Sc alloy.
Figure 3 displays the microstructure of the alloy A7075 in the as-cast condition, aged at room temperature for 7 years (T5). In the as-cast condition, the 7075-type alloys form several intermetallics, mainly (Fe,Cr)3SiAl12, Mg2Si, and a pseudobinary eutectic consisting of Al and MgZn2 or Mg(Zn,Cu,Al), as shown by the white arrow in Figure 3a [33,34,35,36,37]. In addition, dense precipitation is seen covering the grains, particularly in the vicinity of the pre-existing intermetallics, moving towards the center of the grain. The high-magnification micrograph shown in Figure 3b reveals that these particles are rather short platelets (or rods) of 20–50 nm thickness (the inset micrograph). The EDS spectrum corresponding to the white eutectic area in Figure 3a is presented in Figure 3c, confirming the composition of this phase as Mg(Zn,Cu,Al).
Figure 4 represents the microstructure of the A7075+Sc alloy following aging at 120 °C for 24 h (T6 temper), revealing dense precipitation of Al2Cu phase in the form of fine spherical particles extending up to the grain boundaries (Figure 4a). Since the atomic number of Li is 3 which is below the detection level on the SEM, only the impression of the precipitates (black spots) can be observed as can be seen in Figure 4b. Figure 4c shows the shape and size of δ’-Al3Li phase particles using high resolution TEM techniques, with the formation of precipitate-free zones [38].
Several researchers have proposed that during the age-hardening treatment, this process follows the sequence of a saturated solid solution → GP zones → ή (MgZn2) → η (MgZn2). The orthorhombic S-(Al2CuMg) phase may also take place [40]. During the aging process, Ag addition contributes to the formation of dense fine rod-like T1-Mg32(Al, Ag)49 phase particles. According to [41], ledges of the Ω phase could attract Cu atoms from the surrounding matrix, resulting in the formation of the Al2Cu (Ω) crystals. The main hardening precipitate, η’, is a metastable hexagonal phase, semi-coherent with the Al matrix (a = 0.496 nm, c = 1.40 nm, where aAl = 0.405 nm) [42,43,44,45,46]. The equilibrium phase, η, is a hexagonal phase, with a = 0.5221 nm and c = 0.8567 nm. Thus, in summary, for higher Zn/Mg (≥2.2, at.%) alloys, the precipitation sequence may be expressed as (SSS) → coherent GP zones → semi–coherent η′ → incoherent stable η, whereas for lower Zn/Mg ratios (<2.2, at.%), the T phase (Mg32(Al, Zn)49) could be one of the main hardening η phases. The Zn/Mg atomic ratio in the present alloy is about 1.9. Based on all the discussion above, it is expected to observe MgZn2(η), Al2CuMg, and Al2Cu phases. Considering the atomic numbers of the main alloying elements Mg (12, Zn:30, Cu:29), the Al2Cu phase will be the brightest phase under the electron beam [47,48,49,50,51,52,53].
Figure 5 illustrates the microstructure of the A7075+Sc alloy in the T7 condition (280 °C/8h). The backscattered electron image in Figure 5a shows fairly coarser precipitates compared to those shown in Figure 4a for the same alloy in the T6 condition, causing the observed decrease in the alloy hardness. Figure 5b is a high-magnification image of Figure 5a, revealing the presence of (i) very thin platelets parallel to each other—orange arrows, (ii) clusters of fine spherical particles in the vicinity of coarse particles (white circles), and (iii) coarse particles marked by white arrows. These morphologies confirm the coarsening by the ripening mechanism proposed by Wilhelm Ostwald in 1896 [54].

3.2. The Statistical Analysis of Cutting Force

The evaluation of machinability often revolves around two primary criteria: cutting force and surface roughness. Among these, cutting force stands out as a pivotal parameter for optimizing machining performance. The reduction of cutting force under specific cutting conditions can enhance machinability significantly. Notably, a decrease in cutting force correlates with improved dimensional accuracy and reduced tool wear rates throughout the machining process [55]. Furthermore, it is essential to consider that periodically varying cutting force has a direct impact on cutting heat, thereby exerting a critical influence on tool wear and the overall quality of the machined surface. This phenomenon is particularly relevant in milling processes, which are characterized by multi-tooth discontinuous cutting [56,57,58,59].
There are many factors affecting cutting force. Some of these factors include alloying elements, impurities, casting process, heat treatment, machine tool rigidity, and cutting tool geometry. Through the cutting parameters depth of cut and feed rate, the most significant effect on cutting force enhancement occurs, since the effective area of shear per tooth increases with an increase in depth of cut and feed rate. An increase in cutting speed, associated with elevated temperatures, leads to a reduction in shear strength, ultimately resulting in a decrease in cutting force [60,61].
Hardness, a factor influenced by hardening precipitation, serves as a key determinant of mechanical properties. It is worth noting that higher hardness levels are associated with increased cutting forces. When processing materials with high mechanical properties, it is common to encounter elevated cutting forces, which, in turn, can lead to higher temperatures [61]. The incorporation of lubricants into the machining process improves tribological performance by lowering the coefficient of friction, diminishing cutting forces, and mitigating tool wear. This decrease in cutting force necessitates a reduced demand for specific cutting energy, consequently lowering production costs [62,63].

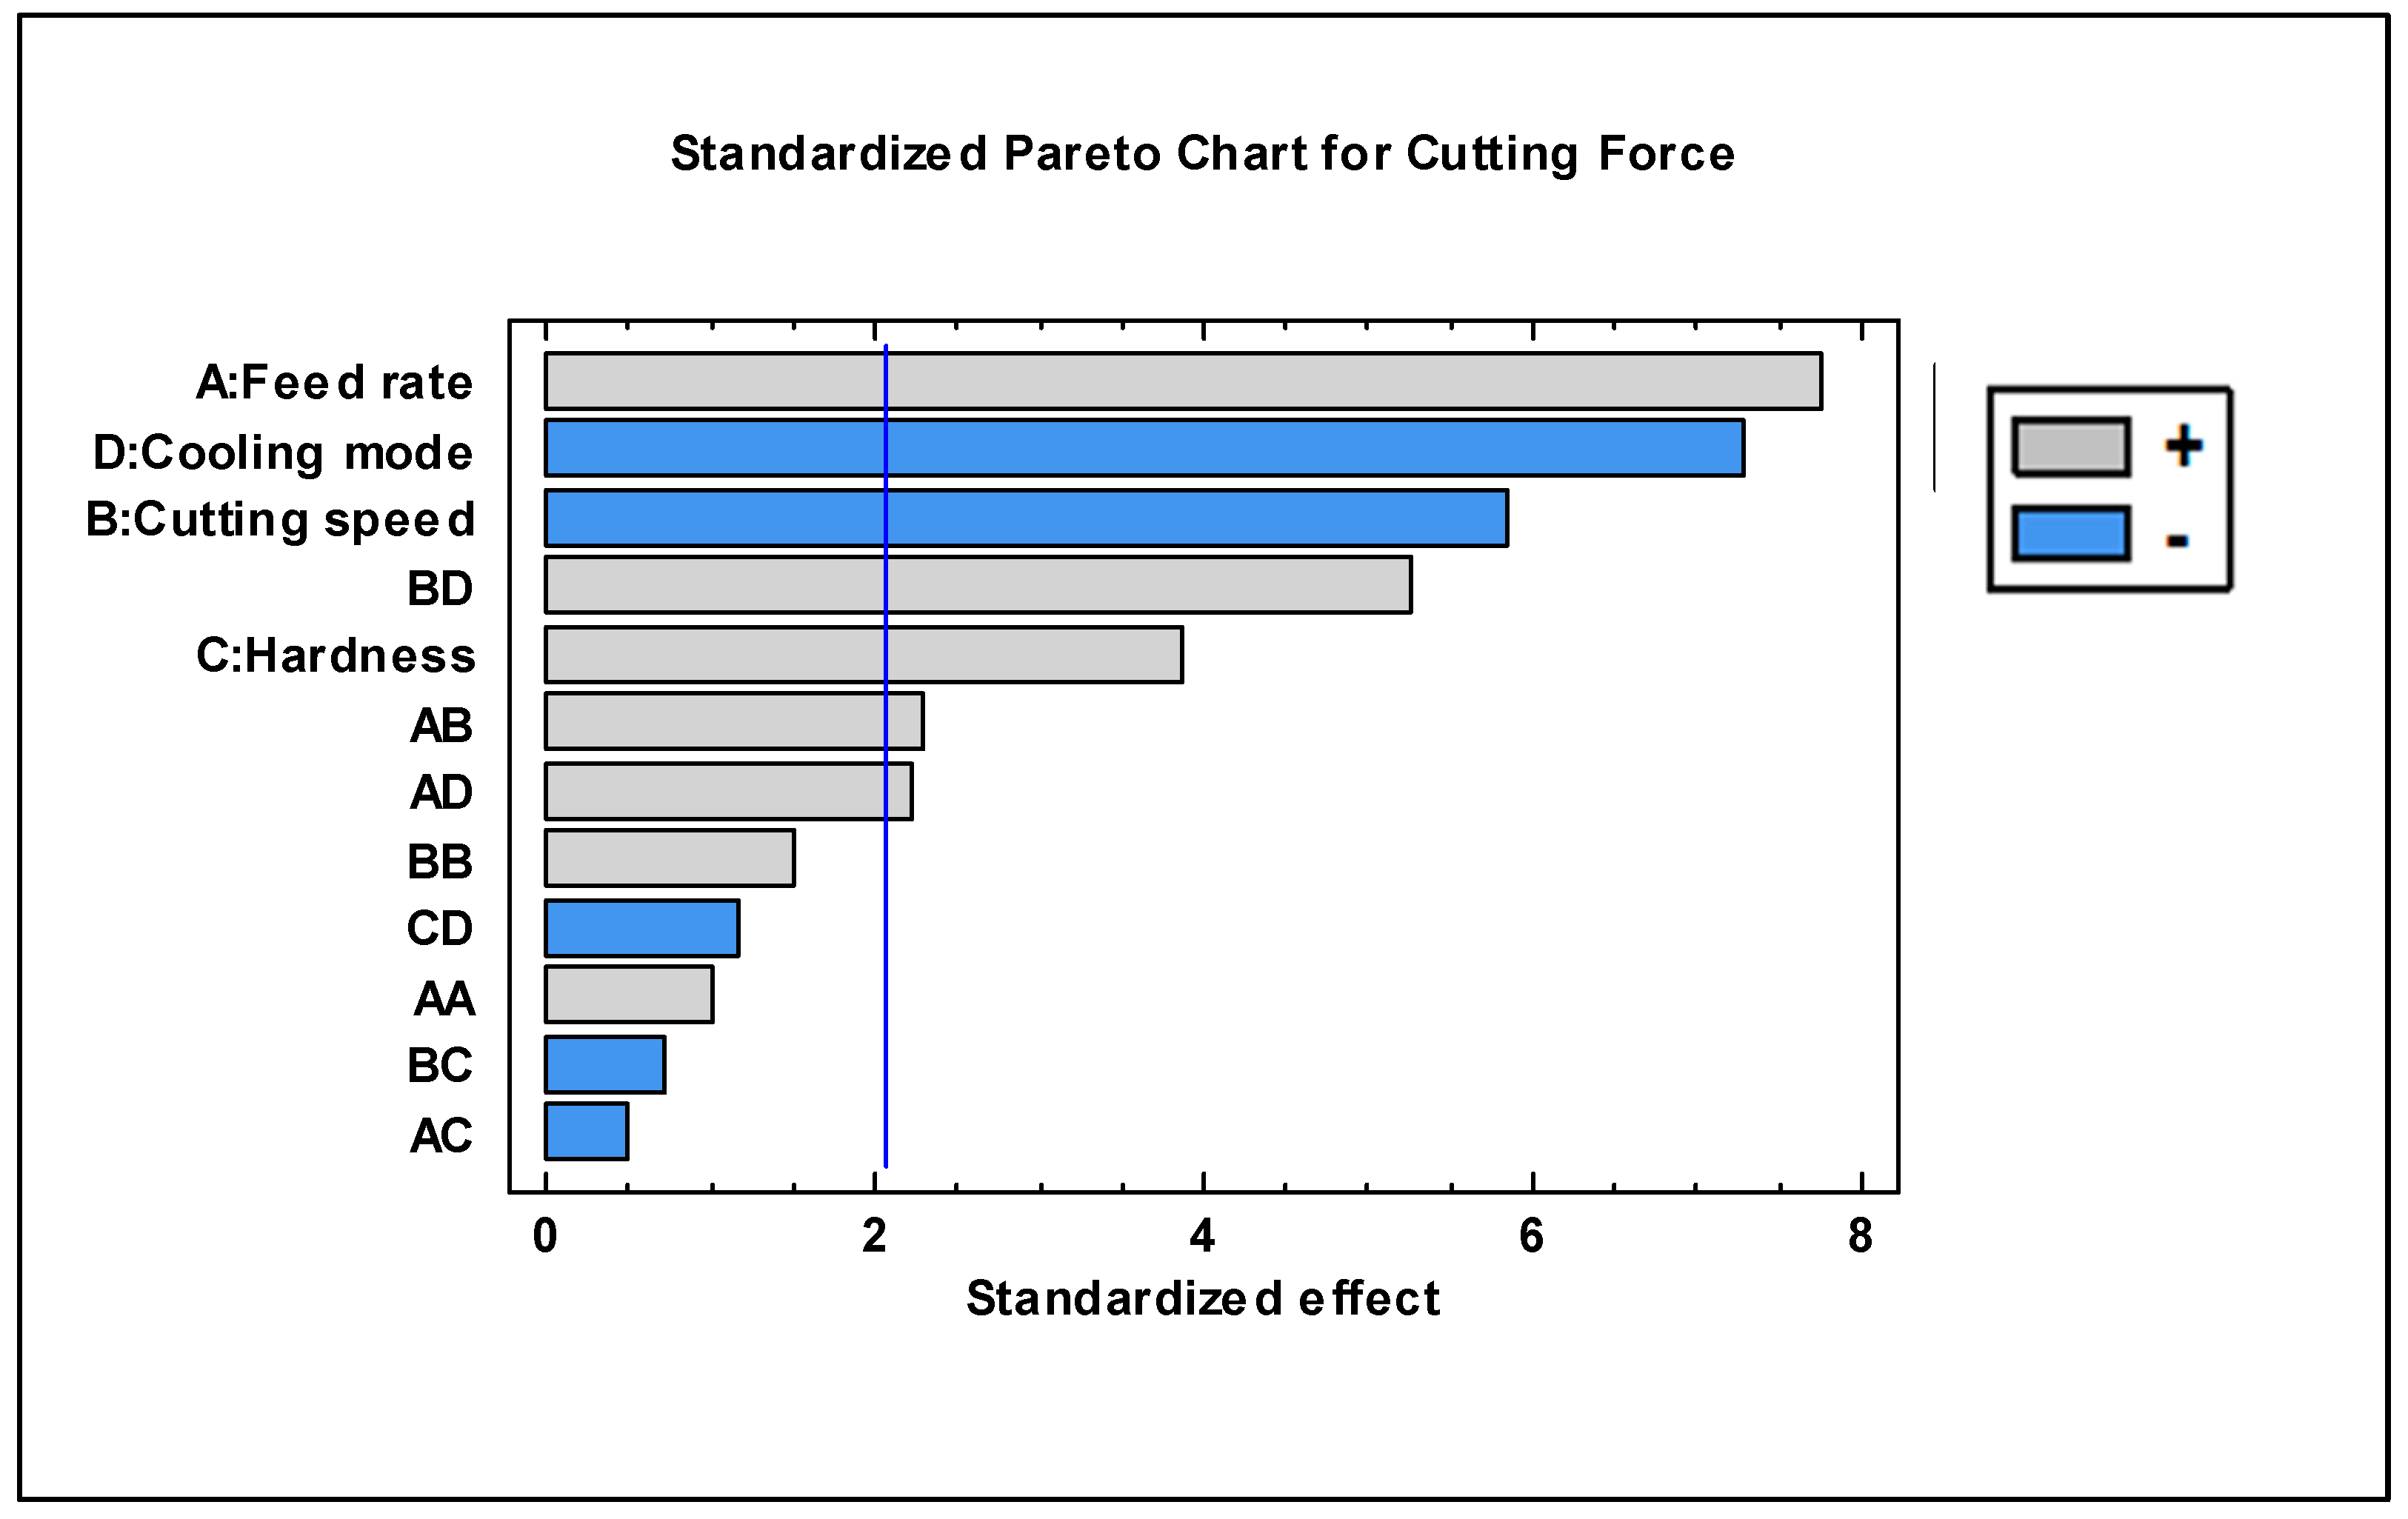
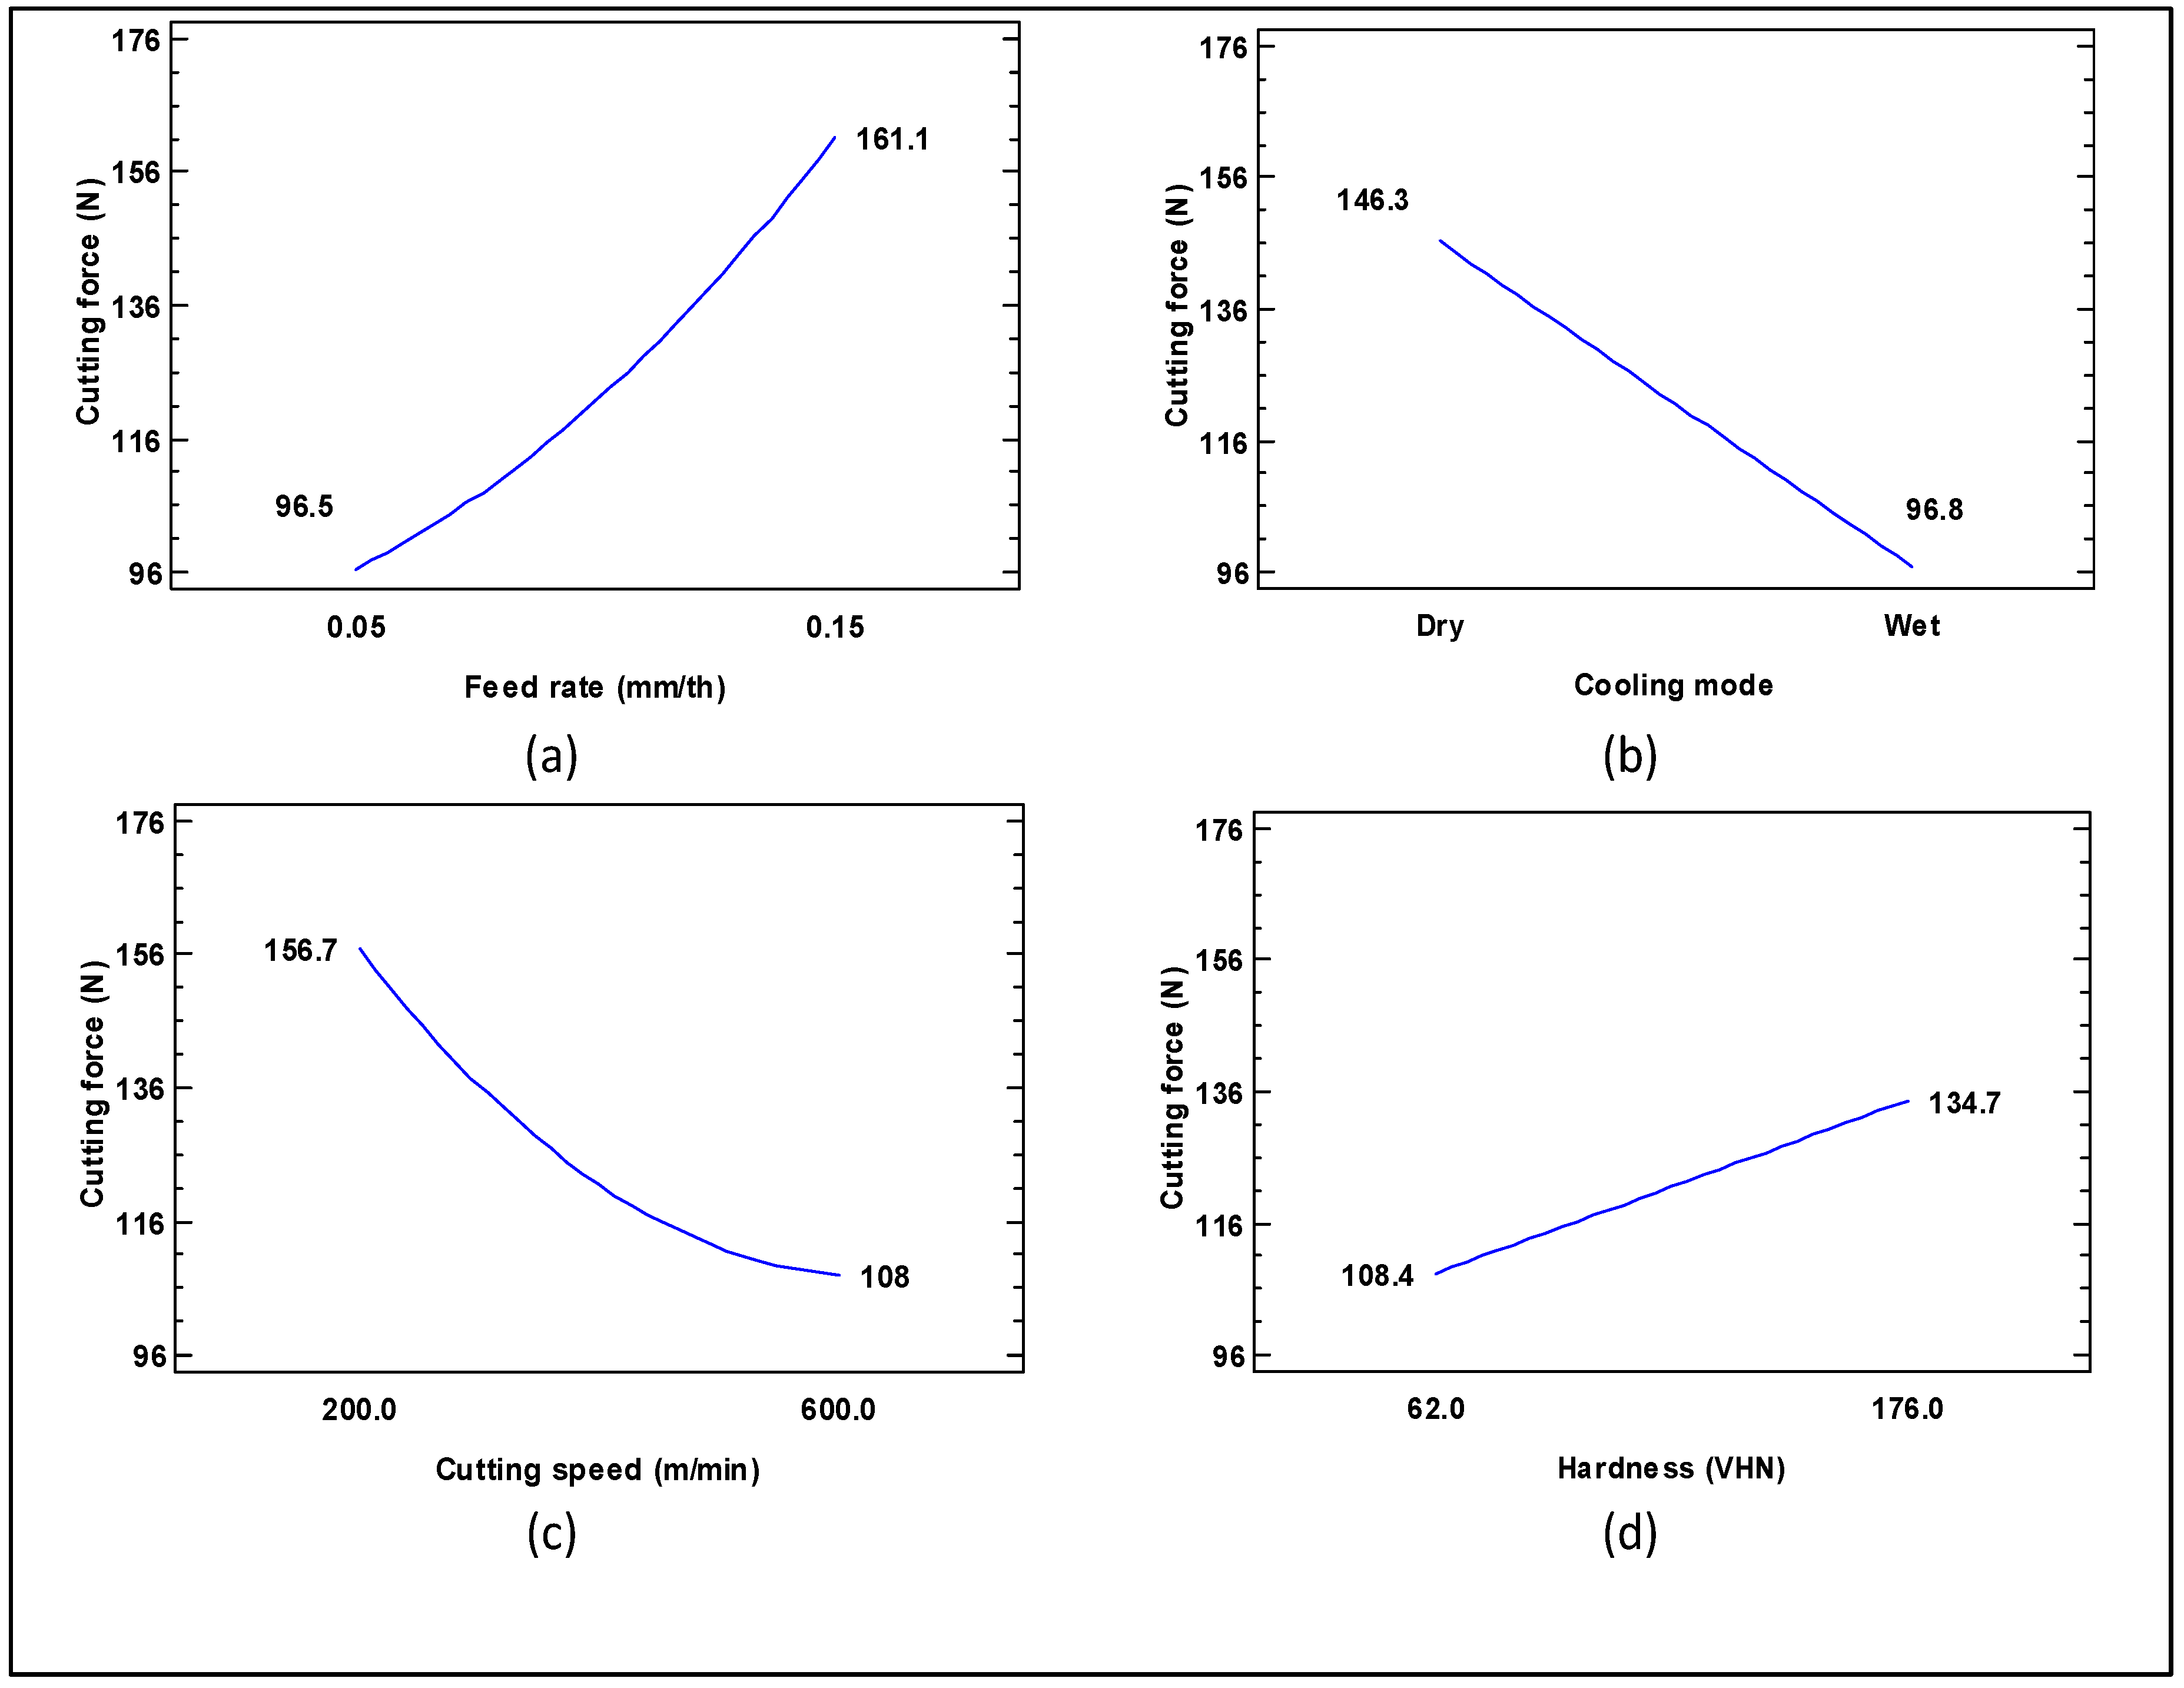
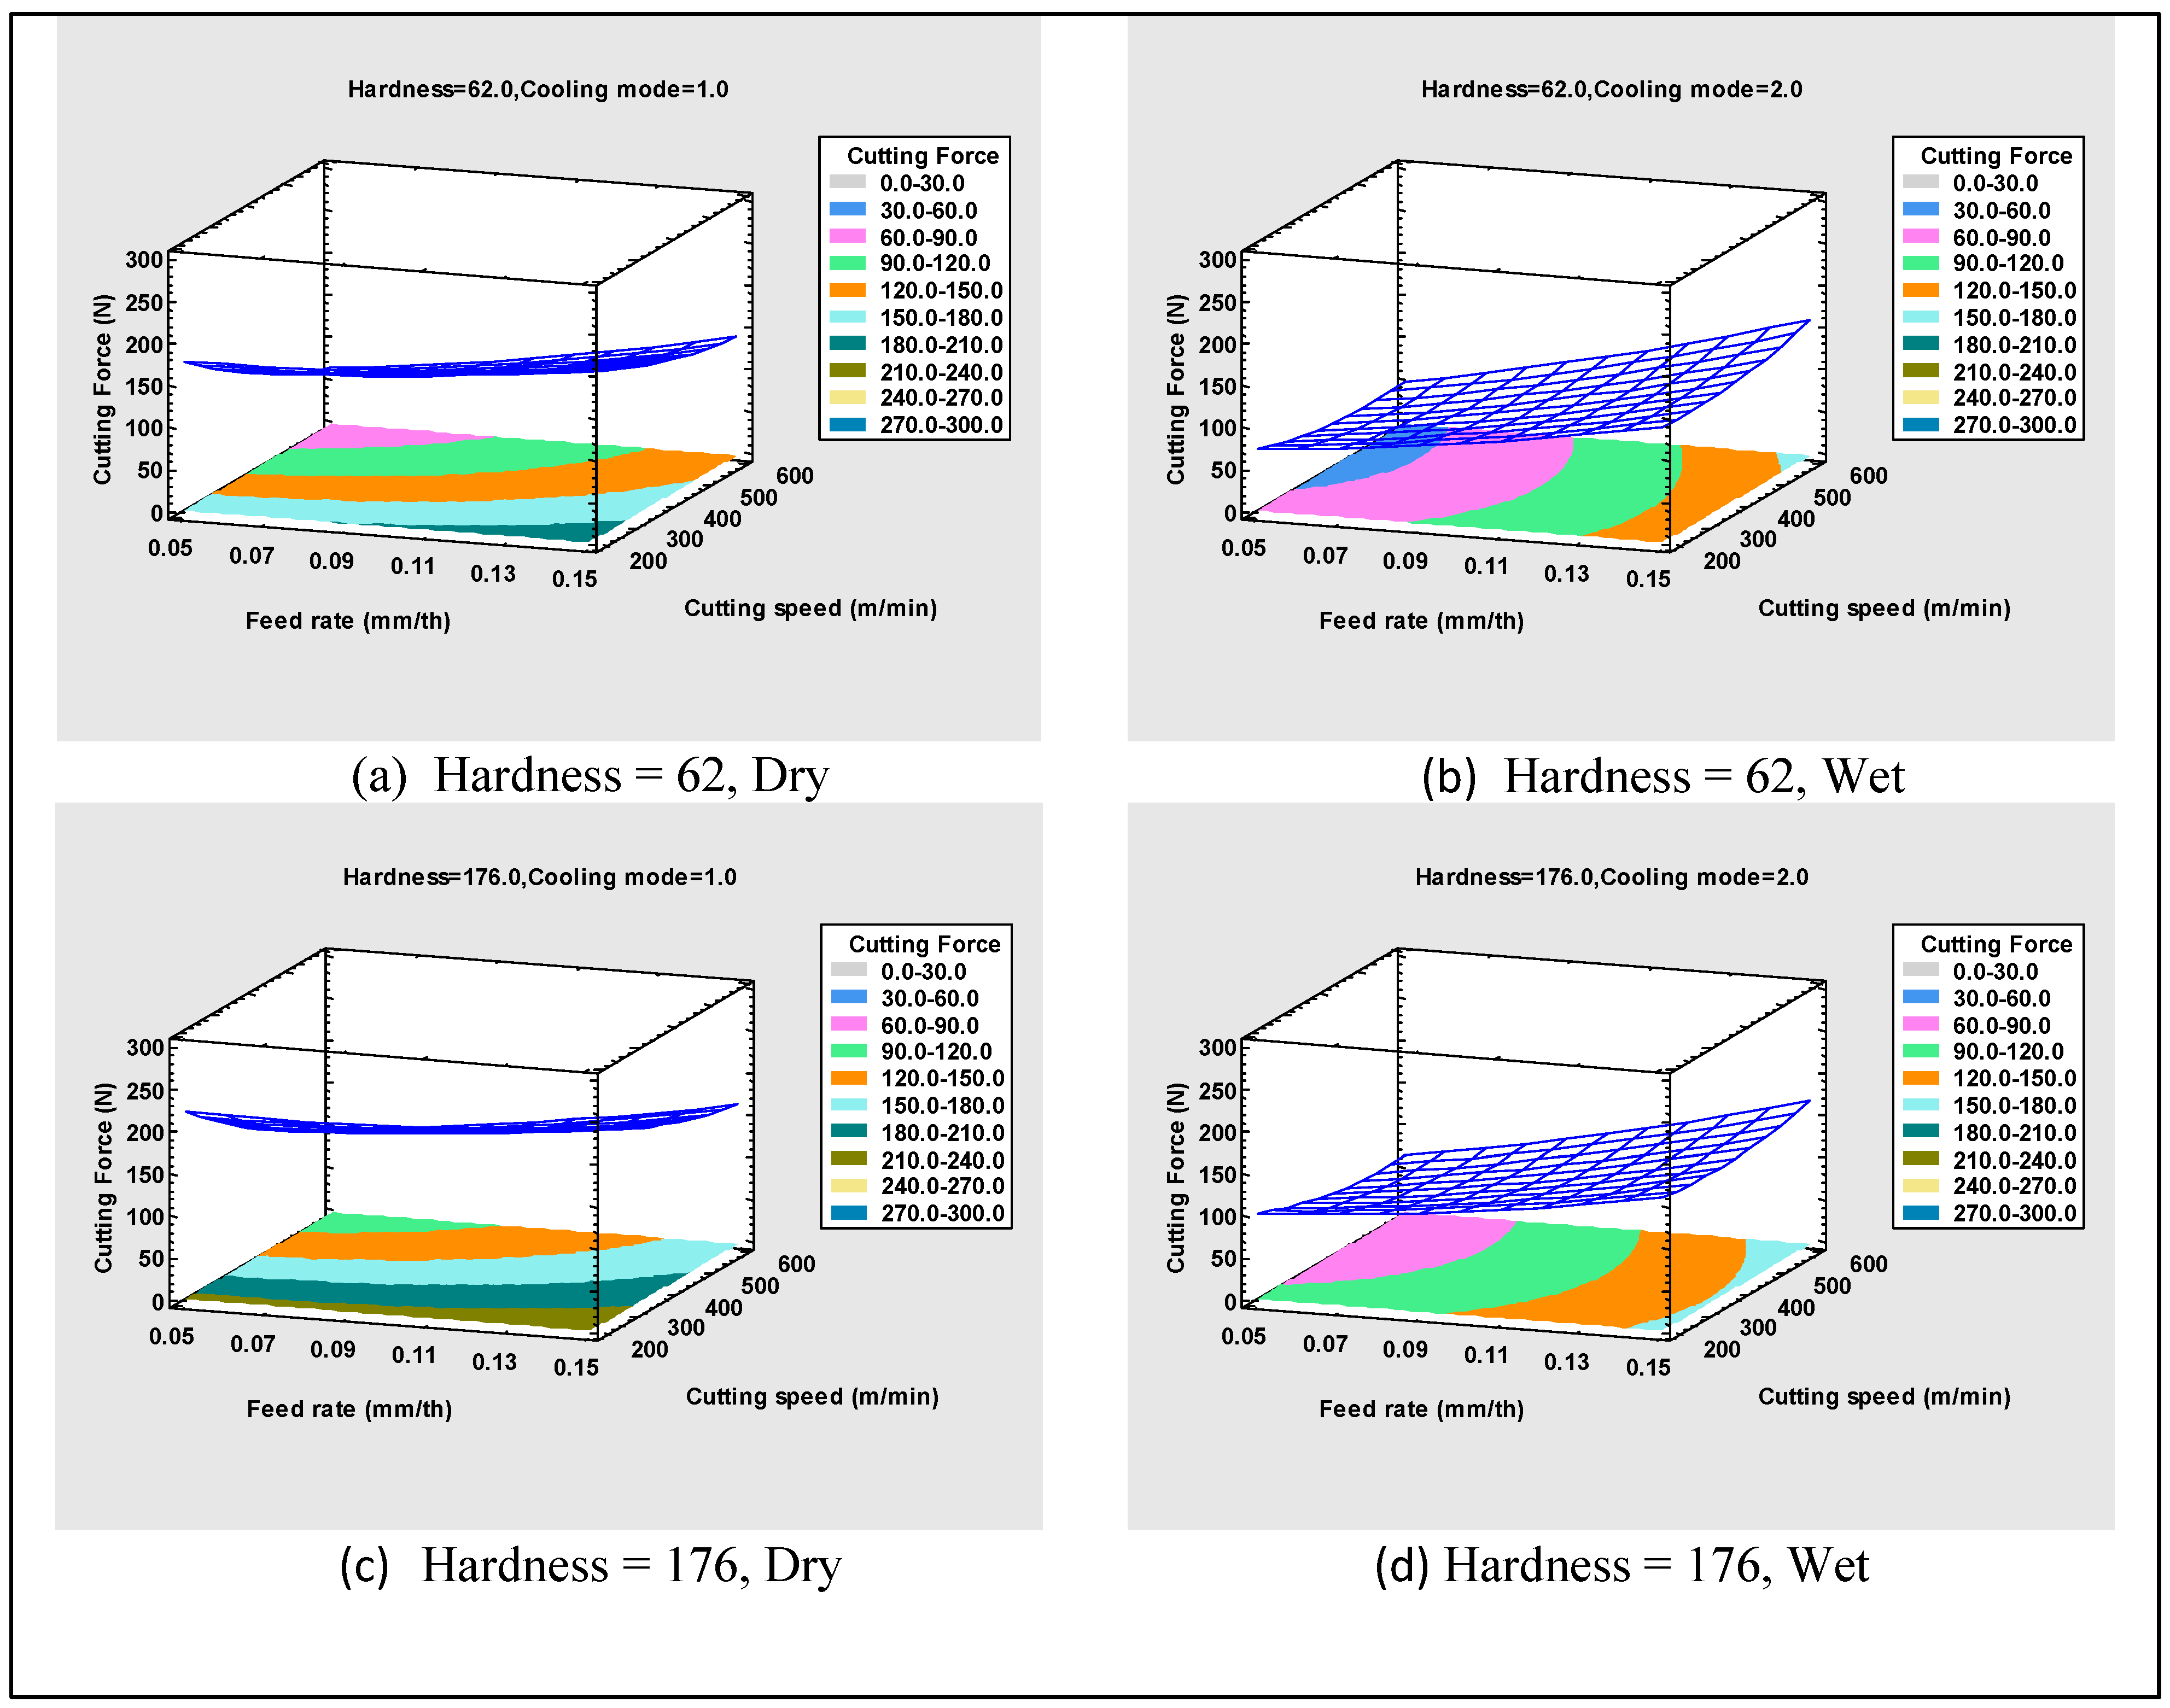
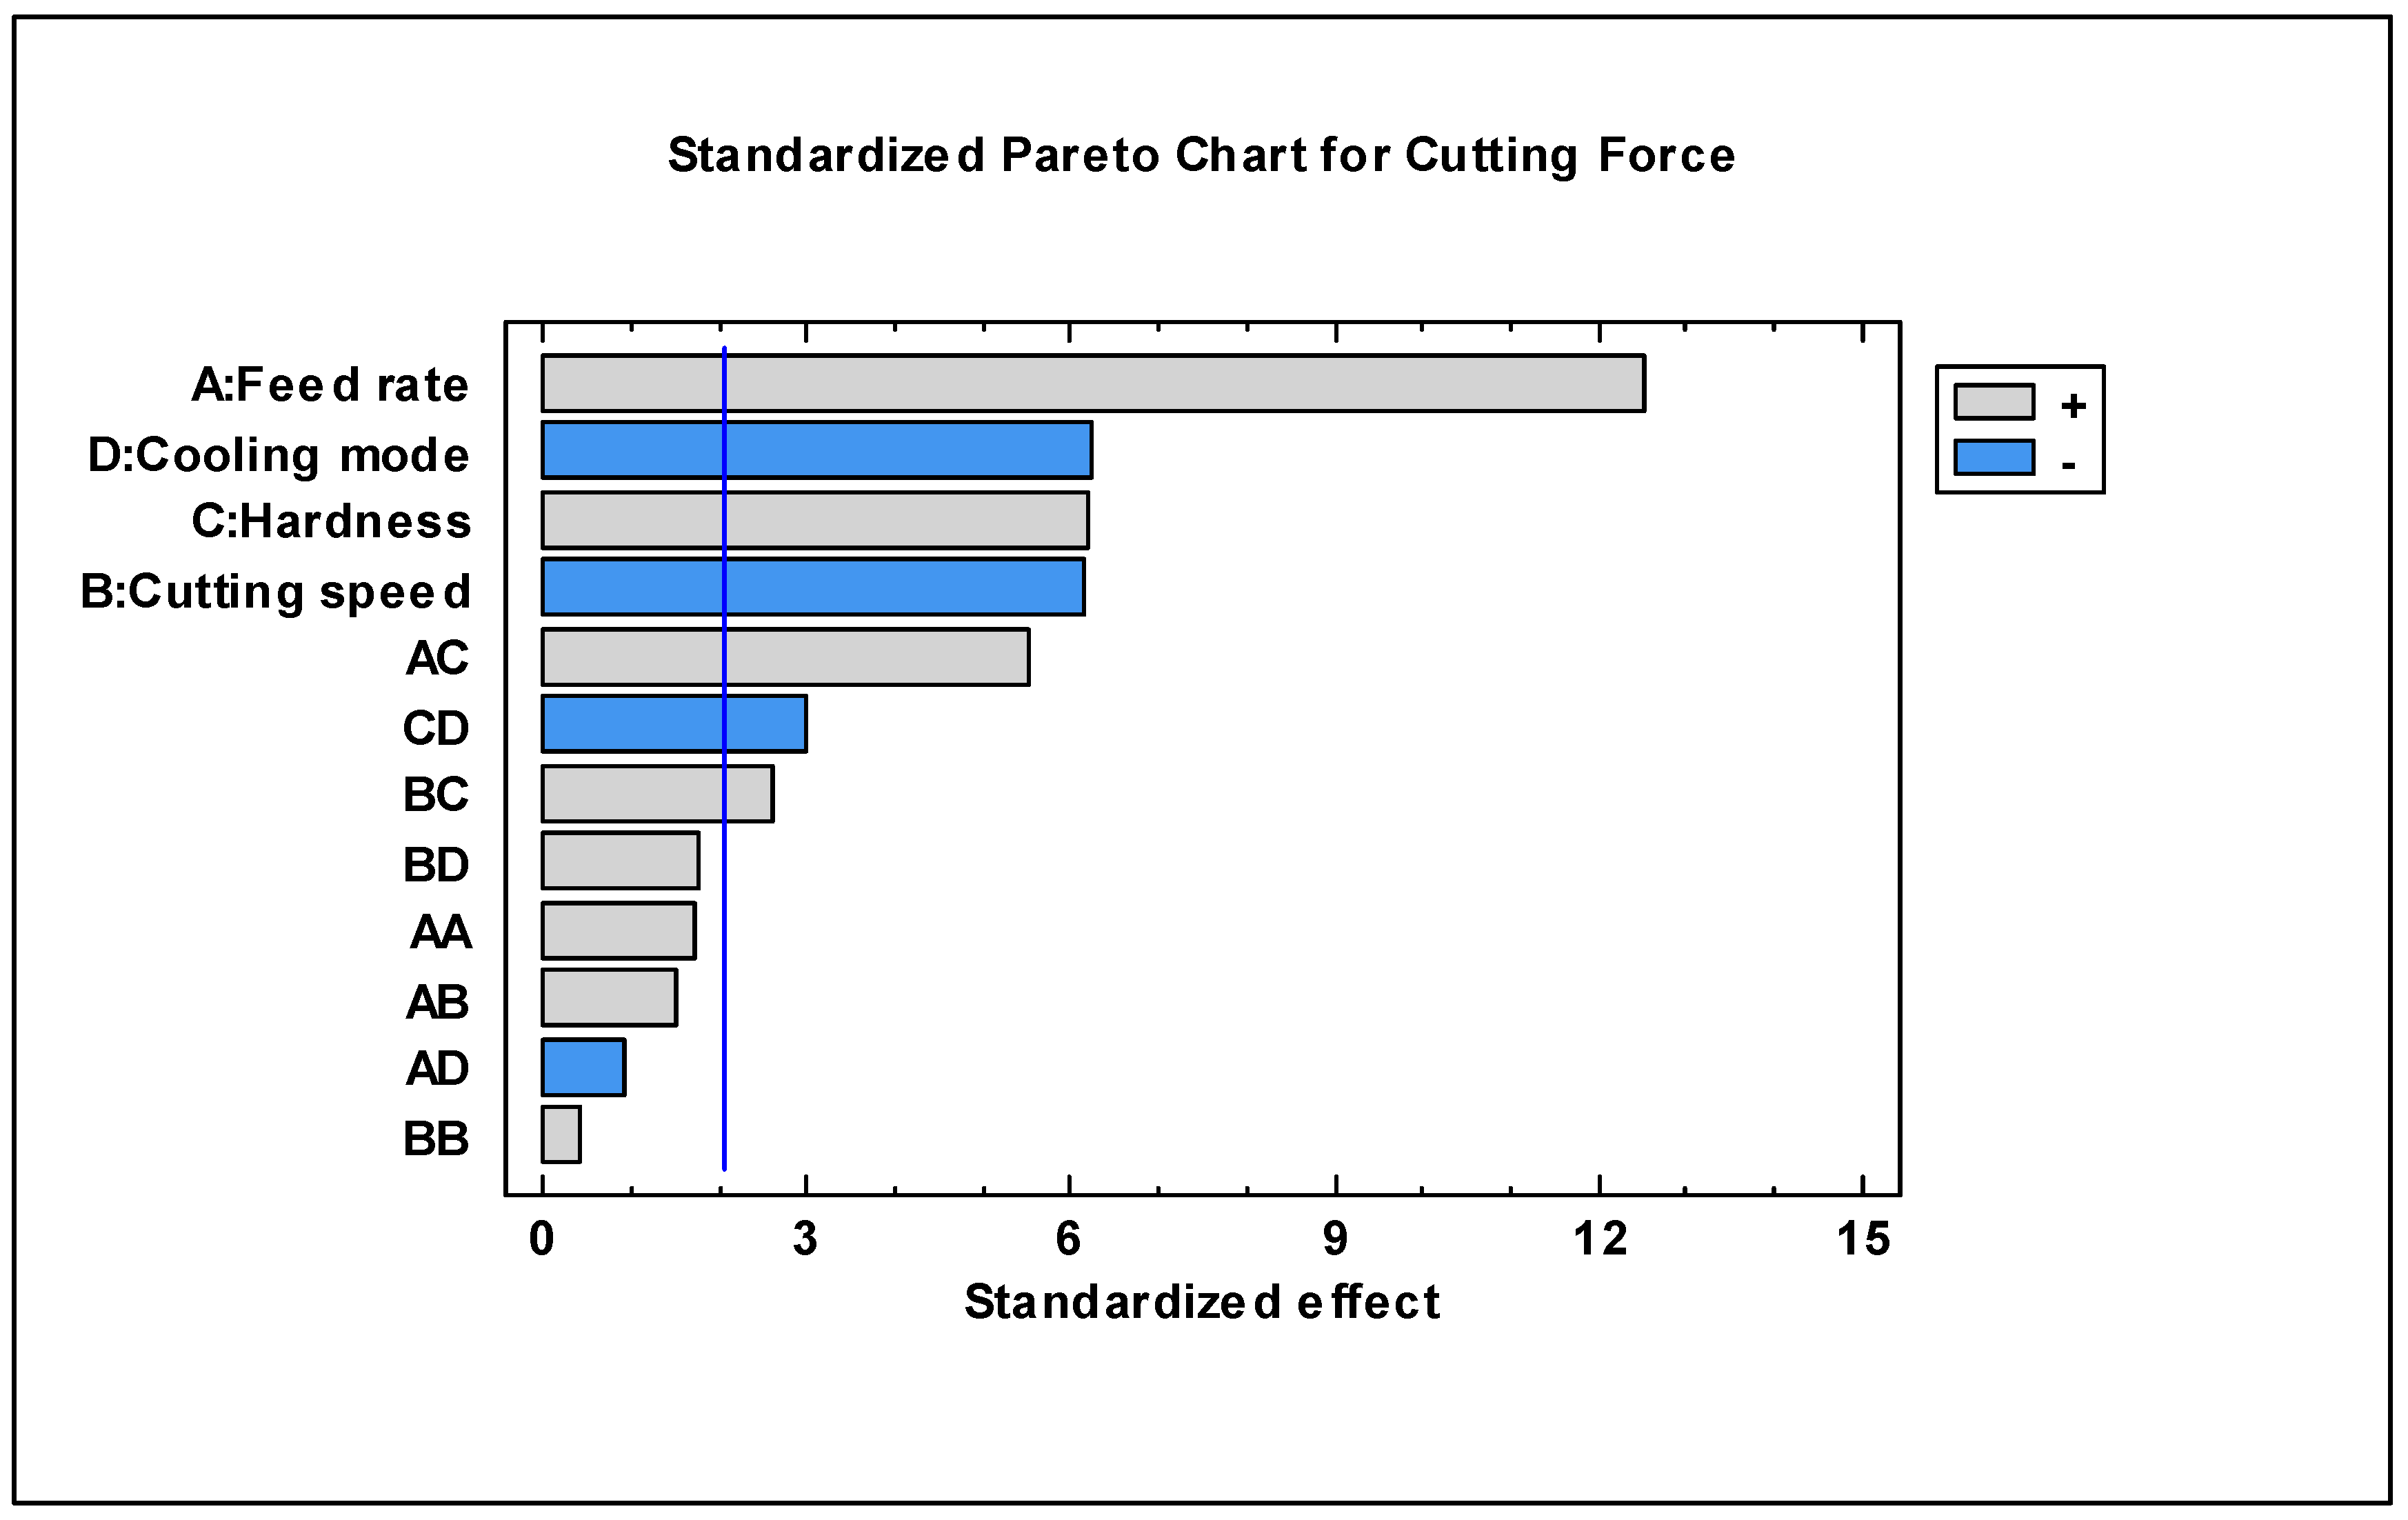
3.2.1. Statistical Analysis of Cutting Force in Machining of A7075

An ANOVA analysis was conducted on the cutting-force results presented in Table 6a,b to investigate the effects of independent variables, including feed rate, cutting speed, microhardness, and cooling mode, on cutting force during the milling of A7075. The model accounts for 89.9% of the variation in cutting force based on the mentioned inputs. Further details of the ANOVA analysis are provided in Table 7. In the machining of A7075, as depicted in Figure 6 and Figure 7a, the feed rate exhibits the most significant positive influence on cutting force, showing an impressive enhancement of approximately 65 N across the range of 0.05 to 0.15 mm/th. When machining under wet conditions, there is a notable reduction in cutting force by approximately 50 N, with all other parameters held constant, as illustrated in Figure 7b. The use of cutting fluid in the machining process leads to a decrease in the coefficient of friction, resulting in a reduction in cutting force. The third parameter significantly affecting cutting force in A7075 machining is cutting speed.
As depicted in Figure 7c, when the cutting speed increased from 200 to 600 m/min, the cutting force decreased from 156.7 to 108 N. Two primary reasons can be mentioned to justify this phenomenon. Firstly, the higher heat generated during machining at higher cutting speeds softens the workpiece in the cutting zone, reducing shear strength. Secondly, at higher cutting speeds, the chip length is [64,65], resulting in a shorter actual contact length compared to the natural contact length.
The direct impact of hardening on cutting speed is also notable. In the case of hard A7075 with a hardness of 176 VHN, the cutting force is approximately 26 N higher compared to the soft condition with a hardness of 62 VHN (see Figure 7d). In terms of the interaction effect between the independent variables, the interaction between cutting speed and cooling mode proved to be significant. As illustrated in Figure 8, at low cutting speeds (200 m/min), the cutting force is approximately 100 N higher in dry machining compared to wet machining. However, at high cutting speeds (600 m/min), there is almost no difference in the cutting force observed between dry and wet machining conditions for A7075.
This finding reveals that the use of cutting fluid at low speeds is beneficial, significantly reducing cutting forces. However, in high-speed machining, wet machining has minimal impact on reducing cutting forces. Figure 9 depicts a 3D surface plot illustrating the cutting force during the machining of A7075. In dry machining, cutting force exhibits greater sensitivity to variations in cutting speed. It can also be observed that, overall, the level of cutting force is significantly lower in wet conditions, particularly when machining a harder alloy.
From the results visually illustrated in Figure 9, the conditions associated with both the highest and lowest cutting forces can be observed. In A7075, with a hardness of 62 VHN, the highest cutting force (almost 200 N) was recorded during machining with a feed rate of 0.15 mm/th and a cutting speed of 200 m/min in dry conditions, and the lowest force was almost 54 N, achieved during wet machining with a feed rate of 0.05 mm/th and a cutting speed of 600 m/min. In terms of A7075 with hardness 176 VHN the highest and lowest amount of cutting force has been recorded in the exact same conditions with 73 N and 233 N, respectively. This observation is made while considering the effects of feed rate (f), cutting speed (v), hardness (h), cooling mode (c), and the interaction between cutting speed and cooling mode.

3.2.2. The Statistical Analysis of Cutting Force in Machining of A7075-Sc

The cutting force results obtained from A7075-Sc machining are presented in Table 7. The R-squared value obtained from the statistical analysis on the cutting force results is 93.4%, indicating that the model explains nearly 93% of the variation in cutting force based on the examined variables. The details of the ANOVA parameters are presented in Table 8 shows the details of the ANOVA parameters.
In A7075-Sc machining, the feed rate stands out as having the most significant impact on cutting force, as depicted in the Pareto chart (Figure 10). Following the feed rate in order of significance are cooling mode, hardness, and cutting speed, each of which has approximately half the effect of feed rate. The direct effect of increasing the feed rate on cutting force, as shown in Figure 11, resulted in an increase of nearly a 48 N in force when the feed rate was raised from 0.05 to 0.15 mm/th. Both the Pareto chart and the main effect plot indicate that using a high level of cutting fluid in machining A7075-Sc is beneficial for reducing cutting force. According to Figure 10, this reduction was approximately 20 N when machining under wet conditions compared to dry machining.
Alloy hardness significantly affected cutting force, with machining the softest condition of A7075-Sc (achieved by heat treating for 8 h at 280 °C) requiring nearly 20 N less cutting force compared to the hardest alloy (heat treated for 24 h at 120 °C), with a cutting force of 129 N. As expected, cutting speed also had a significant impact on reducing cutting force. Increasing the cutting speed from 200 to 600 m/min resulted in a reduction in cutting force from 132.5 to 109 N.
The interaction plot in Figure 11 highlights the amplified impact of feed rate under the high-hardness condition of the alloy. As shown in the plot, machining both hardness levels at a low feed rate (0.05 mm/th) required approximately 100 N of cutting force. However, when machining the hard alloy with the high feed rate (0.15 mm/th), it needed more than 40 N of additional cutting force compared to machining the soft alloy, which required nearly 130 N of cutting force. The interaction plot in Figure 12 highlights the amplified impact of feed rate in high hardness condition of the alloy. As shown in the plot, machining both hardness levels at a low feed rate (0.05 mm/th) required approximately 100 N of cutting force.
One point that can be drawn from the 3D surface plots (Figure 13a,b) is that the negative effect of cutting speed is more pronounced in the soft alloy, especially in dry condition. Although the effect of cutting speed is not as significant in hard alloy machining, its impact is still noticeable in dry machining. The 3D surface plots (Figure 13a,b) also show that the negative effect of cutting speed is more pronounced in the soft alloy, especially under dry conditions. Although the effect of cutting speed is not as significant in hard alloy machining, its impact is still noticeable, particularly in dry machining.
The heightened impact of feed rate on cutting force in the hard A7075-Sc is evident in the 3D surface plots (Figure 13c,d), where the steep inclination of the plot sharply increases with an increase in feed rate. The highest cutting force in the machining of soft A7075-Sc with a hardness of 79 VHN was associated with the highest feed rate (0.15 mm/th) and the lowest cutting speed (200 m/min) in dry conditions, resulting in 163 N. Conversely, the lowest cutting force, approximately 80 N, was observed in both dry and wet machining, with the lowest feed rate (0.05 mm/th) and the highest cutting speed (600 m/min).
The machining of the hardest A7075-Sc alloy, with a hardness of 185 VHN, yielded the highest cutting force when using the highest feed rate (0.15 mm/th) and the lowest cutting speed (200 m/min) in dry conditions, resulting in a force of 191 N. In contrast, the lowest cutting force (81 N) was observed during wet machining with the lowest feed rate (0.05 mm/th) and the highest cutting speed (600 m/min). It is worth noting that using the same cutting parameters (cutting speed and feed rate) in dry machining resulted in a force of nearly 110 N. This highlights the remarkable impact of wet machining on the hard A7075-Sc alloy.
To establish a linear equation between the significant parameters and their interactions affecting cutting force, we selected the parameters highlighted in the Pareto chart (Figure 10). This selection still resulted in a significant explanation of cutting force variation, with an R-squared value of 88.8%.

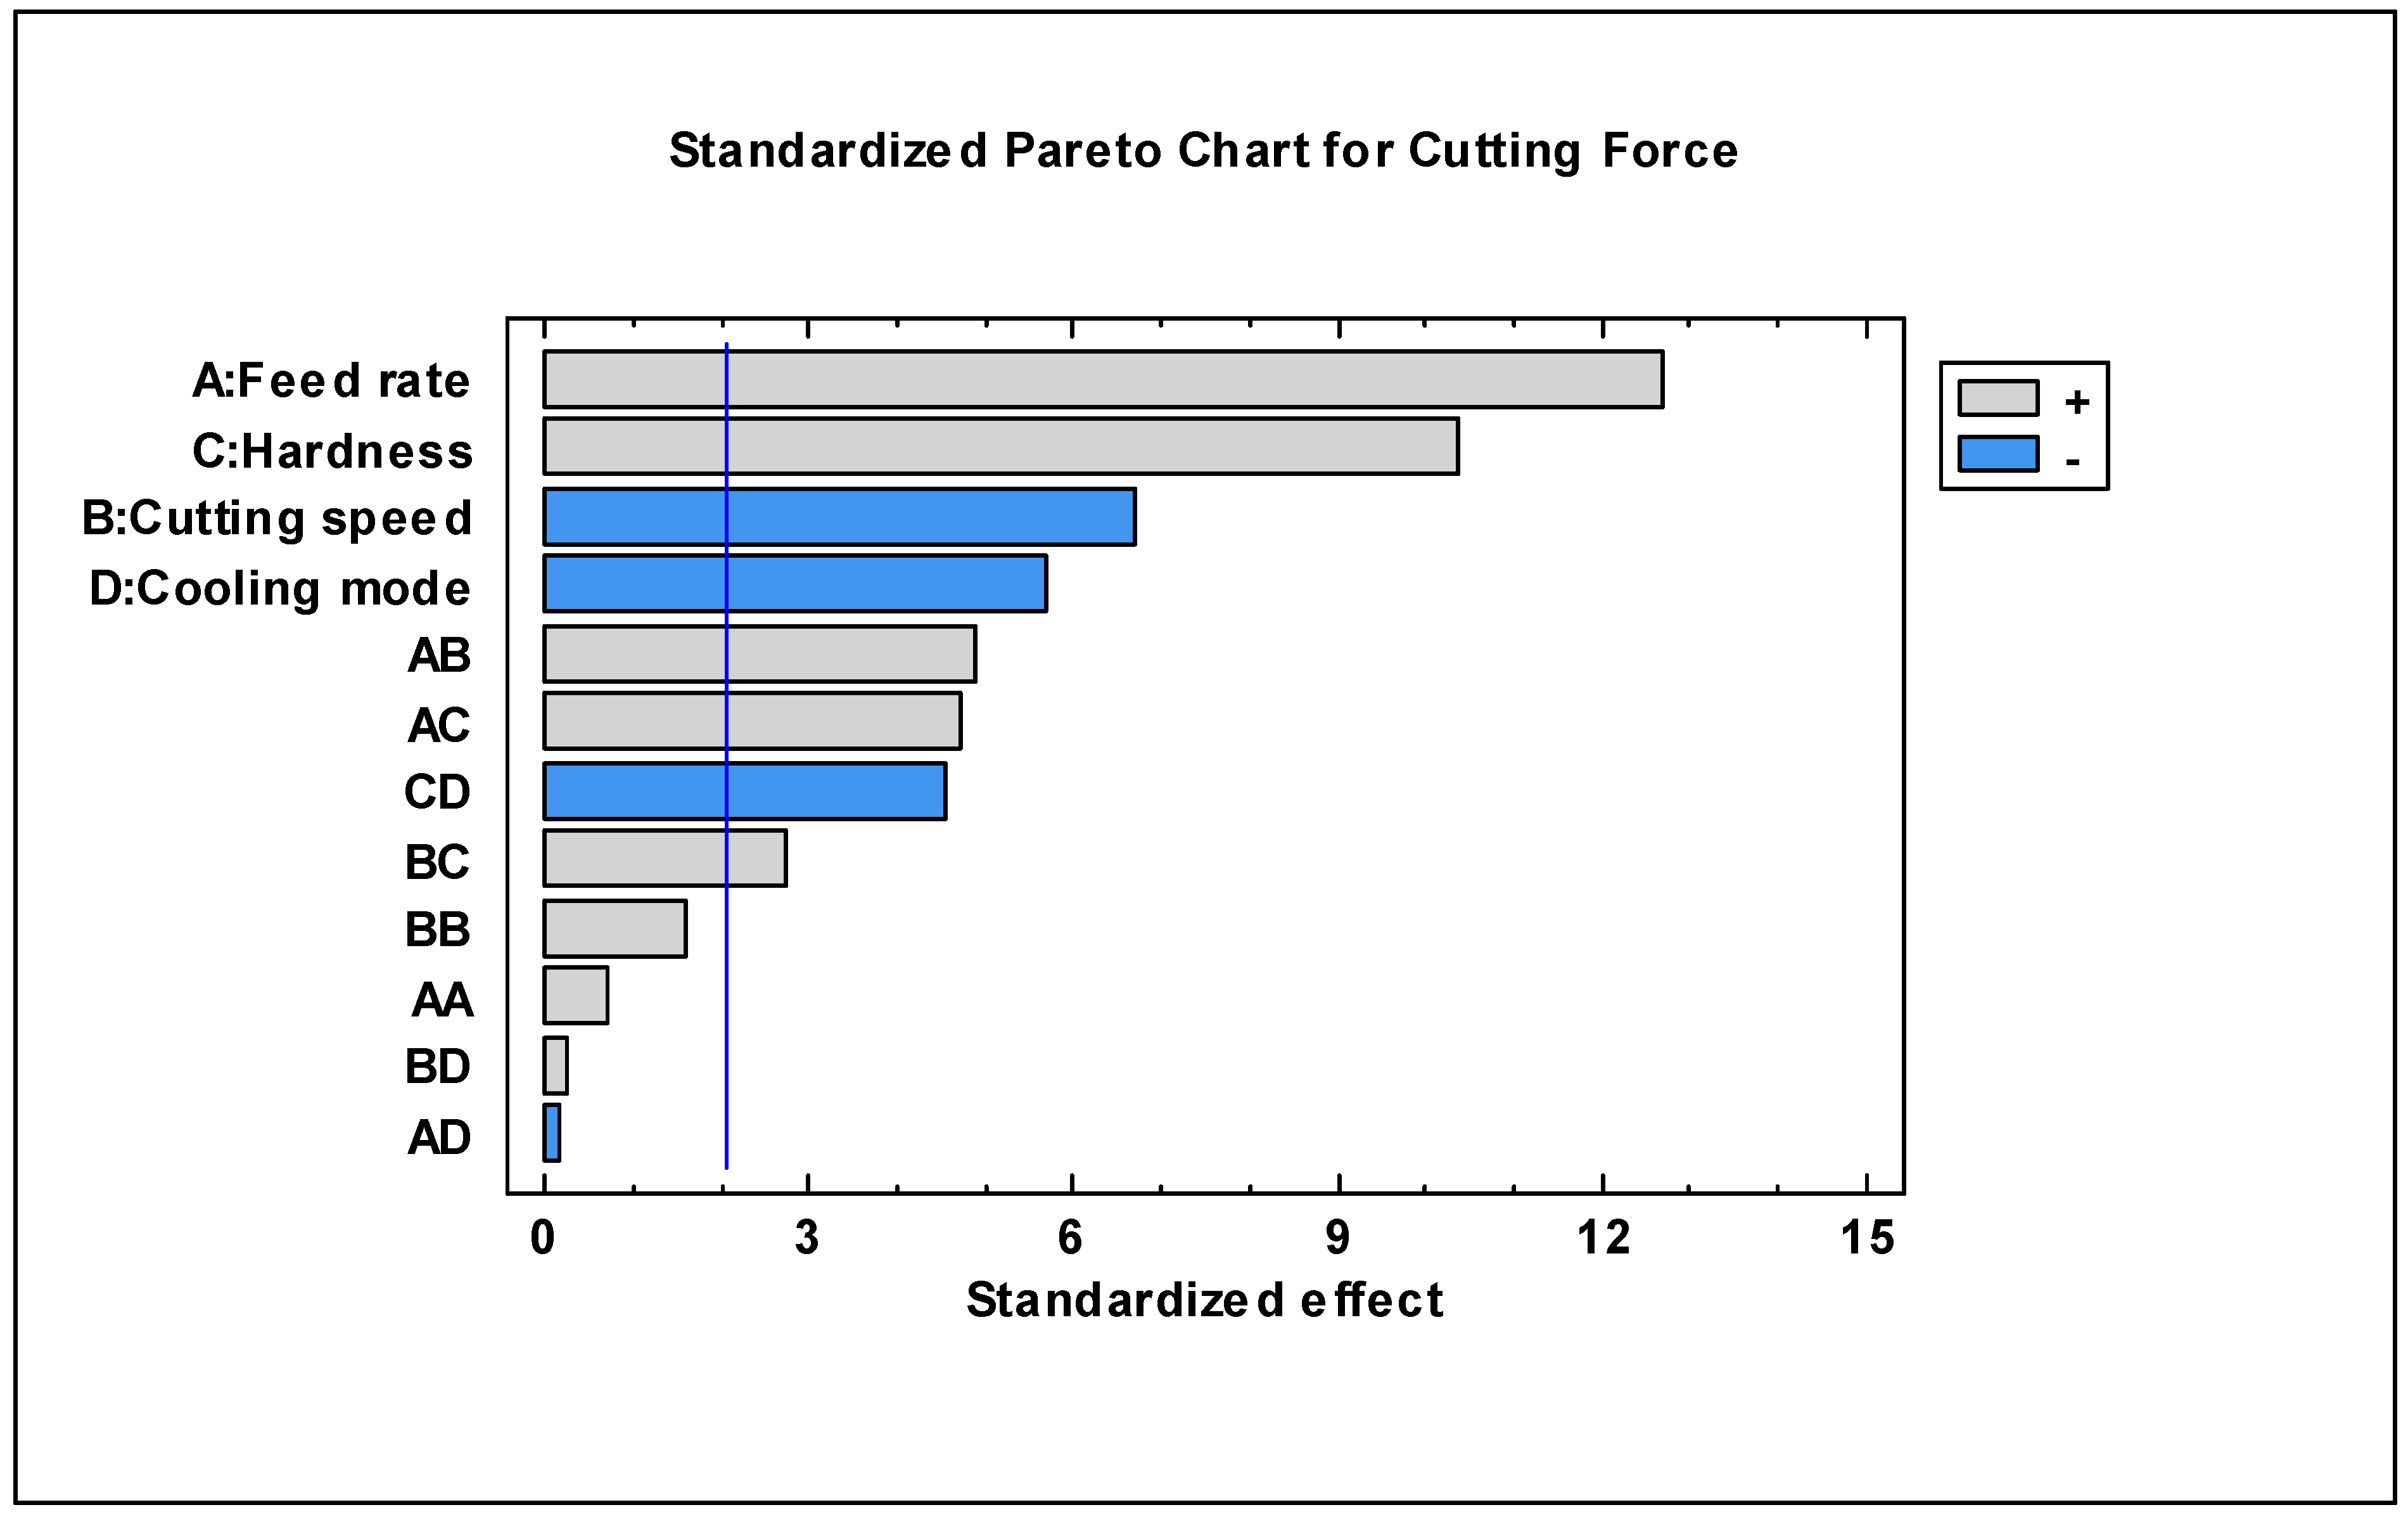
3.2.3. Statistical Analysis of Cutting Force in Machining of A7075-Li-Sc

The cutting force results obtained from the A7075-Li-Sc alloy machining is presented in Table 9. An ANOVA analysis was conducted on the cutting force results obtained from the machining of A7075-Li-Sc, which are presented in Table 10. This analysis was carried out to investigate the impact of the independent variables, including feed rate, cutting speed, microhardness, and cooling mode, on cutting force. The model successfully explains 94.8% of the variations in cutting force attributed to these input factors.
Similar to two other alloys in the machining of A7075-Li-Sc, feed rate emerges as the most significantly influential factor, affecting the variation in cutting force. This observation is evident from the Pareto chart depicted in Figure 14. According to the main effect plot (Figure 15a), machining with the high feed rate (0.15 mm/th) resulted in a cutting force approximately 54 N higher compared to machining with a low feed rate (0.05 mm/th), where the cutting force measured 101.2 N. The hardness in the machining of A7075-Sc-Li had a more significant effect on the cutting force compared to the machining of A7075-Sc. As seen in Figure 14, the cutting force in machining the soft alloy with a hardness of 81 VHN and the hard alloy with a hardness of 198 VHN was 107.6 and 143.6 N, respectively.
When comparing the cutting forces in the machining of A7075-Sc and A7075-Sc-Li, it becomes evident that the effect of hardness between the hard and soft conditions on cutting force is more pronounced in A 7075-Li–Sc. This is attributed to the presence of lithium in the alloy structure, which increases its hardness during heat treatment for 24 h at 120 °C. As shown in Figure 15b,c, the cutting forces are nearly identical under soft conditions in both alloys, with A7075-Sc and A7075-Li-Sc having similar hardness values of 81 VHN and 79 VHN, respectively. However, in the machining of hard alloys, the cutting force is approximately 14 N higher in A7075-Li-Sc (198 VHN) compared to A7075-Sc (185 VHN).
Both cutting speed and the use of cutting fluid in machining had a significant impact on reducing cutting force. As depicted in Figure 15c, machining this alloy at 600 m/min resulted in a cutting force of 117.2 N, while machining at 200 m/min led to a cutting force of 145.6 N. As depicted in Figure 15d, employing wet machining for A7075-Li-Sc led to a reduced cutting force compared to dry machining, with cutting forces of 115.7 N and 135.5 N, respectively.
Interestingly, the feed rate, hardness, cutting speed, and cooling mode had a more significant impact on the variation of cutting force compared to their interactions. The interaction between feed rate and cutting speed had a positive and significant effect on cutting force. This implies that increasing the feed rate had a more pronounced effect on the variation of cutting force when the cutting speed was higher. As shown in Figure 16a, while the cutting force remained the same at the high feed rate of 0.15 mm/th for both high and low feed rates, in the case of the low feed rate, machining at 600 m/min resulted in a nearly 50 N lower cutting force compared to machining at 200 m/min. In the context of the interaction between feed rate and hardness, as illustrated in Figure 16b, the effect of feed rate on cutting force was more pronounced in harder workpieces. At a low feed rate (0.05 mm/th), the cutting force in machining the alloy with a hardness of 198 VHN was approximately 20 N higher than that for the alloy with a hardness of 81 VHN. However, this difference increased to 60 N when machining with a feed rate of 0.15 mm/th. In Figure 16d, it is evident that the cutting force decreased less than 20 N when cutting speed increased from 200 to 600 m/min in the hard alloy (198 VHN), while this decrease in the soft sample (81 VHN) was approximately 40 N.
Although the cutting force was higher in the harder workpiece during machining of A7075-Li-Sc, machining in dry conditions intensified this effect compared to wet machining, as depicted in Figure 16c. High-speed machining of this alloy reduces cutting force in both hard and soft workpieces, with a more substantial reduction observed in the soft material. As observed in the 3D surface plots (Figure 17a,b), the cooling mode’s effect on cutting force was not significant in the soft workpiece of A7075-Li-Sc. Alternatively, when comparing Figure 18c,d, the importance of utilizing cooling fluid became apparent during the machining of the hard A7075-Li-Sc alloy.
Based on 3D surface plots, the effect of feed rate on cutting force in the soft condition was minimal, but a significant reduction in cutting force occurred with an increase in cutting speed, especially at lower feed rates. This highlights the significant impact of the interaction between feed rate and cutting speed. While the feed rate had an insignificant effect on cutting force during the machining of the soft alloy, it displayed a much more pronounced impact on cutting force in the case of the hard A7075-Li-Sc alloy. This underscores the positive effect of the interaction between feed rate and hardness.
The minimum cutting force level achieved during the machining of A7075-Li-Sc was observed when machining the soft alloy under both dry and wet conditions with the lowest feed rate (0.05 mm/th) and highest cutting speed (600 m/min), resulting in a cutting force of approximately 63 N. The maximum cutting force level achieved during the machining of A7075-Li-Sc was observed when machining the hard alloy under dry conditions, with the highest feed rate (0.15 mm/th) and highest cutting speed (600 m/min), resulting in a cutting force of approximately 204 N. While Figure 18c suggests that the maximum force occurred at a cutting speed of 600 m/min, the results in table (Table 10) reveal that the exact same cutting force was achieved with the highest feed rate and the lowest cutting speed (200 m/min). This is due to the insignificant effect of cutting speed on cutting force at high feed rates. To establish a linear equation representing the relationship between significant parameters and their interactions affecting cutting force, we specifically selected the parameters highlighted in the Pareto chart. This selection explains the variation in cutting force, yielding an R-squared value of 94.1%.

3.3. Comparative Analysis of the Effects of Added Elements

It has been observed that the feed rate is the most influential factor in controlling the cutting force for each of the A7075-based alloy materials tested. In fact, the cutting force is known to be governed by the following equation:
F = K s · A c   =   K s · f · d
where K s (N/mm2) is the specific cutting force, Ac (mm2) is the chip cross-section, f (mm/tooth) is the feed rate, and d (mm) is the depth of cut. The specific cutting force of the material is a property that depends on hardness and microstructure. Therefore, it is important to examine the effect of the feed rate and hardness and their interactions on the recorded cutting forces.
Table 11 summarizes the factors and interactions that influence the cutting forces for each material. As indicated, the feed rate is the most influential parameter, followed by hardness for the A7075-Li-Sc alloy, whereas the other two alloys/materials are most influenced by the cooling mode. Some strong interactions with hardness are also present: the interaction with the feed (f × h) and the interaction with the cooling mode (h × c). The harder materials require higher cutting forces, regardless of the feed rate used (Figure 12 and Figure 16b). The increase in feed rate will, of course, increase the cutting force, as per Equation (2). The cutting speed held the third or fourth position of influence, but its interactions with hardness and cooling mode were not influential, except in the case of the A7075 base alloy.
Figure 18 compares the effects of feed rate, hardness, and cooling mode on each alloy material tested when using a low cutting speed of 200 m/min. For a high feed rate (0.15 mm/tooth), the harder materials led to higher cutting forces (Figure 18a,b), with the exception of the base alloy (A7075), for which higher forces were recorded when the alloy was milled in its softer condition, corresponding to a hardness of 62 VHN, as seen from Figure 18 and Figure 19. This behavior could be related to the chip formation and possibly to the presence of temporal build-up edges.
Figure 19 compares the cutting forces obtained when milling the tested alloys using a moderate feed rate of 0.10 mm/tooth. The use of a higher speed (600 m/min) reduced the cutting force requirements (Figure 19c,d) from that required with the use of low cutting speed, as observed in Figure 19a,b. The heat associated with the use of high cutting speed is very likely to have softened the materials. In addition, the use of a coolant further reduced the cutting force slightly, as observed from a comparison of Figure 19c,d. This would be the result of the chips being flushed away from the cutting zone, thus avoiding chip recutting.

3.4. Surface Roughness

In this section, examples of roughness profiles and burr formation taken from the A7075 base alloy (treatment #1, Table 6) and the A7075-Li-Sc alloy (treatment #9, Table 9) under dry condition milling will be reviewed (cutting forces are 60 N and 200 N, respectively). Figure 20a depicts the profile heights of the machined surface of A7075 alloy (cutting force of about 60 N). As can be seen, the signals are very close to each other, with irregular heights and bottoms (with a maximum height of 2 µm). However, the profile obtained from the A7075-Li-Sc alloy (with cutting forces of about 200 N—Figure 20b) reveals rather systematic cycles with a relatively maximum height of 3 µm, typical of hard metals. Occasionally, when the tool hits a defected area, a negating long peak can be clearly observed (Figure 20c). Figure 21 is an example of the effect of the interaction between feed rate and alloy hardness on the alloy surface roughness, represented by the corresponding increase in the value of Ra (average heights in Figure 20).
Figure 22a reveals the machined surface of A7075 alloy (60 N), showing the traces of the machining tool (note the presence of a surface defect in the white circle), whereas Figure 22b depicts the 3D X-ray surface topography of Figure 22a. As can be seen, the machining marks are rather shallow. Increasing the cutting force to 200 N (A7075-Li-Sc alloy) resulted in an increase in the surface roughness (Figure 22c). However, no surface damage has been reported, as confirmed from the X-ray 3D surface topography displayed in Figure 22d. According to Hamed et al. [65,66], the addition of copper to aluminum-based alloys leads to a better surface finishing compared to Al-Si alloys, which may explain the sluggish response of the surface of the present alloys to machining.

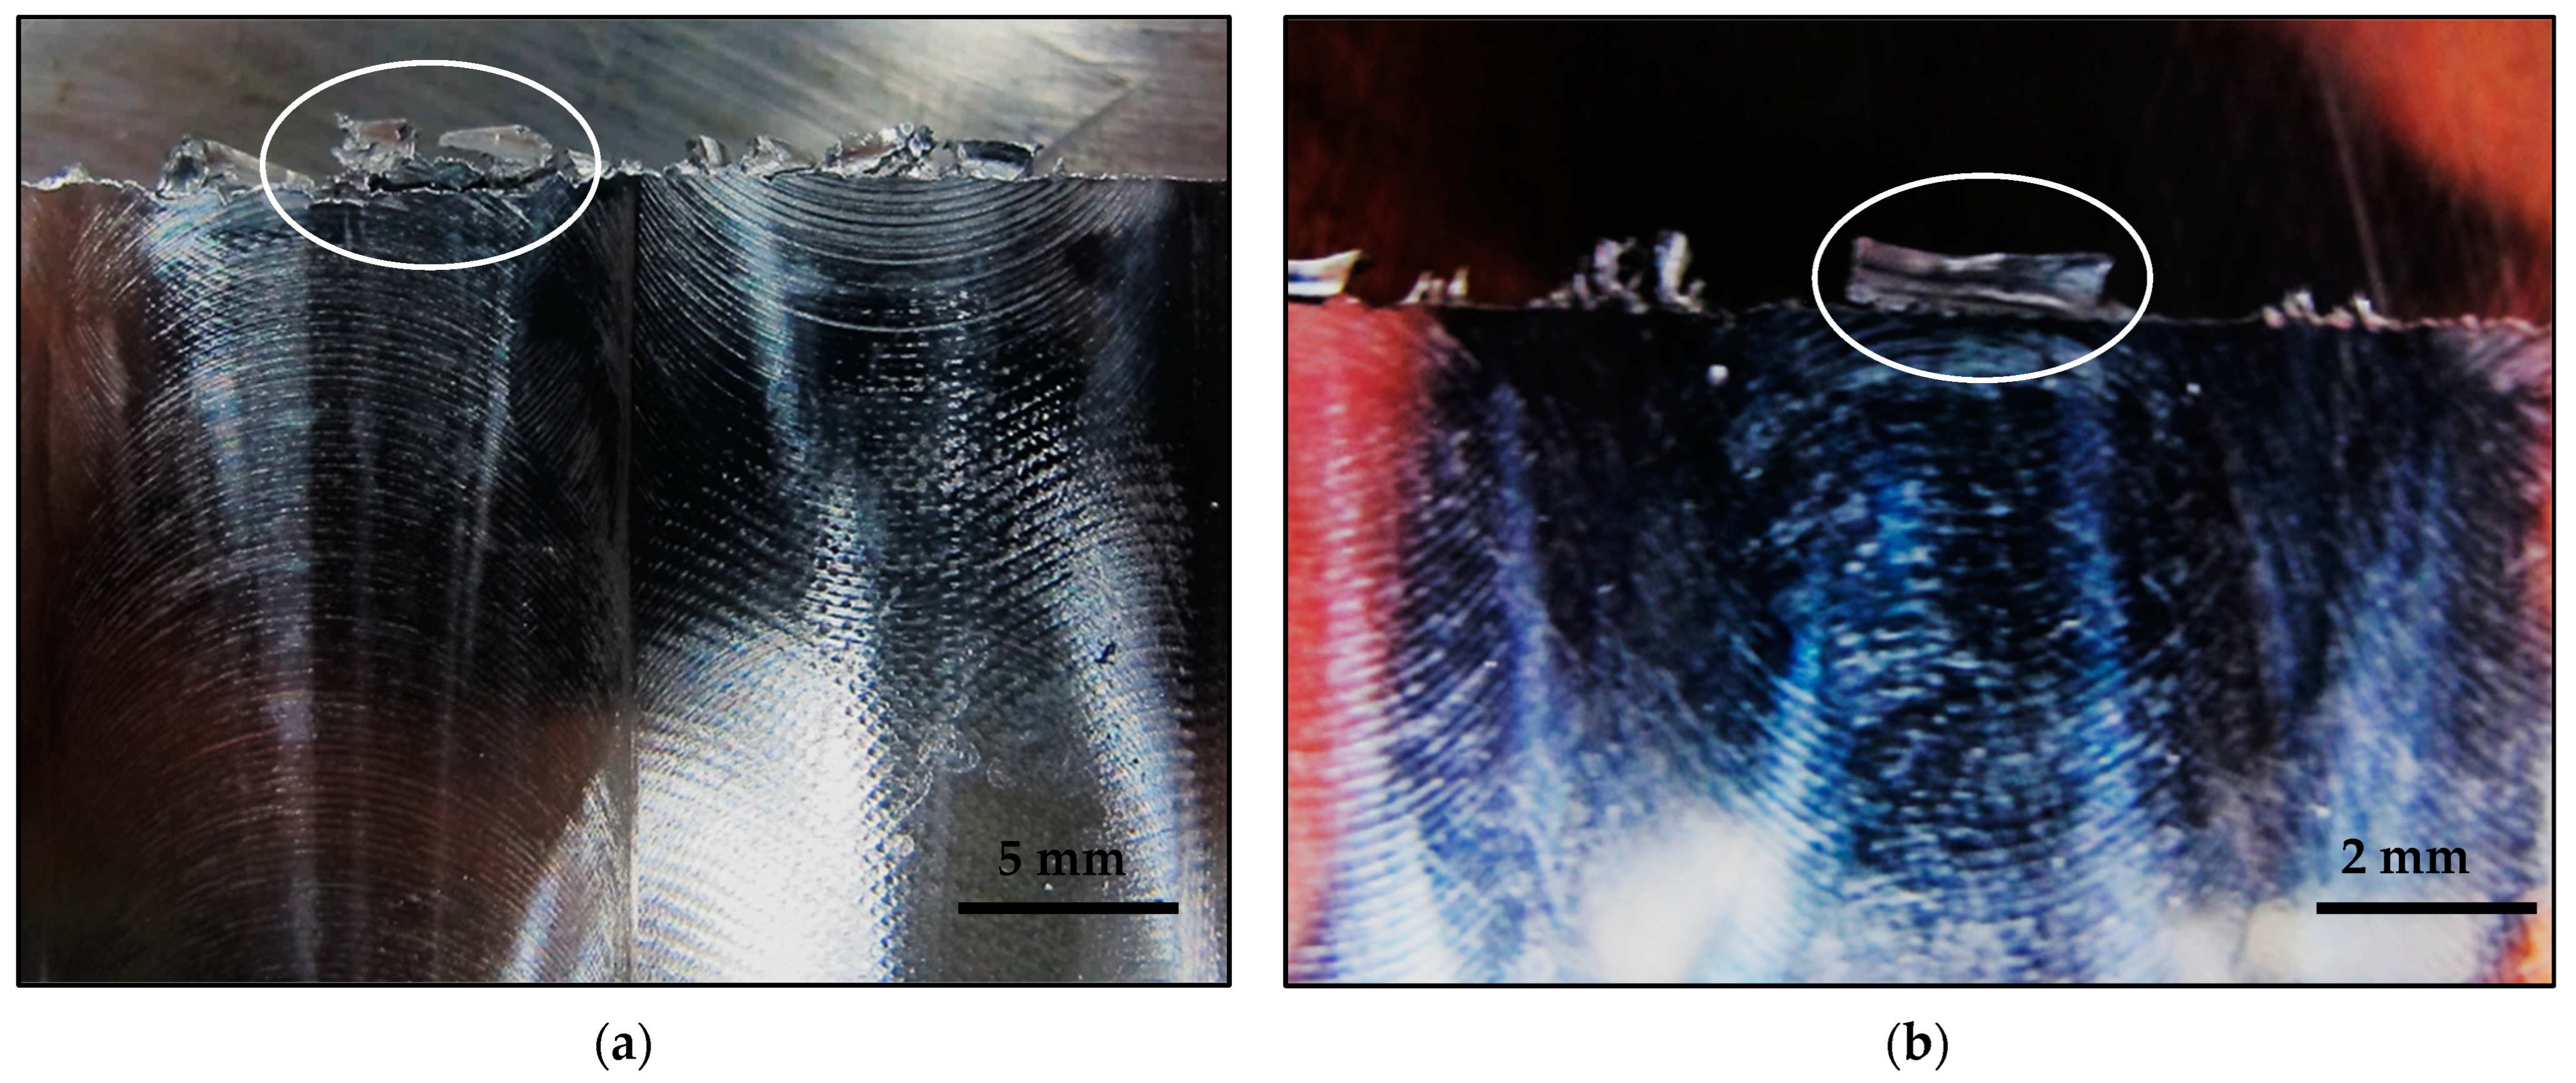
3.5. Burr and Chip Formation

The machinability of a certain material is evaluated based on one or more of the following factors: (a) tool life, (b) cutting forces, (c) chip formation, and (d) the quality of the machined surface. In the following sections, the machinability of aluminum alloys is explained by referring to the above-mentioned machinability criteria [67]. According to Songmene et al. [68], burrs forming during machining are defined as an extension of the material beyond the workpiece edges. These extensions should be limited rather than deburring them by applying a subsequent operation [69,70].
In the present work, the debris is separated from the edge of the workpiece (positive burr), as demonstrated in Figure 23, showing examples of positive burr formation for both workpieces. In all alloys studied, the chips maintained a spiral form with shiny surfaces and no sign of burning. Such chips can be seen in Figure 24a. However, due to the high strength of A7075-Li-Sc alloy, a few cracks were observed (see white arrows). Additionally, the edges are clearly rougher (white arrow), compared to those obtained from the base alloys (Figure 24c).

4. Conclusions

Based on the results described in the present work, the following conclusions may be drawn:
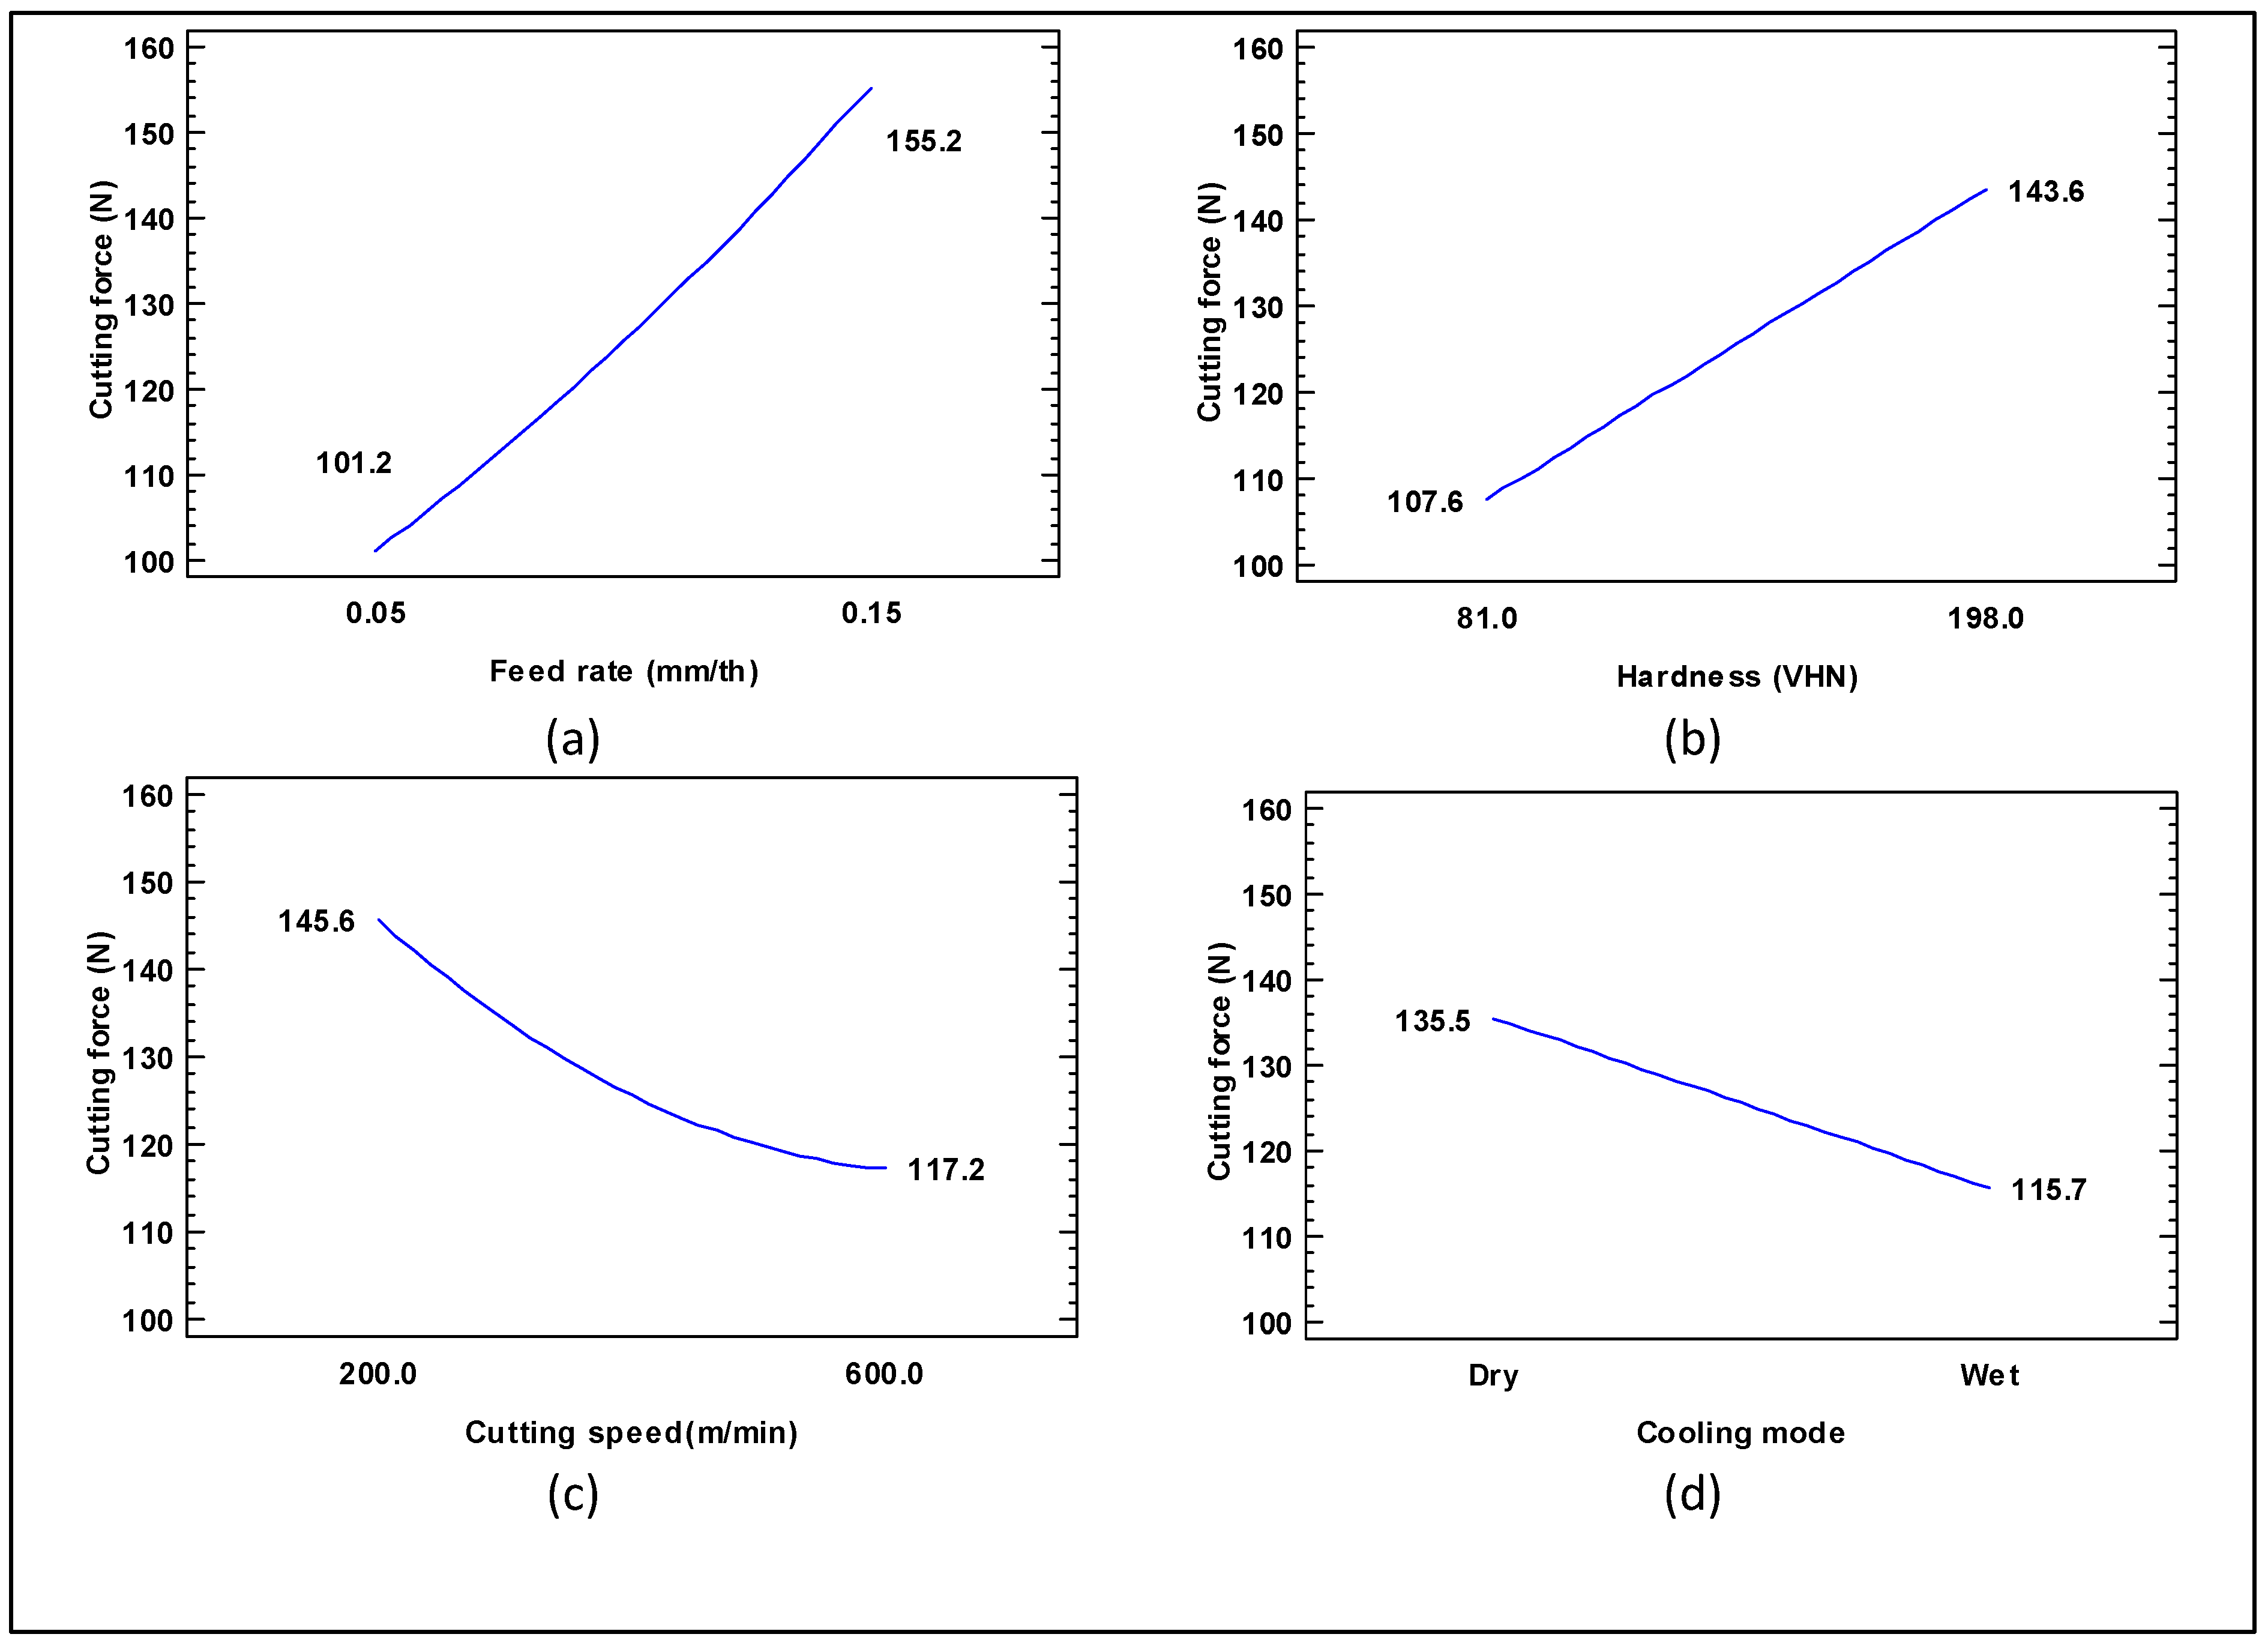
  • The feed rate has the most significant effect on the cutting force in all the studied alloys, with a more pronounced impact observed in the A7075 alloy under wet machining conditions.
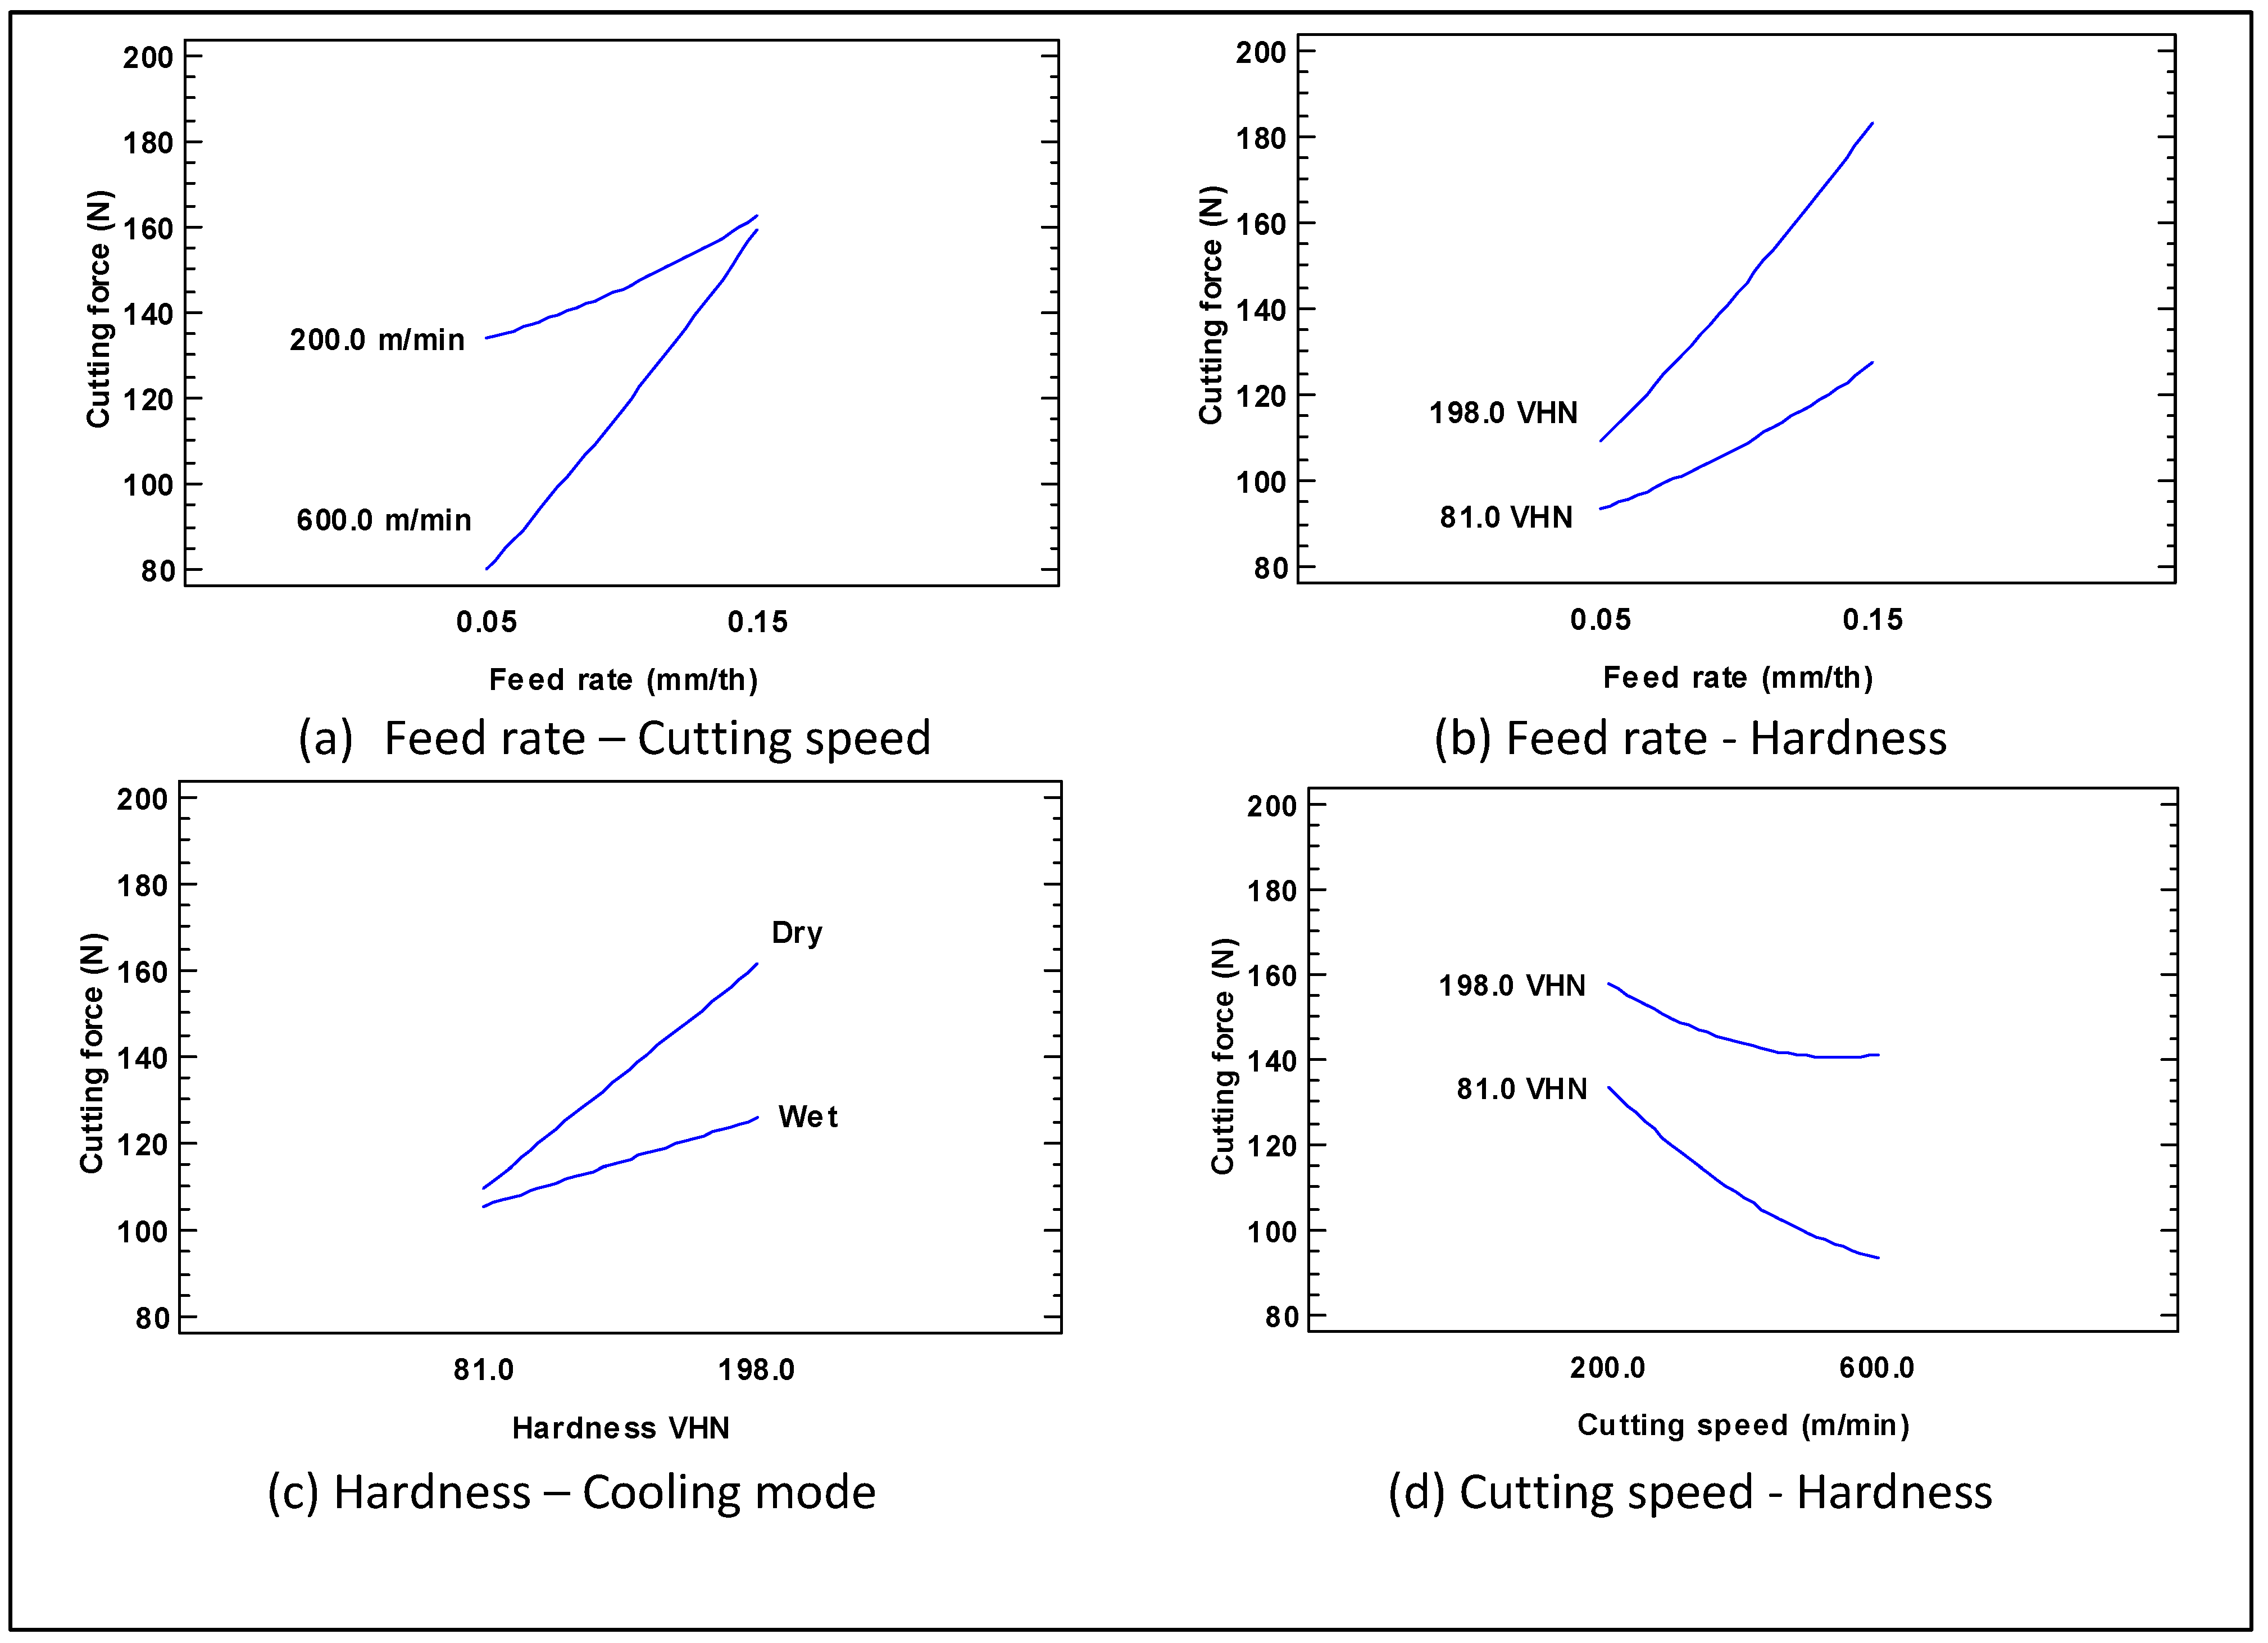
  • As for the A7075-Li and A7075-Li-Sc alloys, the impact of feed rate was more significant in workpieces with high hardness, i.e., aged at 120 °C/24 h.
  • Wet machining significantly reduces the cutting force, with a more pronounced effect on harder materials, regardless of their composition.
  • Dry machining yields satisfactory results when the alloys are in their soft conditions (i.e., aged at 280 °C/8 h, in particular for the A7075-Li-Sc alloy).
  • It is recommended that the T6 heat treatment process (120 °C/24 h) be applied to the machined parts to enhance their hardness, which would significantly optimize their machinability characteristics.
  • A practical conclusion drawn from the cutting force analysis is that, while increasing cutting speed generally reduces cutting force, this trend is more pronounced at lower feed rates for all alloys, at different levels.
  • The implication of selecting lower feed rates and higher cutting speeds for the machining of these alloys not only reduces the cutting force but also maintains high material removal rates, making it an advantageous choice.

Author Contributions

Conceptualization, F.H.S. and A.M.S.; methodology, A.T. and Y.Z.; formal analysis, A.T. and J.B.M.M.; investigation, A.T. and J.B.M.M., data curation, A.T. and Y.Z.; writing—original draft and preparation, F.H.S. and A.M.S.; writing—review and editing, A.M.S.; supervision, V.S. and F.H.S.; project administration, V.S. and F.H.S.; funding acquisition, F.H.S. All authors have read and agreed to the published version of the manuscript.

Funding

This research received no external funding.

Data Availability Statement

Data will be made available upon request.

Acknowledgments

The authors would like to thank Amal Samuel for enhancing the quality of the figures used in the present work.

Conflicts of Interest

The authors declare no conflict of interest.

References

  1. Sunar, T.; Tuncay, T.; Özyürek, D.; Gürü, M. Investigation of Mechanical Properties of AA7075 Alloys Aged by Various Heat Treatments. Phys. Met. Met. 2020, 121, 1440–1446. [Google Scholar] [CrossRef]
  2. Altuntaş, G.; Altuntaş, O.; Bostan, B. Characterization of Al-7075/T651 Alloy by RRA Heat Treatment and Different Pre-deformation Effects. Trans. Indian Inst. Met. 2021, 74, 3025–3033. [Google Scholar] [CrossRef]
  3. Sajadifar, S.V.; Moeini, G.; Scharifi, E.; Lauhoff, C.; Böhm, S.; Niendorf, T. On the Effect of Quenching on Postweld Heat Treatment of Friction-Stir-Welded Aluminum 7075 Alloy. J. Mater. Eng. Perform. 2019, 28, 5255–5265. [Google Scholar] [CrossRef]
  4. Zou, X.L.; Hong, Y.A.N.; Chen, X.H. Evolution of second phases and mechanical properties of 7075 Al alloy processed by solution heat treatment. Trans. Nonferrous Met. Soc. China 2017, 27, 2146–2155. [Google Scholar] [CrossRef]
  5. Stojanovic, B.; Bukvic, M.; Epler, I. Application of aluminum and aluminum alloys in engineering. Appl. Eng. Lett. J. Eng. Appl. Sci. 2018, 3, 52–62. [Google Scholar] [CrossRef]
  6. Tajally, M.; Emadoddin, E. Mechanical and anisotropic behaviors of 7075 aluminum alloy sheets. Mater. Des. 2011, 32, 1594–1599. [Google Scholar] [CrossRef]
  7. Rana, R.S.; Purohit, R.; Das, S. Reviews on the influences of alloying elements on the microstructure and mechanical properties of aluminum alloys and aluminum alloy composites. Int. J. Sci. Res. Publ. 2012, 2, 1–7. [Google Scholar]
  8. Suresh, M.; Sharma, A.; More, A.; Nayan, N.; Suwas, S. Effect of Scandium addition on evolution of microstructure, texture and mechanical properties of thermo-mechanically processed Al-Li alloy AA2195. J. Alloys Compd. 2018, 740, 364–374. [Google Scholar] [CrossRef]
  9. Wang, Y.; Wu, X.; Cao, L.; Tong, X.; Zou, Y.; Zhu, Q.; Tang, S.; Song, H.; Guo, M. Effect of Ag on aging precipitation behavior and mechanical properties of aluminum alloy 7075. Mater. Sci. Eng. A 2020, 804, 140515. [Google Scholar] [CrossRef]
  10. Zhang, J.Z.; Chen, J.C.; Kirby, E.D. Surface roughness optimization in an end-milling operation using the Taguchi design method. J. Am. Acad. Dermatol. 2007, 184, 233–239. [Google Scholar] [CrossRef]
  11. Toenshoff, H.K.; Denkena, B. Basics of Cutting and Abrasive Processes; Springer: Berlin/Heidelberg, Germany, 2013. [Google Scholar]
  12. Trent, E.M.; Wright, P.K. Metal Cutting; Butterworth-Heinemann: Boston, MA, USA, 2000. [Google Scholar]
  13. Lee, Y.J.; Wang, H. Sustainability of methods for augmented ultra-precision machining. Int. J. Precis. Eng. Manuf. Technol. 2023, 11, 585–624. [Google Scholar] [CrossRef]
  14. Astakhov, V.P. Improving sustainability of machining operation as a system endeavor. In Sustainable Machining; Davim, J., Ed.; Springer International Publishing: Cham, Switzerland, 2017; pp. 1–29. [Google Scholar]
  15. Mallick, R.; Kumar, R.; Panda, A.; Sahoo, A.K. Current Status of Hard Turning in Manufacturing: Aspects of Cooling Strategy and Sustainability. Lubricants 2023, 11, 108. [Google Scholar] [CrossRef]
  16. Chen, A.; Peng, Y.; Zhang, L.; Wu, G.; Li, Y. Microstructural evolution and mechanical properties of cast Al-3Li-1.5Cu-0.2Zr alloy during heat treatment. Mater. Charact. 2016, 114, 234–242. [Google Scholar] [CrossRef]
  17. Samuel, E.; Tahiri, H.; Samuel, A.M.; Songmene, V.; Samuel, F.H. A Review on Fundamentals of Grain Refining of Al-Si Cast Alloys. In Recent Advancements in Aluminum Alloys; IntechOpen Limited: London, UK, 2024; p. 83. [Google Scholar] [CrossRef]
  18. Tahiri, H.; Samuel, A.M.; Doty, H.W.; Valtierra, S.; Samuel, F.H. Effect of Sr–Grain Refiner–Si interactions on the microstructure characteristics of Al–Si hypereutectic alloys. Int. J. Met. 2018, 12, 307–320. [Google Scholar] [CrossRef]
  19. Nafisi, S.; Ghomashchi, R. Grain refining of conventional and semi-solid A356 Al–Si alloy. J. Mater. Process. Technol. 2006, 174, 371–383. [Google Scholar] [CrossRef]
  20. Dong, X.; Ji, S. Si poisoning and promotion on the microstructure and mechanical properties of Al–Si–Mg cast alloys. J. Mater. Sci. 2018, 53, 7778–7792. [Google Scholar] [CrossRef]
  21. Easton, M.; St John, D. A model of grain refinement incorporating alloy constitution and potency of heterogeneous nucleant particles. Acta Mater. 2001, 49, 1867–1878. [Google Scholar] [CrossRef]
  22. Qian, M.; Cao, P.; Easton, M.; McDonald, S.; StJohn, D. An analytical model for constitutional supercooling-driven grain formation and grain size prediction. Acta Mater. 2010, 58, 3262–3270. [Google Scholar] [CrossRef]
  23. Men, H.; Fan, Z. Effects of solute content on grain refinement in an isothermal melt. Acta Mater. 2011, 59, 2704–2712. [Google Scholar] [CrossRef]
  24. StJohn, D.; Qian, M.; Easton, M.; Cao, P. The Interdependence Theory: The relationship between grain formation and nucleant selection. Acta Mater. 2011, 59, 4907–4921. [Google Scholar] [CrossRef]
  25. Hall, E.O. The deformation and ageing of mild steel: III discussion of results. Proc. Phys. Soc. Sect. B 1951, 64, 747–753. [Google Scholar] [CrossRef]
  26. Petch, N.J. The cleavage strength of polycrystals. J. Iron Steel Inst. 1953, 174, 25–28. [Google Scholar]
  27. Armstrong, R.W. 60 years of Hall-Petch: Past to present nano-scale connections. Mater. Trans. 2014, 55, 2–12. [Google Scholar] [CrossRef]
  28. Cordero, Z.C.; Knight, B.E.; Schuh, C.A. Six decades of the Hall–Petch effect—A survey of grain-size strengthening studies on pure metals. Int. Mater. Rev. 2016, 61, 495–512. [Google Scholar] [CrossRef]
  29. Meyers, M.A.; Mishra, A.; Benson, D.J. Mechanical properties of nanocrystalline materials. Prog. Mater. Sci. 2006, 51, 427–556. [Google Scholar] [CrossRef]
  30. Marquis, E.A.; Seidman, D.N. Nanoscale structural evolution of Al3Sc precipitates in Al (Sc) alloys. Acta Mater. 2001, 49, 1909–1919. [Google Scholar] [CrossRef]
  31. DebRoy, T.; Wei, H.L.; Zuback, J.S.; Mukherjee, T.; Elmer, J.W.; Milewski, J.O.; Beese, A.M.; Wilson-Heid, A.; De, A.; Zhang, W. Additive manufacturing of metallic components—Process, structure and properties. Prog. Mater. Sci. 2018, 92, 112–224. [Google Scholar] [CrossRef]
  32. Li, S.-S.; Li, L.; Han, J.; Wang, C.-T.; Xiao, Y.-Q.; Jian, X.-D.; Qian, P.; Su, Y.-J. First-Principles study on the nucleation of precipitates in ternary Al alloys doped with Sc, Li, Zr, and Ti elements. Appl. Surf. Sci. 2020, 526, 146455. [Google Scholar] [CrossRef]
  33. Prasad, N.E.; Ramachandran, T.R. Chapter 3—Phase diagrams and phase reactions in Al–Li alloys. In Aluminum-Lithium Alloys; Prasad, N.E., Gokhale, A.A., Wanhill, R.J.H., Eds.; Butterworth-Heinemann: Boston, MA, USA, 2014; pp. 61–97. [Google Scholar]
  34. Khan, M.A.; Wang, Y.; Afifi, M.A.; Malik, A.; Nazeer, F.; Yasin, G.; Jiawei, B.; Zhang, H. Microstructure and mechanical properties of an Al-Zn-Cu-Mg alloy processed by hot forming processes followed by heat treatments. Mater. Charact. 2019, 157, 109901. [Google Scholar] [CrossRef]
  35. Milkereit, B.; Österreich, M.; Schuster, P.; Kirov, G.; Mukeli, E.; Kessler, O. Dissolution and Precipitation Behavior for Hot Forming of 7021 and 7075 Aluminum Alloys. Metals 2018, 8, 531. [Google Scholar] [CrossRef]
  36. Hu, T.; Ma, K.; Topping, T.; Schoenung, J.; Lavernia, E. Precipitation phenomena in an ultrafine-grained Al alloy. Acta Mater. 2013, 61, 2163–2178. [Google Scholar] [CrossRef]
  37. Viana, F.; Pinto, A.M.P.; Santos, H.M.C.; Lopes, A.B. Retrogression and re-ageing of 7075 aluminium alloy: Microstructural characterization. J. Mater. Process. Technol. 1999, 92–93, 54–59. [Google Scholar] [CrossRef]
  38. Zhao, X.; Liu, W.; Xiao, D.; Ma, Y.; Huang, L.; Tang, Y. A critical review: Crystal structure, evolution and interaction mechanism with dislocations of nano precipitates in Al-Li alloys. Mater. Des. 2022, 217, 110629. [Google Scholar] [CrossRef]
  39. Samuel, F.H. Microstructural characterization of rapidly solidified Al-Li-Co powders. Met. Trans. A 1986, 17, 73–91. [Google Scholar] [CrossRef]
  40. Flores-Campos, R.; Estrada-Guel, I.; Miki-Yoshida, M.; Martínez-Sánchez, R.; Herrera-Ramírez, J.M. Microstructure and mechanical properties of 7075 aluminum alloy nanostructured composites processed by mechanical milling and indirect hot extrusion. Mater. Charact. 2012, 63, 39–46. [Google Scholar] [CrossRef]
  41. Rokni, M.R.; Zarei-Hanzaki, A.; Abedi, H.R.; Haghdadi, N. Microstructure evolution and mechanical properties of backward thixoextruded 7075 aluminum alloy. Mater. Des. (1980-2015) 2012, 36, 557–563. [Google Scholar] [CrossRef]
  42. Luo, J.; Luo, H.; Li, S.; Wang, R.; Ma, Y. Effect of pre-ageing treatment on second nucleating of GPII zones and precipitation kinetics in an ultrafine grained 7075 aluminum alloy. Mater. Des. 2019, 187, 108402. [Google Scholar] [CrossRef]
  43. Zhang, Y.; Jin, S.; Trimby, P.W.; Liao, X.; Murashkin, M.Y.; Valiev, R.Z.; Liu, J.; Cairney, J.M.; Ringer, S.P.; Sha, G. Dynamic precipitation, segregation and strengthening of an Al-Zn-Mg-Cu alloy (AA7075) processed by high-pressure torsion. Acta Mater. 2018, 162, 19–32. [Google Scholar] [CrossRef]
  44. Lee, Y.-S.; Koh, D.-H.; Kim, H.-W.; Ahn, Y.-S. Improved bake-hardening response of Al-Zn-Mg-Cu alloy through pre-aging treatment. Scr. Mater. 2018, 147, 45–49. [Google Scholar] [CrossRef]
  45. Peng, X.; Li, Y.; Liang, X.; Guo, Q.; Xu, G.; Peng, Y.; Yin, Z. Precipitate behavior and mechanical properties of enhanced solution treated Al-Zn-Mg-Cu alloy during non-isothermal ageing. J. Alloys Compd. 2018, 735, 964–974. [Google Scholar] [CrossRef]
  46. dos Santos, J.; Staron, P.; Fischer, T.; Robson, J.; Kostka, A.; Colegrove, P.; Wang, H.; Hilgert, J.; Bergmann, L.; Hütsch, L.; et al. Understanding precipitate evolution during friction stir welding of Al-Zn-Mg-Cu alloy through in-situ measurement coupled with simulation. Acta Mater. 2018, 148, 163–172. [Google Scholar] [CrossRef]
  47. Reda, Y.; Yehia, H.; El-Shamy, A. Microstructural and mechanical properties of Al-Zn alloy 7075 during RRA and triple aging. Egypt. J. Pet. 2021, 31, 9–13. [Google Scholar] [CrossRef]
  48. Kilic, S.; Kacar, I.; Sahin, M.; Ozturk, F.; Erdem, O. Effects of Aging Temperature, Time, and Pre-Strain on Mechanical Properties of AA7075. Mater. Res. 2019, 22, e20190006. [Google Scholar] [CrossRef]
  49. Guner, A.T.; Dispinar, D.; Tan, E. Microstructural and Mechanical Evolution of Semisolid 7075 Al Alloy Produced by SIMA Process at Various Heat Treatment Parameters. Arab. J. Sci. Eng. 2019, 44, 1243–1253. [Google Scholar] [CrossRef]
  50. Sajadifar, S.V.; Krooß, P.; Fröck, H.; Milkereit, B.; Kessler, O.; Niendorf, T. Effects of Aging under Stress on Mechanical Properties and Microstructure of EN AW 7075 Alloy. Metals 2021, 11, 1142. [Google Scholar] [CrossRef]
  51. Sajadifar, S.V.; Scharifi, E.; Weidig, U.; Steinhoff, K.; Niendorf, T. Effect of Tool Temperature on Mechanical Properties and Microstructure of Thermo-Mechanically Processed AA6082 and AA7075 Aluminum Alloys. HTM J. Heat Treat. Mater. 2020, 75, 177–191. [Google Scholar] [CrossRef]
  52. Scharifi, E.; Savaci, U.; Kavaklioglu, Z.; Weidig, U.; Turan, S.; Steinhoff, K. Effect of thermo-mechanical processing on quench-induced precipitates morphology and mechanical properties in high strength AA7075 aluminum alloy. Mater. Charact. 2021, 174, 111026. [Google Scholar] [CrossRef]
  53. Liu, B.; Hu, X. Chapter 1—Hollow Micro- and Nanomaterials: Synthesis and Applications. In Micro and Nano Technologies, Advanced Nanomaterials for Pollutant Sensing and Environmental Catalysis; Zhao, Q., Ed.; Elsevier: Amsterdam, The Netherlands, 2020; pp. 1–38. [Google Scholar]
  54. Marani, M.; Songmene, V.; Zeinali, M.; Kouam, J.; Zedan, Y. Neuro-fuzzy predictive model for surface roughness and cutting force of machined Al–20 Mg2Si–2Cu metal matrix composite using additives. Neural Comput. Appl. 2019, 32, 8115–8126. [Google Scholar] [CrossRef]
  55. Zhang, P.; Zhang, X.; Cao, X.; Yu, X.; Wang, Y. Analysis on the tool wear behavior of 7050-T7451 aluminum alloy under ultrasonic elliptical vibration cutting. Wear 2020, 466–467, 203538. [Google Scholar] [CrossRef]
  56. Zhang, P.; Yue, X.J.; Wang, P.H.; Yu, X. Surface integrity and tool wear mechanism of 7050-T7451 aluminum alloy under dry cutting. Vacuum 2020, 184, 31. [Google Scholar]
  57. Belhocine, A.; Ghazaly, N.M. Effects of material properties on generation of brake squeal noise using finite element method. Lat. Am. J. Solids Struct. 2015, 12, 1432–1447. [Google Scholar] [CrossRef]
  58. Junge, T.; Liborius, H.; Mehner, T.; Nestler, A.; Schubert, A.; Lampke, T. Measurement system based on the Seebeck effect for the determination of temperature and tool wear during turning of aluminum alloys. Procedia CIRP 2020, 93, 1435–1441. [Google Scholar] [CrossRef]
  59. Meng, X.; Lin, Y.; Mi, S. An Improved Johnson–Cook Constitutive Model and Its Experiment Validation on Cutting Force of ADC12 Aluminum Alloy During High-Speed Milling. Metals 2020, 10, 1038. [Google Scholar] [CrossRef]
  60. Cantero, J.L.; Díaz-Álvarez, J.; Miguélez, M.H.; Marín, N.C. Analysis of tool wear patterns in finishing turning of Inconel 718. Wear 2013, 297, 885–894. [Google Scholar] [CrossRef]
  61. Gupta, M.K.; Korkmaz, M.E.; Sarıkaya, M.; Krolczyk, G.M.; Günay, M.; Wojciechowski, S. Cutting forces and temperature measurements in cryogenic assisted turning of AA2024-T351 alloy: An experimentally validated simulation approach. Measurement 2021, 188, 110594. [Google Scholar] [CrossRef]
  62. Shankar, S.; Mohanraj, T. Tool condition monitoring in milling using sensor fusion technique. In Proceedings of the Malaysian International Tribology Conference, Penang, Malaysia, 16–17 November 2015; pp. 322–323. [Google Scholar]
  63. Shankar, S.; Mohanraj, T.; Thangarasu, S.K. Multi-response milling process optimization using the Taguchi method coupled to grey relational analysis. Mater. Test. 2016, 58, 462–470. [Google Scholar] [CrossRef]
  64. Pham, T.-H.; Nguyen, D.-T.; Banh, T.-L.; Tong, V.-C. Experimental study on the chip morphology, tool–chip contact length, workpiece vibration, and surface roughness during high-speed face milling of A6061 aluminum alloy. Proc. Inst. Mech. Eng. Part B J. Eng. Manuf. 2019, 234, 610–620. [Google Scholar] [CrossRef]
  65. Yuan, Y.; Jing, X.; Li, H.; Ehmann, K.F.; Zhang, D. Chatter detection based on wavelet coherence functions in micro-end-milling processes. Proc. Inst. Mech. Eng. Part B J. Eng. Manuf. 2018, 233, 1934–1945. [Google Scholar] [CrossRef]
  66. Hamed, M.; Zedan, Y.; Samuel, A.M.; Doty, H.W.; Samuel, F.H. Effect of tool quality on the machinability characteristics of Al-Cu and Al-Si cast alloys. Int. J. Adv. Manuf. Technol. 2019, 106, 1317–1326. [Google Scholar] [CrossRef]
  67. Hamed, M.; Zedan, Y.; Samuel, A.M.; Doty, H.W.; Samuel, F.H. Milling parameters of Al-Cu and Al-Si cast alloys. Int. J. Adv. Manuf. Technol. 2019, 104, 3731–3743. [Google Scholar] [CrossRef]
  68. Songmene, V.; Khettabi, R.; Zaghbani, I.; Kouam, J.; Djebara, A. Machining and machinability of aluminum alloys. Alum. Alloys Theory Appl. 2011, 377, 400. [Google Scholar]
  69. Balout, B.; Songmene, V.; Masounave, J. An Experimental study of dust generation during dry drilling of pre-cooled and pre-heated workpiece materials. J. Manuf. Process. 2007, 9, 23–34. [Google Scholar] [CrossRef]
  70. Barry, J.; Byrne, G. The mechanisms of chip formation in machining hardened steels. J. Manuf. Sci. Eng. 2002, 124, 528–535. [Google Scholar] [CrossRef]
Figure 1. Cutting tool specifications.
Jmmp 08 00083 g001
Figure 2. Grain size of alloys; (a) A7075, (b) A7075-Sc, (c) A7075-Li-Sc, respectively, in the as-cast condition, (df) characteristics of grain diameters.
Jmmp 08 00083 g002aJmmp 08 00083 g002b
Figure 3. (a) Backscattered electron image of alloy A7075 in the as-cast condition-arrow points to eutectic reaction, (b) high-magnification electron micrograph of the precipitated particles within the grain in (a)-arrow points to the thickness of the preciîtates, (c) EDS spectrum corresponding to the area in (a), indicated by the white arrows exhibiting peaks due to Al, Mg, Cu, and Zn, covering both L- and K- lines.
Jmmp 08 00083 g003
Figure 4. (a) Backscattered electron image of A7075+Sc alloy aged at 120 °C for 24 h revealing precipitation of dense, fine spherical particles, whereas (b) illustrates the precipitation of δ’-Al3Li phase particles, (c) TEM image of δ’-Al3Li phase particles in Al-3%Li alloy in the T6 condition [39].
Jmmp 08 00083 g004
Figure 5. (a,b) Backscattered electron images of A7075-Sc alloy aged at 280 °C for 8 h, (c) EDS spectrum corresponding to white square in (a) showing peaks due to Al, Cu, Zn, and Mg elements with a small peak of Ag.
Jmmp 08 00083 g005
Figure 6. Pareto chart of cutting force for A7075.
Jmmp 08 00083 g006
Figure 7. Main effects plot for cutting force in machining of A7075: (a) feed rate, (b) cooling mode, (c) cutting speed, (d) hardness.
Jmmp 08 00083 g007
Figure 8. Interaction plot for cutting force in A7075 machining.
Jmmp 08 00083 g008
Figure 9. Three-dimensional surface plots of cutting force in different hardness and cooling modes for A7075: (a) low hardness-dry, (b) low hardness-wet, (c) high hardness-dry, (d) high hardness-wet.
Jmmp 08 00083 g009
Figure 10. Pareto chart of cutting force for A7075–Sc.
Jmmp 08 00083 g010
Figure 11. Main effects plot for cutting force in machining of A7075-Sc: (a) feed rate, (b) cooling mode, (c) hardness, (d) cutting speed.
Jmmp 08 00083 g011
Figure 12. Interaction plot for cutting force in A7075-Sc machining.
Jmmp 08 00083 g012
Figure 13. Three-dimensional surface plots of cutting force in different hardness and cooling modes for A7075-Sc: (a) low hardness-dry, (b) low hardness-wet, (c) high hardness- dry, (d) high hardness-wet.
Jmmp 08 00083 g013
Figure 14. Pareto chart of cutting force for A7075–Li–Sc.
Jmmp 08 00083 g014
Figure 15. Main effects plot for cutting force in machining of A7075–Li-Sc: (a) feed rate, (b) hardness, (c) cutting speed, (d) cooling mode.
Jmmp 08 00083 g015
Figure 16. Interaction plot for cutting force in A7075–Li-Sc machining: (a) feed rate-cutting speed, (b) feed rate-hardness, (c) hardness-cooling mode, (d) cutting speed-hardness.
Jmmp 08 00083 g016
Figure 17. Three-dimensional surface plots of cutting force in different hardness and cooling modes for A7075-Li-Sc: (a) low hardness-dry, (b) low hardness-wet, (c) high hardness- dry, (d) high hardness-wet.
Jmmp 08 00083 g017
Figure 18. Comparative performance of the A7075 alloys when using low cutting speed: effects of hardness, feed rate, and cooling mode: (a) high feed rate-dry, (b) high feed rate-wet, (c) low feed rate-dry, (d) low feed rate-wet.
Jmmp 08 00083 g018
Figure 19. Comparative performance of the A7075 alloys when using a moderate feed rate: effects of hardness, cutting speed, and cooling mode: (a) low cutting speed-dry, (b) low cutting speed-wet (c) high cutting speed-dry, (d) high cutting speed-wet.
Jmmp 08 00083 g019
Figure 20. Profiles of machined workpieces: (a) A7075 alloy, 60 N, (b) A7075-Li-Sc alloy, 200 N, (c) A7075 alloy exhibiting a surface defect. Numbers represent the cutting forces.
Jmmp 08 00083 g020
Figure 21. Interaction plot for Ra in machining of Al 7075–Li-Sc alloy.
Jmmp 08 00083 g021
Figure 22. Surface roughness of workpiece: (a) A7075 alloy-60 N—the white circle shows the presence of a surface defect, (b) X-ray surface topography of (a), (c) A7075-Li-Sc alloy-200 N, (d) X-ray surface topography of (c). Numbers represent cutting forces.
Jmmp 08 00083 g022
Figure 23. Burr forms: (a) A7075 alloy-60 N, (b) A7075-Li-Sc alloy-200 N. Numbers represent cutting forces- White circles point to the separation of burr from the workpiece.
Jmmp 08 00083 g023
Figure 24. Chips’ shape: (a,b) base A7075 alloy (60 N) and (c,d) A7075-Li-Sc alloy (200 N). Numbers represent cutting forces. Black circle in (d) highlights fracture of the chips.
Jmmp 08 00083 g024
Table 1. Chemical composition (wt%) of A7075 workpiece materials.
CodeSiMgCrFeCuZnZrTiLiScAg
A70750.202.10.180.161.55.6-0.03----
A7075-Sc0.112.80.160.051.56.60.30.160.060.120.27
A7075-Li-Sc0.162.20.140.101.36.50.30.152.20.180.27
Table 2. Applied heat treatment process.
NumberSolution Heat TreatmentQuenchingArtificial Aging
1(8 h @ 470 °C)Quenched in warm water at 60 °CNone
2Single aging (24 h @ 120 °C)
3Single aging (8 h @ 280 °C)
4Double aging (24 h @ 120 °C + 8 h @ 180 °C)
5Double aging (8 h @ 180 °C + 24 h @ 120 °C)
6Double aging (8 h @ 280 °C + 24 h @ 120 °C)
Table 3. Experimental variables and their levels.
Experimental VariablesLevel 1Level 2Level 3
Cutting speed (m/min)200400600
Feed per tooth (mm/z)0.050.10.15
Cooling modeDry-Wet
MaterialA7075A7075-ScA7075-Li-Sc
Aging treatment8 h @ 280 °C-24 h @ 120 °C
Table 4. Cutting parameters of each condition.
Test
(Tool Path)
Cutting Speed
(m/min)
Feed Rate
(mm/tooth)
Cutting Time
(s)
12000.054.71
24000.052.36
36000.051.57
42000.12.36
54000.11.18
66000.10.79
72000.151.57
84000.150.79
96000.150.52
Table 5. Microhardness of alloys subjected to different heat treatments.
Heat TreatmentSolution Heat TreatmentArtificial AgingAlloy TypeMicro-Hardness (HVN)
18 h @ 470 °C-A7075113.7
A7075-Sc149.6
A7075-Li-Sc155.4
2Single aging
(24 h @ 120 °C)
A7075176
A7075-Sc185
A7075-Li-Sc198
3Single aging
(8 h @ 280 °C)
A707562.6
A7075-Sc79.2
A7075-Li-Sc80.8
4Double aging
(24 h @ 120 °C + 8 h @ 180 °C)
A7075142.7
A7075-Sc167.4
A7075-Li-Sc174.8
5Double aging
(8 h @ 180 °C + 24 h @ 120 °C)
A7075144.8
A7075-Sc171.9
A7075-Li-Sc174
6Double aging
(8 h @ 280 °C + 24 h @ 120 °C)
A707565.9
A7075-Sc78.8
A7075-Li-Sc78.7
Table 6. (a) Cutting force results of A7075 dependence on cutting speed and feed rate. (b) The details of the ANOVA parameters.
(a)
MaterialTest NumberCutting Speed
(m/min)
Feed
Rate
(mm/tooth)
F (N)
Softest
(62 VHN)
Hardest
(176 VHN)
DryWetDryWet
A707512000.0561.073.0203.8261.1
20.10106.4112.5149.4233.6
30.15149.0154.8200.4233.8
44000.0562.381.680.3132.7
50.10103.4118.0121.2150.9
60.15145.6164.1172.0184.5
76000.0553.973.573.788.1
80.190.8119.2114.8125.0
90.15124.4165.7155.7170.2
(b)
SourceSum of SquaresDfMean SquareF-Ratiop-Value
A: Feed rate4.5684114.56841216.820.0000
B: Cutting speed0.21926810.21926810.410.0037
C: Hardness1.1384911.1384954.030.0000
D: Cooling mode1.8860411.8860489.510.0000
AA0.034716110.03471611.650.2121
AB0.00792110.0079210.380.5458
AC0.36088510.36088517.130.0004
AD0.00044204210.0004420420.020.8861
BB0.035112510.03511251.670.2096
BC0.000060166710.00006016670.000.9578
BD0.00098816710.0009881670.050.8305
CD0.46466910.46466922.050.0001
Total error0.484606230.0210698
Total (corr.)9.2016135
Table 7. The cutting force results obtained from A7075-Sc machining.
MaterialTest NumberCutting Speed
(m/min)
Feed
Rate
(mm/tooth)
F (N)
Softest (79 VHN)Hardest (185 VHN)
DryWetDryWet
A7075-Sc12000.05124.3129.9133.382.3
20.1146.0111.6151.8120.9
30.15163.0119.9191.1162.1
44000.0596.0101.3117.891.4
50.1106.1111.2144.5118.2
60.15135.5121.7173.0162.2
76000.0575.982.2109.880.9
80.1111.493.7127.3100.9
90.15117.9112.6185.8155.9
Table 8. The details of the ANOVA parameters.
SourceSum of SquaresDfMean SquareF-Ratiop-Value
A: Feed rate13,804.8113,804.8156.820.0000
B: Cutting speed3311.1513311.1537.610.0000
C: Hardness3383.3613383.3638.430.0000
D: Cooling mode3433.9613433.9639.010.0000
AA266.8051266.8053.030.0951
AB203.7761203.7762.310.1418
AC2679.7112679.7130.440.0000
AD76.3267176.32670.870.3614
BB14.8512114.85120.170.6851
BC6048.3716048.3739.790.0000
BD244.4821244.4821.610.2174
CD4578.7814578.7830.120.0000
Total error3496.5923152.025
Total (corr.)70,993.435
Table 9. Cutting force results for A7075-Li-Sc dependence on cutting speed and feed rate.
MaterialTest NumberCutting Speed
(m/min)
Feed
Rate
(mm/tooth)
F (N)
Softest (81 VHN)Hardest (198 VHN)
DryWetDryWet
A7075-Li-Sc12000.05133.4135.7171.495.3
20.1125.5134.0182.1133.1
30.15135.4148.1204.2170.0
44000.0590.897.9125.793.7
50.1109.3113.4158.1131.2
60.15133.4109.4195.6169.8
76000.0561.164.1109.582.6
80.1100.985.3152.2128.4
90.15147.5113.4204.1178.4
Table 10. The A7075-Sc-Li ANOVA table for cutting force.
SourceSum of SquaresDfMean SquareF-Ratiop-Value
A: Feed rate17,501.4117,501.4161.480.0000
B: Cutting speed4836.5214836.5244.620.0000
C: Hardness11,620.8111,620.8107.220.0000
D: Cooling mode3528.3613528.3632.550.0000
AA56.0035156.00350.520.4795
AB2606.112606.124.050.0001
AC2394.012394.022.090.0001
AD3.0104213.010420.030.8691
BB268.7331268.7332.480.1290
BC803.8841803.8847.420.0121
BD6.7204216.720420.060.8056
CD2246.7612246.7620.730.0001
Total error2492.8223108.384
Total (corr.)48,365.235
Table 11. The most influential factors for the A 7075 materials investigated (1—most influential, 10—least influential; * indicates non-statistically significant factor or interaction at 95% confidence interval).
Parameters and InteractionsMaterial
A7075A7075-ScA7075-Li-Sc
Feed rate: f111
Cutting speed: V343
Hardness: h532
Cooling mode: c224
Interaction: speed × cooling mode: V × c48 *9 *
Interaction: speed × hardness: V × h9 *78
Interaction: feed rate × speed: f × V69 *5
Interaction: feed rate × cooling mode: f × c710 *10 *
Interaction: hardness × cooling mode: h × c8 *67
Interaction: feed rate × hardness: f × h10 *56
Disclaimer/Publisher’s Note: The statements, opinions and data contained in all publications are solely those of the individual author(s) and contributor(s) and not of MDPI and/or the editor(s). MDPI and/or the editor(s) disclaim responsibility for any injury to people or property resulting from any ideas, methods, instructions or products referred to in the content.

