Article

The Influence of Cochlear Volume on Temporal Changes of Impedance among Cochlear Implant Patients

by
Henrique F. Pauna
1,2,*,
Maria Stella A. Do Amaral
1,
Daniela S. Fonseca
1,
Rodrigo Pessini
3,
Denny M. Garcia
2,
Jéssica Echeverria
2,
Alexandre C. Guimarães
4,
Vagner A. R. Da Silva
4 and
Miguel A. Hyppolito
1
1
Department of Ophthalmology, Otorhinolaryngology and Head and Neck Surgery, Ribeirão Preto Medical School (FMRP-USP), University of São Paulo, Ribeirão Preto 14049-900, SP, Brazil
2
Department of Otorhinolaryngology, Hospital Universitário Cajuru, Curitiba 80050-350, PR, Brazil
3
Department of Radiology, Ribeirão Preto Medical School (FMRP-USP), University of São Paulo, Ribeirão Preto 14049-900, SP, Brazil
4
Department of Otorhinolaryngology, Head and Neck Surgery, University of Campinas (UNICAMP), Campinas 13083-888, SP, Brazil
*
Author to whom correspondence should be addressed.
J. Otorhinolaryngol. Hear. Balance Med. 2023, 4(1), 3; https://doi.org/10.3390/ohbm4010003
Submission received: 2 March 2023 / Revised: 24 May 2023 / Accepted: 30 May 2023 / Published: 31 May 2023

Abstract

:
Background: There is evidence that the cochlear volume may influence audiometric thresholds and CI electrodes’ impedance. The aim of the present study was to evaluate the impedance changes over time and correlate them to the residual volume of the cochlea. Methods: An MRI scan was performed via 3-D reconstruction before every surgery to obtain a residual volume for each ear. We performed repeated assessments of electrode impedance, both intra-operatively and post-implant, at the following intervals: 3 months, 6 months, and one year. The same type of perimodiolar array was implanted for each. Results: Thirty-four patients (10 (29.41%) male patients and 24 (70.59%) female patients) were evaluated. Patients received the implants between 2008 and 2017. The mean age of implantation was 13 ± 17.17 years, and the average of hearing thresholds improved after one year of the surgery. The mean cochlear volumes of the implanted ears were 68.16 ± 10.74 mm3 (right ear) and 56.54 ± 13.75 mm3 (left ear). We observed an increase in the basal electrodes’ impedance at the 3rd month. Yet, for the apical electrodes’ impedance, there was a decrease in averaged values. Conclusions: Post-operative impedance measurements were increased when compared to the intraoperatively measured basal values. Newly formed connective tissue is thought to be the cause of the higher impedance values.

1. Introduction

Cochlear implants (CI) are helpful tools to restore the hearing of people with severe to profound hearing loss by means of intra-cochlear stimulation of the remaining neuronal cells. Since their introduction in the 1970s, they have become devices with increasing technological refinements [1,2]. The progressive knowledge from the scientific community and manufacturers regarding the practical mechanisms of the ear have clarified many unknown aspects of the functional cochlea [3,4].
The sequential process from sound acquisition to its transformation in the auditory cortex relies on the cochlea–electrode interface [1]. Changes in the adjacent electrode structures or in the composition of the perilymph may alter the impedance values [5]. Previous histological studies have demonstrated profound cochlear changes due to injury to the cochlear lateral wall among implanted ears in terms of fibrous tissue, new bone formation, loss of cochlear hair cells, and damage to the stria vascularis and spiral ligament [6,7].
Impedance represents the electrical resistance of CI electrodes, and is considered as the ratio between electrical voltage and current intensity [6,7,8]. Many factors may influence impedance values, such as the electrode surface, the presence of connective tissue around the electrode, and the position of the electrode contact on the electrode array [8]. In general, impedance values reflect a device’s integrity and its surrounding space [8,9,10]. There is a correlation between the degree of connective tissue around the CI electrode and impedance [9].
It has already been described that gross bony changes to the cochlea can be seen either by high resolution computed tomography or T2 weighted magnetic resonance imaging (MRI) of the temporal bone [11,12,13]. MRI is well suited to detecting different stages of fibrosis or new bone formation at early stages, while extensive osteoneogenesis within the cochlea impedes electrode insertion [14]. The influence of cochlear diameter has also been described [15]. Escudé et al. observed that larger-sized cochlea influenced the final insertion depth angles of the CI electrodes [15]. Takahashi et al. observed that larger cochlear volume was associated with residual hearing preservation after conventional CI surgery [16]. The rationale behind these findings was that a larger cochlear diameter, and, consequently, the larger cochlear volume, would provide more space for the electrodes to fit, thus reducing trauma during insertion. Cochlear length and diameter may vary and induce heterogeneity in cochlear coverage in a population implanted with the same array [17].
Our choice to record impedance changes over time was motivated by the following: impedance is an objective measurement tool providing information about the electrodes’ integrity in addition to estimating the energy consumption of the cochlear implant [8,9,10]. There are several studies on electrode impedance changes over time in children [18,19,20,21,22,23]. The elevation of thresholds, comfortable levels, and dynamic range were seen during the first six months, but thereafter, levels stabilized. [21] Electrode impedance values decreased from implantation to the first month, then stabilized as well. [21] It has also been observed that fibrosis and new bone formation, which might occur up to one year after surgery (leading to a reduced cochlear volume), is negatively correlated with postoperative word recognition. [24] Most of these studies evaluated patients with a short follow-up period [8,23,25], while Cheng et al. described similar impedance values and sentence perception tests after 12 months of surgery, regardless of whether a round window or cochleostomy approach was used [26]. The differences in the results might be related to different approaches to electrode insertion (round window approach versus cochleostomy).
The objective of our study, in addition to the previous studies, was to evaluate the impedance variations over time in patients implanted with a cochlear implant system with a longer follow-up of one year, and to correlate impedance values with the residual cochlear volume.

2. Materials and Methods

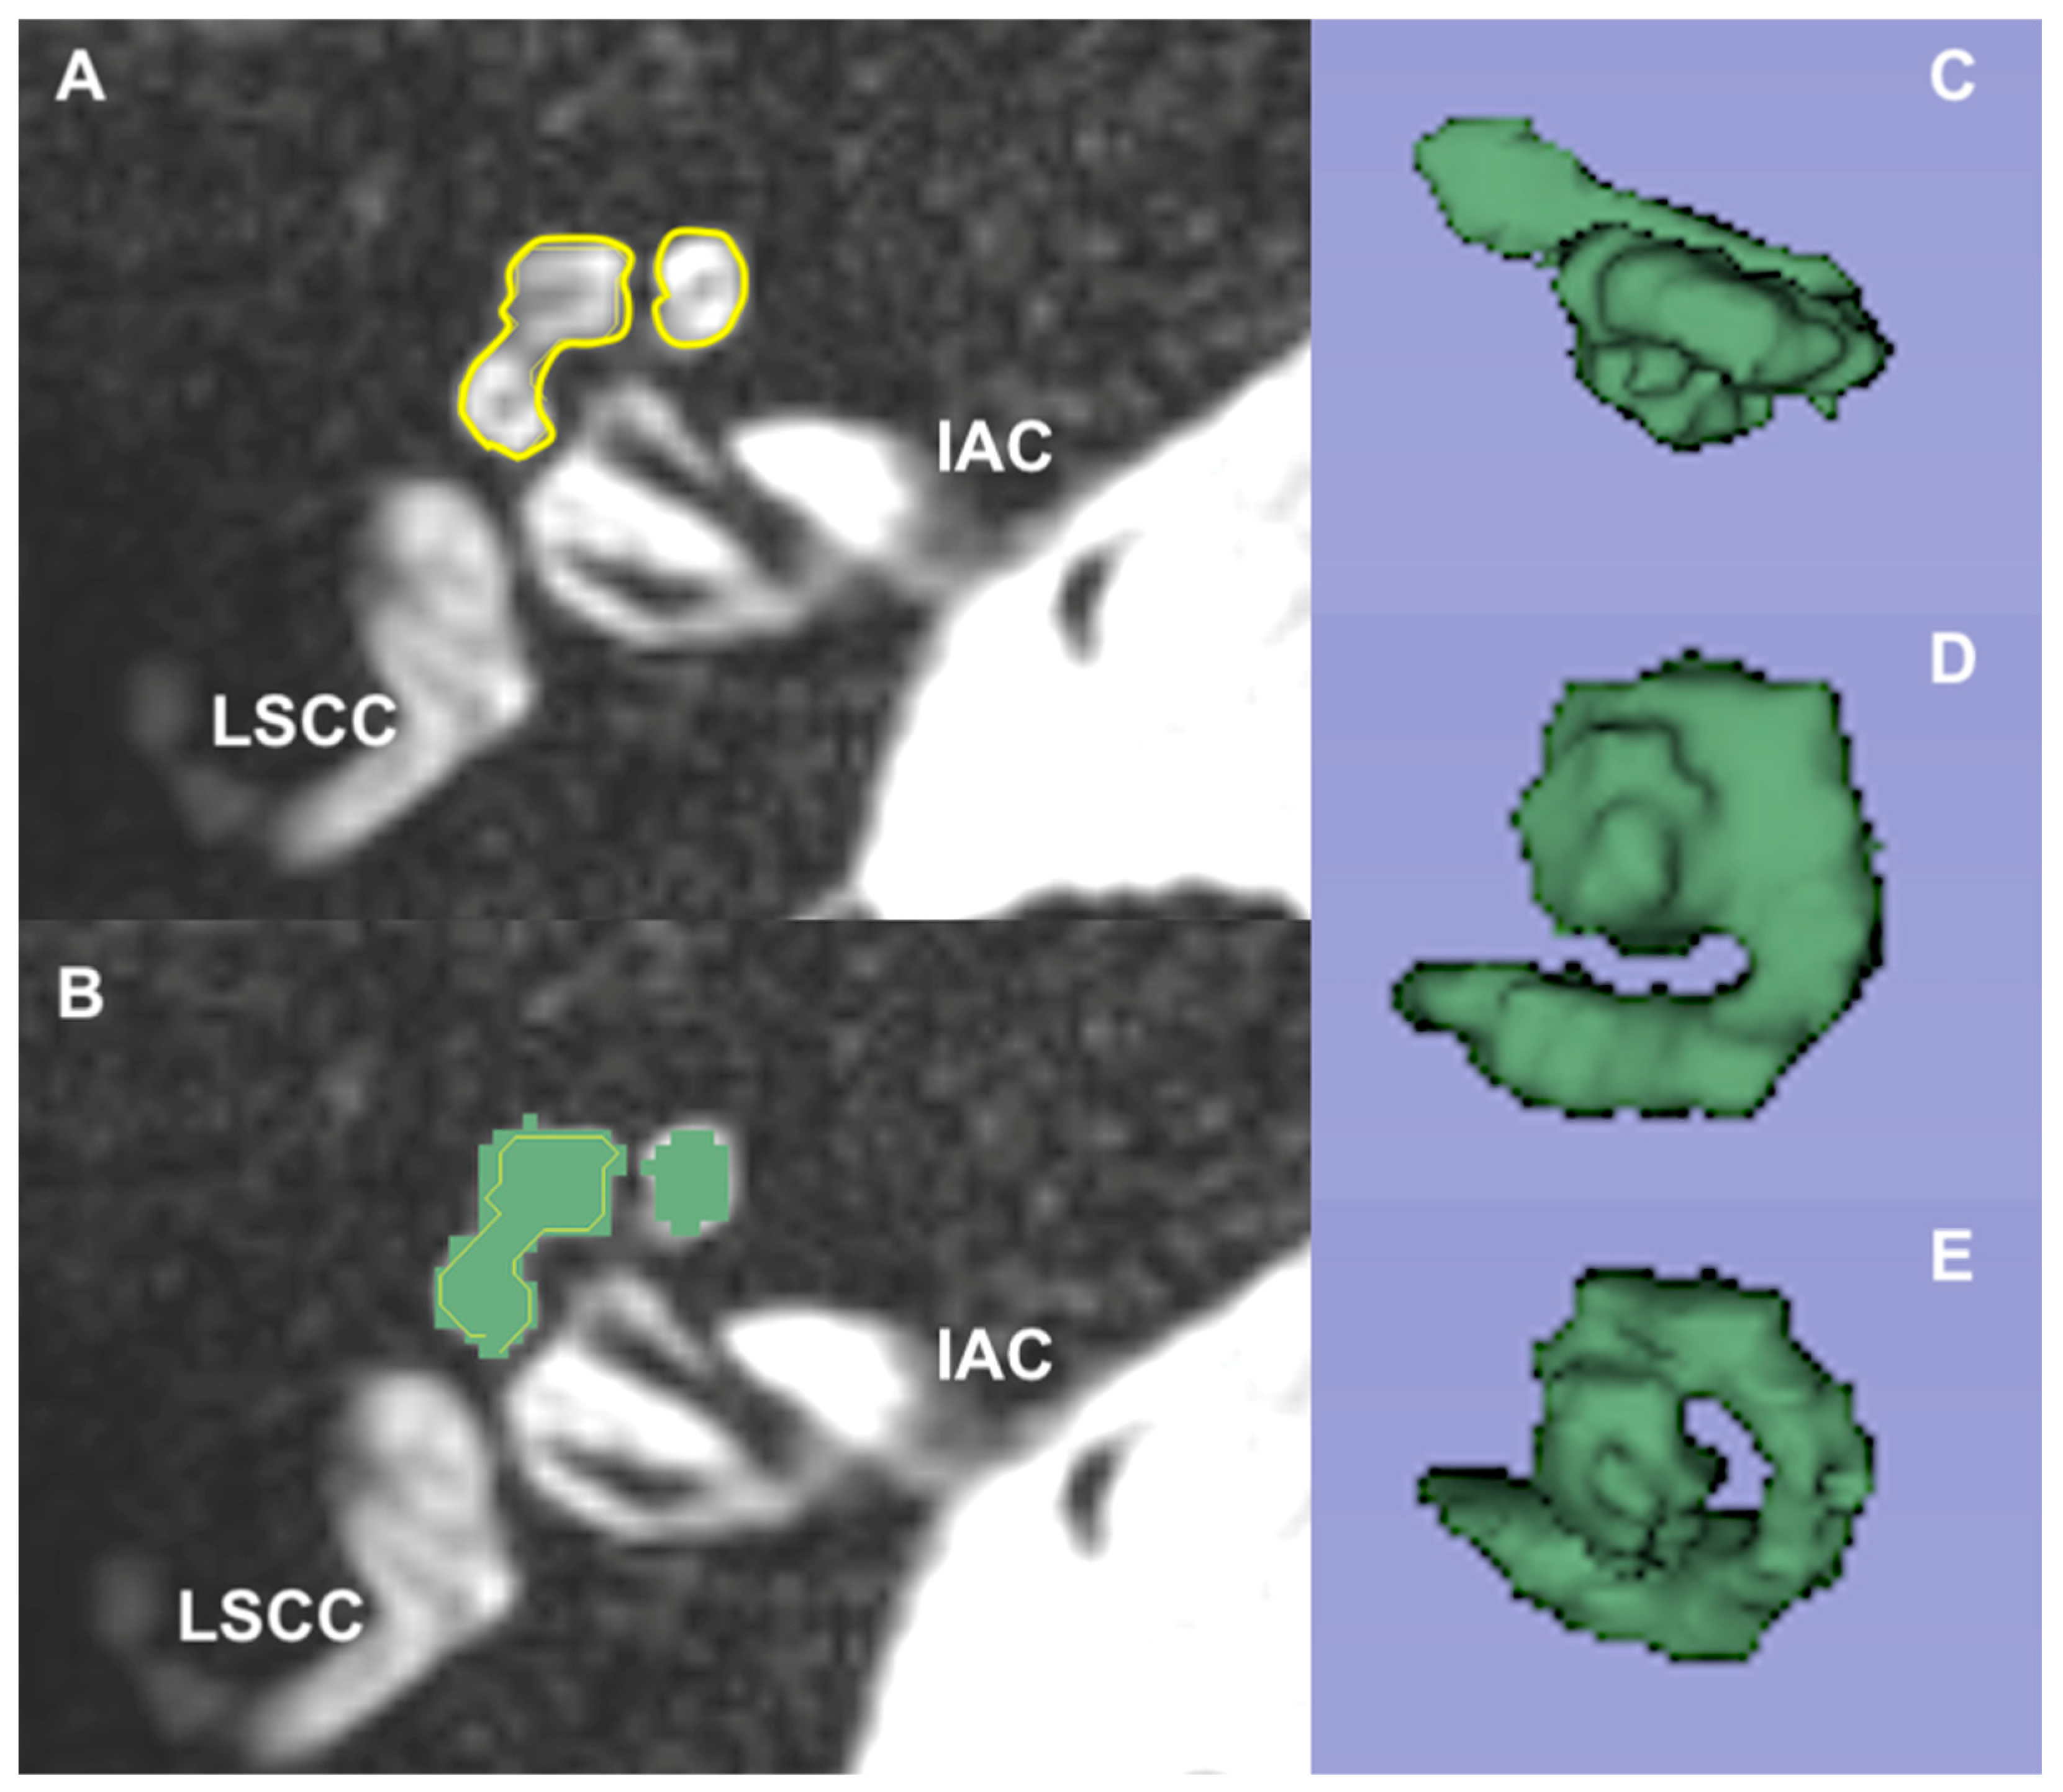
2.1. Magnetic Resonance Imaging

MRI was carried out with a 1.5-T unit (Infinion; Philips Medical Systems, Cleveland, OH, USA) using a standard head coil. Cranial MRI images focusing on inner-ear structures were routinely obtained according to the previous literature [3]. Images were evaluated for the presence of any gross configurational abnormalities by a radiologist. The images were obtained only once prior to the surgery.
The fluid volume of the cochlea was calculated with the help of an online workstation using an available software system (3D Slicer, version 4.8.0) by two experienced radiologists, so it would be possible to avoid potential measurement errors. Area calculation of each slice was performed by simply drawing the borders of the cochlear structures in the module “Editor” with the “level tracing effect” tool (Figure 1). These area measurements were used to calculate the volume of the cochlea for each ear. Quantifications of all volumes that were obtained were made in the module “Label statistics”. The averaged measurements were used for further calculations.
The inner ear fluid volumes were calculated. The 3D reconstruction was performed once before the surgery, and side-related differences were evaluated. The residual volume for the implanted ear was considered for statistical analysis and correlations.

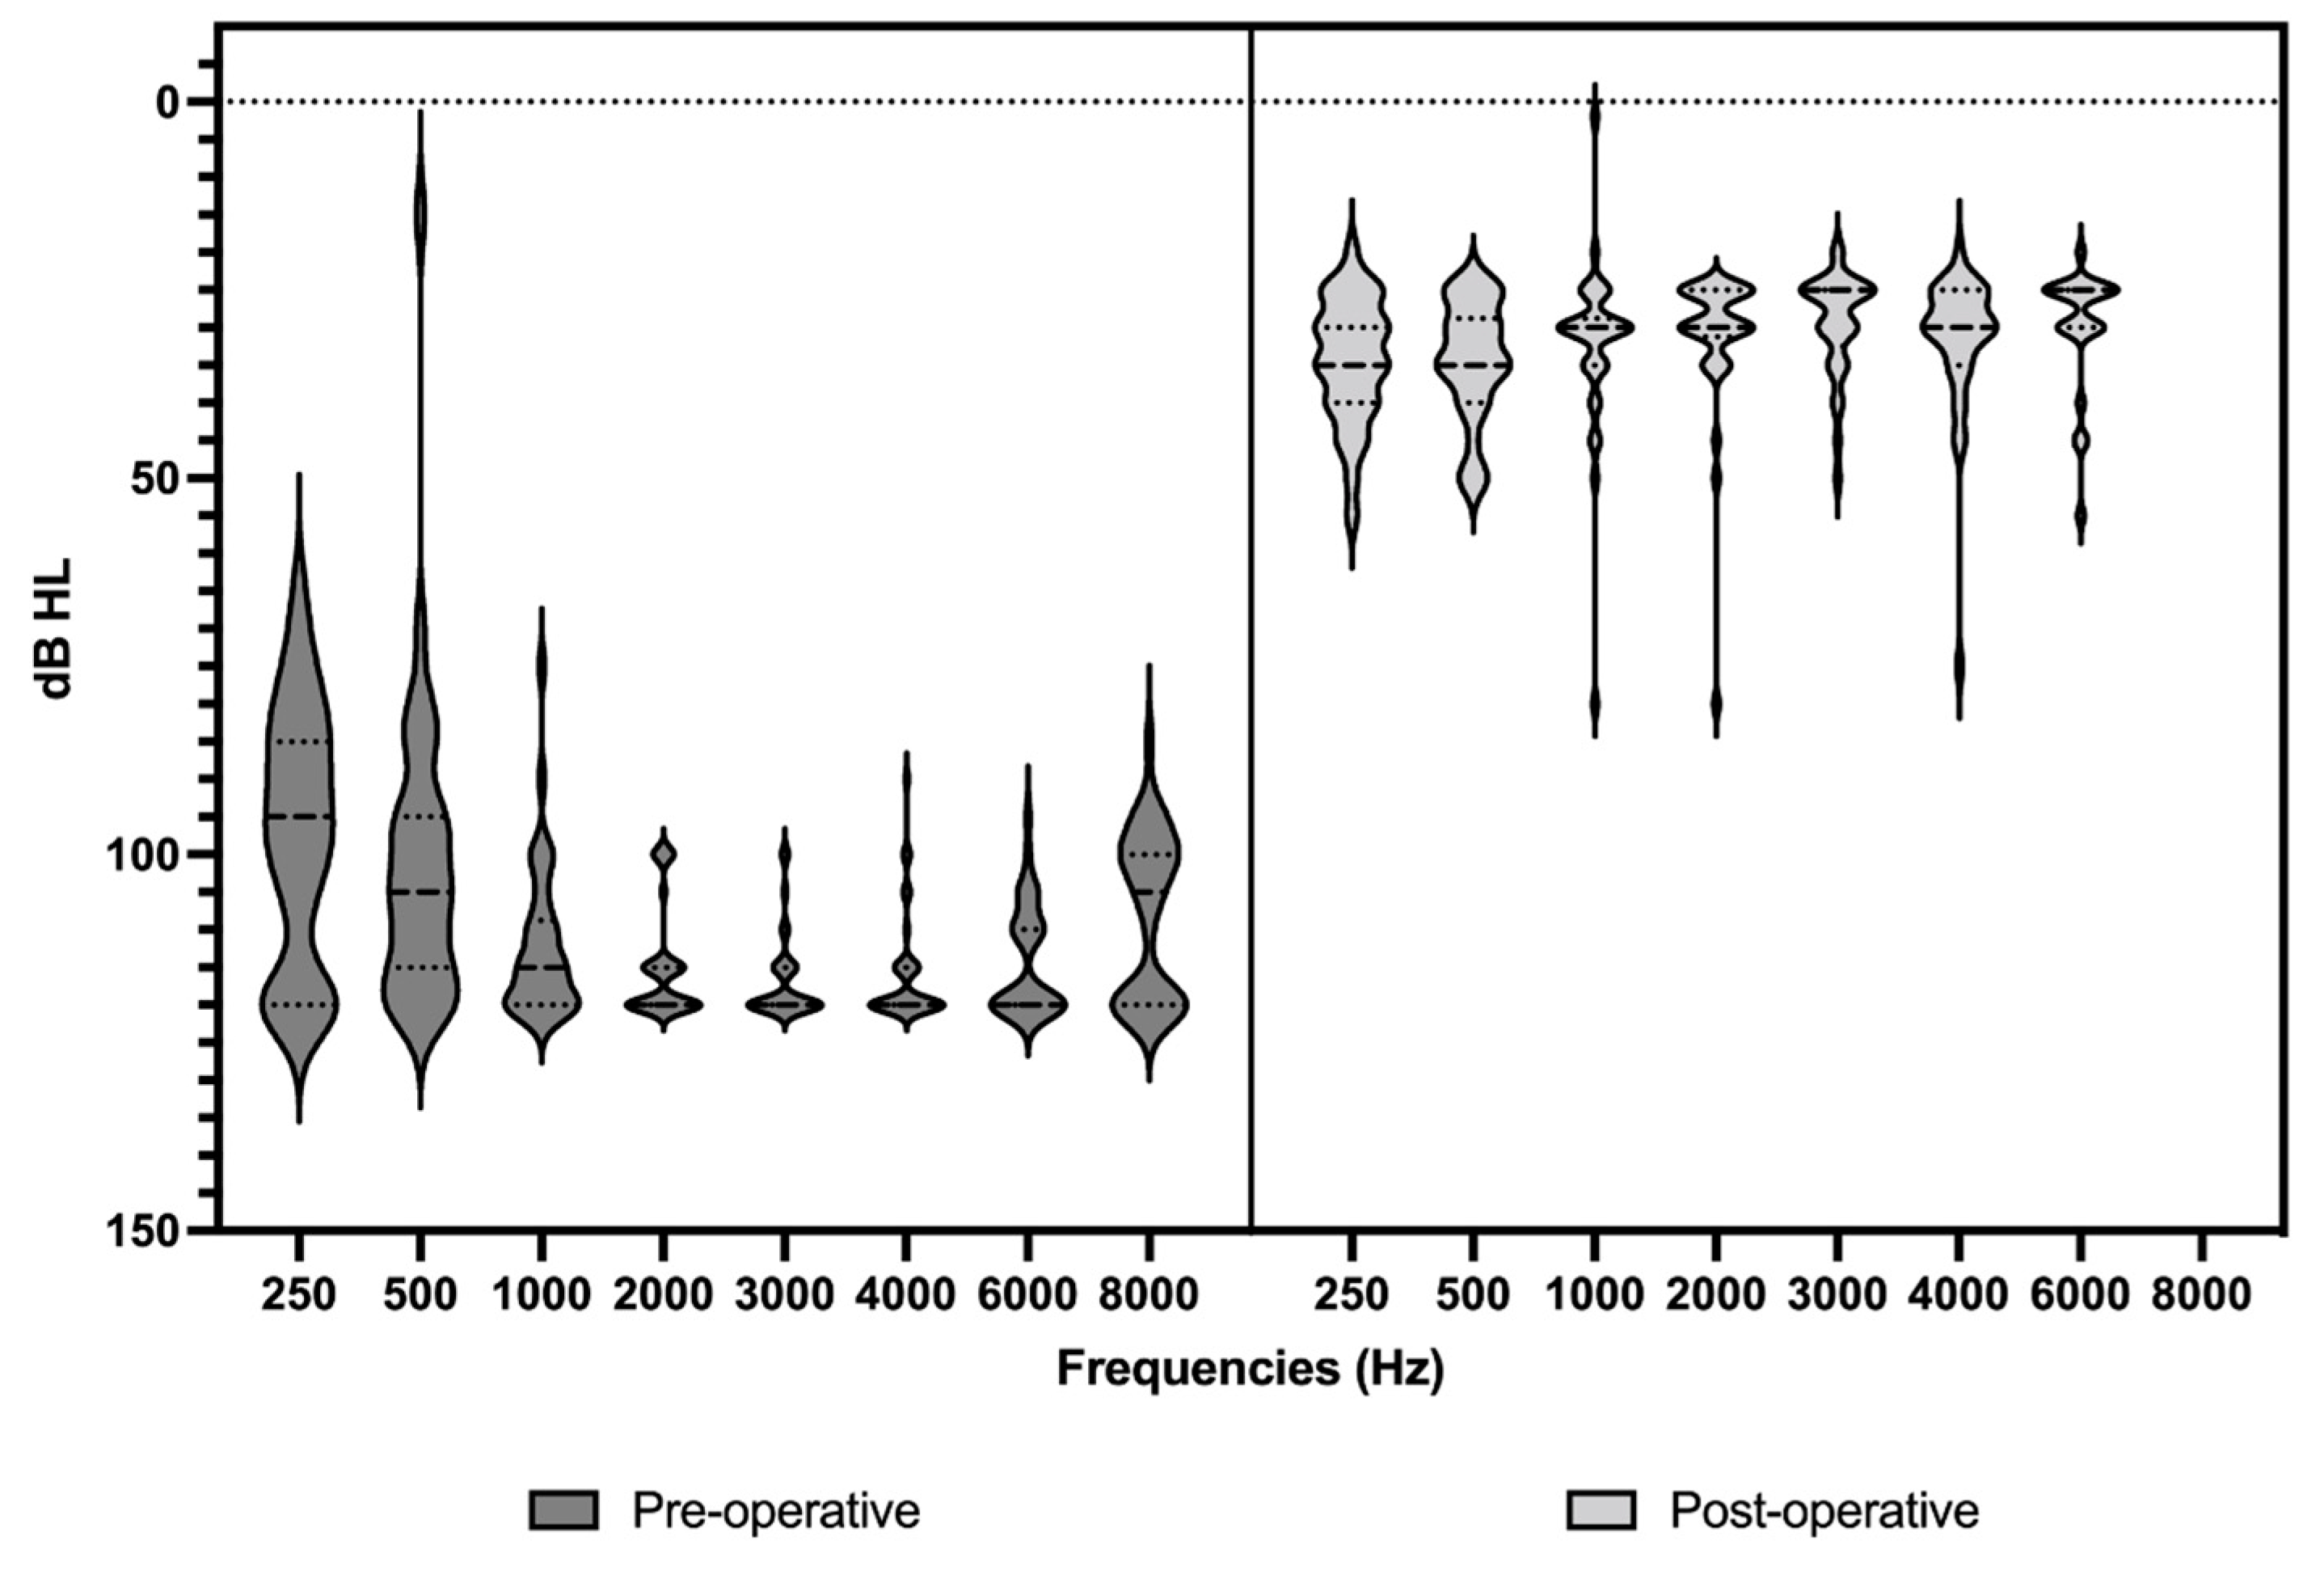
2.2. Audiometric Assessment

We performed repeated assessments, both intra-operatively (t0) and post-implant, at the following intervals: 3 months (t3), 6 months (t6), and one year (t12). All subjects were good CI users.
The same perimodiolar array was implanted (Cochlear™ Nucleus® Freedom Implant Contour Advance (CI24RE-CA)). The same surgical technique (cochleostomy), with progressive introduction of the array and using the recommended precautions of soft surgery and topical steroids (betamethasone) over the cochleostomy site before cochlear insertion, was applied [27,28,29,30]. All surgeries included in this study were performed by one experienced surgeon. Our group implanted 435 patients between 2008 and 2017.
We excluded those patients with incomplete electrode array insertion or cochlear malformations. We also excluded any patient with a history of meningitis and patients with ossified cochlea (after CT scan imaging), as well as cases with bilateral implants. The contralateral ears of patients with bilateral CI surgery were excluded because they were part of another research protocol that did not include the soft surgery technique for electrode insertion.
All processors were fitted with consistent parameters using the ACE strategy, with the same default fitting parameters for the stimulation rate. During every session, the electrical impedances, in kΩ, for each electrode were recorded. Average values were calculated for the impedances measured in “common-ground” (CG) mode and in monopolar (MP1+2) mode, as described by Leone et al. [1]. This monopolar stimulation is used as the default in clinical conditions by the ACE strategy.
Mean values were evaluated for electrode array segments as follows: basal (from No. 1 to 7); middle (from No. 8 to 14); and apical (from No. 15 to 22).

2.3. Statistical Analysis

Statistical analysis of the data was performed using SigmaPlot Version 14.0 (Systat Software, Inc, San Jose, CA, USA). For all tests, a p value lower than 0.05 was considered significant. The results of the qualitative variables are presented as frequency and proportions and of the quantitative variables by mean and standard deviation (mean ± SD). Correlation between two categorical variables was analyzed using Pearson’s correlation test. A one-way ANOVA was performed to compare the effect of residual cochlear volume on electrode impedance over time.

3. Results

3.1. Analysis of Demographic Data

Thirty-four patients who had been implanted at our department were evaluated (Table 1). The patients were implanted between 2008 and 2017. All patients had their etiology of deafness classified as idiopathic, with no malformation of the inner ear, and no fibrous tissue or ossification was found in their CT scans.
We included 10 (29.41%) male patients and 24 (70.59%) female patients. The mean age of implantation was 13 ± 17.17 years. The mean time from implantation to activation was 37.20 ± 8.86 days. We included 8 (23.53%) patients with post-lingual hearing loss and 26 (76.47%) patients with pre-lingual hearing loss. Twenty-one (61.76%) patients were implanted on the left ear and 13 (38.24%) patients were implanted on the right ear.
The average hearing threshold of the right ear was 110.69 ± 7.95 dBHL, and 112.95 ± 7.13 dBHL for the left ear (unaided ear; p = 0.801). The average hearing threshold of the right ear after one year of the CI surgery was 34.55 ± 12.37 dBHL, and 30.45 ± 5.98 dBHL for the left implanted ear (p = 0.101) (Figure 2).

3.2. Magnetic Resonance Imaging

The mean cochlear volume of the implanted ear, after 3D reconstruction, was 68.16 ± 10.74 mm3 (for the right ear) and 56.54 ± 13.75 mm3 (for the left ear; p < 0.01).

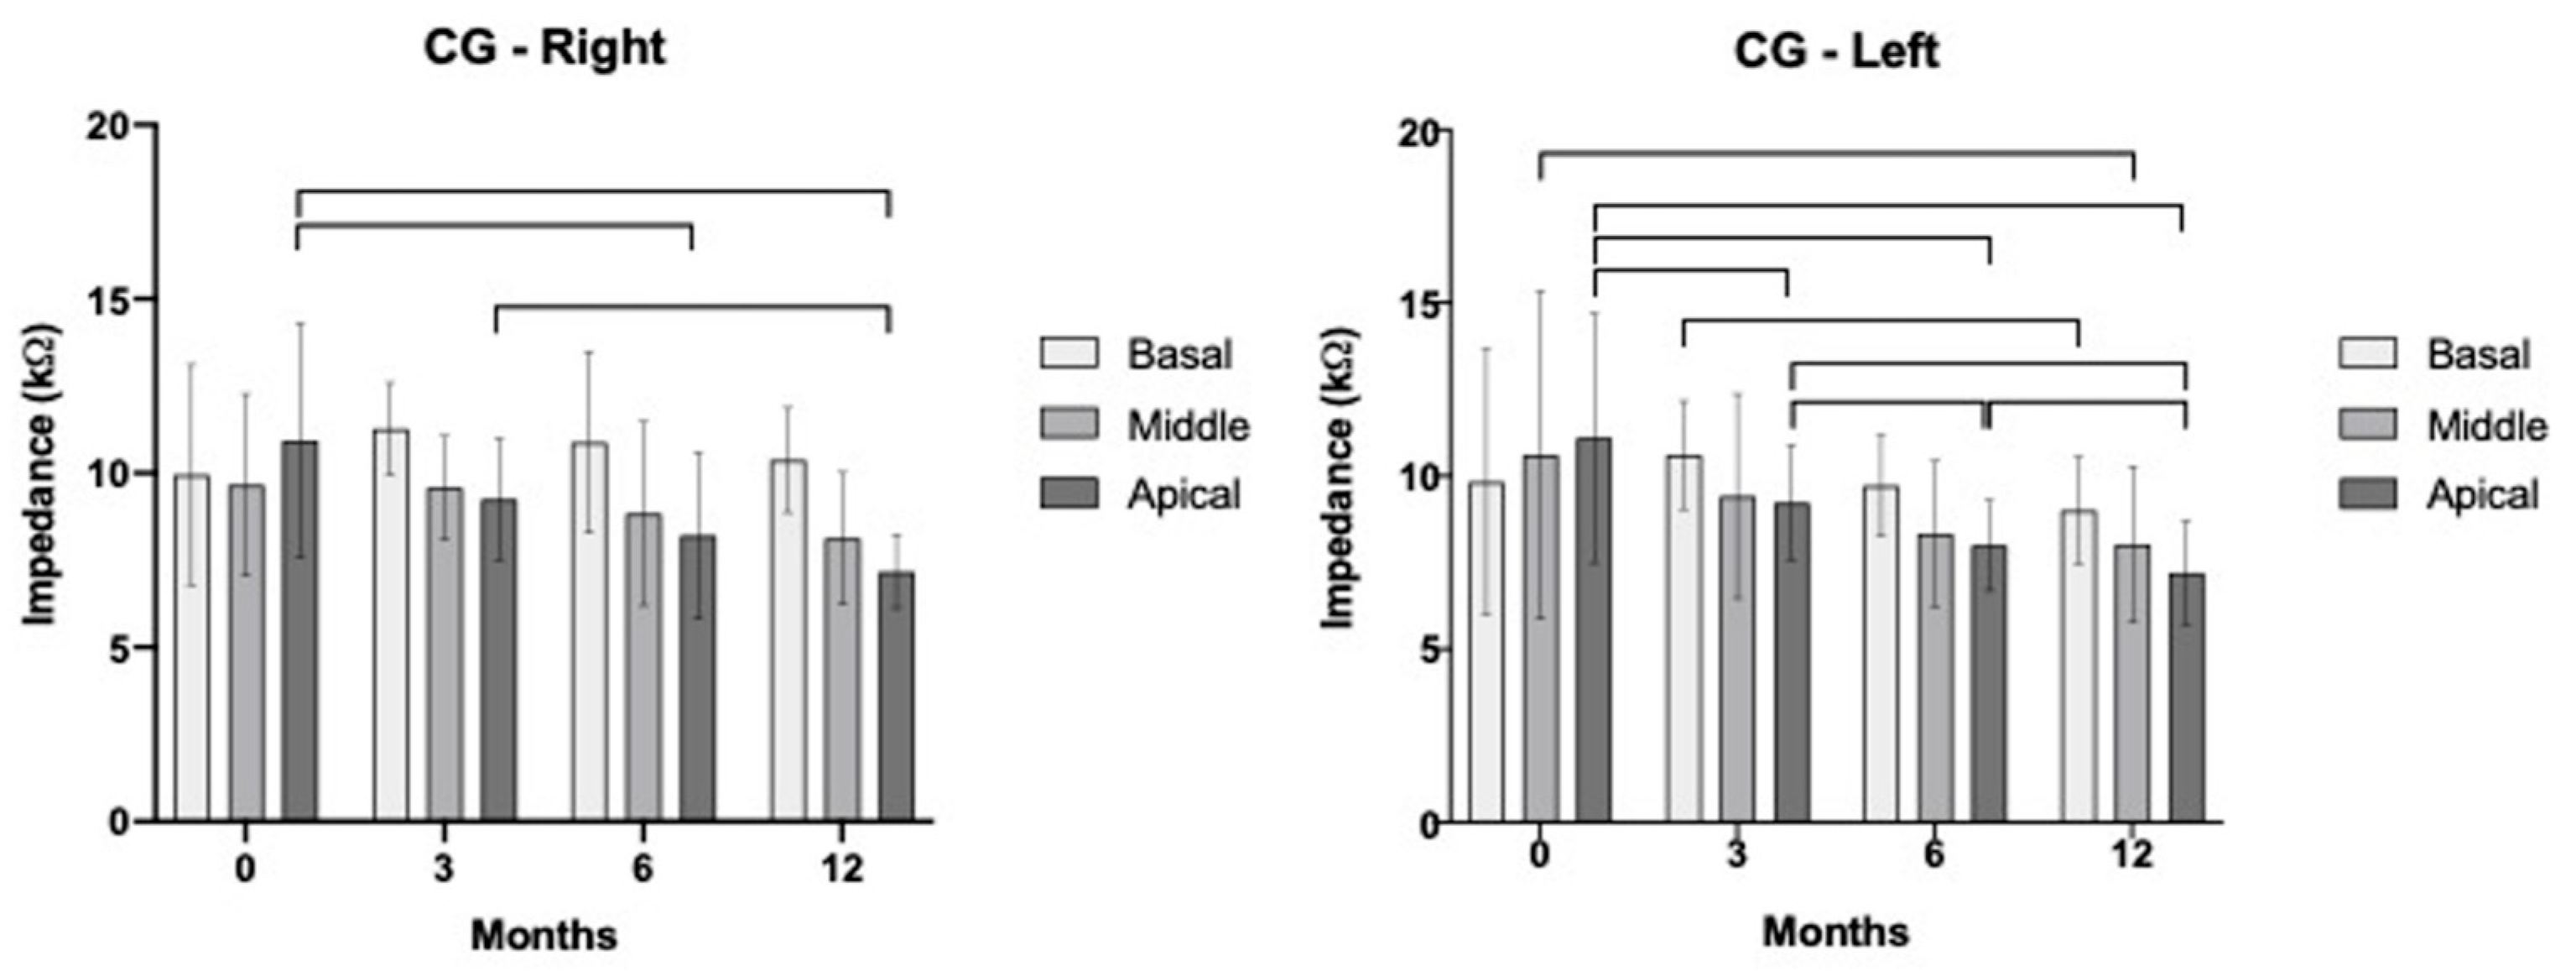
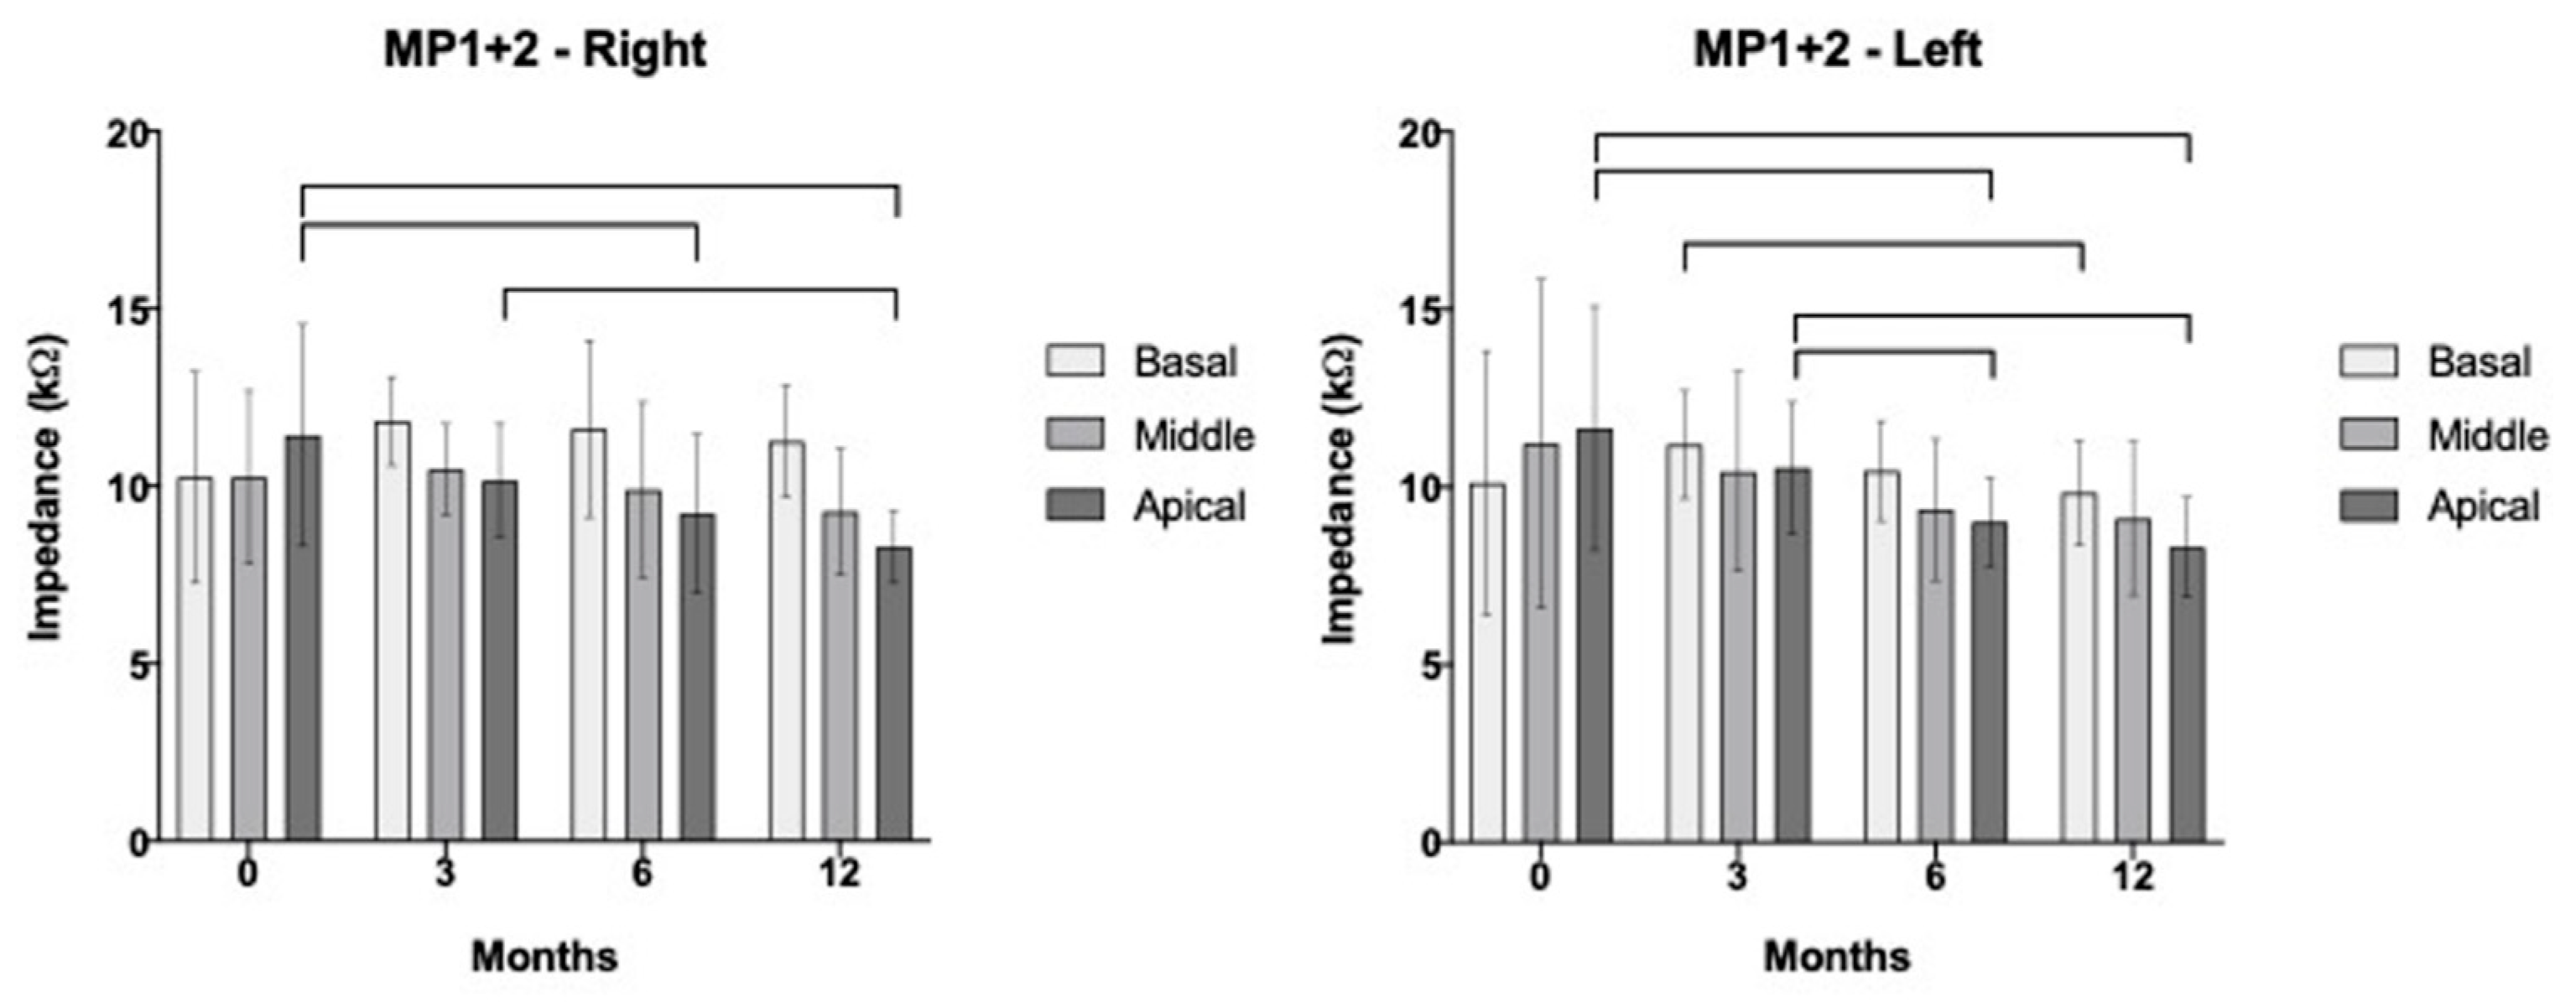
3.3. Segregated Analysis for Apical, Medial, and Basal Electrodes over Time

We conducted a statistical analysis for each cochlear region by differentiating electrodes into their basal, middle, and apical segments (Figure 3 and Figure 4). According to our results, there was a tenuous increase in the basal electrodes’ impedance from t0 to t3 (p > 0.05). We also observed a decreased impedance of the middle electrodes from t0 to t3, except for MP1+2 mode on the right ear, for which we observed an increased impedance value (from t0 to t3). Yet, for the apical electrodes’ impedance, there was a decrease in the averaged values from t0 to t3, although it was significant only in CG mode for the left ear (p = 0.03). Interestingly, the electrodes’ impedance of the apical portion decreased from t0 to every other moment of analysis, for both ears and for both modes (CG and MP1+2), and it was significantly reduced from t0 to t6 and t12.

3.4. Impedance in Relation to Cochlear Volume

The Pearson correlation and the corresponding p value are displayed in relation to each other in Table 2 and Table 3. Impedance values over time were strongly correlated between CG and MP1+2; thus, the averaged impedance could allow us to limit the number of correlation attempts. We conducted a statistical analysis for each cochlear region by differentiating electrodes into their basal, middle, and apical segments. The results presented for the corresponding array segments showed that the absolute values of the basal impedances were much higher at most of the measurement times. A one-way ANOVA revealed that there was a statistically significant difference in the impedance of the basal electrode segment over time for CG (F (2.474, 81.66) = 283.9, p < 0.0001) and MP1+2 (F (1.052, 34.71) = 8.993, p = 0.0045). There was also a significant difference in the impedance values of the middle segment electrodes for both CG and MP1+2 (F (1.067, 34.98) = 4.578, p = 0.0372) and (F (2.117, 69.41) = 113.2, p < 0.0001). Similarly, there was a significant difference in the apical electrode segment impedances over time in both stimulation modes (CG, (F (2.464, 81.16) = 297.2, p < 0.0001; MP1+2, (F (3.304, 108.8) = 215.4, p < 0.0001).

4. Discussion

Complete patency of the cochlea is of paramount importance for the surgical insertion of an electrode array [2]. If complete insertion of the electrodes is achieved, less current is needed [31,32]. More demanding energy consumption may be necessary if the route of insertion is somehow obstructed by osteogenesis progressing to labyrinthitis ossificans [14]. Therefore, radiological imaging is mandatory, and can assist the surgeon in deciding whether the cochlea is suitable for cochlear implantation or not. From the CT scans of the thirty-four patients implanted at our department, none presented signs of new bone formation within the cochlea. Even though no ossification was seen among the CT scans, we observed significant differences in the residual cochlear volume between the right and left side (p < 0.01).
It is expected for impedance values to decrease over time in general (across all the cochlear segments) [1,8,25]. The evaluation of our impedance data, however, shows an increasing impedance value from t0 to t3 (at the basal segment—where the maximum values are recorded at t3 (3 months after CI surgery)), followed by a decrease after activation of the sound processor. Interestingly, the impedance values obtained at the middle and apical segments of the electrode array showed decreased values along the time after CI surgery. An increase in the impedances was observed during the first three months of CI use. The variation in global impedance significantly changed after CI surgery for both CG and MP1+2 (Figure 3 and Figure 4). It has been described in the literature that the first post-operative measurements may show an increase in impedance in comparison with the intraoperatively measured “basal values” [22,23,33,34,35]. Our data, however, showed lower impedance values at the apical segment for every assessment after CI surgery (at t3, t6, and t12). Henkin et al. found no differences between impedances among cochlear segments; however, they assessed lateral wall implants, while we considered perimodiolar array implants only [21]. Molisz et al. also found decreased impedance values at the middle and apical electrodes in the first semester after surgery, and stabilization in the later course [36]. They observed increased impedance values of basal electrodes (higher than the middle and apical impedances), similar to our results. It is hypothesized that the surgical trauma due to the cochleostomy leads to destructive changes to the lateral wall, spiral ligament, and stria vascularis, as well as damage to the lamina spiralis, basilar membrane, or modiolus [7]. The connective tissue that arises around the electrode during the first days after surgery is presumed to be the cause of higher impedance values [37,38].
Perimodiolar electrode positioning reduces the extent of the electrical field, decreasing stimulation levels and extending the dynamic range, thereby allowing for the maximum amount of stimulus to the auditory nerve [18,39,40]. We hypothesize that fibrosis and new connective tissue could be responsible for the changes we observed in the impedance’s measurements.
The same cochleostomy approach and the same device from Cochlear™ were applied. The resultant high impedances in basal electrodes could be related to this traumatic technique. On the other hand, a previous histological study showed no differences in the amount of fibrosis, new-bone formation, or residual sensorineural cells with round window insertion compared to cochleostomy insertions [7]. Additionally, Nadol and Eddington reported that 57% of the temporal bones obtained from CI patients with an inflammatory cellular response were much more evident proximal to the cochleostomy site [41]. Other pathological processes may also be related to high impedance values, such as connective tissue on the surface of the electrode. It is also suggested that labyrinthitis after CI surgery and neurodegeneration may play a role in higher impedance values [2,42].
We also observed a positive correlation between the residual cochlear volume and impedance values for both the CG and MP1+2 modes. The significant correlations were seen in t3, t6, and t12 in basal electrodes on both sides. Interestingly, there was also a significant correlation between the middle and apical electrodes on both sides at the sixth month after CI surgery. It is suggested that the electrode–modiolus distance affects the spread of electric stimulation inside the cochlea [43]. The medial array positioning is associated with lower stimulation currents, but also with lower psychophysical thresholds and comfortable levels [44].
Contour arrays are designed to reduce the distance between the electrodes and the nerve endings and to maximize the quality of electrophysiological interaction between these two structures [45]. There is a correlation between array location in the cochlea and its insertion depth, on the one hand, and speech recognition performance, on the other [46]. Esquia Medina et al. showed that the electrode array position is influenced by the length of the inserted array in relation to the cochlear size [47]. When we observed a large cochlea with a short insertion length, the array seemed to be pushed toward the lateral wall and the electrode–modiolus distance was greater. Although we did not measure the positioning of the electrodes within the cochlea, we can infer that the perimodiolar electrodes were located closer to the modiolus. Additionally, the residual cochlear volume did not seem to influence the auditory thresholds after CI surgery, since the right cochlear mean volume was larger than the left cochlear mean volume, but the thresholds were not significantly different.
It is interesting to note that the impedance values of the apical electrodes were the highest during the intraoperative period, but they were the ones that were most reduced during the assessment period. The impedance values of the medial electrodes also followed the tendency to decrease as the evaluation progressed. Thus, we can infer that the impedance values may have been influenced by the residual cochlear volume (since they are smaller in relation to the volume of the basal turn of the cochlea) closer to the modiolus.
This study has several limitations. First, it is a retrospective study. A significant amount of information from medical records was lost or not recorded. Therefore, the number of subjects included in this study was limited. Second, we were unable to perform serial analyses (monthly) or longer periods of analysis (more than one year) of the impedance data because the computers on which the mappings were performed were backed up, and much data were lost. Lastly, without conflicts of interest, we performed the analysis using a single CI brand (Cochlear™, Australia) to avoid confounding factors such as different numbers of electrodes, different programming schemes, different electrode diameters, or different stimulation modes.
For these reasons, it is recommended that CI surgery be performed as soon as possible to optimize the audiological outcome.

5. Conclusions

Progressive changes in electrode impedance values were evident during the 12 months following CI surgery. Post-operative impedance measurements indicated an increase when compared to the intraoperatively measured basal values. The larger volume of the basal turns may explain the higher impedances that are necessary to stimulate the residual spiral ganglion neurons. Given the important role of an optimal map for speech perception, frequent programming sessions during the first few months of implant use are essential.

Author Contributions

Conceptualization, H.F.P. and M.A.H.; methodology, H.F.P. and M.A.H.; software, A.C.G.; validation, V.A.R.D.S. and A.C.G.; formal analysis, H.F.P., D.M.G., A.C.G., and V.A.R.D.S.; investigation, H.F.P., M.S.A.D.A., and D.S.F.; resources, D.S.F.; data curation, M.S.A.D.A. and R.P.; writing—original draft preparation, H.F.P.; writing—review and editing, H.F.P. and J.E.; supervision, M.A.H. All authors have read and agreed to the published version of the manuscript.

Funding

Coordenação de Aperfeiçoamento de Pessoal de Nível Superior, Grant/Award Number CAPES code 001.

Institutional Review Board Statement

All procedures contributing to the present study comply with the ethical standards of the institutional guidelines on human experimentation (CEP 62116816.2.0000.5440) and with the Helsinki Declaration of 1975. The authors declare no conflict of interest for the development of the present study.

Informed Consent Statement

Patient consent was waived due to the retrospective aspect of the present research.

Data Availability Statement

No new data were created or analyzed in this study. Data sharing is not applicable to this article.

Conflicts of Interest

V.A.R.S. is a consultant of MedEL®. M.A.H. is a consultant of OTICON®. All the other authors declare no conflict of interest.

References

  1. Leone, C.A.; Mosca, F.; Grassia, R. Temporal changes in impedance of implanted adults for various cochlear segments. Acta Otorhinolaryngol. Ital. 2017, 37, 312–319. [Google Scholar] [CrossRef]
  2. Durisin, M.; Büchner, A.; Lesinski-Schiedat, A.; Bartling, S.; Warnecke, A.; Lenarz, T. Cochlear implantation in children with bacterial meningitic deafness: The influence of the degree of ossification and obliteration on impedance and charge of the implant. Cochlear Implant. Int. 2015, 16, 147–158. [Google Scholar] [CrossRef]
  3. House, W.F. Cochlear Implant: My Perspective; Newport Beach All Hear: Newport Beach, CA, USA, 1995. [Google Scholar]
  4. Clark, G.M. The multiple-channel cochlear implant: The interface between sound and the central nervous system for hearing, speech, and language in deaf people—A personal perspective. Philos. Trans. R. Soc. Lond. B Biol. Sci. 2006, 361, 791–810. [Google Scholar] [CrossRef]
  5. Duan, Y.Y.; Clark, G.M.; Cowan, R.S. A study of intra-cochlear electrodes and tissue interface by electrochemical impedance methods in vivo. Biomaterials 2004, 25, 3813–3828. [Google Scholar] [CrossRef]
  6. Nadol, J.B., Jr. Patterns of neural degeneration in the human cochlea and auditory nerve: Implications for cochlear implantation. Otolaryngol. Head. Neck Surg. 1997, 117, 220–228. [Google Scholar] [CrossRef]
  7. Fayad, J.N.; Makarem, A.O.; Linthicum, F.H., Jr. Histopathological assessment of fibrosis and new bone formation in implanted human temporal bones using 3D-reconsruction. Otolaryngol. Head Neck Surg. 2009, 141, 247–252. [Google Scholar] [CrossRef] [PubMed]
  8. Busby, P.A.; Plant, K.L.; Whitford, L.A. Electrode impedance in adults and children using the Nucleus 24 cochlear implant system. Cochlear Implant. Int. 2002, 3, 87–103. [Google Scholar] [CrossRef] [PubMed]
  9. Clark, G.M.; Shute, S.A.; Shepherd, R.K.; Carter, T.D. Cochlear implantation: Osteoneogenesis, electrode-tissue impedance, and residual hearing. Ann. Otol. Rhinol. Laryngol. Suppl. 1995, 166, 40–42. [Google Scholar]
  10. Swanson, B.; Seligman, P.; Carter, P. Impedance measurement of the nucleus 22-electrode array in patients. Ann. Otol. Rhinol. Laryngol. Suppl. 1995, 166, 141–144. [Google Scholar] [PubMed]
  11. Gleeson, T.G.; Lacy, P.D.; Bresnihan, M.; GaVney, R.; Brennan, P.; Viani, L. High resolution computed tomography and magnetic resonance imaging in the pre-operative assessment of cochlear implant patients. J. Laryngol. Otol. 2003, 117, 692–695. [Google Scholar] [CrossRef] [PubMed]
  12. Bettman, R.; Beek, E.; Van Olphen, A.; Zonneveld, F.; Huizing, E. MRI versus CT in assessment of cochlear patency in cochlear implant candidates. Acta Otolaryngol. 2004, 124, 577–581. [Google Scholar] [CrossRef]
  13. Laszig, R.; Chang, S.O.; Kubo, T.; Ramos, M.A.; Frijns, J.H.; Briggs, R.; Haynes, D.S. APSCI panel discussion I: Imaging and surgical issues. Ear Hear. 2007, 28, 119S–123S. [Google Scholar] [CrossRef] [PubMed]
  14. Beijen, J.; Casselman, J.; Joosten, F.; Stover, T.; Aschendorf, A.; Zarowski, A.; Becker, H.; Mylanus, E. Magnetic resonance in patients with meningitis induced hearing loss. Eur. Arch. Otorhinolaryngol. 2009, 266, 1229–1236. [Google Scholar] [CrossRef] [PubMed]
  15. Escudé, B.; James, C.; Deguine, O.; Cochard, N.; Eter, E.; Fraysse, B. The size of the cochlea and predictions of insertion depth angles for cochlear implant electrodes. Audiol. Neurotol. 2006, 11 (Suppl. 1), 27–33. [Google Scholar] [CrossRef]
  16. Takahashi, M.; Arai, Y.; Sakuma, N.; Yabuki, K.; Sano, D.; Nishimura, G.; Oridate, N.; Usami, S.-I. Cochlear volume as a predictive factor for residual-hearing preservation after conventional cochlear implantation. Acta Otolaryngol. 2018, 138, 345–350. [Google Scholar] [CrossRef]
  17. Lee, J.; Nadol, J.B., Jr.; Eddington, D.K. Depth of electrode insertion and postoperative performance in humans with cochlear implants: A histopathologic study. Audiol. Neurotol. 2010, 15, 323–331. [Google Scholar] [CrossRef] [PubMed]
  18. Blamey, P. Are spiral ganglion cell numbers important for speech perception with a cochlear implant? Am. J. Otol. 1997, 18, S11–S12. [Google Scholar] [PubMed]
  19. Fayad, J.N.; Linthicum, F.H., Jr. Multichannel cochlear implants: Relation of histopathology to performance. Laryngoscope. 2006, 116, 1310–1320. [Google Scholar] [CrossRef] [PubMed]
  20. Linthicum, F.H., Jr.; Fayad, J.N. Spiral ganglion cell loss is unrelated to segmental cochlear sensory system degeneration in humans. Otol. Neurotol. 2009, 30, 418–422. [Google Scholar] [CrossRef]
  21. Henkin, Y.; Kaplan-Neeman, R.; Muchnik, C.; Kronenberg, J.; Hildesheimer, M. Changes over time in electrical stimulation levels and electrode impedance values in children using the Nucleus 24M cochlear implant. Int. J. Ped Otorhinolaryngol. 2003, 67, 873–880. [Google Scholar] [CrossRef] [PubMed]
  22. Henkin, Y.; Kaplan-Neeman, R.; Muchnik, C.; Kronenberg, J.; Hildesheimer, M. Changes over time in the psycho-electric parameters in children with cochlear implants. Int. J. Audiol. 2003, 42, 274–278. [Google Scholar] [CrossRef]
  23. Henkin, Y.; Kaplan-Neeman, R.; Kronenberg, J.; Migirov, L.; Hildesheimer, M.; Muchnik, C. Electrical stimulation levels and electrode impedance values in children using the Med-El Combi 40+ cochlear implant: A one year follow-up. J. Basic Clin. Physiol. Pharmacol. 2005, 16, 127–137. [Google Scholar] [CrossRef]
  24. Kamakura, T.; Nadol, J.B., Jr. Correlation between word recognition score and intracochlear new bone and fibrous tissue after cochlear implantation in the human. Hear. Res. 2016, 339, 132–141. [Google Scholar] [CrossRef]
  25. van Wermeskerken, G.K.; van Olphen, A.F.; Smoorenburg, G.F. Intra- and postoperative electrode impedance of the straight and Contour arrays of the Nucleus 24 cochlear implant: Relation to T and C levels. Int. J. Audiol. 2006, 45, 537–544. [Google Scholar] [CrossRef] [PubMed]
  26. Cheng, X.; Wang, B.; Liu, Y.; Yuan, Y.; Shu, Y.; Chen, B. Comparable electrode impedance and speech perception at 12 months after cochlear implantation using round window versus cochleostomy: An analysis of 40 patients. ORL J. Otorhinolaryngol. Relat. Spec. 2018, 80, 248–258. [Google Scholar] [CrossRef]
  27. Lehnhardt, E. Intracochlear placement of cochlear implant electrodes in soft surgery technique. HNO 1993, 41, 356–359. [Google Scholar] [PubMed]
  28. Cohen, N.L. Cochlear implant soft surgery: Fact or fantasy? Otolaryngol. Head Neck Surg. 1997, 117, 214–216. [Google Scholar] [CrossRef]
  29. Laszig, R. Cochlear implants in children (soft surgery). Adv. Otorhinolaryngol. 2000, 57, 87–89. [Google Scholar] [PubMed]
  30. James, C.; Albegger, K.; Battmer, R.; Burdo, S.; Deggouj, N.; Deguine, O.; Dillier, N.; Gersdorff, M.; Laszig, R.; Lenarz, T.; et al. Preservation of residual hearing with cochlear implantation: How and why. Acta Otolaryngol. 2005, 125, 481–491. [Google Scholar] [CrossRef]
  31. Eisenberg, L.S.; Luxford, W.M.; Becker, T.S.; House, W.F. Electrical stimulation of the auditory system in children deafened by meningitis. Otolaryngol. Head Neck Surg. 1984, 92, 700–705. [Google Scholar] [CrossRef]
  32. Rotteveel, L.J.; Snik, A.F.; Vermeulen, A.M.; Mylanus, E.A. Three-year follow-up of children with postmeningitic deafness and partial cochlear implant insertion. Clin. Otolaryngol. 2005, 30, 242–248. [Google Scholar] [PubMed]
  33. Henkin, Y.; Kaplan-Neeman, R.; Kronenberg, J.; Migirov, L.; Hildesheimer, M.; Muchnik, C. A longitudinal study of electrical stimulation levels and electrode impedance in children using the Clarion cochlear implant. Acta Otolaryngol. 2006, 126, 581–586. [Google Scholar] [CrossRef]
  34. Hughes, M.L.; Vander Werff, K.R.; Brown, C.J.; Abbas, P.J.; Kelsay, D.M.R.; Teagle, H.F.B.; Lowder, M.W. A longitudinal study of electrode impedance, the electrically evoked compound action potential, and behavioral measures in Nucleus 24 cochlear implant users. Ear Hear. 2001, 22, 471–486. [Google Scholar] [CrossRef]
  35. Kumar, G.; Chokshi, M.; Richter, C.P. P. Electrical impedance measurements of cochlear structures using the four-electrode reflection-coefficient technique. Hear. Res. 2010, 259, 86–94. [Google Scholar]
  36. Molisz, A.; Zarowski, A.; Vermeiren, A.; Theunen, T.; De Coninck, L.; Siebert, J.; Offeciers, E.F. Postimplantation changes of electrophysiological parameters in patients with cochlear implants. Audiol. Neurotol. 2015, 20, 222–228. [Google Scholar] [CrossRef] [PubMed]
  37. Nadol, J.B., Jr.; Shiao, J.Y.; Burgess, B.J.; Gantz, B.J.; Coker, N.J.; Ketten, D.R.; Kos, I.; Roland, T., Jr.; Shiao, J.Y.; Eddington, D.K.; et al. Histopathology of cochlear implants in humans. Ann. Otol. Rhinol. Laryngol. 2001, 110, 883–891. [Google Scholar] [CrossRef] [PubMed]
  38. Tykocinski, M.; Cohen, L.T.; Cowan, R.S. Measurement and analysis of access resistance and polarization impedance in cochlear implant recipients. Otol. Neurotol. 2005, 26, 948–956. [Google Scholar]
  39. Brummer, S.B.; Turner, M.J. Electrical stimulation with Pt electrodes: I- A method for determination of ‘real’ electrode areas. IEEE Trans. Biomed. Eng. 1977, 24, 436–439. [Google Scholar] [CrossRef]
  40. Lenarz, T.; Stover, T.; Buechner, A.; Paasche, G.; Briggs, R.; Risi, F.; Pesch, J.; Battmer, R.D. Temporal bone results and hearing preservation with a new straight electrode. Audiol. Neurotol. 2006, 11 (Suppl. 1), 34–41. [Google Scholar]
  41. Nadol, J.B., Jr.; Eddington, D.K. Histologic evaluation of the tissue seal and biologic response around cochlear implant electrodes in the human. Otol. Neurotol. 2004, 252, 57–62. [Google Scholar]
  42. Neuburger, J.; Lenarz, T.; Lesinski-Schiedat, A.; Büchner, A. Spontaneous increases in impedance following cochlear implantation: Suspected causes and management. Int. J. Audiol. 2009, 48, 233–239. [Google Scholar] [CrossRef] [PubMed]
  43. Hughes, M.L.; Stille, L.J. Effect of stimulus and recording parameters on spatial spread of excitation and masking patterns obtained with the electrically evoked compound action potential in cochlear implants. Ear Hear. 2010, 31, 679–692. [Google Scholar] [CrossRef] [PubMed]
  44. Runge-Samuelson, C.; Firszt, J.B.; Gaggl, W.; Wackym, P.A. Electrically evoked auditory brain-stem responses in adults and children: Effects of lateral to medial placement of the nucleus 24 contour electrode array. Otol. Neurotol. 2009, 30, 464–470. [Google Scholar] [CrossRef]
  45. Xi, X.; Ji, F.; Han, D.; Hong, M.; Chen, A. Electrode interaction in cochlear implant recipients: Comparison of straight and contour electrode arrays. ORL J. Otorhinolaryngol. Relat. Spec. 2009, 71, 228–237. [Google Scholar] [PubMed]
  46. Finley, C.C.; Holden, T.A.; Holden, L.K.; Whiting, B.R.; Chole, R.A.; Neely, G.J.; Hullar, T.E.; Skinner, M.W. Role of electrode placement as a contributor to variability in cochlear implant outcomes. Otol. Neurotol. 2008, 29, 920–928. [Google Scholar] [CrossRef] [PubMed]
  47. Esquia Medina, G.N.; Borel, S.; Nguyen, Y.; Ambert-Dahan, E.; Ferrary, E.; Sterkers, O.; Grayeli, A.B. Is electrode-modiolus distance a prognostic factor for hearing performances after cochlear implant surgery? Audiol. Neurotol. 2013, 18, 406–413. [Google Scholar] [CrossRef]
Figure 1. This is a screen obtained from the 3D reconstruction software (3D Slicer, version 4.8.0). Box (A) is an axial view obtained prior to the 3D reconstruction of the cochlea. The yellow line highlights the boundaries of the basal turn of the cochlea. Box (B) is the defined area of the cochlea (green) that was used to calculate the volume. Box (C) is the superior view of a normal cochlea (patient without a history of meningitis). Box (D) is the anterior view of a normal cochlea from the 3D reconstruction. Box (E) is the anterior view of a cochlea from a patient with history of meningitis (for comparison). (Legend: IAC = internal auditory canal, LSCC = lateral semicircular canal).
Ohbm 04 00003 g001
Figure 2. Graph of grouped hearing thresholds for every frequency from 250 Hz to 8000 Hz, both pre- and post-operatively.
Ohbm 04 00003 g002
Figure 3. Histograms depicting average values of the impedances in CG mode in various cochlear segments according to evaluation times. Brackets indicate significant differences for apical electrodes between the left and right ear (decrease in time). For the left ear only, a decrease for middle electrodes at t12 and a decrease for basal electrodes from t3 to t12 were observed. No significant differences were found between other electrodes according to time.
Ohbm 04 00003 g003
Figure 4. Histograms depicting average values of the impedances in MP1+2 mode in various cochlear segments, according to evaluation times. In brackets, groups with significant variations are shown.
Ohbm 04 00003 g004
Table 1. Characteristics of subjects and hearing levels (pre-operatively).
CaseSexVolumeAge at Surgery (Years)Pre/PostTime of HL (Years)
1M50.043Pre2
2F90.984Pre2.5
3F72.036Pre5
4F78.6351Post48
5F72.875Pre3
6F57.5117Post9
7M60.236Pre5
8F56.2541Post28
9F75.415Post2
10M69.86Pre5
11M64.3911Pre9.5
12M68.31Pre1
13F69.676Pre5
14F56.54Pre4
15F52.3642Post38
16F60.585Pre5
17M38.355Pre3
18M69.285Pre4
19F60.774Pre3
20F13.684Pre3
21F41.3410Pre8
22F57.864Pre3
23M68.324Pre3
24F54.28Pre2
25M63.045Pre3
26F65.0939Post5
27F63.6268Post17
28M81.115Pre3
29F57.3547Post13
30F46.964Pre3
31F54.033Pre3
32F53.9816Pre15
33F61.16Pre6
34F67.944Pre3
Mean-60.93 ± 13.765.00 ± 17.11-4.00 ± 10.45
Table 2. Correlation of impedance values (in kΩ) and cochlear volume (in mm3) for basal, middle, and apical segmentations of both ears (CG).
T0T3T6T12
CGBasalp = 0.553
r = 0.166
p < 0.001 *
r = 0.811
p = 0.006 *
r = 0.670
p = 0.004 *
r = 0.694
Middlep = 0.098
r = 0.442
p = 0.001 *
r = 0.741
p = 0.021 *
r = 0.588
p = 0.054
r = 0.505
Apicalp = 0.083
r = 0.462
p = 0.001 *
r = 0.739
p = 0.016 *
r = 0.609
p = 0.002 *
r = 0.727
Legend: (T0) operative time; (T3) 3 months post-operative; (T6) 6 months post-operative; (T12) one year post-operative; (*) statistically significant.
Table 3. Correlation of impedance values (in kΩ) and cochlear volume (in mm3) for basal, middle, and apical segmentations of both ears (MP1+2).
T0T3T6T12
MP1+2Basalp = 0.450
r = 0.211
p < 0.001 *
r = 0.816
p = 0.004 *
r = 0.695
p = 0.004 *
r = 0.694
Middlep = 0.062
r = 0.491
p < 0.001 *
r = 0.787
p = 0.009 *
r = 0.646
p = 0.002 *
r = 0.568
Apicalp = 0.050
r = 0.513
p < 0.001 *
r = 0.782
p = 0.006 *
r = 0.668
p = 0.001 *
r = 0.759
Legend: (T0) operative time; (T3) 3 months post-operative; (T6) 6 months post-operative; (T12) one year post-operative; (*) statistically significant.
Disclaimer/Publisher’s Note: The statements, opinions and data contained in all publications are solely those of the individual author(s) and contributor(s) and not of MDPI and/or the editor(s). MDPI and/or the editor(s) disclaim responsibility for any injury to people or property resulting from any ideas, methods, instructions or products referred to in the content.

