Simulative Prediction of Fiber-Matrix Separation in Rib Filling During Compression Molding Using a Direct Fiber Simulation


1
Volkswagen Group Research, Postbox 011/14990, 38440 Wolfsburg, Germany
2
Polymer Engineering Center (PEC), University of Wisconsin-Madison, 1513 University Ave, Madison, WI 53706, USA
*
Author to whom correspondence should be addressed.
J. Compos. Sci. 2018, 2(1), 2; https://doi.org/10.3390/jcs2010002
Submission received: 22 November 2017
/
Revised: 12 December 2017
/
Accepted: 13 December 2017
/
Published: 28 December 2017
(This article belongs to the Special Issue Discontinuous Fiber Composites)
Abstract
:Compression molding of long fiber reinforced composites offers specific advantages in automotive applications due to the high strength to weight ratio, the comparably low tooling costs and short cycle times. However, the manufacturing process of long fiber composite parts presents a range of challenges. The phenomenon of fiber matrix separation (FMS) is causing severe deviations in fiber content, especially in complex ribbed structures. Currently, there is no commercial software that is capable to accurately predict FMS. This work uses a particle level mechanistic model to study FMS in a rib filling application. The direct fiber simulation (DFS) is uniquely suited to this application due to its ability to model individual fibers and their bending, as well as the interaction amongst fibers that leads to agglomeration. The effects of mold geometry, fiber length, viscosity, and initial fiber orientation are studied. It is shown that fiber length and initial fiber orientation have the most pronounced effects on fiber volume percentage in the ribs, with viscosity and part geometry playing a smaller role.
1. Introduction
Fiber reinforced composites offer high mechanical strength to weight ratios. This makes them interesting for a number of industries, including the automotive industry, where tightening emissions restrictions have forced designers to find suitable materials and processes to reduce component weight in large scale production [1]. Compression molding using glass mat thermoplastics (GMT) or long fiber reinforced thermoplastics (LFT) is widely used in high volume production [2,3]. The process can be fully automated with a high degree of quality consistency in production, which reduces costs and cycle time [2,4]. Simulation tools are included at early stages of the product design process to determine processing conditions and predict part performance [5,6,7], however there are some aspects of processing that are not yet implemented in commercially available tools. One aspect which is particularly difficult to predict is fiber matrix separation (FMS), which occurs in systems that are highly filled with long fibers [8,9,10]. Due to increasing fiber interaction, fibers are restrained in their movement and accumulate inside complex flow geometries. This effect of FMS leads to significant variations in fiber content throughout the part. Current mold-filling software is not able to account for this behavior as it uses continuum models that are based on the motion and interactions observed in short, rigid fiber experiments [6,11]. This presents an issue, since the mechanical properties of fiber reinforced parts are highly dependent on fiber content, orientation and length distribution [5,12].
In order to predict FMS and the occurring variations in fiber content, a different approach is needed that accounts for complex fiber movement and interactions during processing. To this end, the direct fiber simulation (DFS) was developed to study complex interactions occurring during processing. The DFS utilizes a particle level mechanistic model, in which fibers are simulated as rigid beams connected by ball and socket joints [13,14]. During simulation, fiber-fiber interaction, hydrodynamic, fiber-mold interaction, and intra-fiber forces are computed. With this approach, complex phenomena leading to FMS can be predicted. However, using a particle level approach leads to far greater computational times than conventional models.
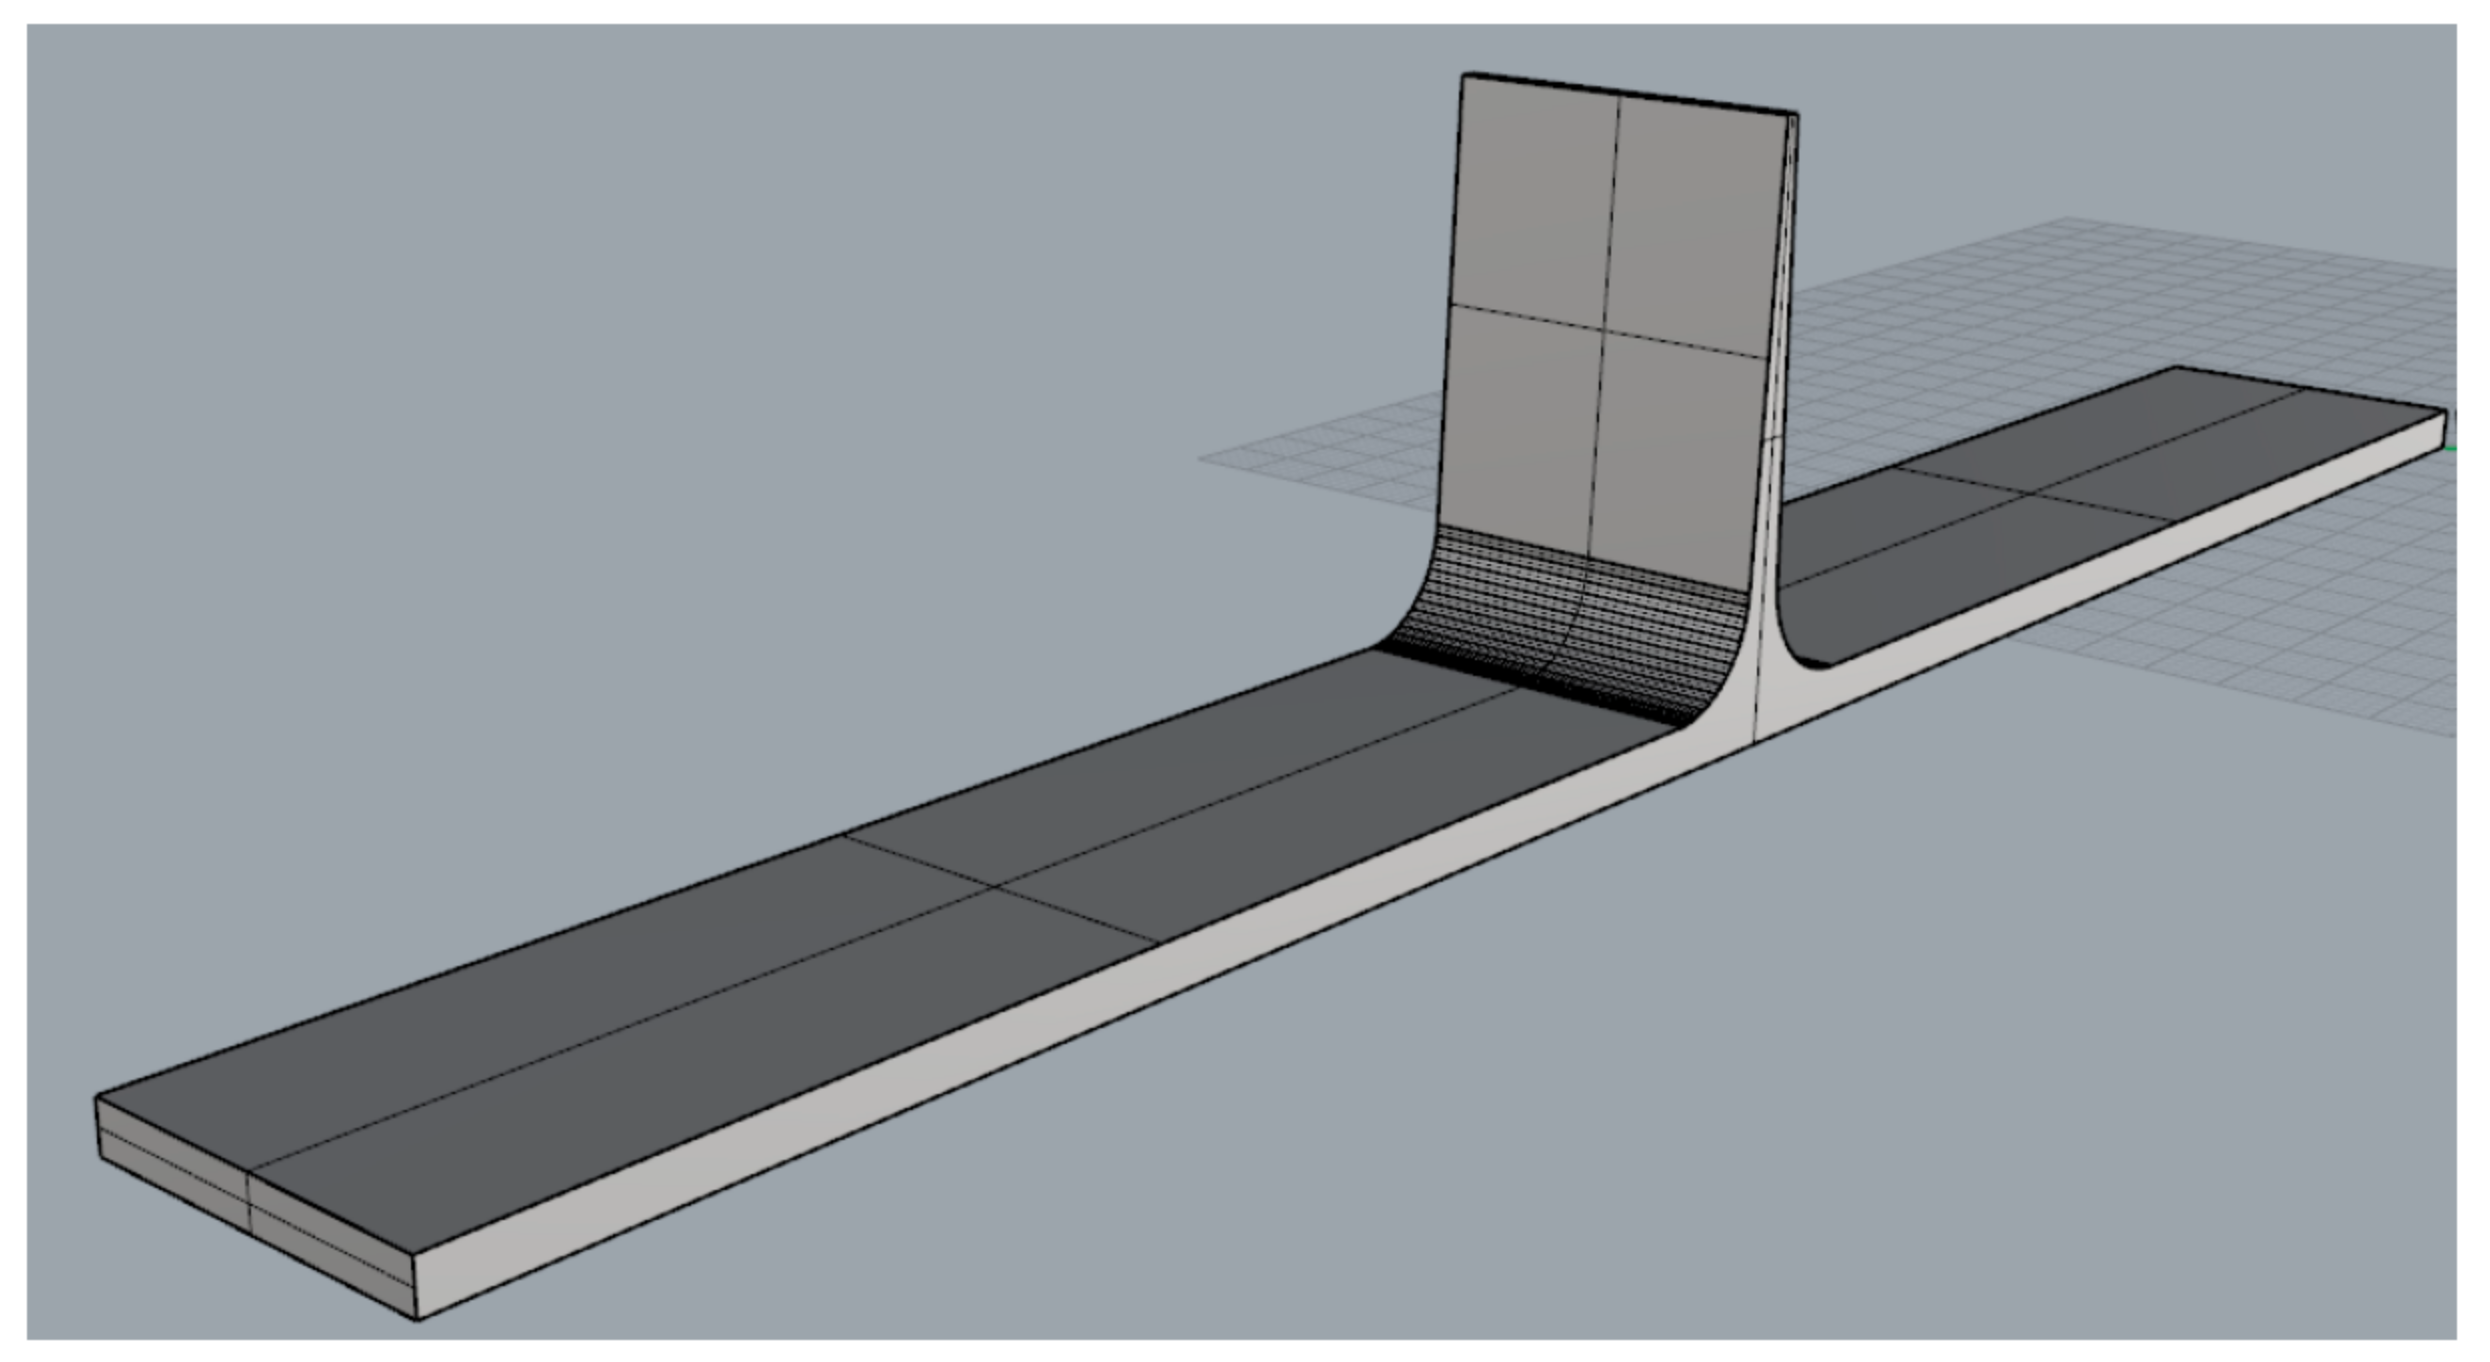
In this work, the DFS is applied to study FMS inside ribbed components in long fiber compression molding. Earlier simulations with the instigated component geometry (Figure 1) were conducted in [15] and showed limitations regarding mesh exiting and fiber freezing due to boundary conditions and model simplifications unsuitable for full scale DFS. In this paper, improvements are presented to accurately display the fiber behavior during processing. With the implemented improvements, further simulations are conducted to evaluate the effects of fiber length, initial orientation, rib geometry, and viscosity on rib filling. The simulation results are then compared to experimental studies, which were obtained earlier in compression molding experiments [15]. The research of this paper focuses on the prediction of fiber content distribution in compression molding. Results regarding the fiber orientation prediction will be published consecutively.
2. Direct Fiber Simulation
The DFS simulation chain is initially started with a traditional mold filling simulation, using the commercial software Moldex3D™ by CoreTech System Co., Ltd., Chupei City, Taiwan. The conventional filling simulation is conducted with SABIC STAMAX 30YM240 material data, a fiber reinforced polypropylene with an initial fiber content of 30 wt %. After the conventional simulation has been completed, the flow field is extracted and utilized in the mechanistic model. Since the flow-field velocity is output at discreet steps, it is necessary to use a high number of output files to improve simulative accuracy. Once the Moldex3D™ simulation is completed, the DFS is implemented by placing fibers within the volume of the mold. These fibers are randomly generated in the specified volume, according to the desired fiber volume fraction and initial fiber orientation. For a more complete description of the fiber generation, please refer to [16].
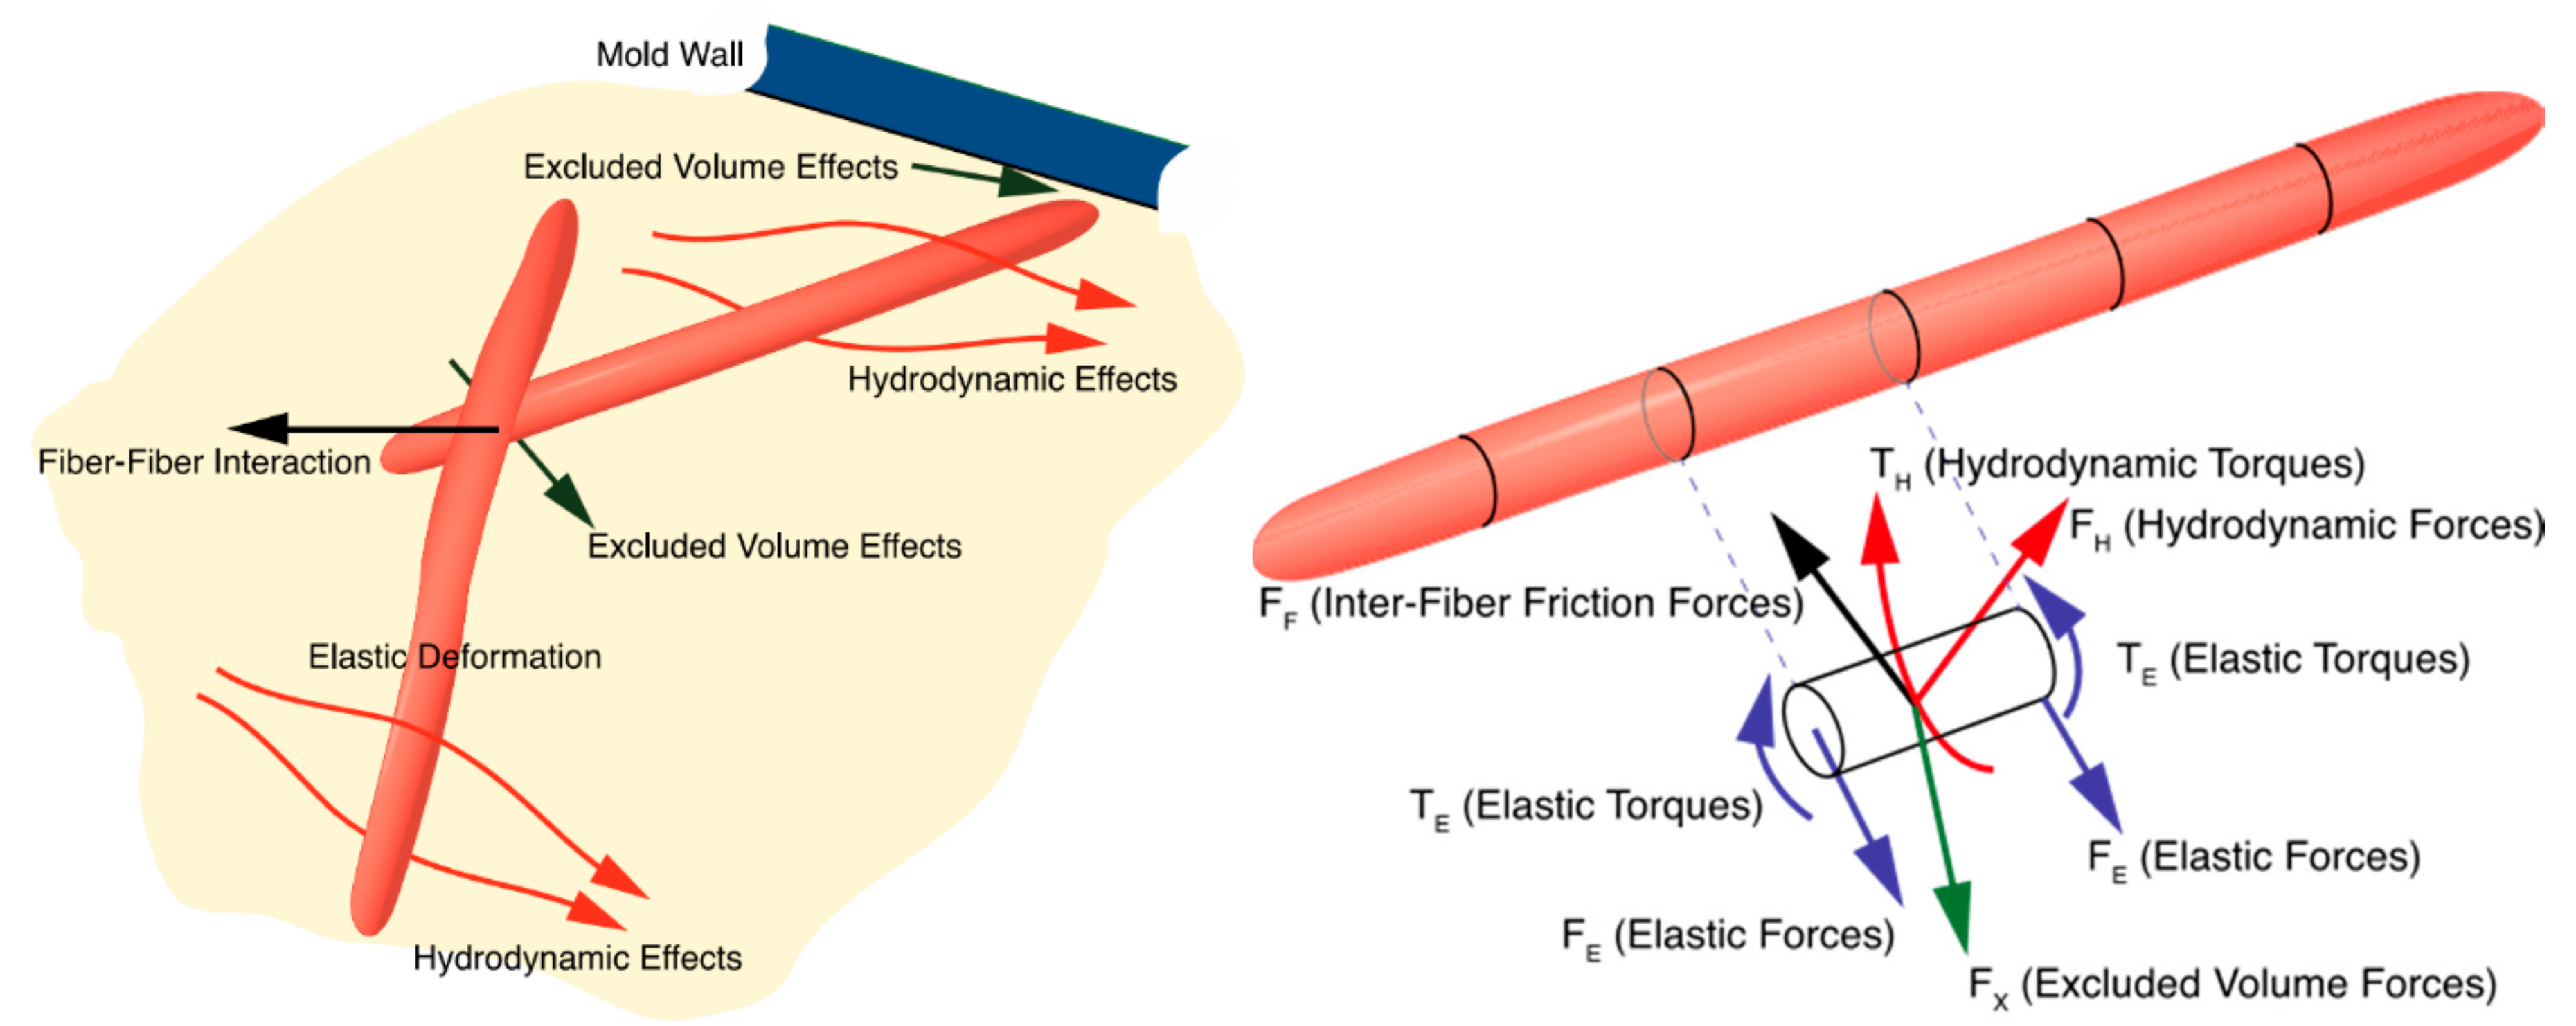
Once the bundle is placed in the cavity, fiber motion is determined by interaction with the flow field. First, a force balance is calculated for each fiber including all the effects shown in Figure 2. The “excluded volume effect” listed below is a penalty function used to model fiber-fiber interaction and fiber-mold interaction and keep fibers from occupying the same volume. As fibers approach one another, a repulsive force is applied along the shortest path between the approaching fibers, or fiber and mold wall. Fibers are also able to bend at the joints between segments, unlike in the Folgar-Tucker model, which assume short, rigid fibers [6,17]. This is important for calculating fiber behavior in parts whose dimensions are smaller than the fiber length.
The DFS applies the approach of Schmid [18] and Lindstroem [17], and the code used in this work was developed by Ramírez and Pérez [13,14]. Fibers are modeled as rigid rods connected by ball and socket joints [13]. Positions, velocities and angular velocities are stored at each node and bending may occur at these nodes. Each segment i experiences drag forces (FH), inter-fiber interactions (FF), and intra-fiber forces from neighboring segments (FX) as seen in Figure 2. Due to the low Reynolds numbers seen in polymer flows, inertial effects are ignored, as are gravitational effects. Long range hydrodynamic forces are also not calculated. It was found that calculation of these effects is prohibitively expensive in systems with large numbers of fibers and less important than contact forces [8]. Additionally, no extensional deformation of the fibers is taken into account. It is possible to make this assumption due to the high stiffness of the fibers and the relatively small effect stretching has compared to bending. More details on the fiber modelling in the mechanistic model are presented by Ramírez and Pérez [13,14]. Once the force balance is calculated, a linear system of equations is solved to find the velocity of the nodes, and the fibers are advanced one time step. One important note is that fiber-fiber and fiber-mold interactions are not calculated every integration, rather it is up to the user to specify how many integrations may pass in between this calculation. This is done to decrease computation time, as fiber-fiber interactions are the most expensive effect to calculate. In the simulations discussed in this paper, interactions were calculated once every 50 integrations which showed optimized simulative performance in earlier simulations.
With the described method, fiber movement inside the compression charge is calculated. Figure 3 shows the fiber movement during compression molding for the ribbed-plate component. It is observed how the reinforcement fibers are dragged inside the rib by the polymer flow, gradually filling the part. The fibers display complex fiber movement, bending and interaction during flow. The governing mechanisms on FMS are investigated in detail after the simulation if improved regarding the simulative boundary conditions in the following chapter.
3. Simulation Improvements
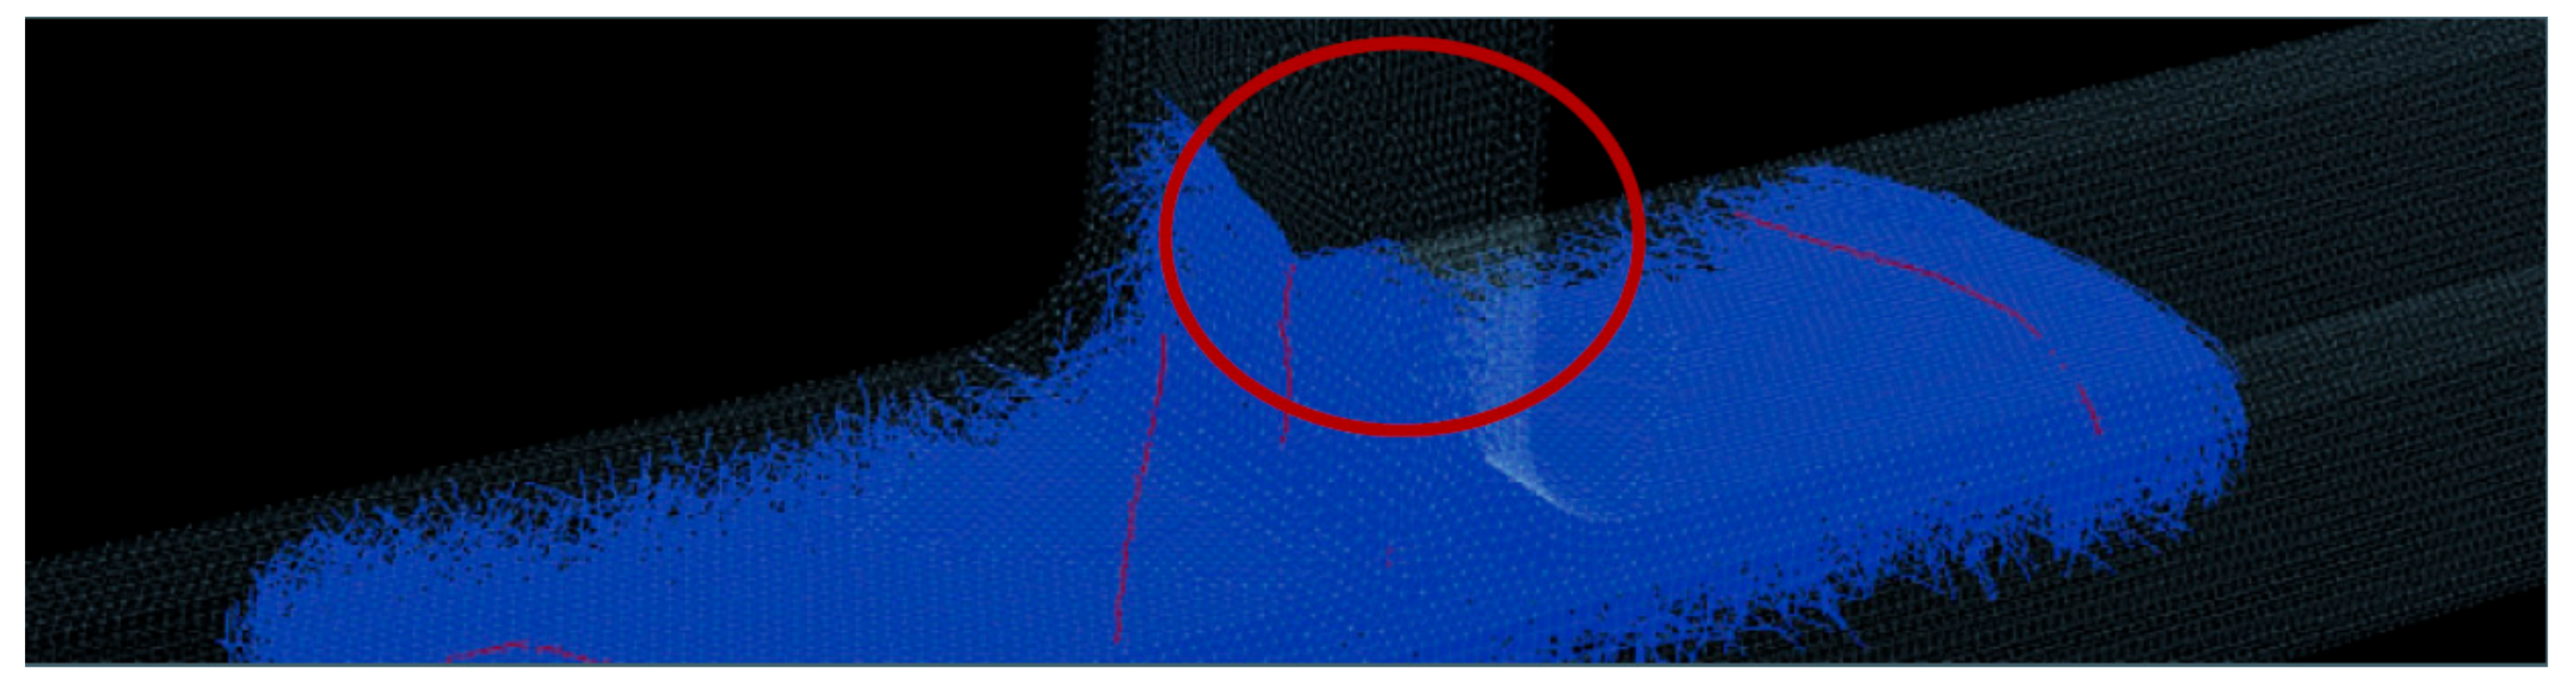
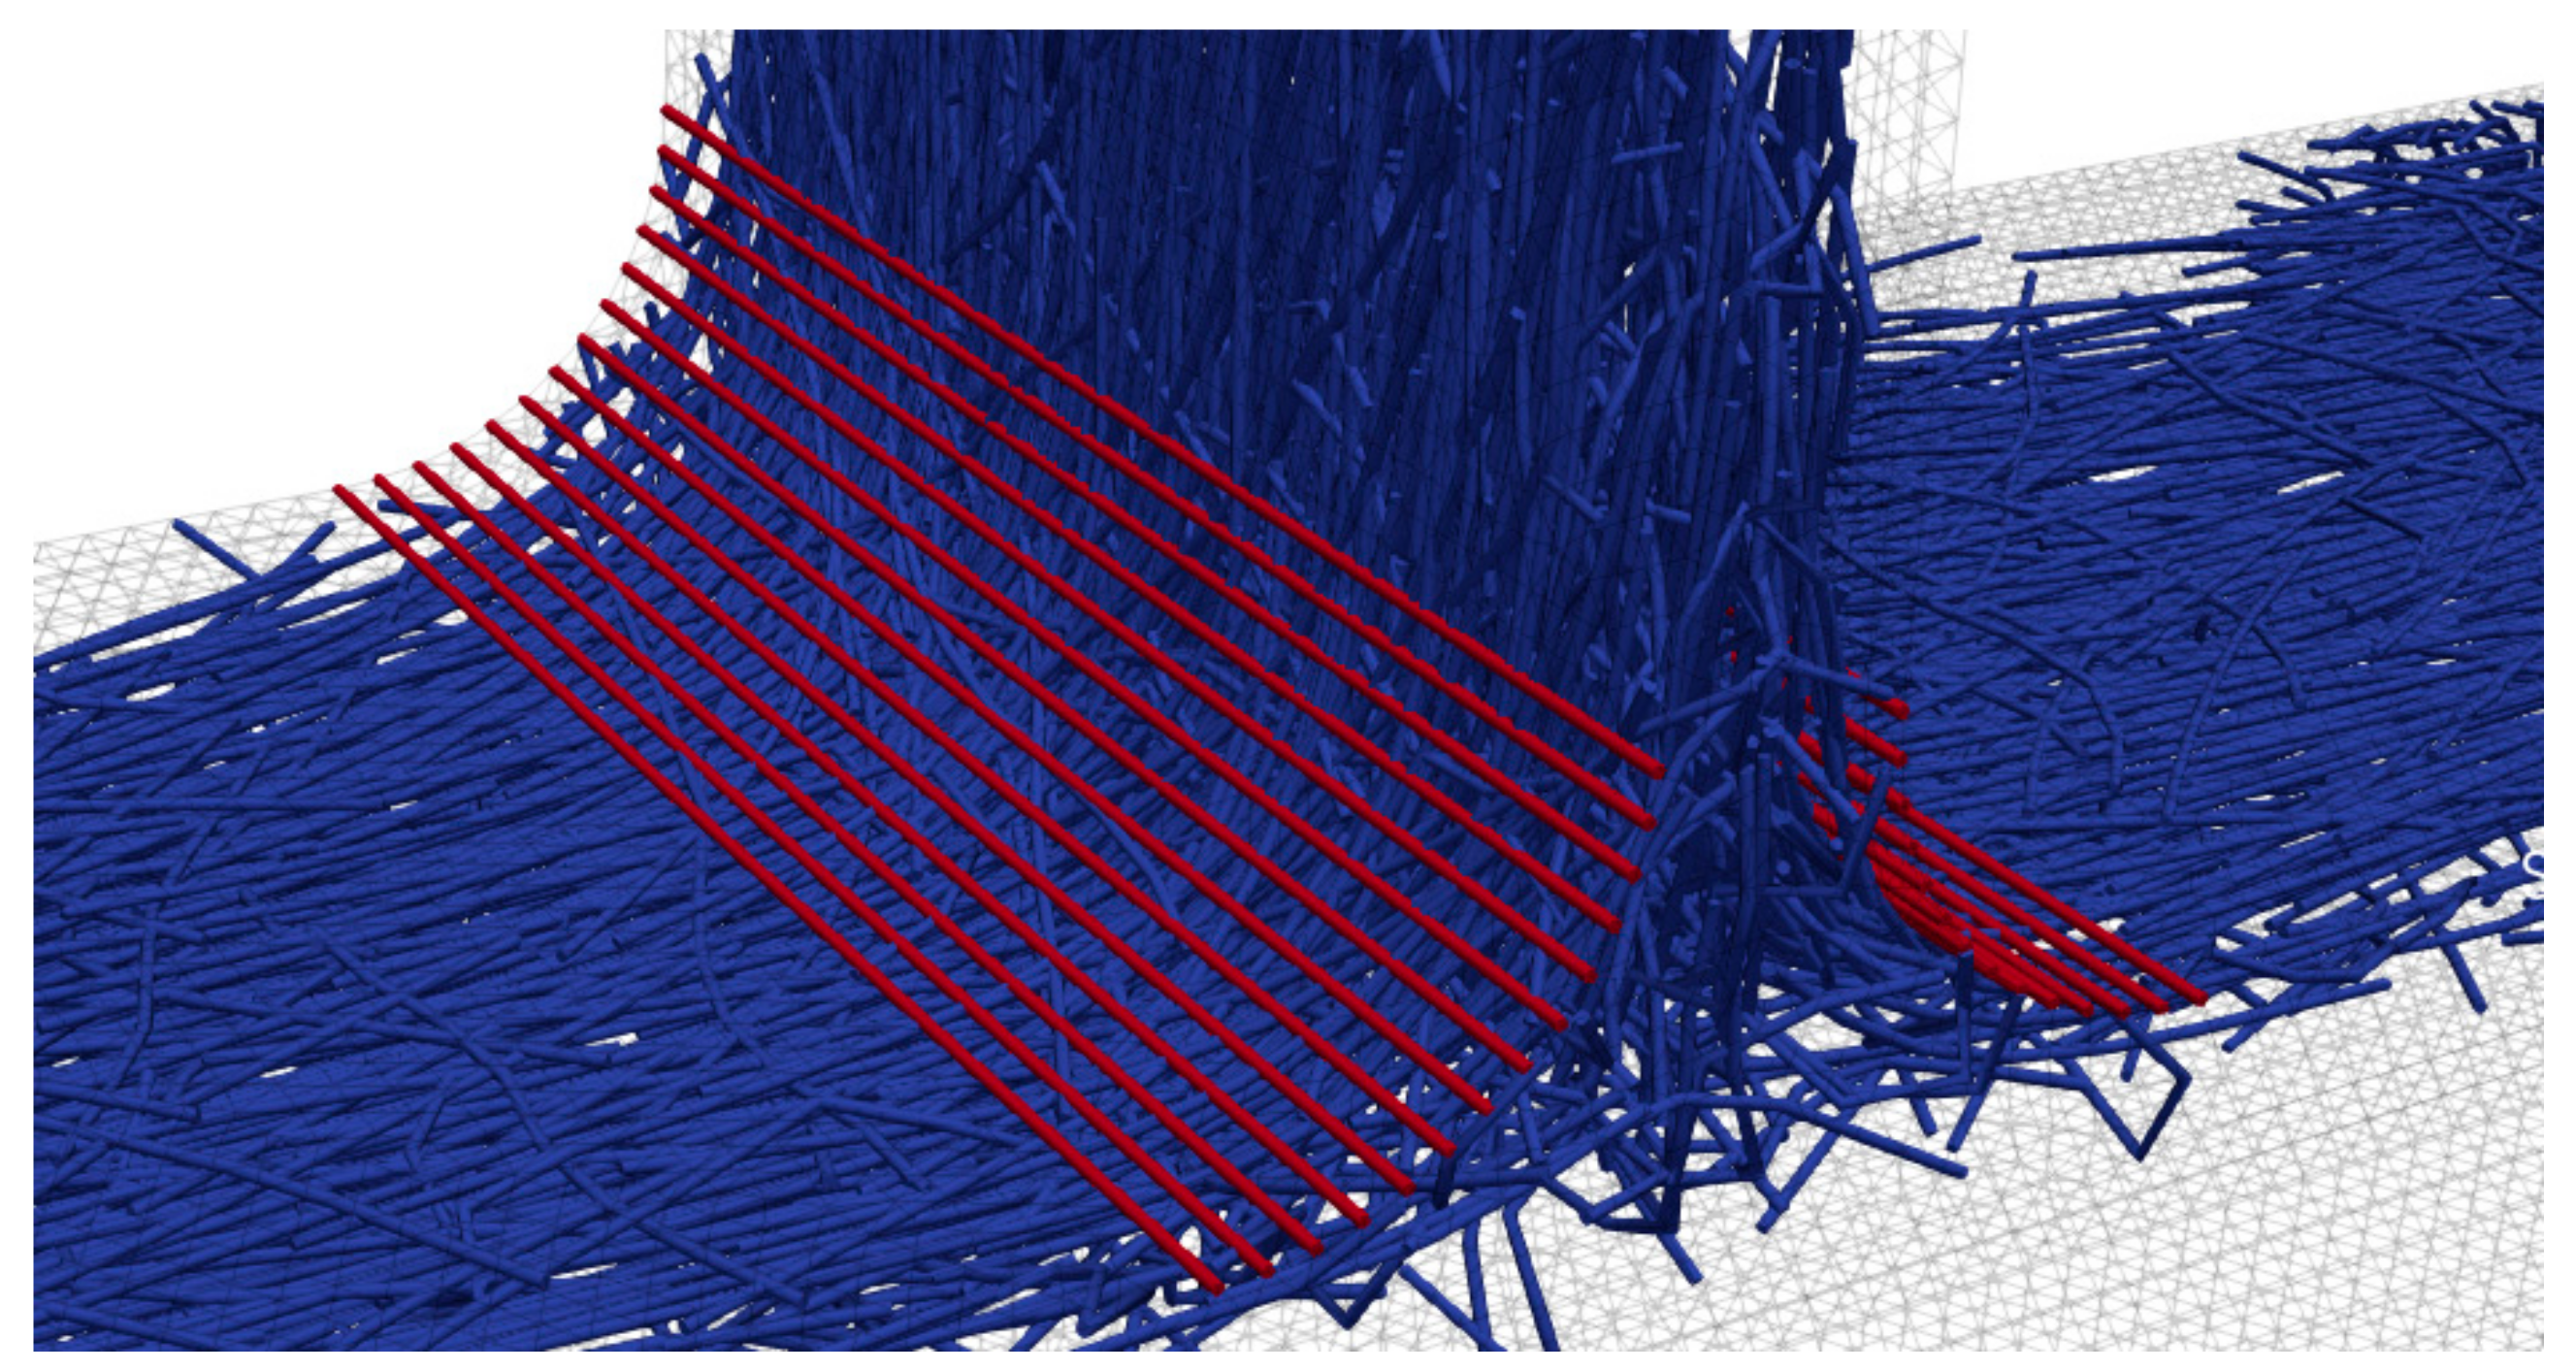
In previous simulations [15], fibers were often observed exiting the part cavity mesh. This occurs because there is no Boolean variable that stops fibers from exiting. During fiber movement, the excluded volume force applies a force away from the wall that deters fibers from exiting the mesh. This force increases with smaller distance between fibers or to the cavity walls. The issue of fibers exiting the mesh arises due to the increasing excluded volume forces within the fiber bed. Due to fiber interactions and bundling, especially as observed in the rib base, fiber interaction forces are higher than excluded volume forces from the wall. At these locations, fibers are pushed outside the wall during numerical calculations. When fibers exit the mesh, they become frozen in place. This presents an issue because the part of the fiber inside of the cavity also freezes, leaving frozen fibers hanging out into the flow field. These fibers act as hooks and artificially prevent other fibers from flowing past their location, as presented in Figure 4. In an effort to mitigate this, four identical simulations using 20 mm fibers were run and two new methods were implemented in this work.
In order to stop frozen fibers hindering the movement of other fibers, a function was added that removes fibers from the simulation once they exit the mesh and freeze. Their positions are saved before deletion and are used in the analysis of fiber position, bending, etc. When fibers are removed after freezing, a dramatic increase in fiber volume fraction at the top of the rib is seen. Enhancing boundary conditions was also used in an attempt to prevent fibers from exiting the mesh in the first place, as shown in Figure 5. Mesh boundary conditions are enhanced at the edge of the mesh in problematic areas such as corners or ribs. These extra barriers increase the excluded volume force applied away from the wall and help prevent fibers from exiting the mesh. As can be seen in Figure 5, this leads to more realistic results. All full charge simulations done within this work used both a fiber barrier, and removed fibers when they were frozen to avoid artificial bridging.
4. Simulative Study
Simple rib simulations are conducted using the entire bottom of the plate as the compression surface as shown in Figure 6. Initially, a fractional factorial design of experiments (DOE) is completed to give an overview of the different variables and assess their relative effect on fiber volume fraction throughout the rib. For analysis, the 35 mm rib is divided into three sections, including the top (11 mm), middle (12 mm), and bottom (12 mm). Additionally, the fiber orientation in the plate extending 10 mm in either direction from the center of the rib is evaluated.
For the following analysis, each variable was used at two different levels, −/+, as shown in Table 1. The average fiber volume fraction values at each section are measured and used to determine the relative magnitude of the effects of each parameter.
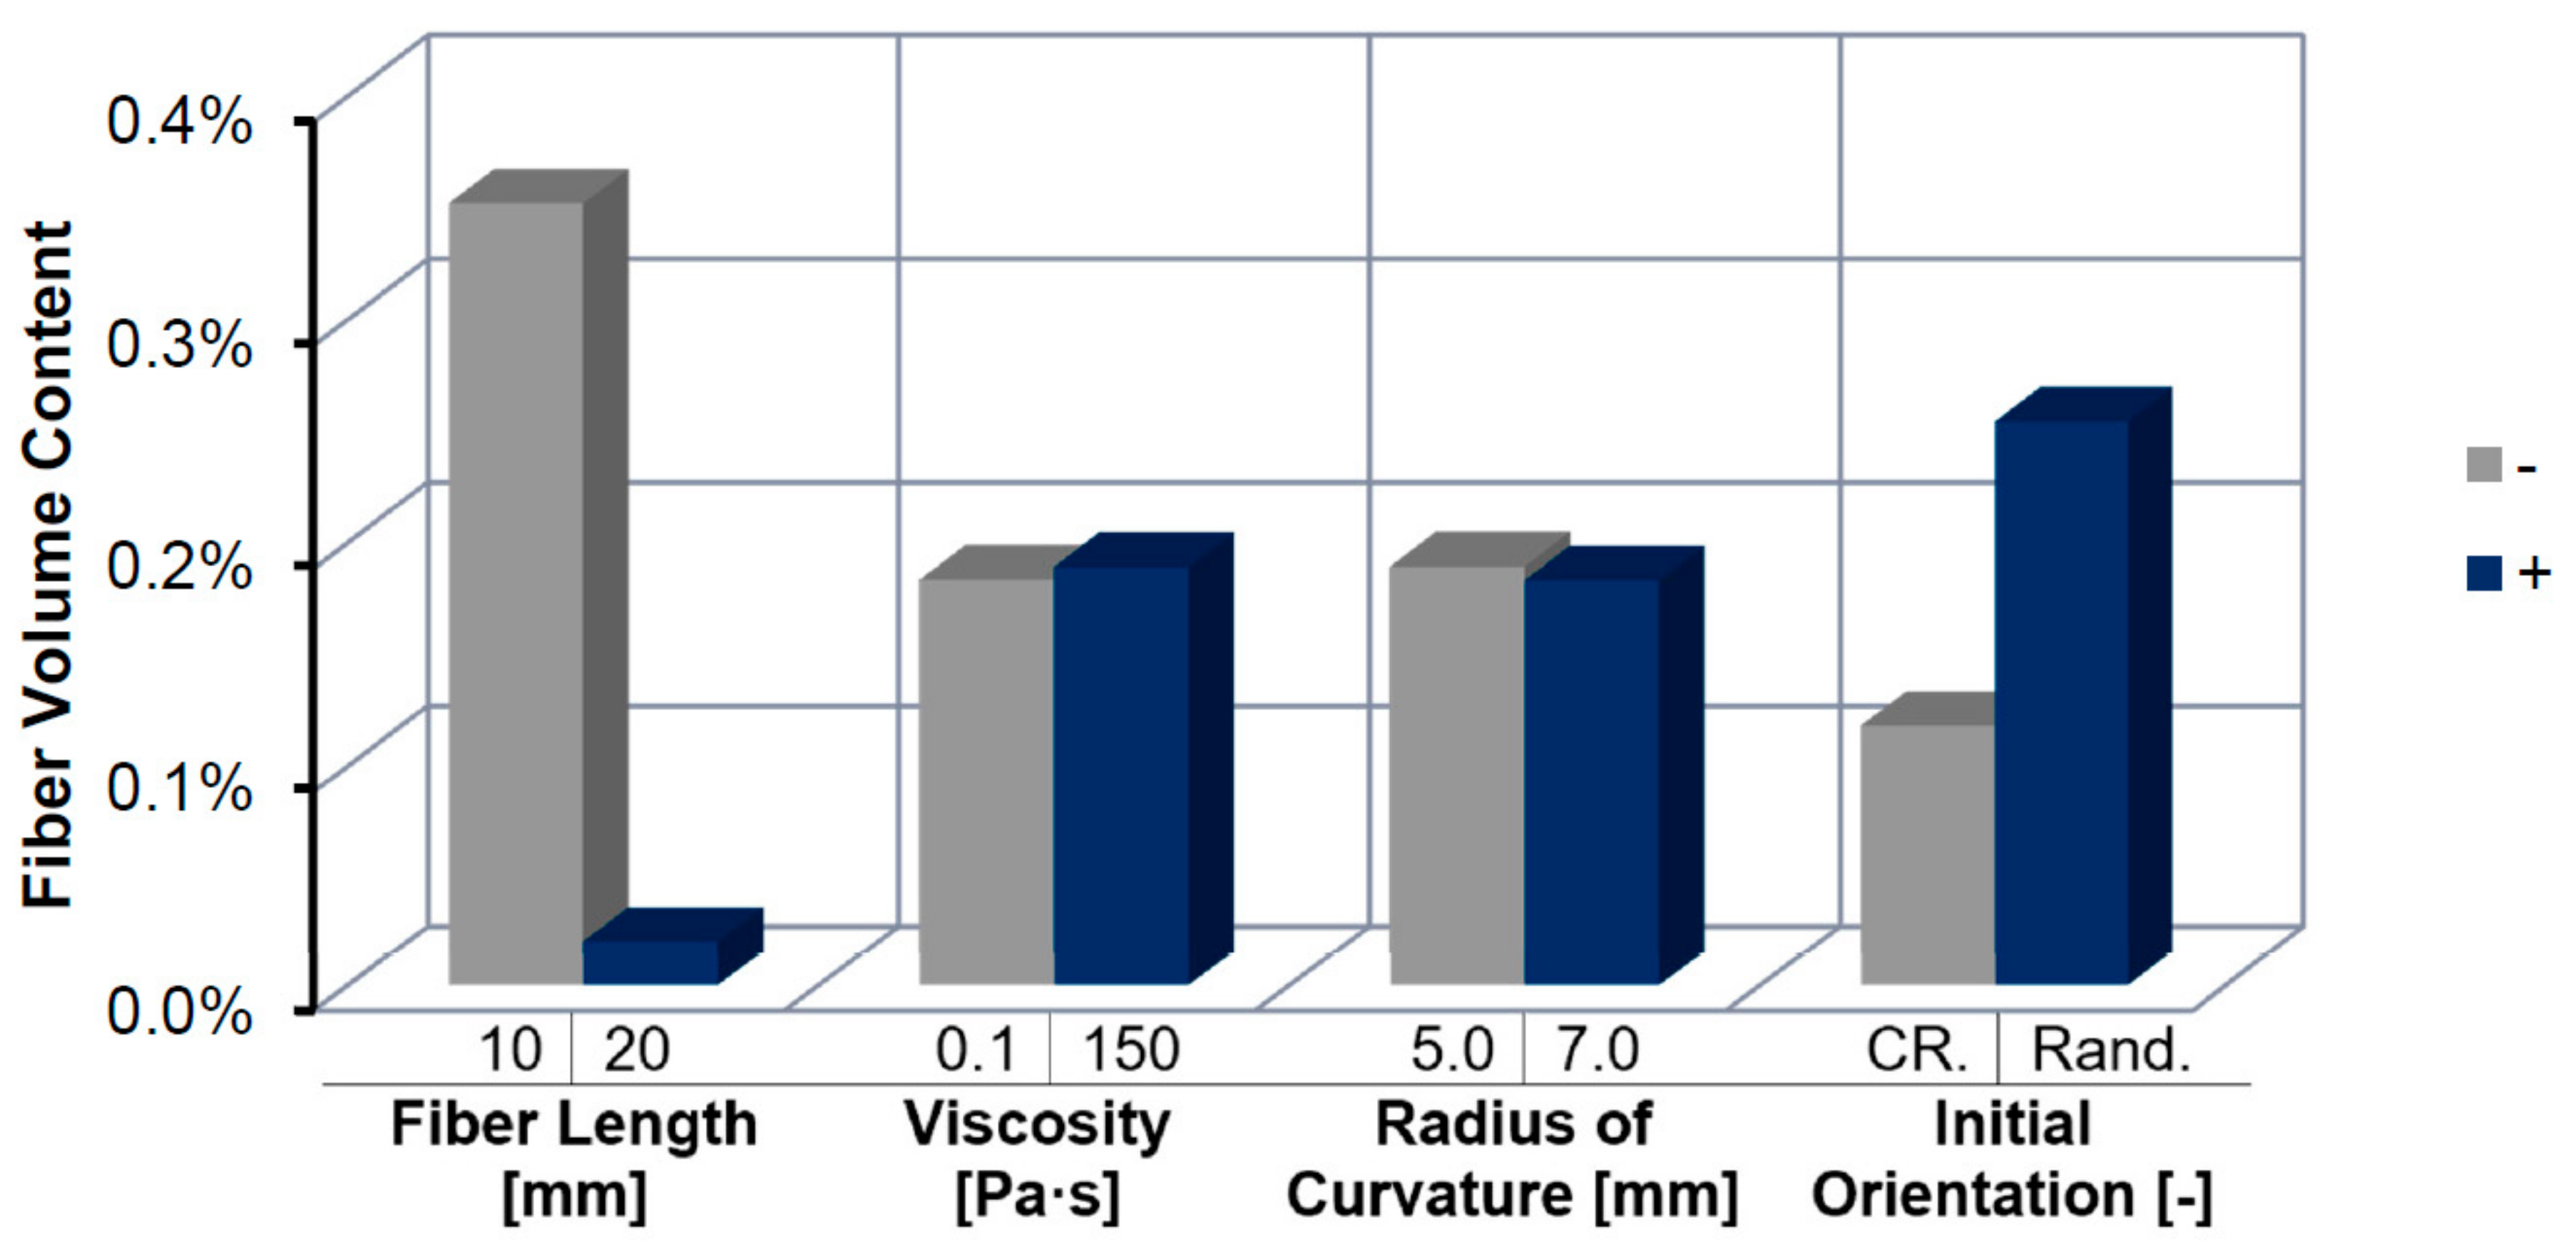
As observed in Figure 7, fiber length displays the largest effect on filling percentage in the top third of the rib. Initial fiber orientation had the next largest effect, with fibers oriented across the rib showing excessive fiber bridging and FMS. Longer fibers and fibers oriented across the rib opening create more fiber bridging which made it more difficult for other fibers to flow past and into the rest of the rib. This led to lower volume fractions in the rib due to the velocity gradient between the fiber and matrix.
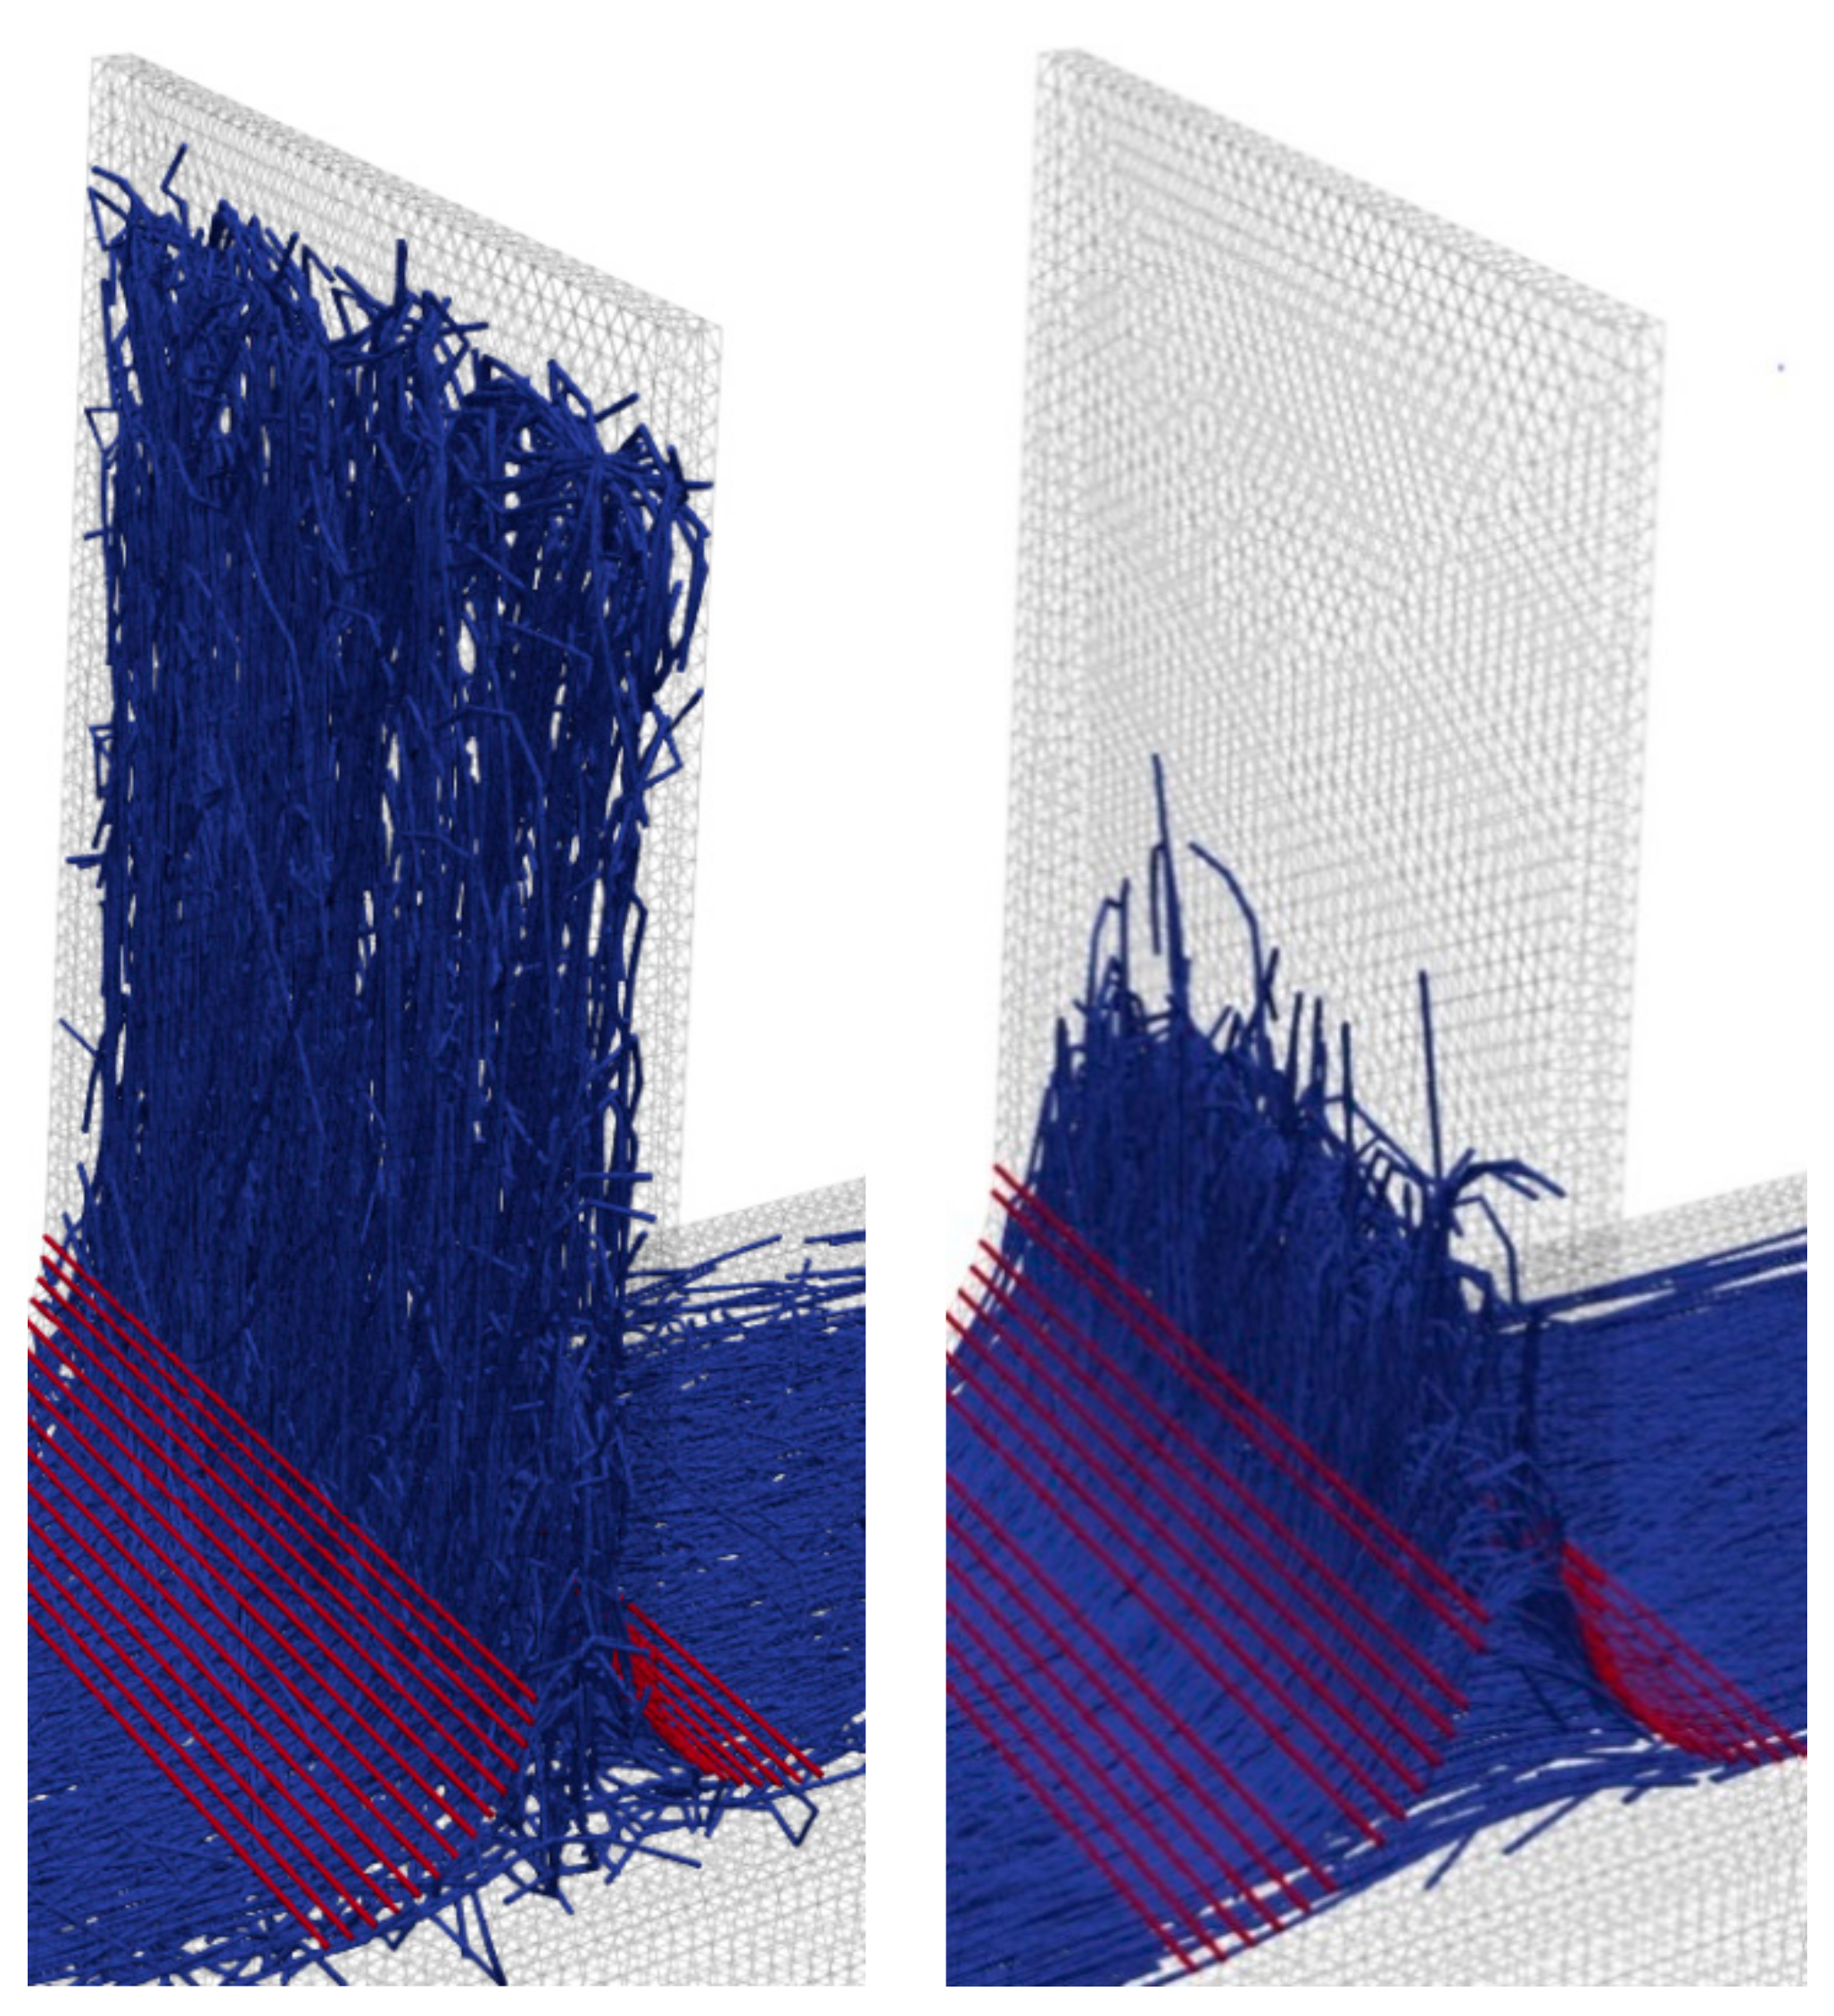
Figure 8 illustrates the difference seen between the most favorable conditions and the least favorable. A large variation in fiber content is seen, and a large difference in orientation can also be observed at the rib base. On the left-hand side, random short fibers can be seen to easily make it into the rib as they are not oriented across the opening. On the right-hand side, longer fibers oriented across the rib tend to get stuck in this area and experience great difficulty moving past the bottom of the rib.
Inside the midsection of the rib (Figure 9), it is observed that varying fiber length and orientation creates the largest content variations, although the viscosity and geometry begin to have a larger effect as well. Higher viscosity and a larger rib entrance both have favorable effects on the volume content. These results are in agreement with previous work by Londoño et al. [10].
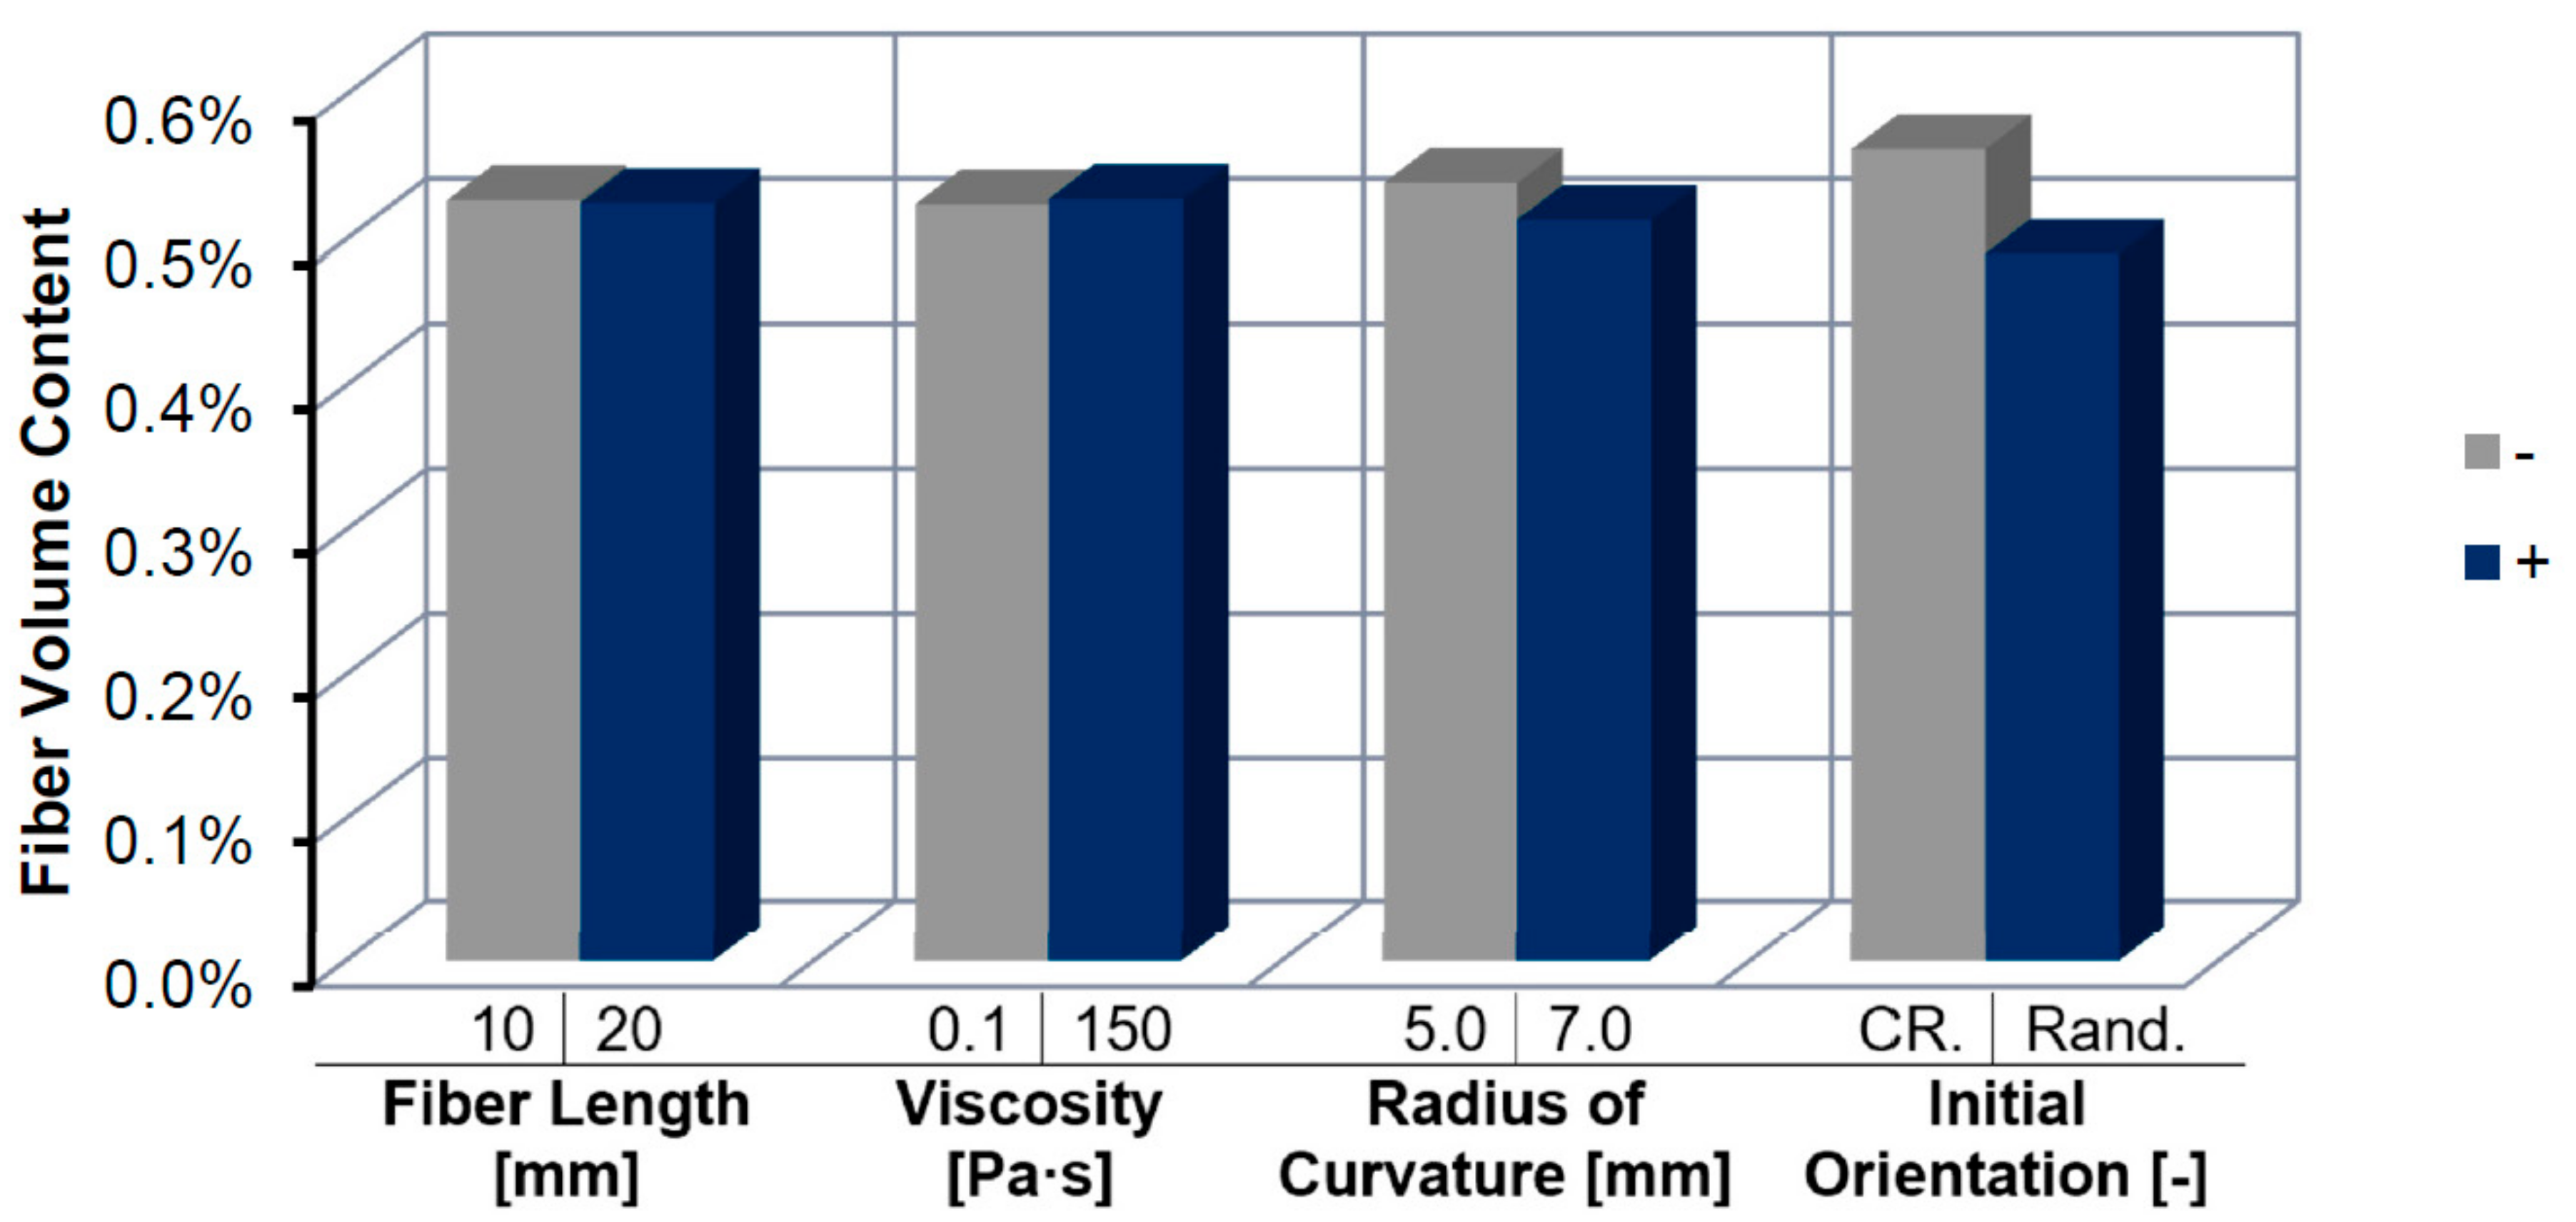
Figure 10 displays the fiber content at the bottom of the rib. Here we see that viscosity and fiber length do not play as important of a role, but rather the size of the rib entrance and the orientation have a larger, but yet comparably low effect. This implies that a sufficient length for fiber jamming and bridging has been reached and the orientation begins to play a larger role on fiber bridging and jamming.
The effect of fiber bridging can be seen in both the DFS results as well as physical experiments as shown by Kuhn et al. [15] in Figure 11. Several fiber bundles that appear to be flowing around an obstruction are seen, and on the right, the same behavior is observed during simulation. This implies that the DFS is able to model fiber-fiber interaction effects that lead to FMS.
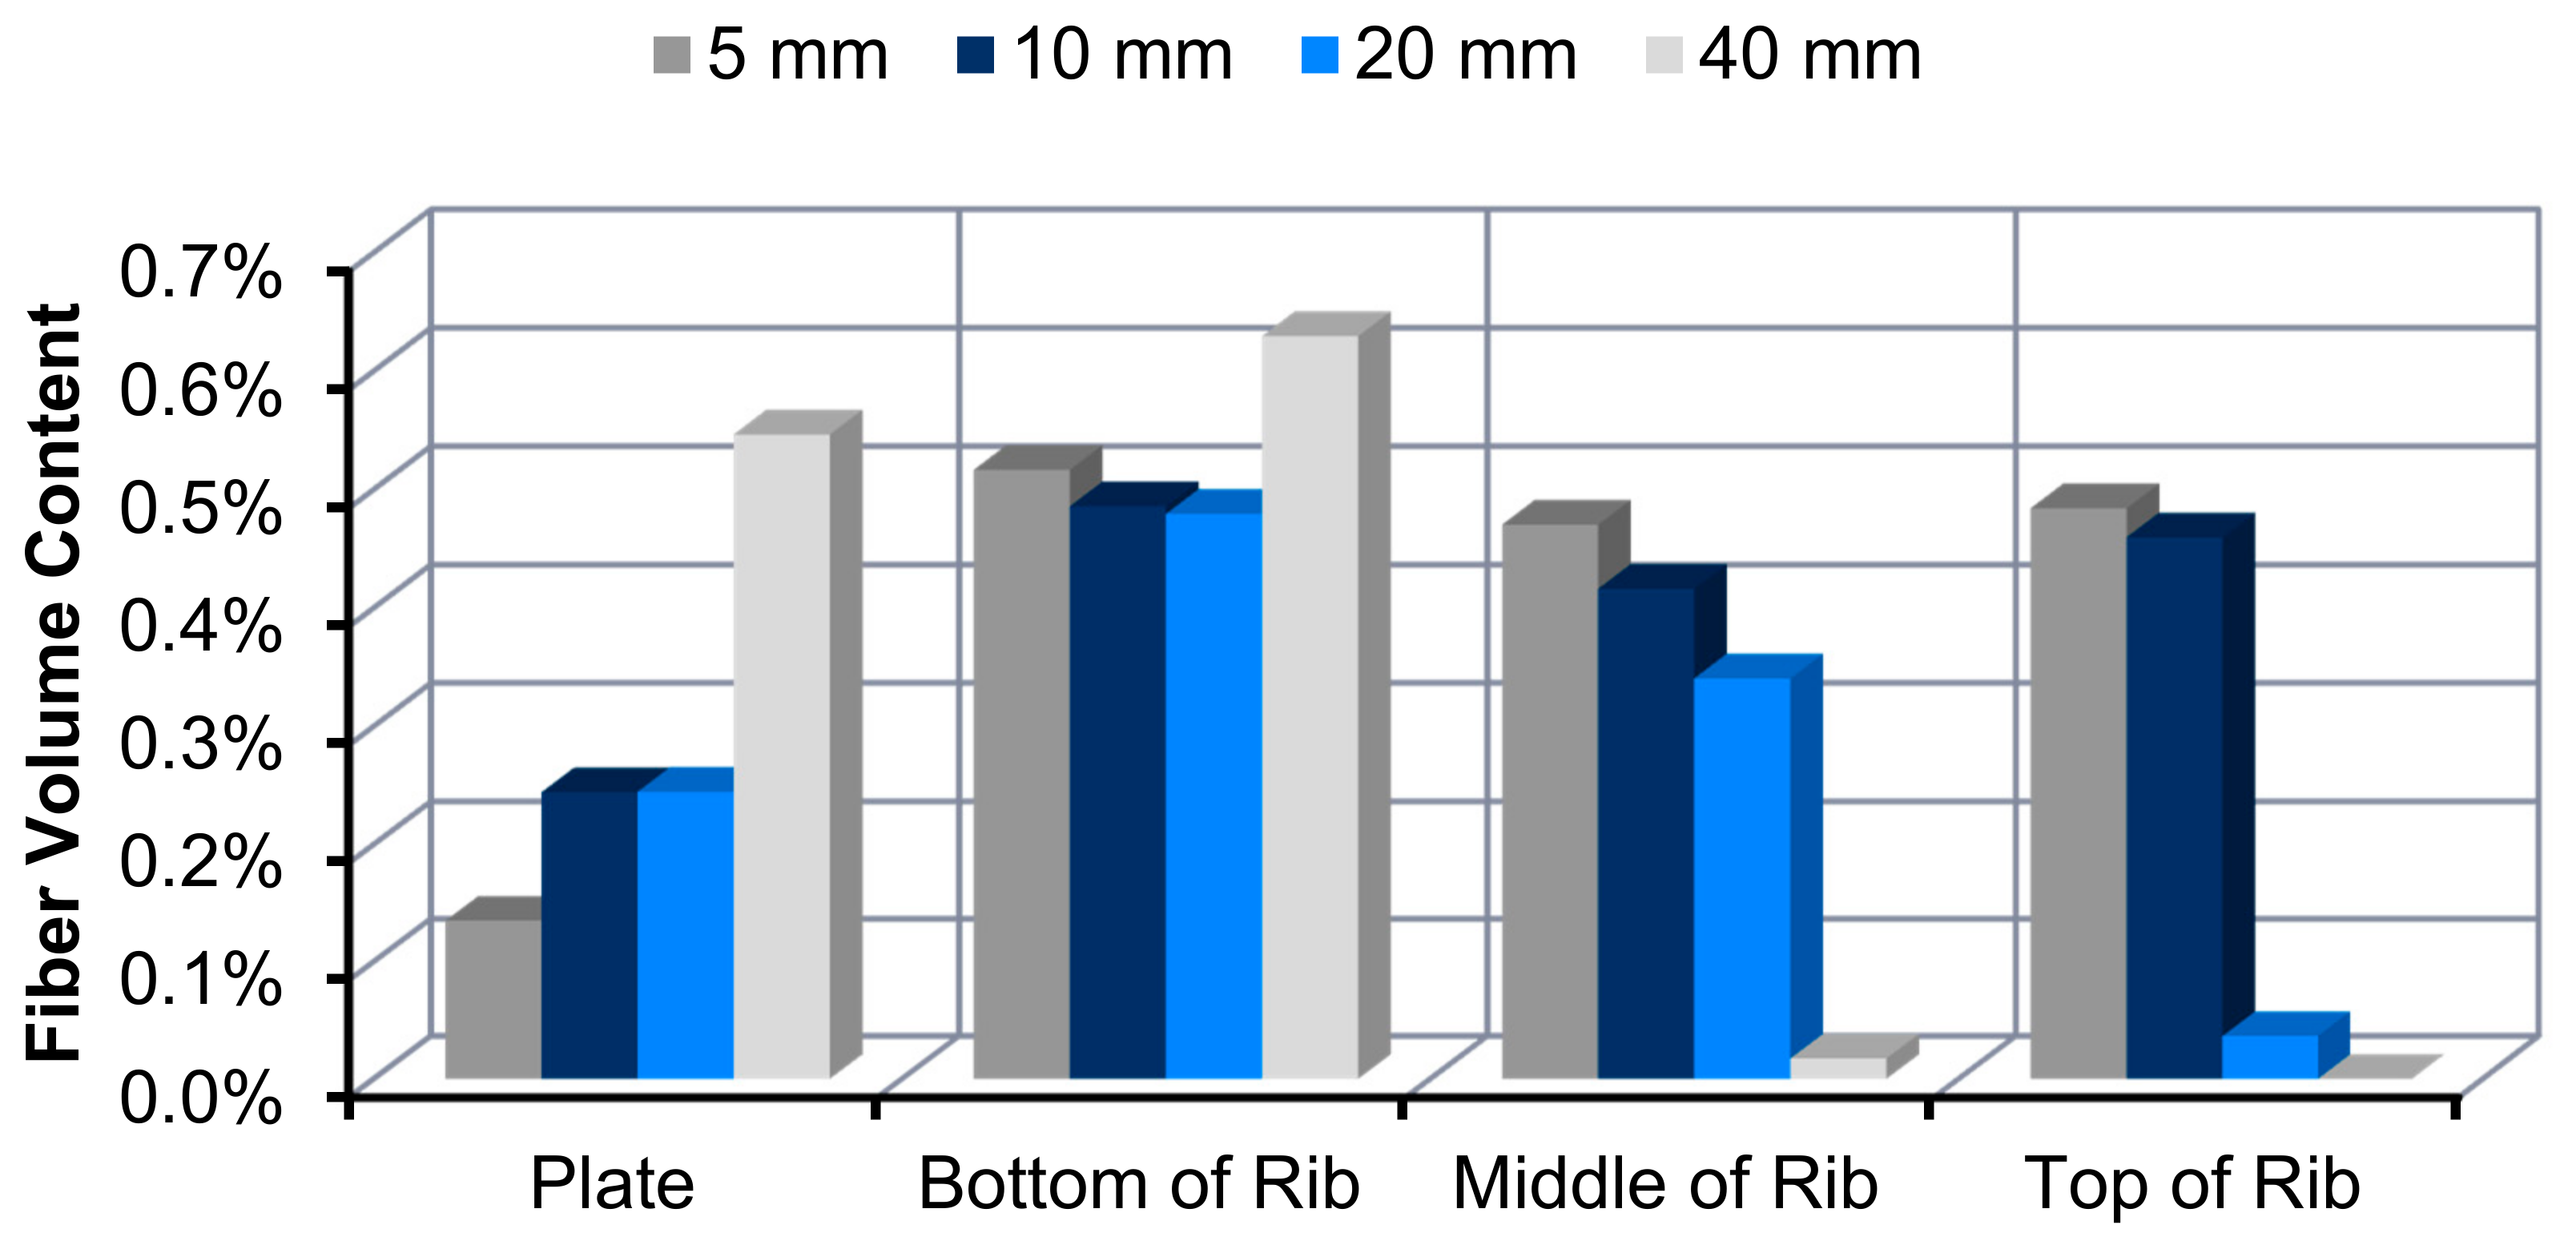
To further investigate the influencing parameters on FMS in ribs, additional simulations are conducted. Figure 12 displays the change of fiber content inside the rib sections with different initial fiber lengths.
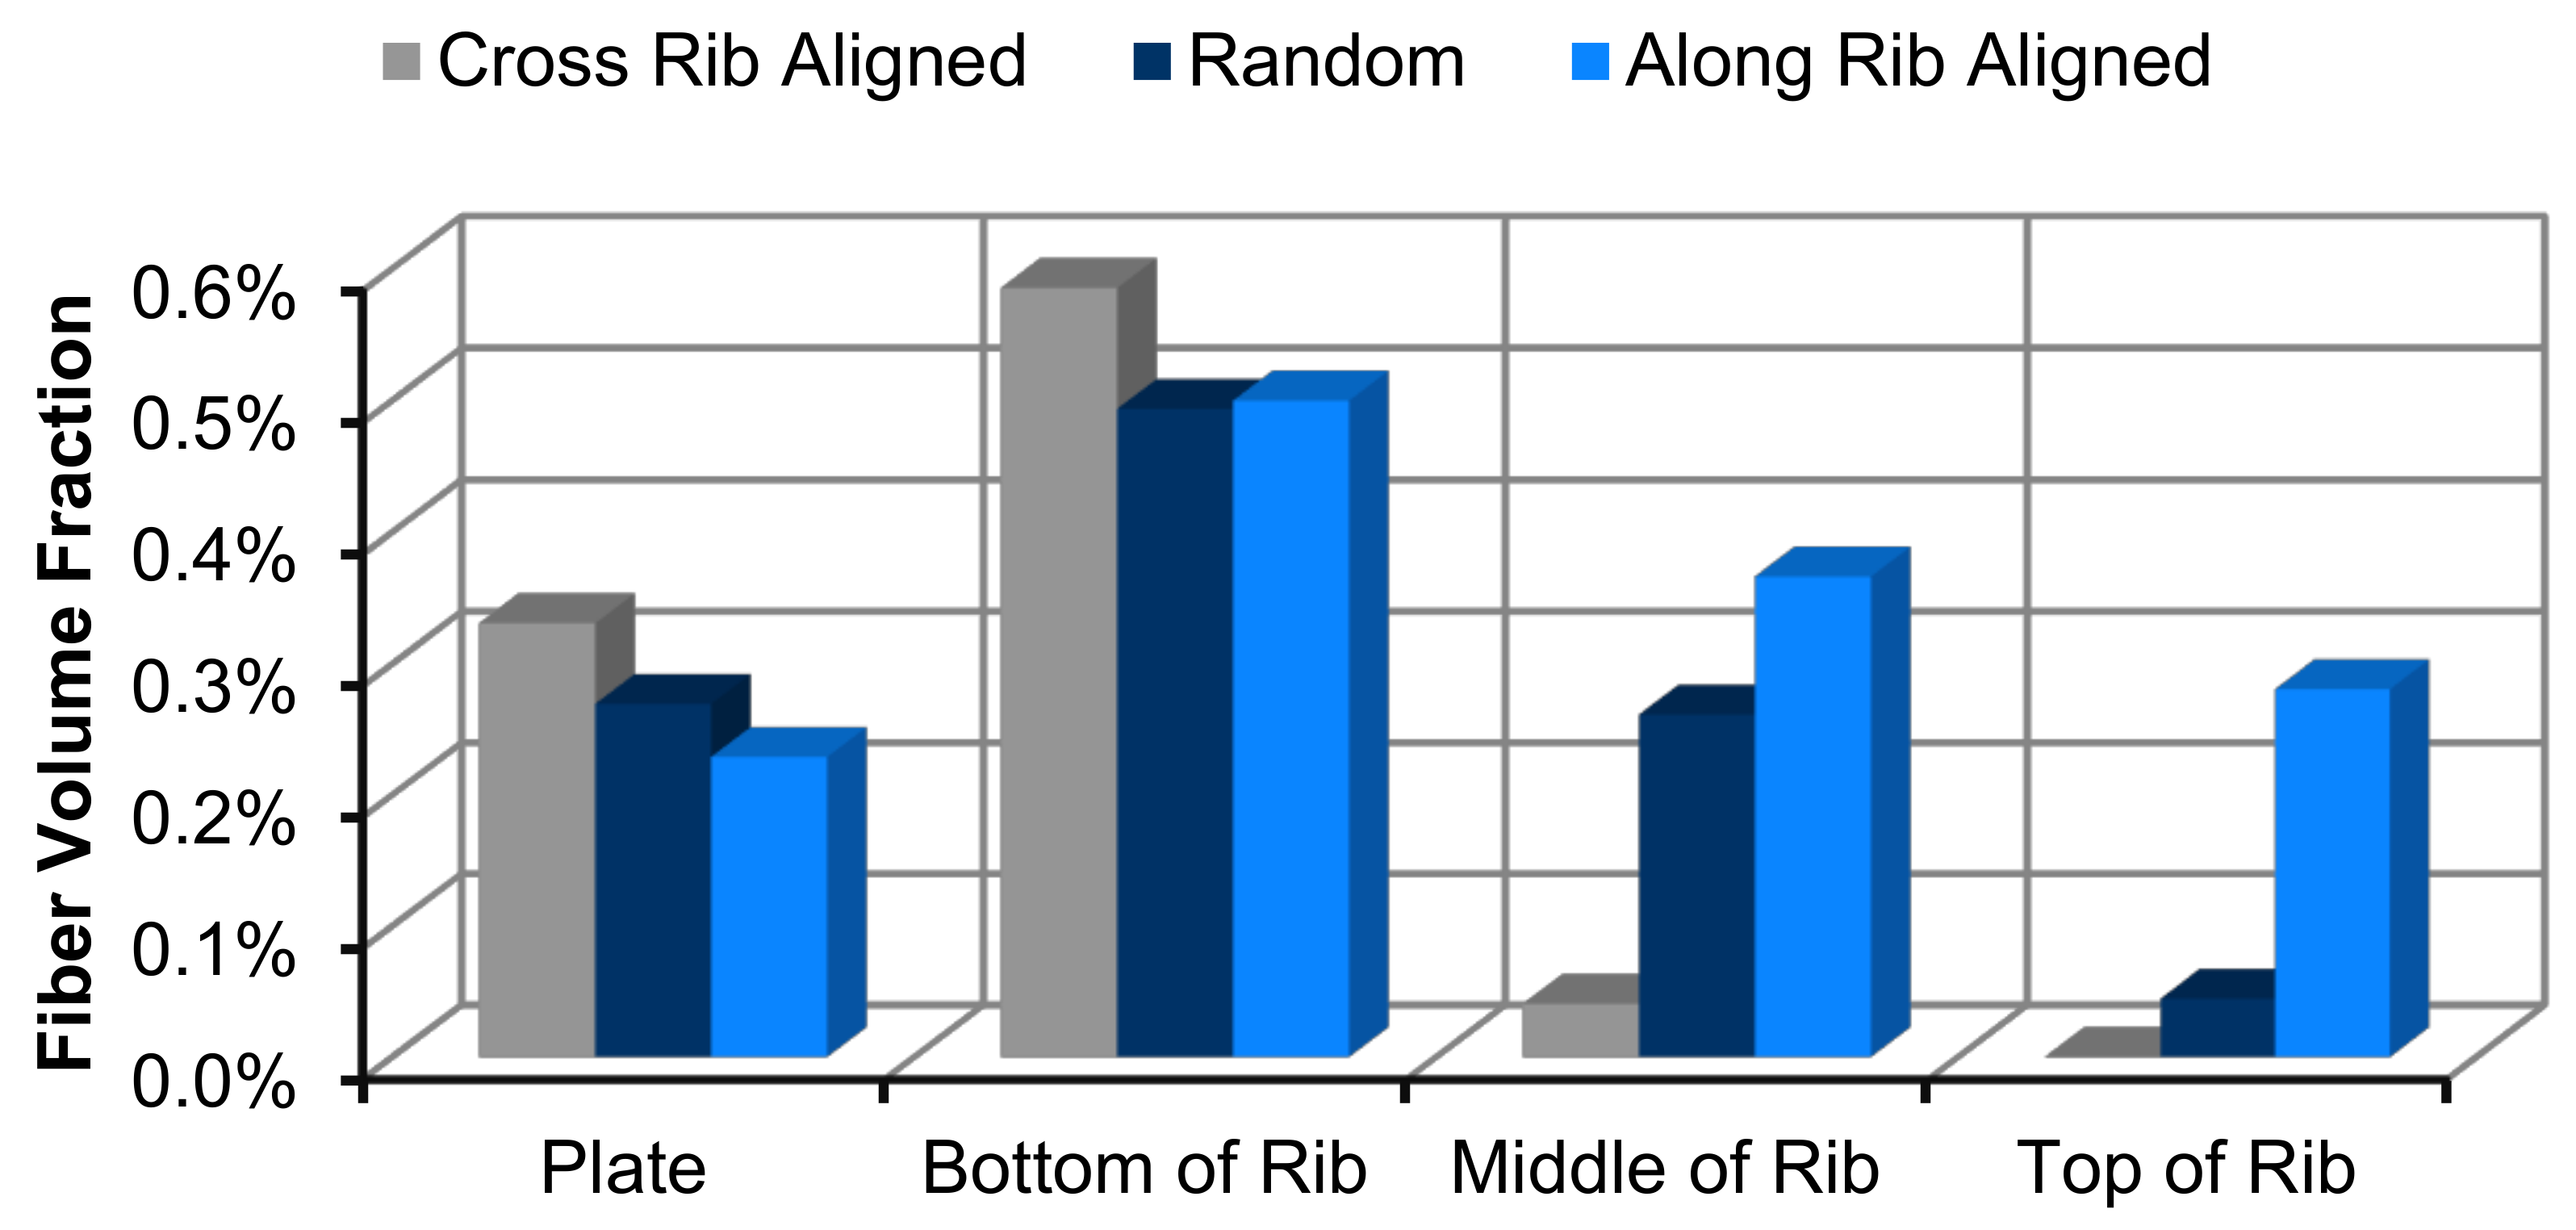
It is observed that 5 and 10 mm fibers exhibit less deviations in fiber content than 20 and 40 mm. With fibers which are shorter than, or approximately the same size as the rib entrance, significantly less fiber bridging is observed. With 20 and 40 mm fibers, intensive fiber bridging occurs which is reflected in the high fiber content at the base of the rib, and smaller fiber content in the upper two sections of the rib. Simulations are conducted to further assess the effect of initial fiber orientation on fiber volume content deviations inside the rib. Figure 13 shows that there is a dramatic difference as the initial orientation moved from cross rib aligned to aligned in the direction of the rib. This agrees with the hypothesis that bridging plays a large role in preventing fibers from entering the rib.
Fewer fibers are oriented across the rib, which leads to fewer fibers as candidates for bridging. This reduces potential flow obstacles and allows more fibers to enter the rib. Further evidence is observed in the change of volume fraction at the bottom of the rib, where there are more fibers in the cross rib bundle. The same set of simulations was run at a slightly higher fiber volume fraction but, this did not prove to be a sufficiently high volume fraction to change the filling behavior appreciably. The effect of the radius of the rib entrance was also studied, and simulations using a rib that had no radius at the bottom were run to compare against the 5 mm and 7 mm radii, as shown in Figure 14. Adding a radius to the bottom of the rib improved the fiber volume fraction in the middle portion of the rib. Fibers had difficulties getting to the top of the rib regardless of the rib entrance, with no significant difference seen amongst the three different geometries. The absence of a radius also led to a higher volume fraction immediately below the rib entrance and a slightly higher volume fraction in the bottom-most portion of the rib. This higher volume fraction shows that there are more fibers that span the rib opening and become stuck in this area. With a smaller opening, a much wider range of orientations can facilitate bridging.
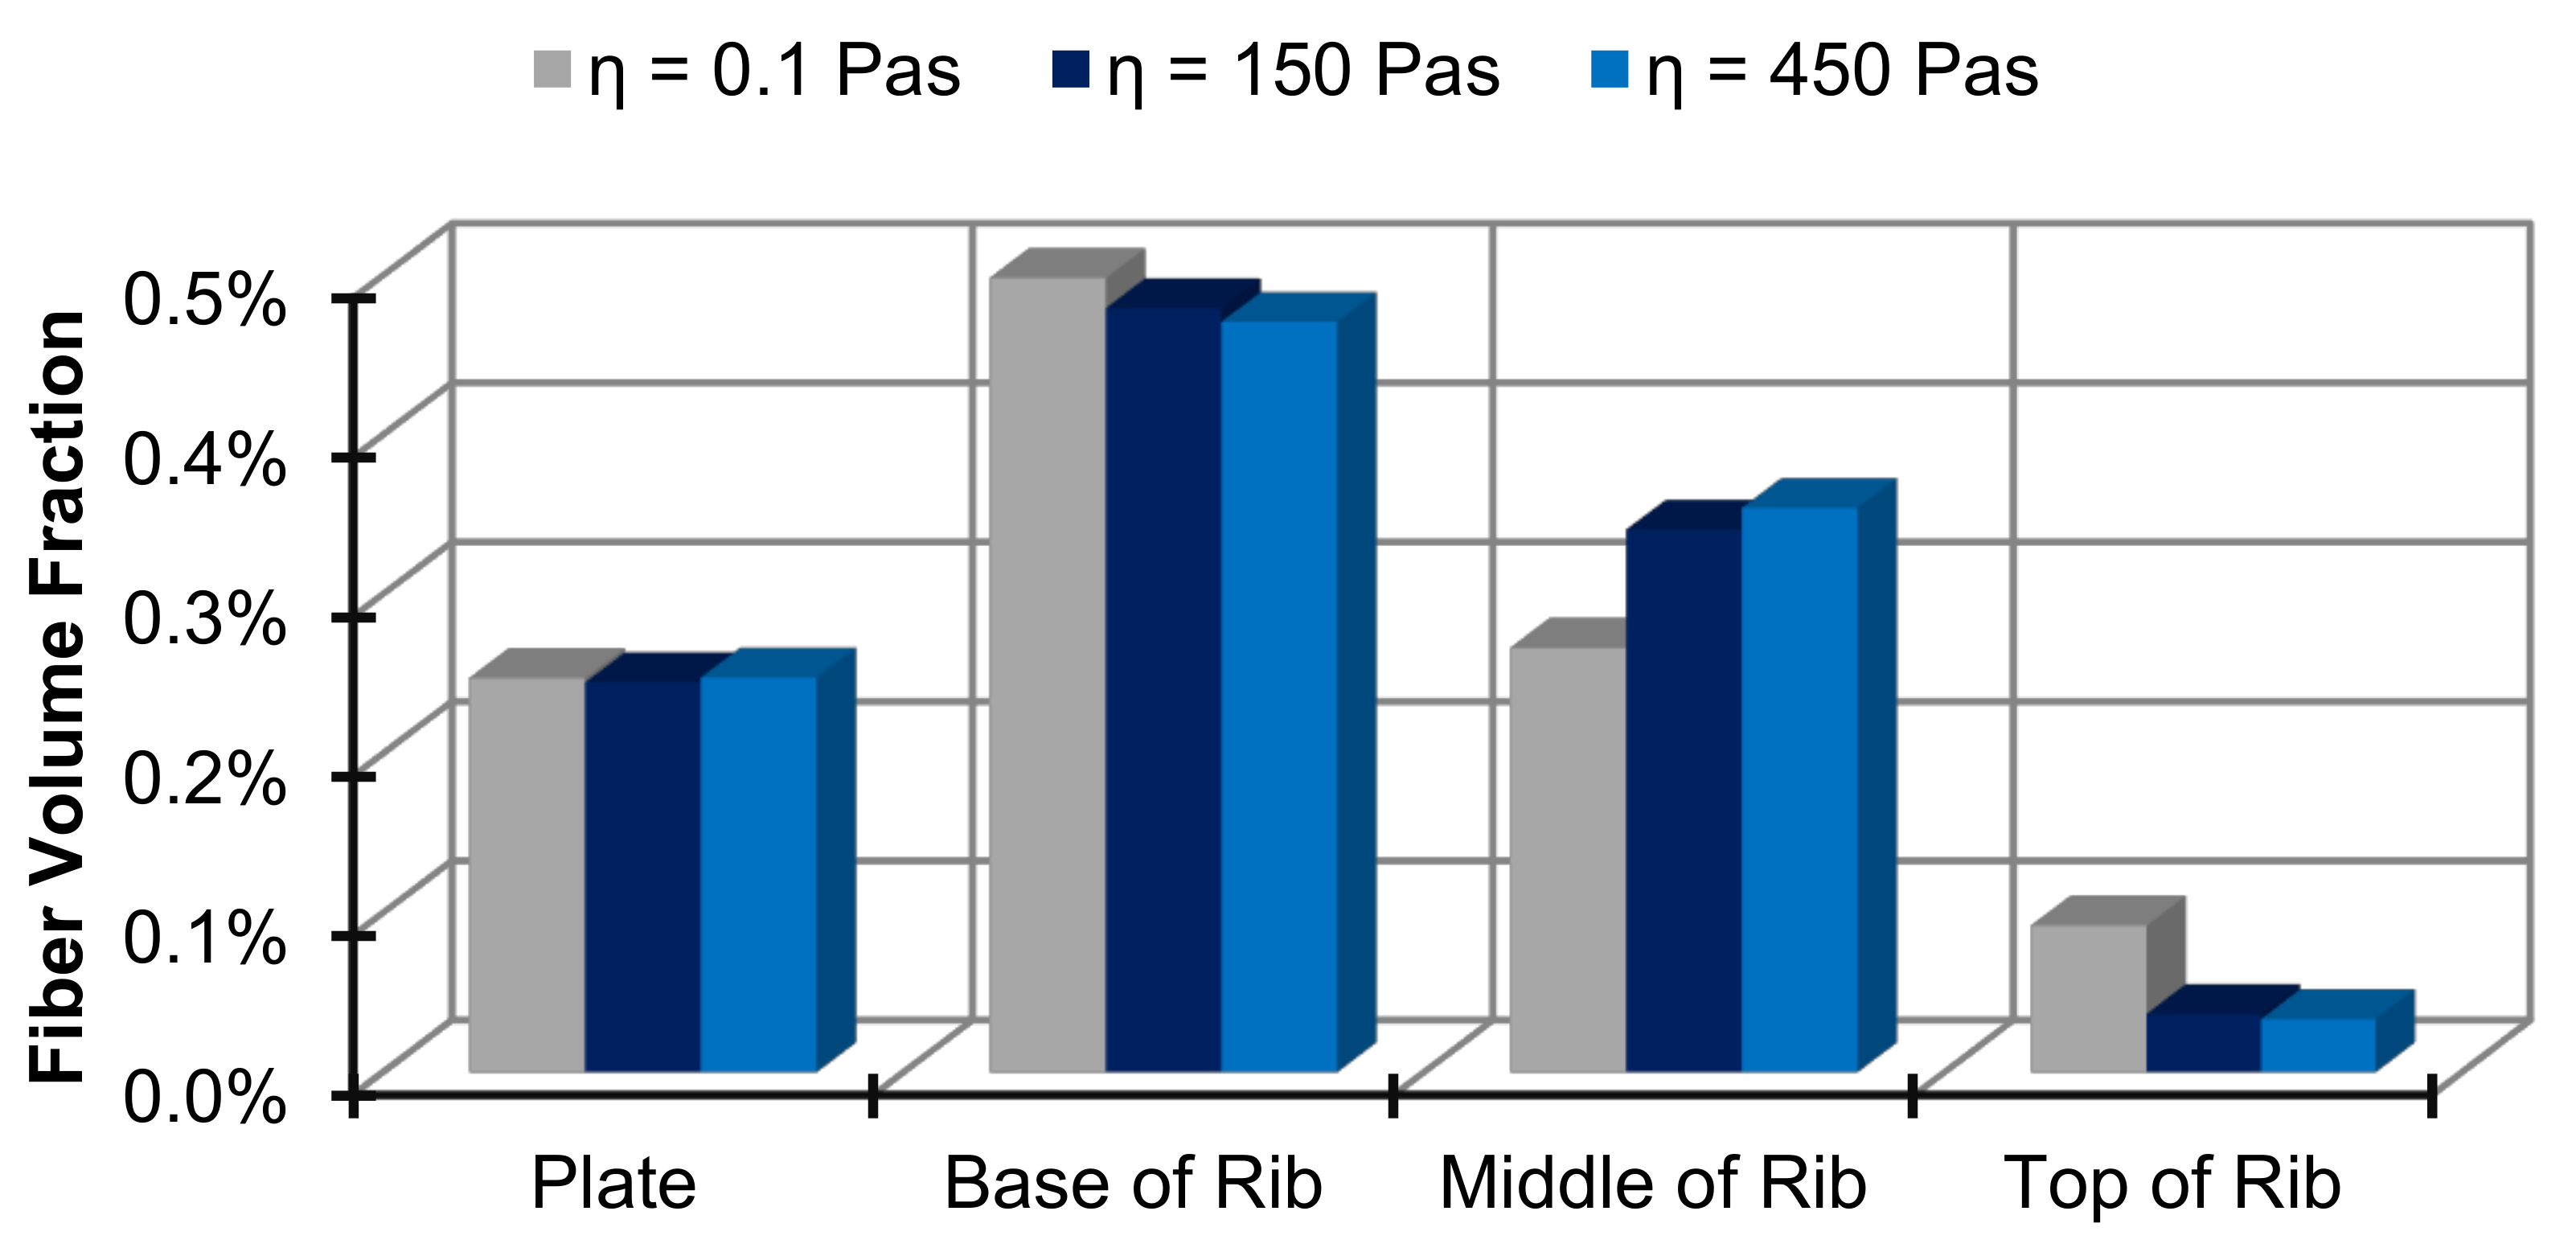
Furthermore, the influence of polymer viscosity is investigated in Figure 15. With increasing viscosity, the volume fraction increases from the plate to the rib, and then decreases. The highest level of accumulation in the rib base is seen at the lowest viscosity level, where the hydrodynamic forces are unable to overcome the jamming that occurs. This also leads to a lower level in the midsection, with higher viscosities showing higher content here. Finally, in the top of the rib, none of the viscosity levels show a high volume fraction.
5. Experimental Results Comparison
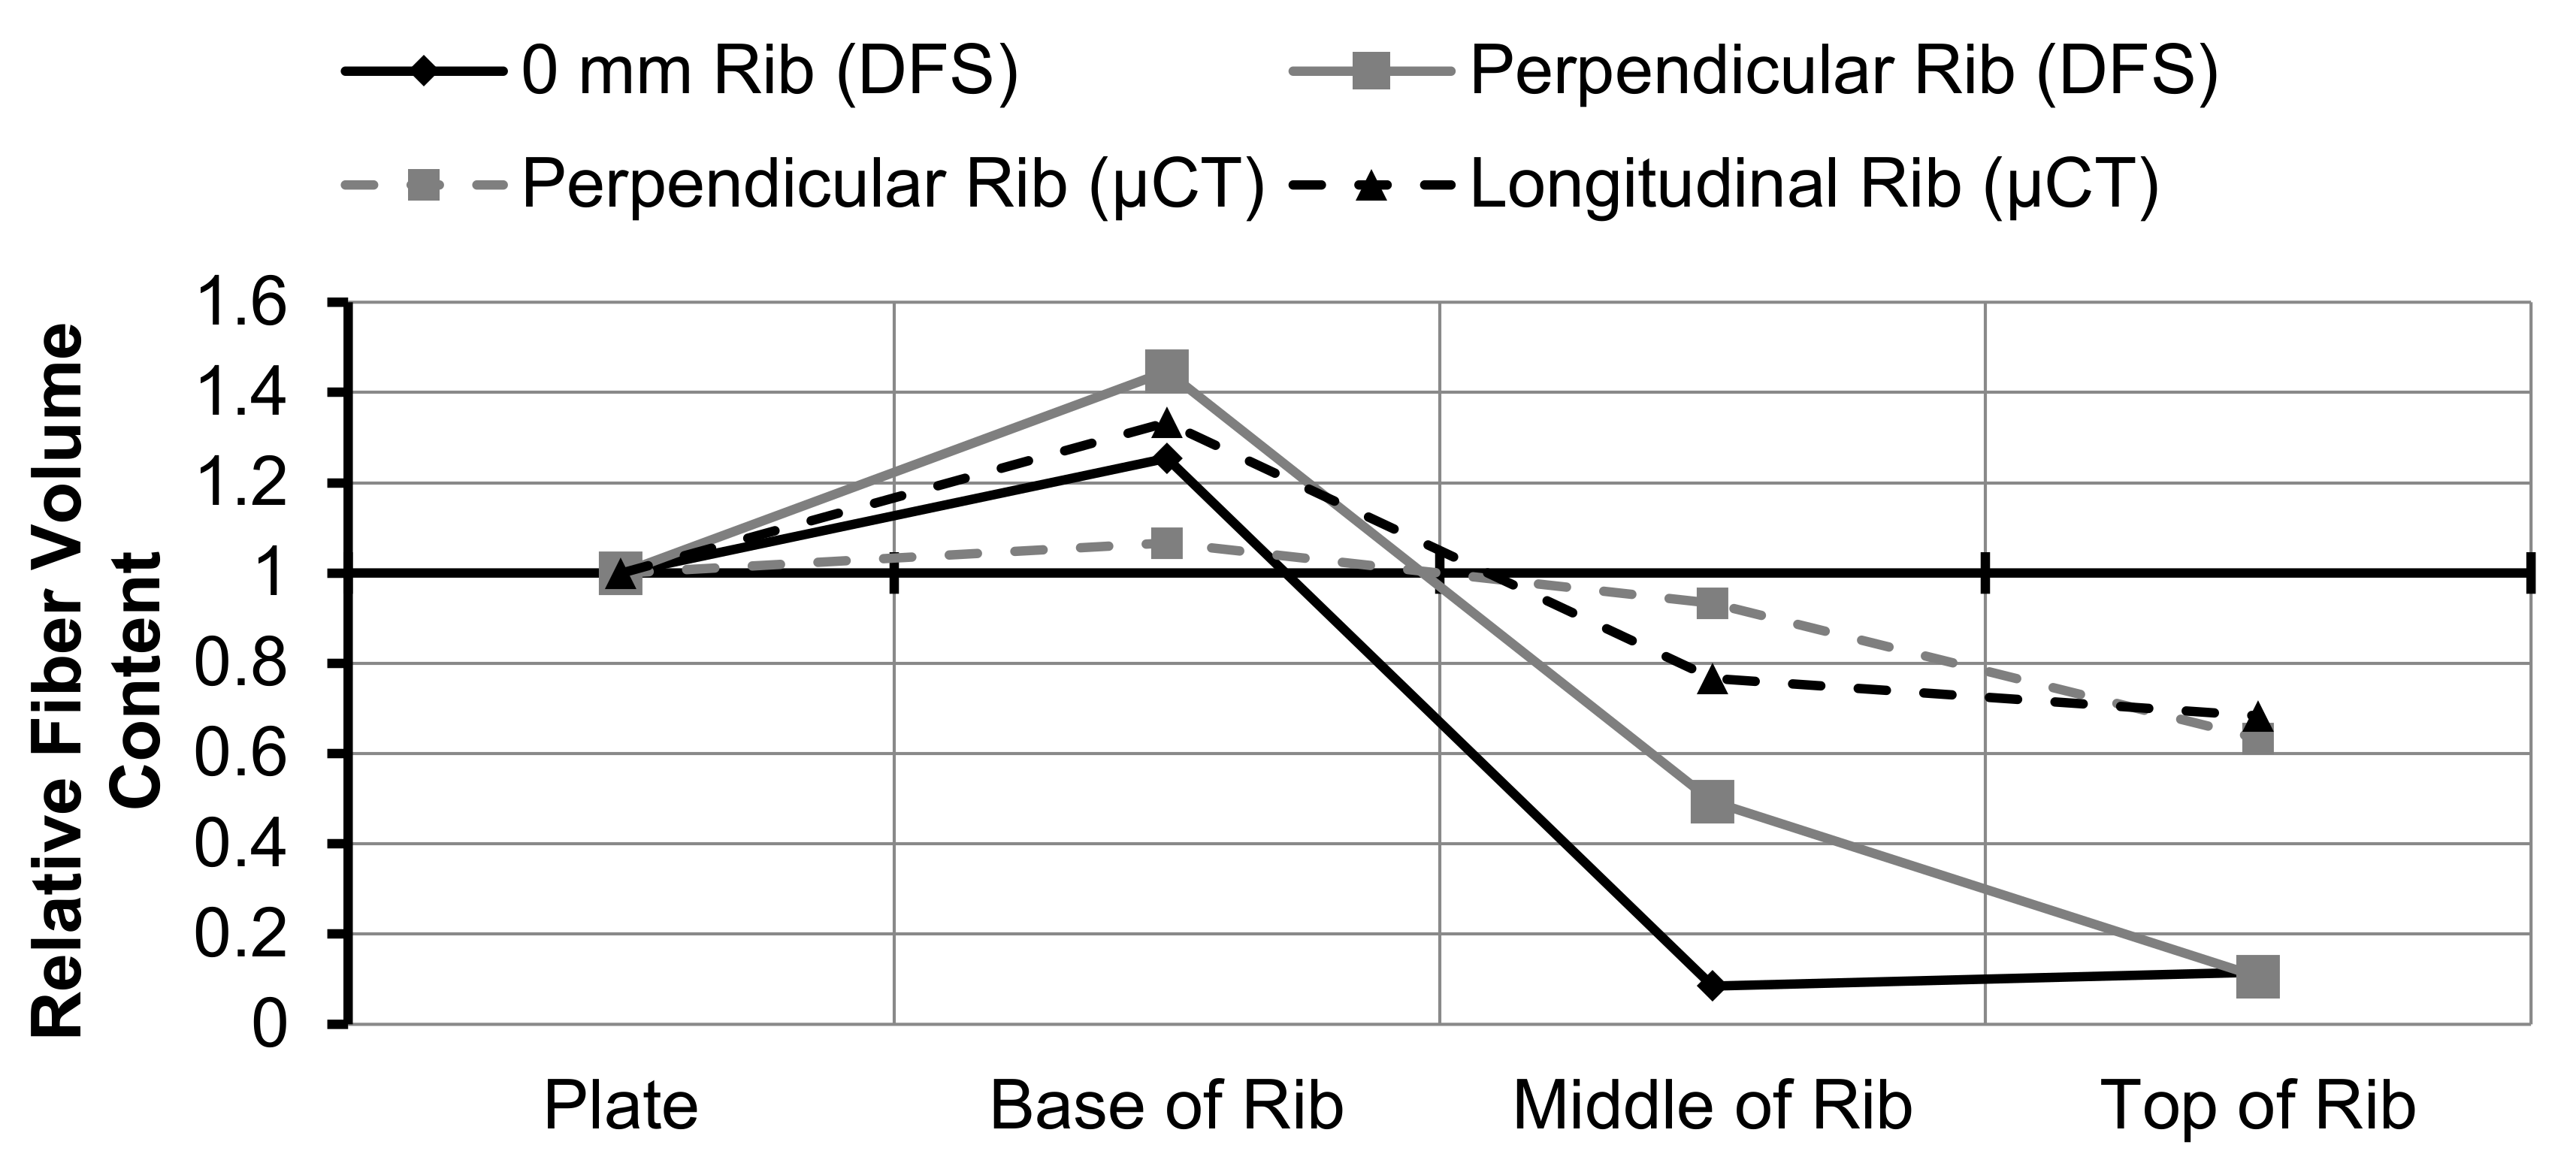
The results of the DFS were compared to fiber content values taken from micro-computed tomography scans (µCT) of compression molded samples of the star rib geometries as shown in Figure 11 [15]. As shown in Figure 16, it was found that the DFS was able to capture the general trend seen in molded parts. There is an initial increase in the fiber content from the plate to the base of the rib, followed by a decrease in the upper portions of the rib. The DFS generally shows a more drastic variation in fiber content than observed in the molded parts. For future comparisons, experimental data with the applied ribbed mold is necessary.
6. Conclusions and Outlook
Using the mechanistic model for DFS, it was found that initial fiber orientation and fiber length has the largest impact on the fiber volume fraction in ribs. Using simplified rib geometries, it was shown that decreasing the radius at the bottom of the rib has a negative impact on fiber volume fraction. Viscosity has not shown to play a large role in fiber content distributions, but it is believed that the initial fiber volume fractions used in this work are not high enough to capture the differences that have been found in other works. In general, the behavior observed in the mechanistic model generally complies with earlier experiments and shows great advantage over the predictions of traditional process simulation tools.
Future simulative work will focus on increasing fiber volume fractions, as well as investigating other parameters such as charge placement location and fiber bending stiffness and their effect on fiber volume fraction in ribs. Simulations using more complex geometry such as the star mold used for the preliminary simulations will be investigated. Analysis of other fiber effects including orientation and bending will also be performed. Regarding future experiments, the geometry presented in the simulation, the ribbed-plate, is applied to further study the fiber behavior during molding and to compare the simulative results directly.
Acknowledgments
The Volkswagen Group Research would like to thank the University of Wisconsin-Madison for their ongoing support in joint research projects.
Author Contributions
Christoph Kuhn and Ian Walter conceived and designed the experiments; Ian Walter performed the simulations; Christoph Kuhn and Ian Walter. analyzed the data and conceived further simulations; All contributed materials are provided by the Volkswagen Group Research under Olaf Taeger The Mechanistic Model is provided by the Polymer Engineering Center under Tim Osswald; Christoph Kuhn wrote the paper. All presented work was conducted at the Volkswagen Group under supervision of Christoph Kuhn.
Conflicts of Interest
The authors declare no conflict of interest.
References
- Teixeira, D.; Giovanela, M.; Gonella, L.; Crespo, J. Influence of flow restriction on the microstructure and mechanical properties of long glass fiber-reinforced polyamide 6.6 composites. Mater. Des. 2015, 85, 695–706. [Google Scholar]
- Stauber, R.; Vollrath, L. Plastics in Automotive Engineering; Carl Hanser Verlag: Munich, Germany, 2007. [Google Scholar]
- Osswald, T.; Menges, G. Material Science of Polymers for Engineers; Carl Hanser Verlag: Munich, Germany, 2012. [Google Scholar]
- Davis, B.; Gramann, P.T.O.; Rios, A. Compression Molding; Carl Hanser Verlag: Munich, Germany, 2003. [Google Scholar]
- Wang, J.; O’gara, J.; Tucker, C. An Objective model for slowing orientation kinetics in concentrated fiber suspensions: Theory and rheological evidence. J. Rheol. 2008, 52, 1179–1200. [Google Scholar] [CrossRef]
- Folgar, F.; Tucker, C. Orientation behavior of fibers in concentrated suspensions. J. Reinf. Plast. Compos. 1984, 3, 98–119. [Google Scholar] [CrossRef]
- Phelps, J.; Tucker, C. An anisotropic rotary diffusion model for fiber orientation in short and long-fibre thrmoplastics. J. Non-Newton. Fluid Mech. 2009, 156, 165–176. [Google Scholar] [CrossRef]
- Londoño-Hurtado, A. A Mechanistic Model for Fiber Flow; University of Wisconsin-Madison: Madison, WI, USA, 2009. [Google Scholar]
- Goris, S.; Osswald, T.A. Process-Induced Fiber Matrix Separation in Long Fiber-Reinforced Thermoplastics. Compos Part A Appl. Sci. Manuf. 2018, 105, 321–333. [Google Scholar] [CrossRef]
- Londoño, A.; Osswald, T.A. Fiber Jamming and Fiber Matrix Separation during Compression Molding. J. Plast. Technol. 2006, 15, 109. [Google Scholar]
- Jeffery, G.B. The Motion of Ellipsoidal Particles Immersed in a Viscous Fluid. R. Soc. 1922, 102, 161–179. [Google Scholar] [CrossRef]
- Thomason, J.; Vlug, M. Influence of fibre length and concentration on the properties of glass fibre-reinforced polypropylene: 1. Tensile and flexural modulus. Compos. Part A Appl. Sci. Manuf. 1996, 27, 419–503. [Google Scholar]
- Pèrez, C. The Use of a Direct Particle Simulation to Predict Fiber Motion in Polymer Processing; University of Wisconsin-Madison: Madison, WI, USA, 2016. [Google Scholar]
- Ramìrez, D. Study of Fiber Motion in Molding Processes by Means of a Mechanistic Model; University of Wisconsin-Madison: Madison, WI, USA, 2014. [Google Scholar]
- Kuhn, C.; Walter, I.; Taeger, O.; Osswald, T. Experimental and Numerical Analysis of Fiber Matrix Separation During Compression Molding of Reinforced Thermoplastics. J. Compos. Sci. 2017, 1, 2. [Google Scholar] [CrossRef]
- Pèrez, C.; Ramìrez, D.; Osswald, T. Mechanistic model simulation of a compression molding process: Fiber orientation and fiber-matrix separation. In Proceedings of the Technical Conference & Exhibition, Orlando, FL, USA, 23–25 March 2015. [Google Scholar]
- Lindstroem, S.; Uesaka, T. Simulation of the motion of flexible fibers in viscous fluid flow. Phys. Fluids 2007, 19, 113307. [Google Scholar] [CrossRef]
- Schmid, C.; Switzer, L.; Klingenberg, D. Simulations of fiber flocculation: Effects of fiber properties and interfiber friction. J. Rheol. 2000, 44, 781–809. [Google Scholar] [CrossRef]
Figure 1.
Simplified ribbed plate geometry.

Figure 2.
Depiction of forces and interactions calculated by direct fiber simulation.

Figure 3.
Fiber movement during compression molding simulations with the ribbed plate at consecutive time steps 1–4.
Figure 3.
Fiber movement during compression molding simulations with the ribbed plate at consecutive time steps 1–4.
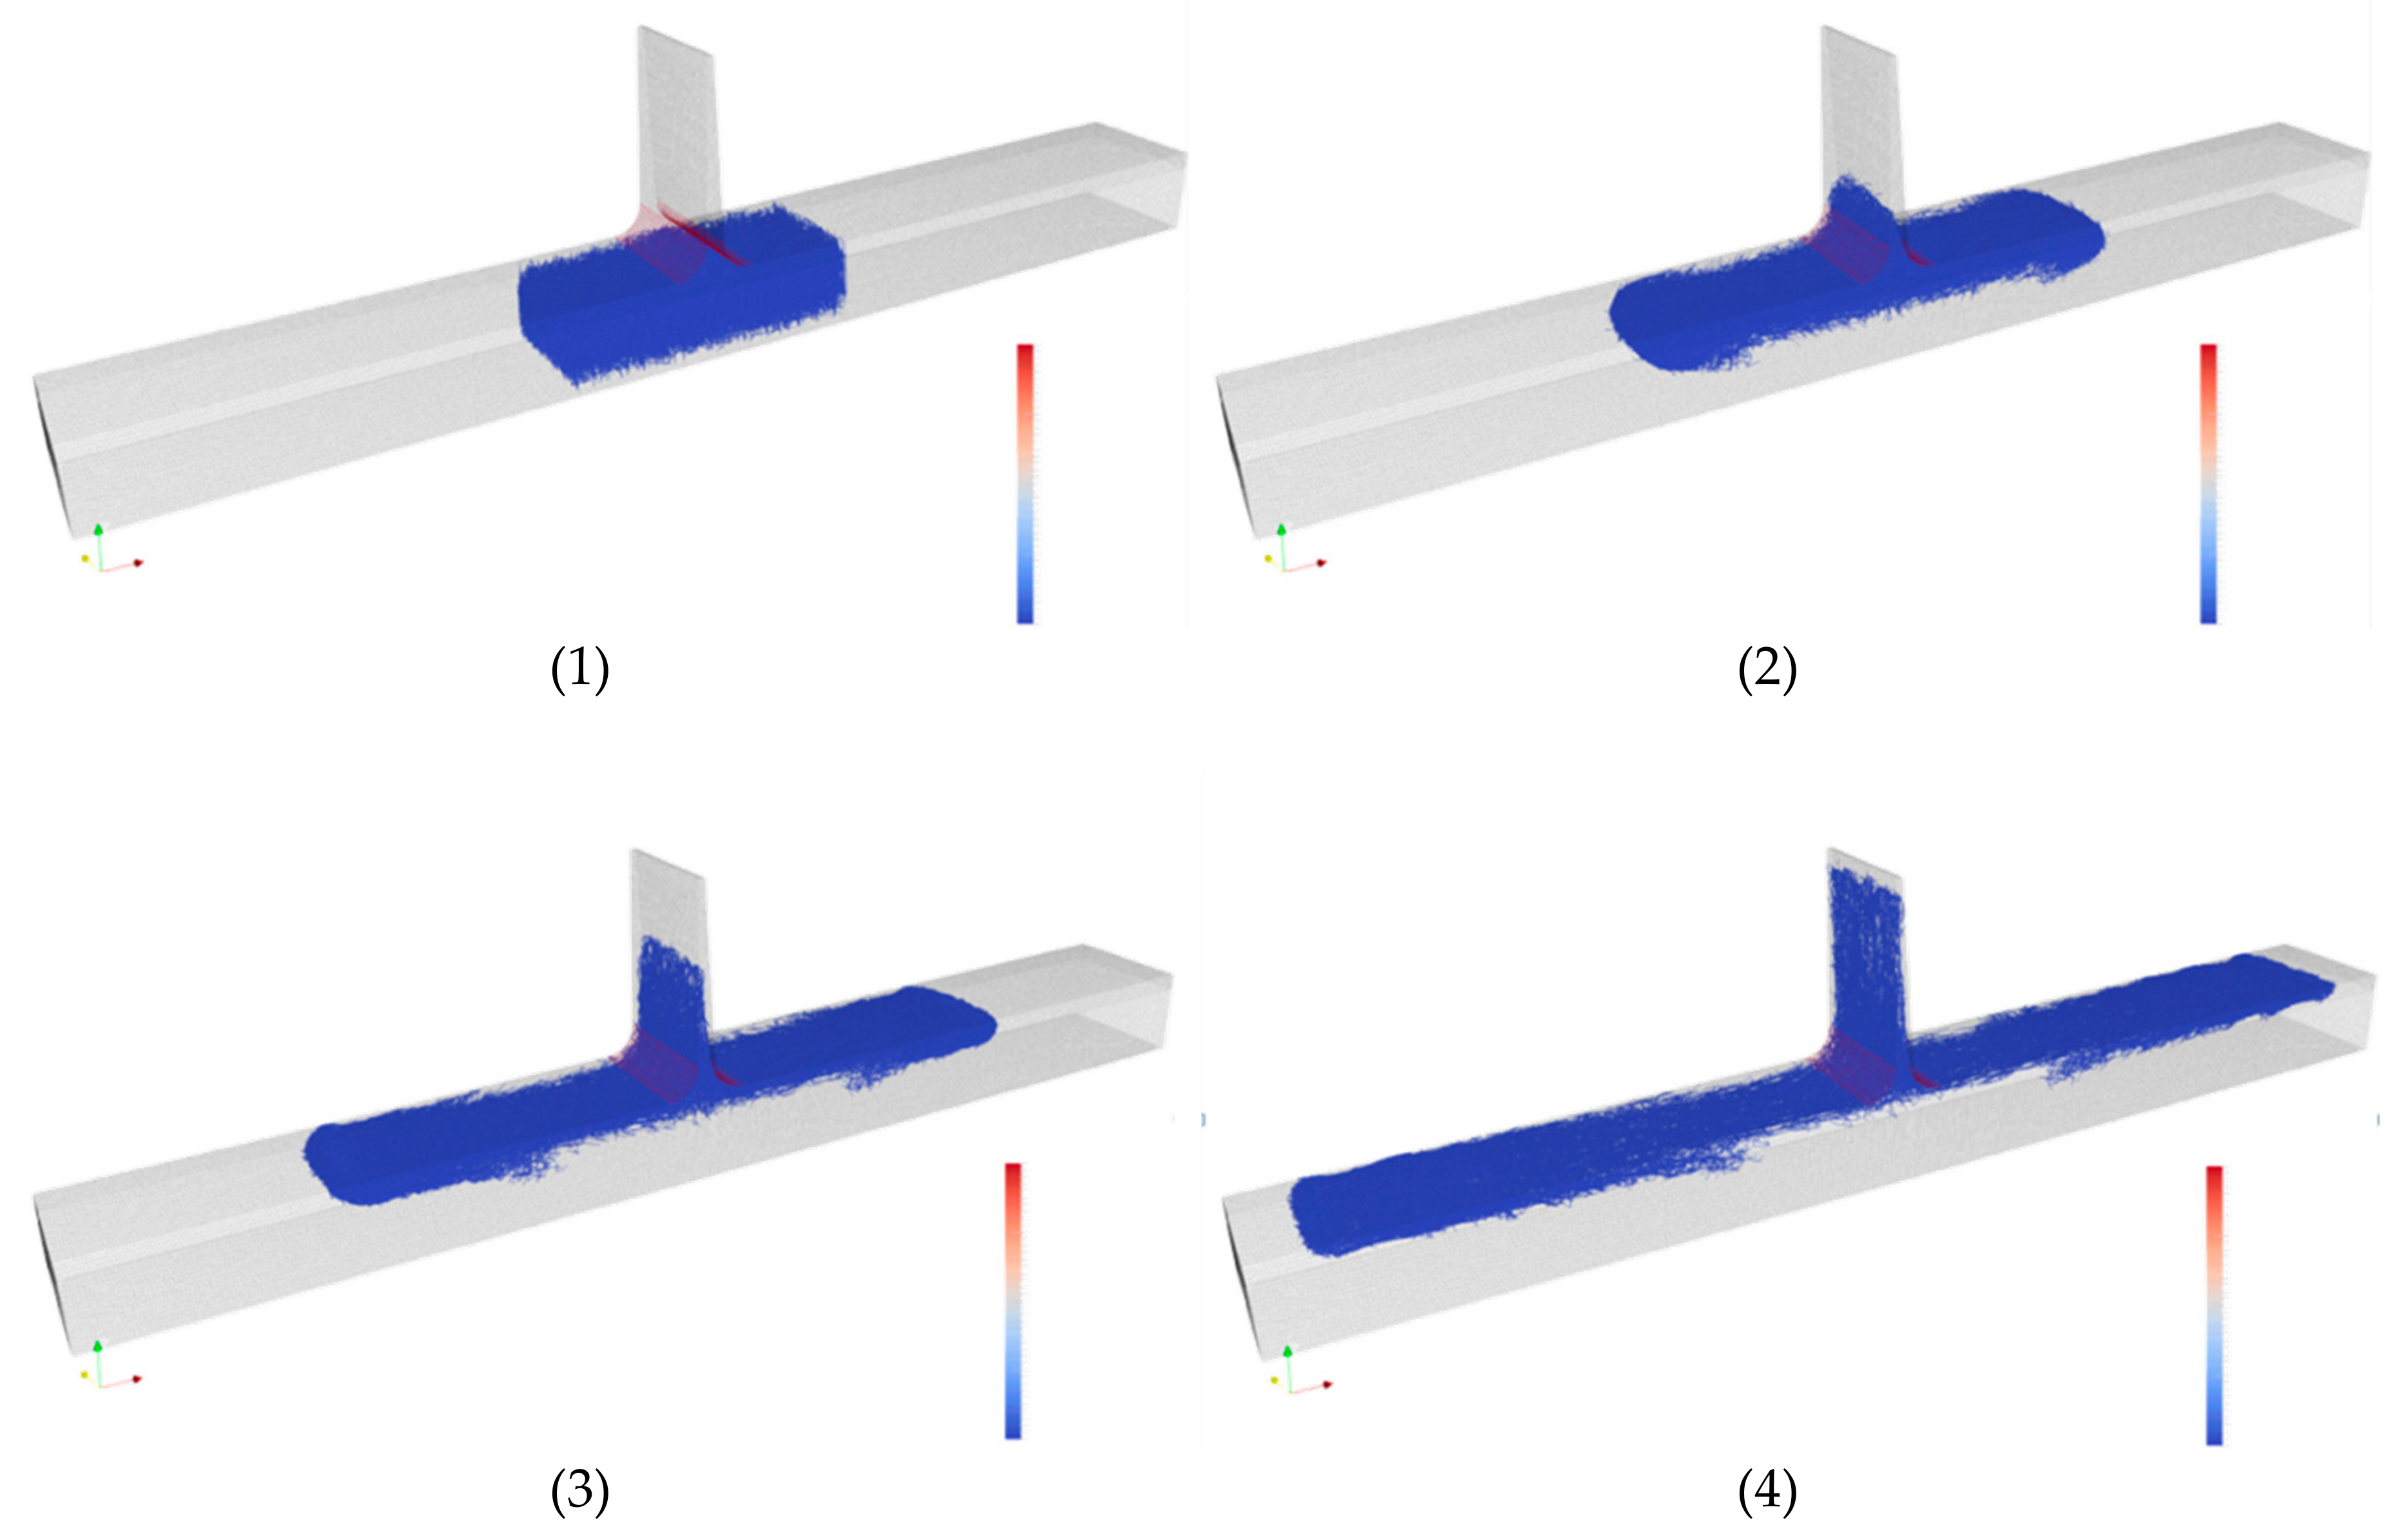
Figure 4.
The circled frozen fiber in the center can be seen to stop other fibers from flowing past it.
Figure 4.
The circled frozen fiber in the center can be seen to stop other fibers from flowing past it.

Figure 5.
Increased boundary conditions shown in red. Note: Fiber radius is shown as larger for illustration purposes.
Figure 5.
Increased boundary conditions shown in red. Note: Fiber radius is shown as larger for illustration purposes.

Figure 6.
Cross section of rib. Width (into page) was adjusted based on fiber length. The striped sections show charge placement.
Figure 6.
Cross section of rib. Width (into page) was adjusted based on fiber length. The striped sections show charge placement.
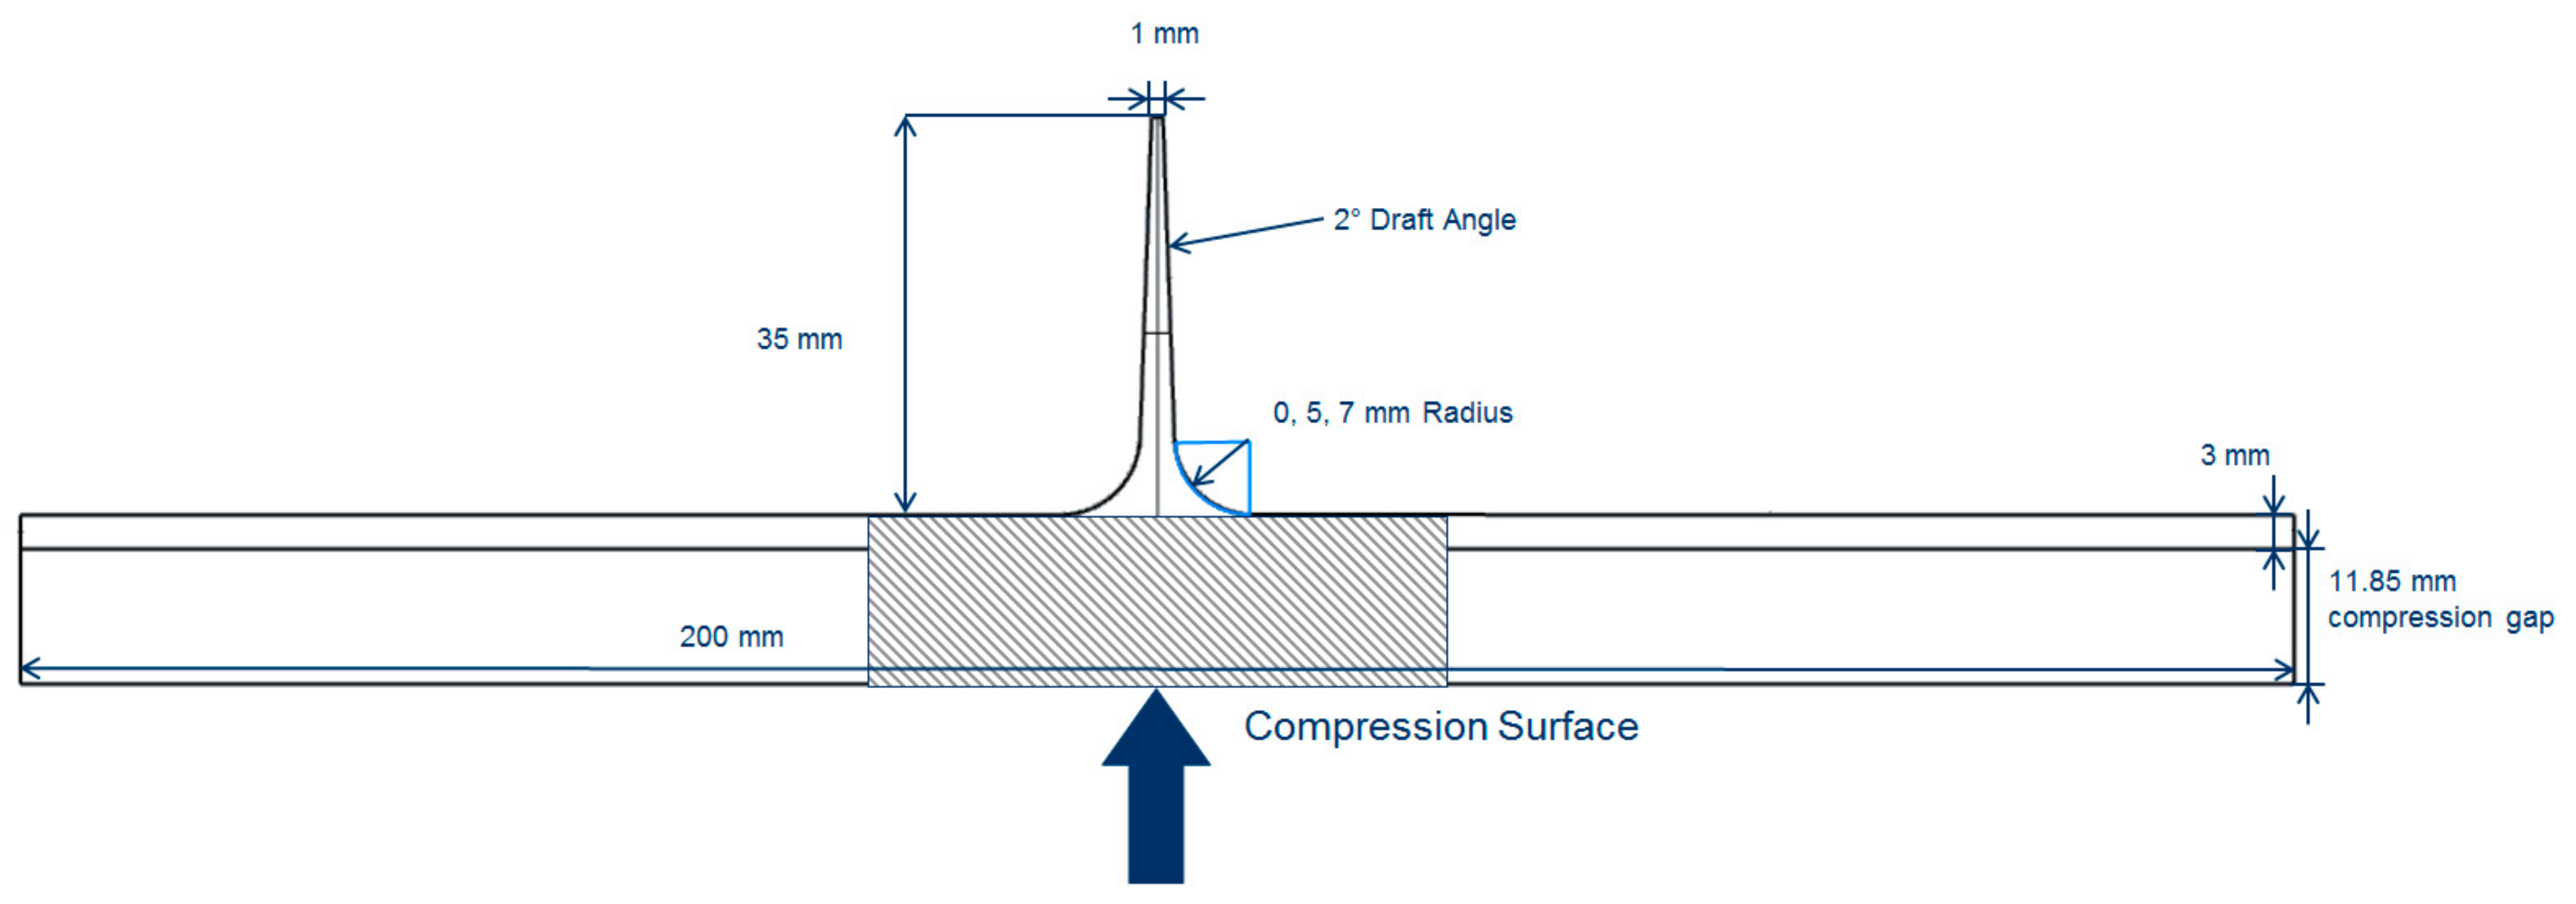
Figure 7.
Average effect of each variable on volume fraction at top of rib.

Figure 8.
Ten-millimeter fibers’ random orientation (left) vs. 20 mm fibers with cross rib orientation (right) after filling completed. Fiber diameter is exaggerated for visibility purposes.
Figure 8.
Ten-millimeter fibers’ random orientation (left) vs. 20 mm fibers with cross rib orientation (right) after filling completed. Fiber diameter is exaggerated for visibility purposes.

Figure 9.
Average effect on volume fraction in middle section of rib.
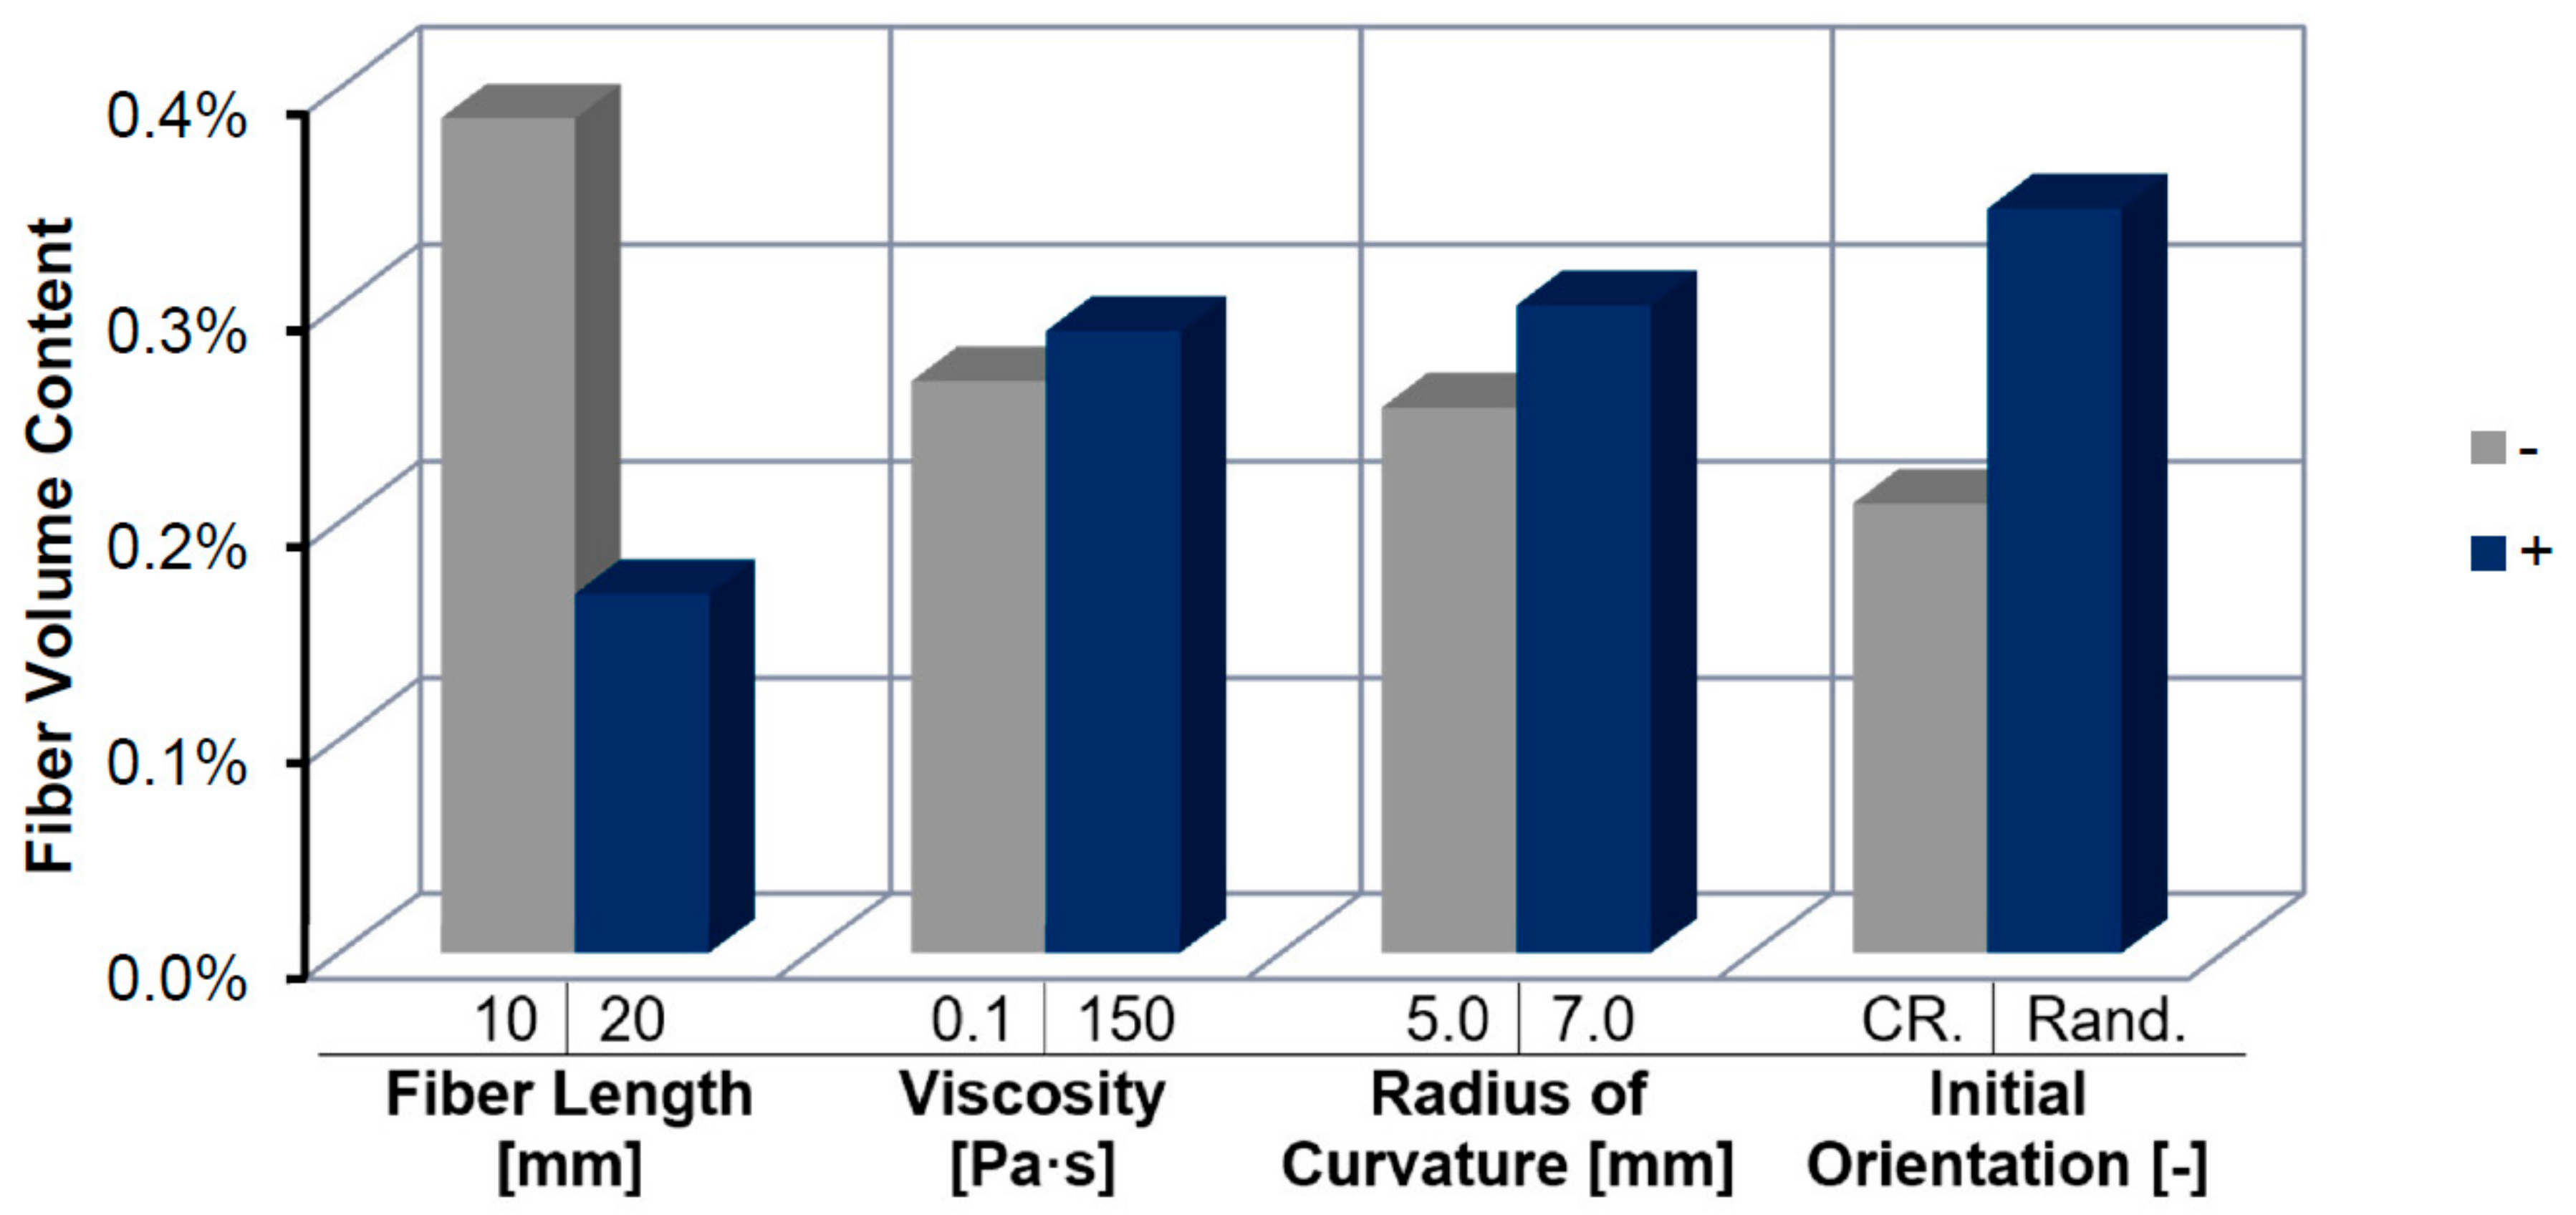
Figure 10.
Average effect on volume fraction in bottom section of rib.

Figure 11.
Examples of fiber bridging seen in real parts (left, circles) and in the direct fiber simulation (DFS) (right).
Figure 11.
Examples of fiber bridging seen in real parts (left, circles) and in the direct fiber simulation (DFS) (right).
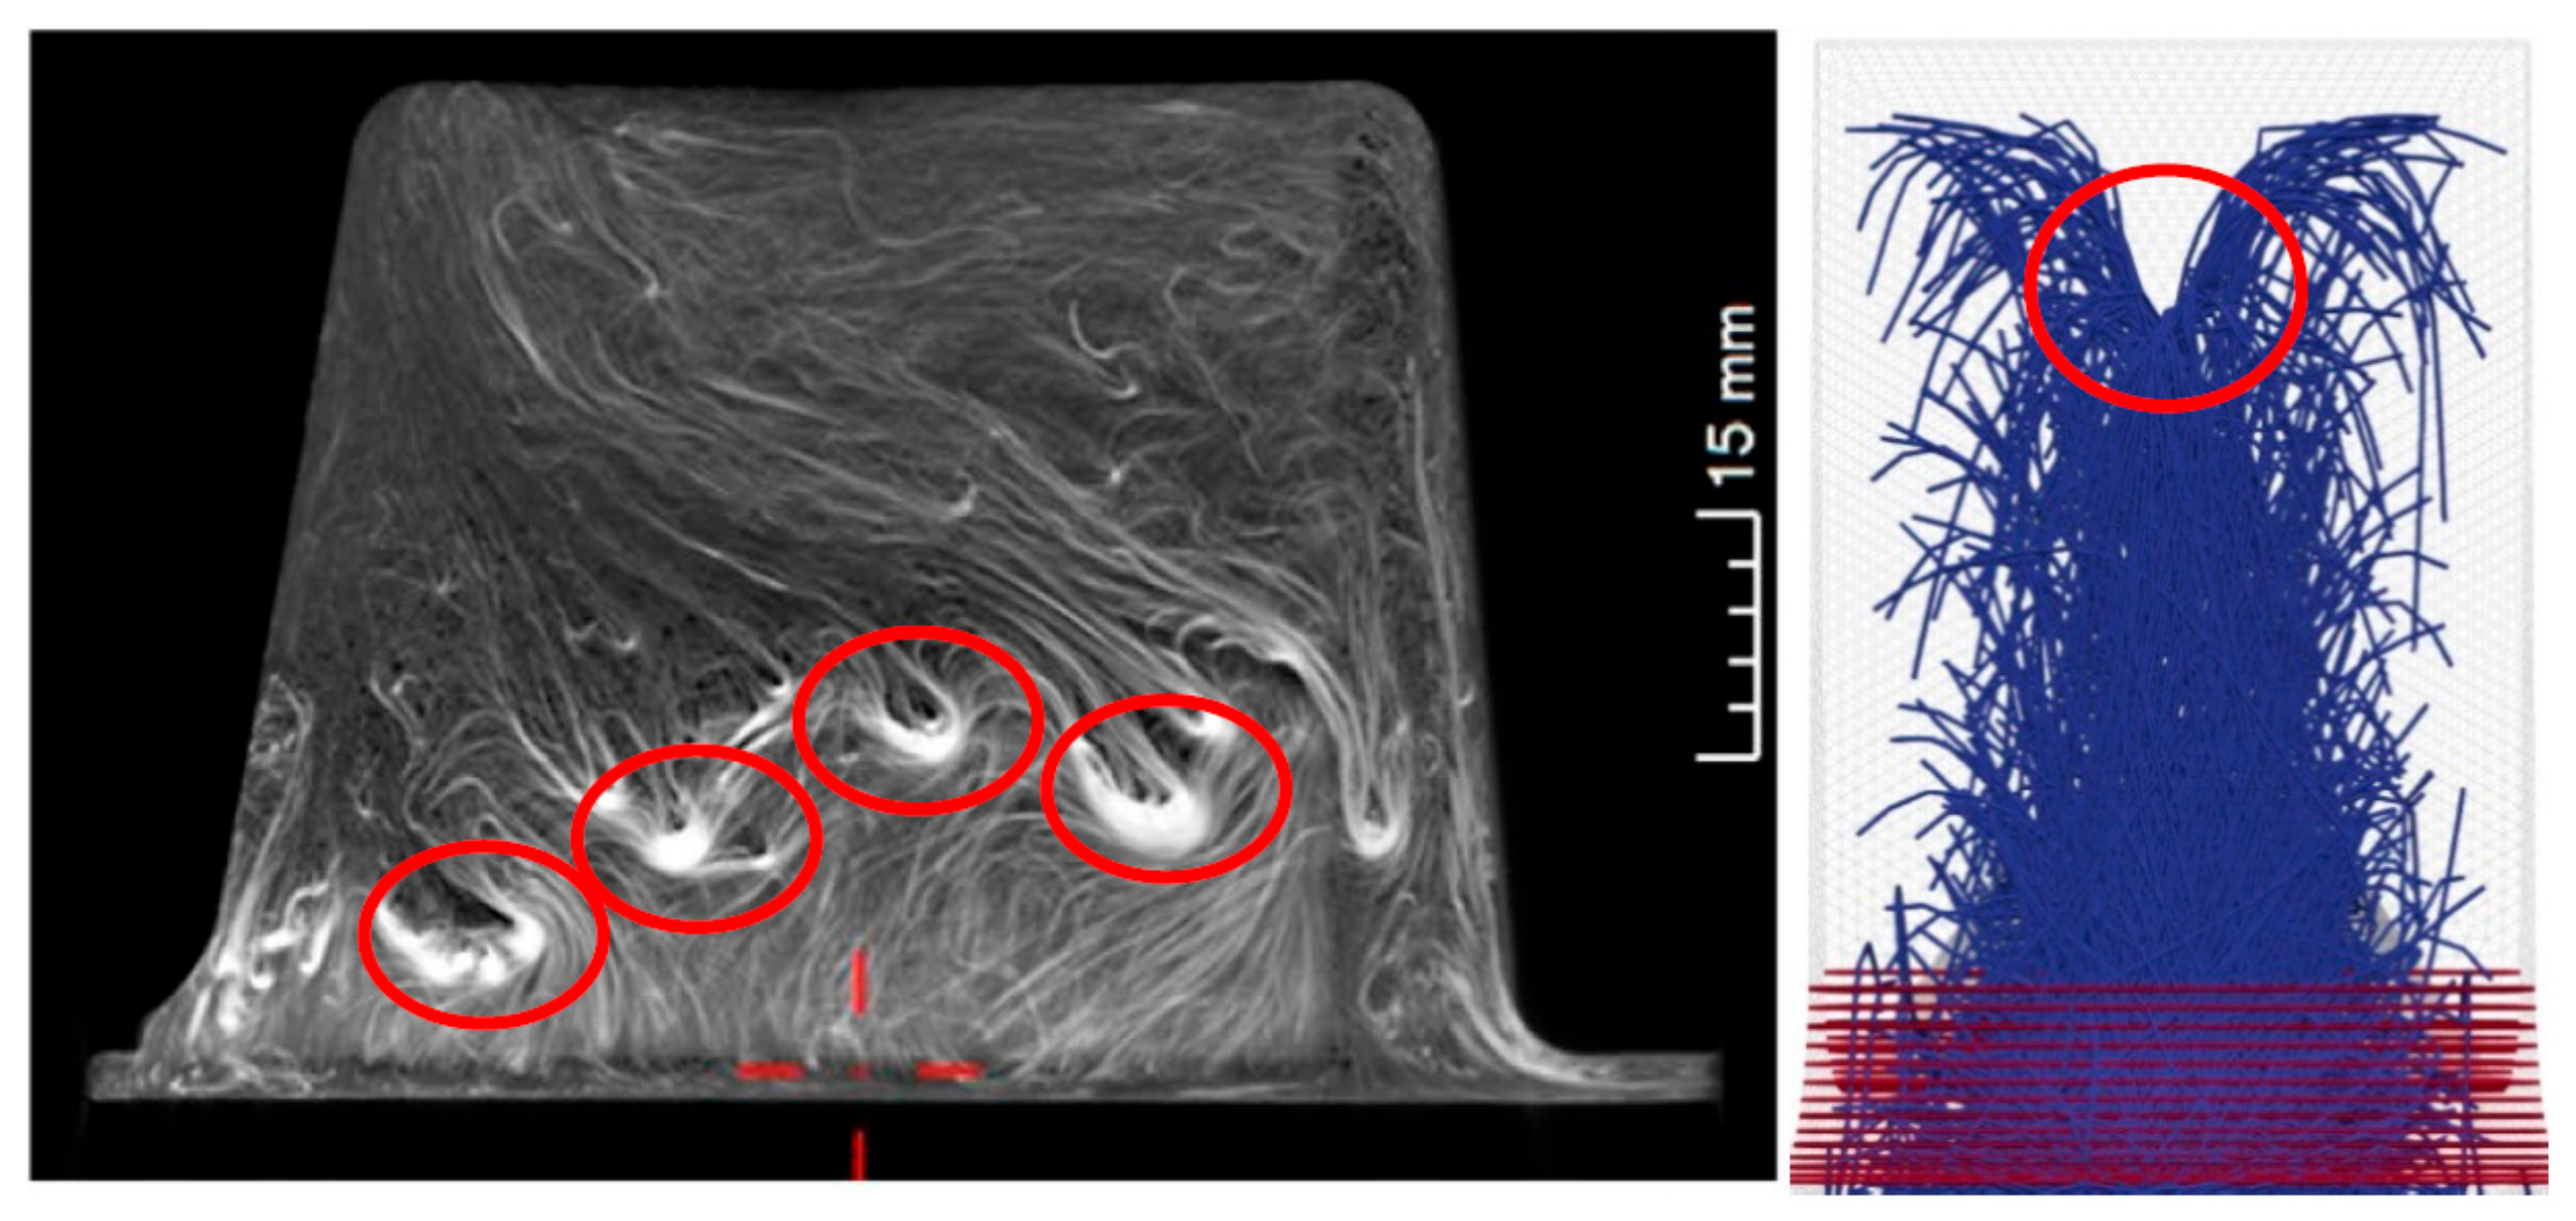
Figure 12.
Fiber volume fraction throughout rib for different fiber lengths. All simulations used a center charge, random initial fiber orientation and a rib entrance radius of 7 mm.
Figure 12.
Fiber volume fraction throughout rib for different fiber lengths. All simulations used a center charge, random initial fiber orientation and a rib entrance radius of 7 mm.

Figure 13.
Fiber volume fraction throughout the rib for different initial fiber orientations. All simulations used a center charge with 20 mm fibers and a rib entrance radius of 5 mm.
Figure 13.
Fiber volume fraction throughout the rib for different initial fiber orientations. All simulations used a center charge with 20 mm fibers and a rib entrance radius of 5 mm.

Figure 14.
Volume fraction throughout rib for different rib entrance radii. All simulations used a center charge with 20 mm fibers and a random orientation.
Figure 14.
Volume fraction throughout rib for different rib entrance radii. All simulations used a center charge with 20 mm fibers and a random orientation.
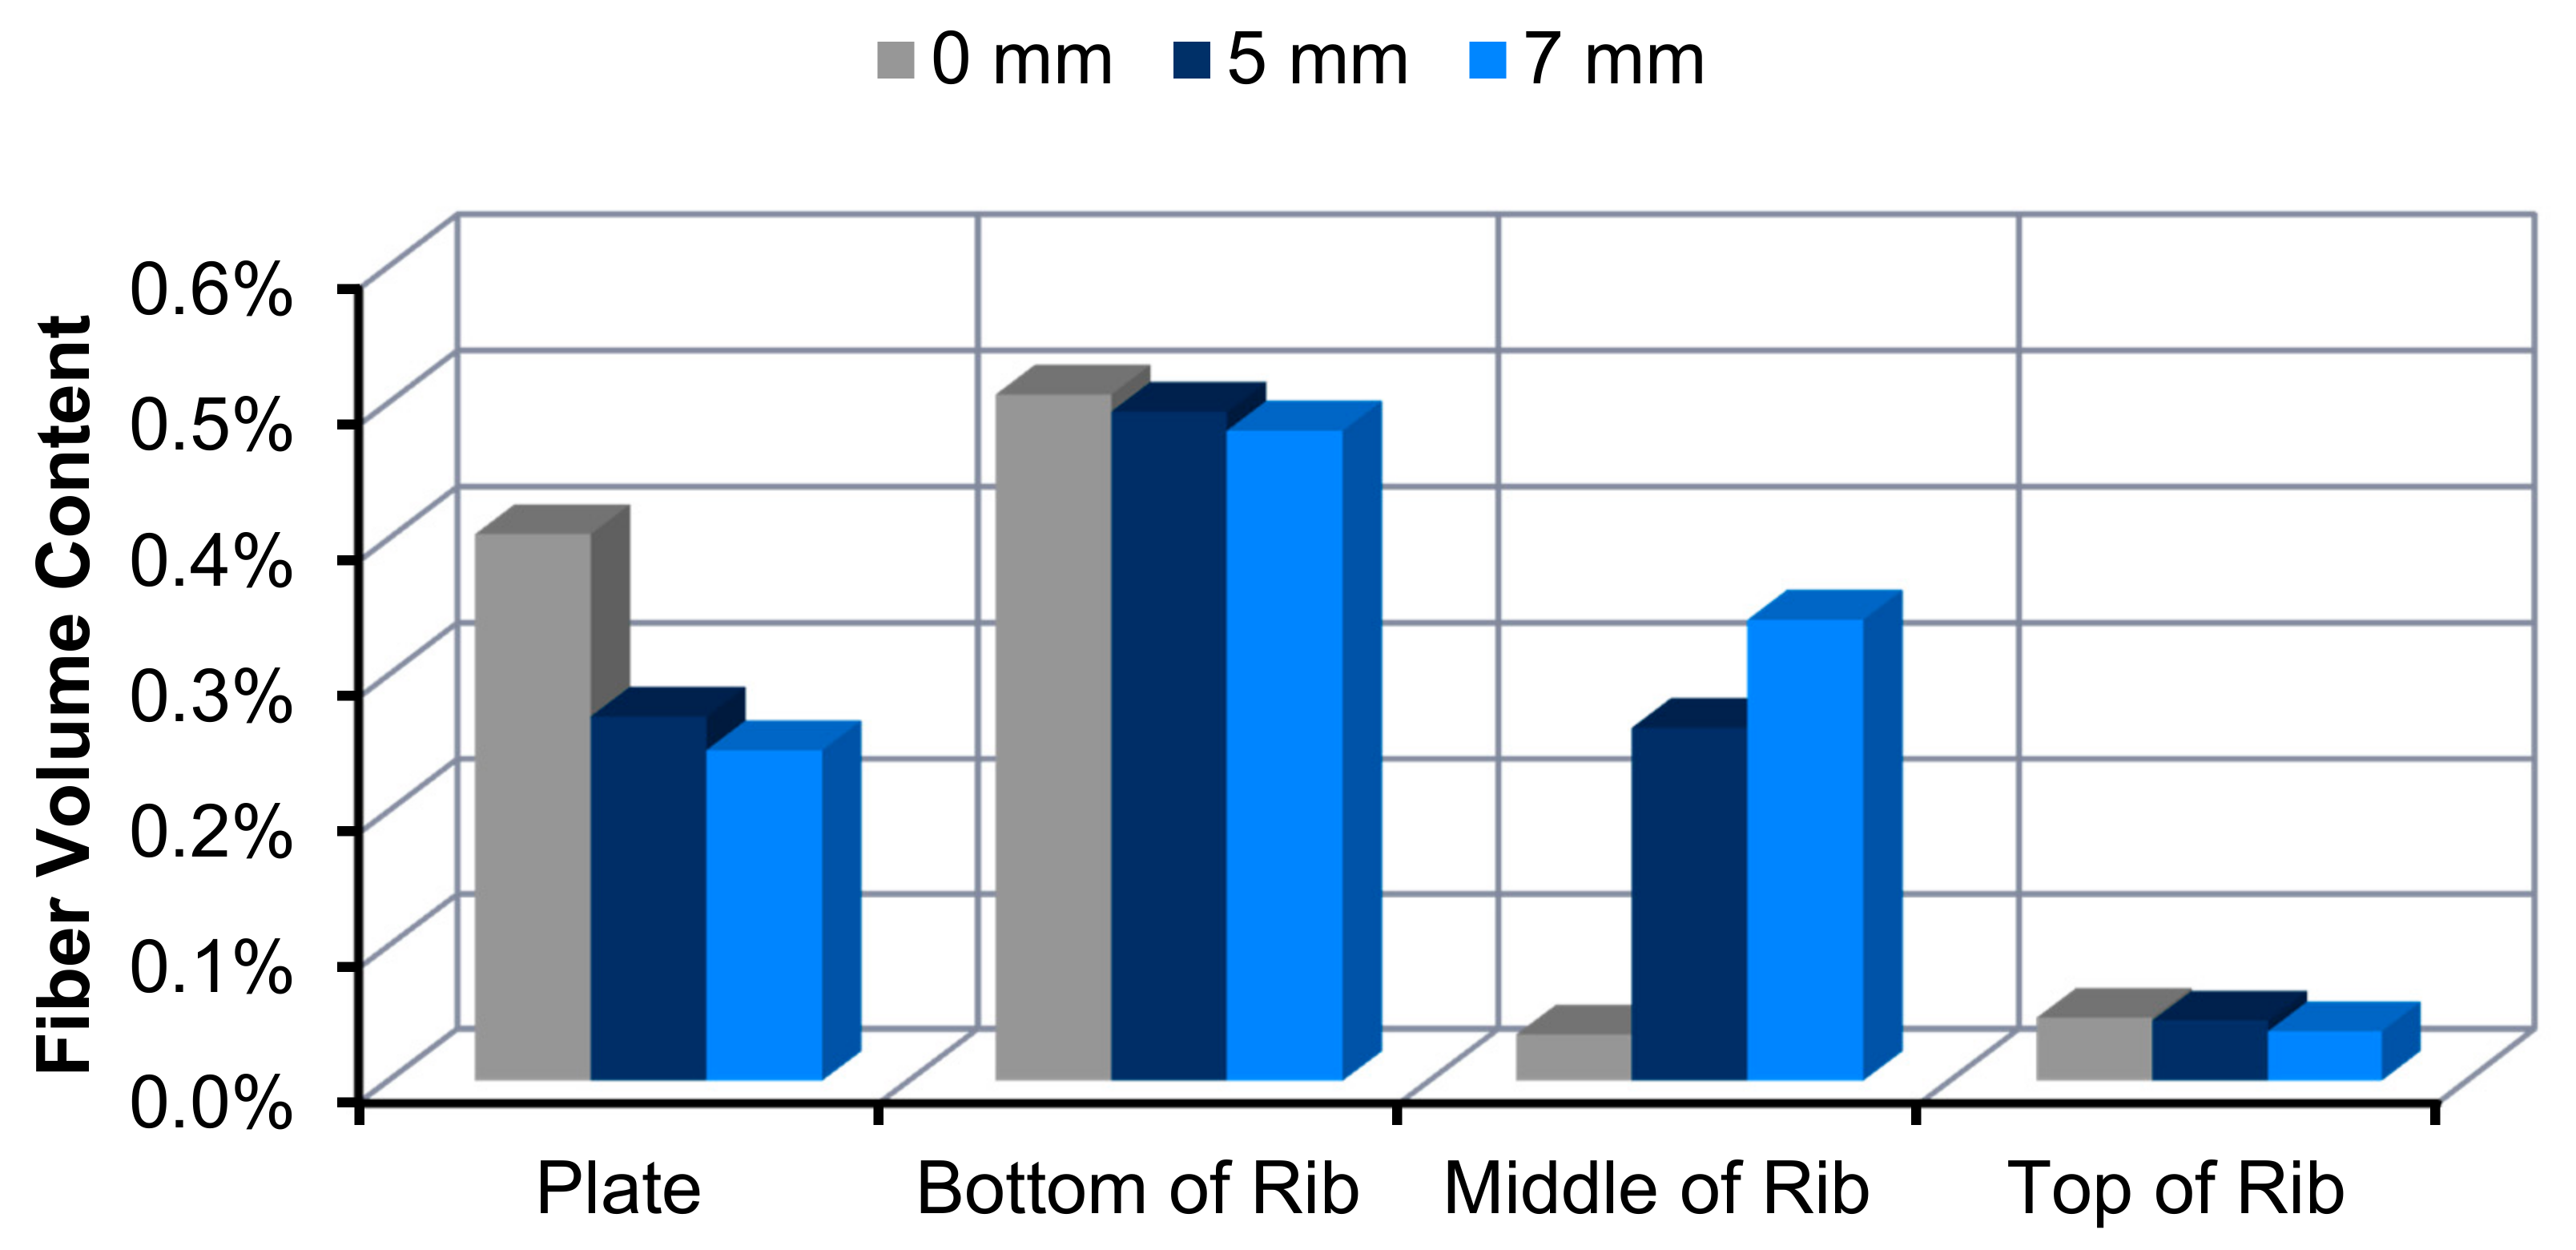
Figure 15.
Influence of polymer viscosity on fiber content distribution inside the rib.

Figure 16.
Comparison between fiber volume content taken from molded parts [15], and predicted values from the direct fiber simulation. Measured values are shown with dashed lines and simulation results with solid.
Figure 16.
Comparison between fiber volume content taken from molded parts [15], and predicted values from the direct fiber simulation. Measured values are shown with dashed lines and simulation results with solid.


Table 1.
Variables for initial design of experiments (DOE).
| Parameter | − | + |
|---|---|---|
| Fiber Length (mm) | 10 | 20 |
| Rib Radius (mm) | 5 | 7 |
| Viscosity (Pa∙s) | 0.1 | 150 |
| Initial Orientation (-) | Cross Rib (CR.) | Random (Rand.) |
| Fiber Diameter (m) | 1.9 × 10⁻⁵ | |
| Fiber Young’s Modulus (MPa) | 70 | |
| Initial Fiber Content in Charge (vol %) | 0.5 | |
© 2017 by the authors. Licensee MDPI, Basel, Switzerland. This article is an open access article distributed under the terms and conditions of the Creative Commons Attribution (CC BY) license (http://creativecommons.org/licenses/by/4.0/).
Share and Cite
MDPI and ACS Style
Kuhn, C.; Walter, I.; Täger, O.; Osswald, T. Simulative Prediction of Fiber-Matrix Separation in Rib Filling During Compression Molding Using a Direct Fiber Simulation. J. Compos. Sci. 2018, 2, 2. https://doi.org/10.3390/jcs2010002
AMA Style
Kuhn C, Walter I, Täger O, Osswald T. Simulative Prediction of Fiber-Matrix Separation in Rib Filling During Compression Molding Using a Direct Fiber Simulation. Journal of Composites Science. 2018; 2(1):2. https://doi.org/10.3390/jcs2010002
Chicago/Turabian StyleKuhn, Christoph, Ian Walter, Olaf Täger, and Tim Osswald. 2018. "Simulative Prediction of Fiber-Matrix Separation in Rib Filling During Compression Molding Using a Direct Fiber Simulation" Journal of Composites Science 2, no. 1: 2. https://doi.org/10.3390/jcs2010002