Machinability, Modelling and Statistical Analysis of In-Situ Al–Si–TiB2 Composites


Department of Mechanical & Industrial Engineering, Indian Institute of Technology, Roorkee 247667, India
*
Author to whom correspondence should be addressed.
J. Compos. Sci. 2019, 3(1), 28; https://doi.org/10.3390/jcs3010028
Submission received: 29 November 2018
/
Revised: 19 February 2019
/
Accepted: 15 March 2019
/
Published: 21 March 2019
(This article belongs to the Special Issue Selected Papers from the 11th Asian-Australasian Conference on Composite Materials)
Abstract
:Aluminum and its alloys have numerous applications in manufacturing, aerospace, and automotive industries. At elevated temperatures, they start to fail in fulfilling their roles and functions. Aluminum-based metal matrix composites (MMCs) are good alternatives for metal and alloys due to their excellent properties. However, the conventional machining of several composites shows complications for a number of reasons, such as high tool wear, poor surface roughness, high machining cost, cutting forces, etc. Numerous studies have already been conducted on the machinability of various MMCs, but the machinability of Al–Si–TiB2 composite is still not well studied. It is of utmost importance that several process parameters of conventional machining are precisely controlled as well as optimized. In this study an effort was made to optimize input parameters such as cutting speed, depth of cut, and feed to obtain well-finished final components with the minimum cutting force and tool wear. These progressions are involved with multiple response characteristics, therefore the exploration of an appropriate multi-objective optimization technique was indeed essential. The performance characteristics of cutting forces and surface roughness were considered for optimization of the machining parameters. Analysis of variance (ANOVA) was employed for the optimization and statistical analysis.
1. Introduction
The demand for aluminum–silicon alloy-based composites is rapidly increasing in automobile and aerospace sectors. Their high strength-to-weight ratio and their capacity to operate effectively under adverse conditions—particularly at high temperatures—brands them as potential materials for use in diesel engine and aircraft engine applications [1]. These materials help to achieve a weight reduction of twenty-five percent, and the density of most metal matrix composites (MMCs) is almost one third in comparison to steel [2]. However, the emerging trend in the machining of these materials has given a real challenge. Carbide tools with hard coatings like TiC, TiN, Al2O3, etc. have already substantiated their domination in the machining of steels in dry conditions, even at high cutting speeds. From past machining studies conducted on Al–SiC composites, it was observed that tool wear was extreme, and the surface finish was poor with carbide tool inserts. It was later ruled out that the hard SiC particles collaboratively work as cutting edges, in the same manner as a grinding wheel over the cutting tool edge, which in due course was worn out due to abrasive action and hence resulting in the creation of poor surface finish [3]. The durability of the cutting tools is one of the major indicators of the efficiency of a machining process, as the overall cost of the machining majorly depends on the life cycle and cost of cutting tools [4]. While in another observation, polycrystalline diamond (PCD) insert performance was found to be pointedly much better than the carbide tool inserts during the turning of Al/5%Mg alloys reinforced with 5 wt.% saffil and 15 wt.% SiCp [5,6]. Most of the studies widely report on tool wear performance during the machining of MMCs based on Al–SiC or Al2O3 processed using conventional casting methods. Recent machinability studies on in-situ Al–6061–TiB2 composites have confirmed an increase in the flank wear rate, cutting force, and surface roughness with the increase in the depth of cut [7,8,9]. Studies have also been conducted on the optimization of output parameters like surface roughness and cutting force for turning operation of AlB2/Al–Mg3 MMCs. A statistical method was employed for optimizing the process parameters. For experimentation purposes, a smaller is the better condition with an orthogonal array technique was employed for obtaining optimum responses. Analysis of variance (ANOVA) was employed to rule out the process parameters that most affected surface roughness and cutting force. Validation tests were conducted to check the effectiveness using optimized levels of parameters by the Taguchi method [10]. The machinability behavior of an Al–Cu–TiC metal matrix composite has also been studied experimentally under varying process parameters with optimization studies with full factorial matrix design which used the Taguchi method on output parameters such as surface roughness and cutting force [9,10,11,12]. The aforesaid literature analysis revealed that the machining process characteristics of ex-situ processed composites have been significantly addressed. However, there were inadequate research findings testifying the machining process characteristics of in-situ-processed Al–Si–TiB2 metal matrix composites. The purpose of the present study was to study the effect of machining parameters on the machining process and the characteristics of in-situ synthesized Al–12%Si/6wt.%TiB2 composites through a dry turning process using uncoated carbide tools. The depth of cut, cutting speeds, and feed were used as the control factors, and cutting forces (Fy and Fz), surface roughness, and chip formation were the output measures.
2. Materials and Methods
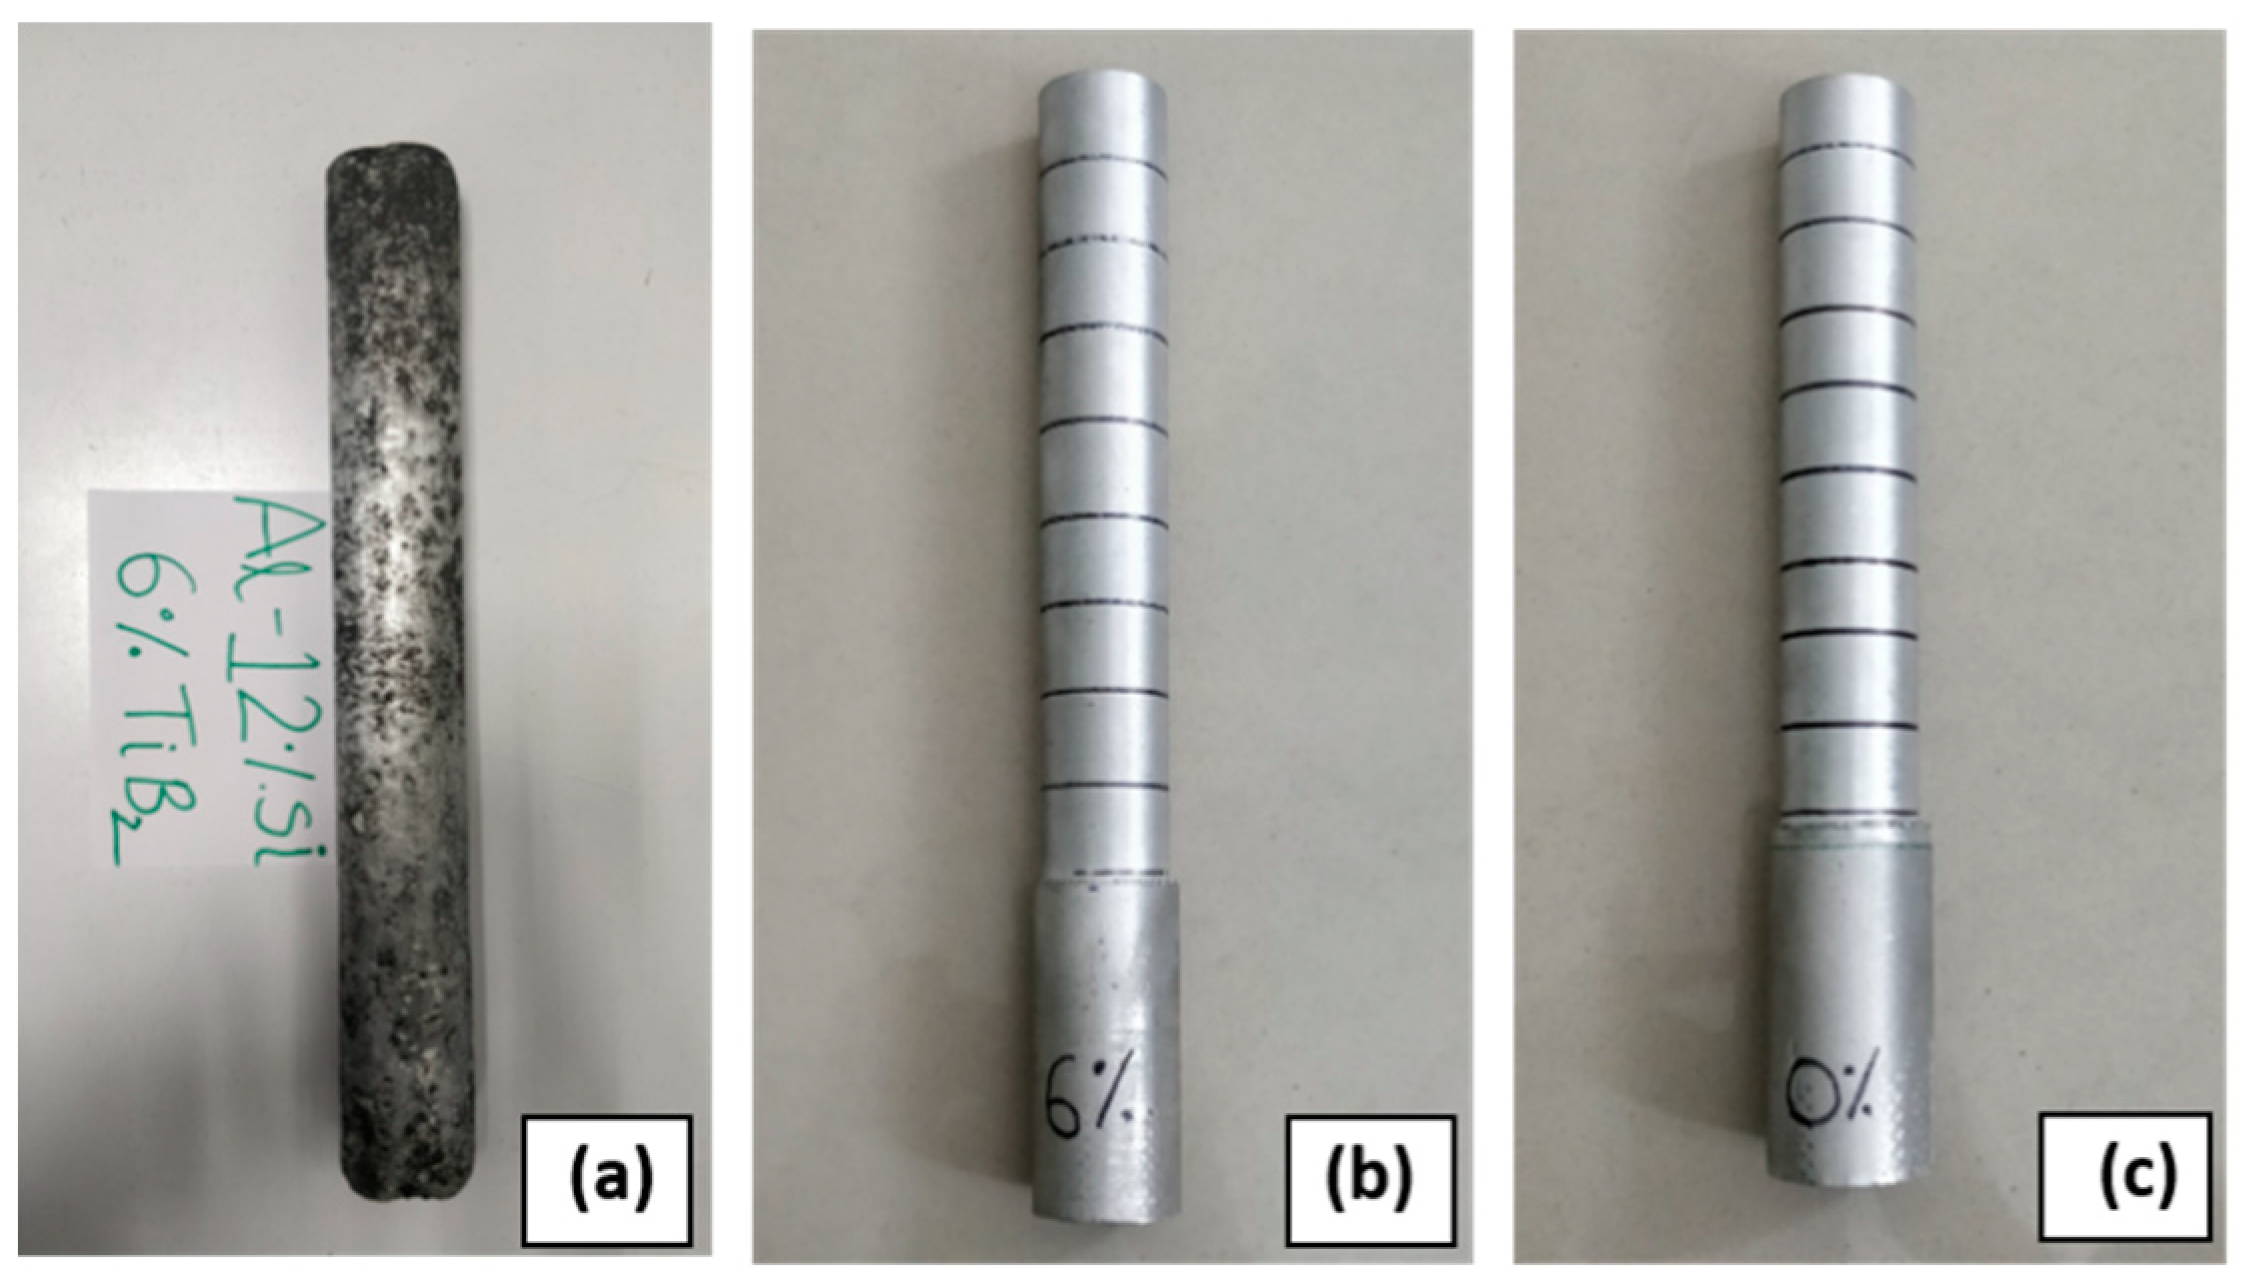
The Al–12%Si/6wt.%TiB2 in-situ MMCs were fabricated using a stir casting technique. Formation of the TiB2 particles phase was precipitated in situ due to an exothermic salt reaction between K2TiF6 and KBF4. This method of producing an in-situ reinforcement phase through chemical reactions between salts is known as a mixed salt route process. The requisite amounts of K2TiF6 and KBF4 salts are vital for obtaining the required weight fraction of TiB2. To promote the adequate reaction between salts and matrix melt, a temperature of 800 °C was maintained in an electrically operated muffle furnace. Degassing was conducted with C2Cl6 tablets for removing unwanted gases. The salt mixture was added in batches followed by intermittent stirring with the help of a graphite rod stirrer coated with zirconia. The obtained specimens of 450 mm length and 45 mm diameter are shown in Figure 1. These composites were used for turning operation on a self-centered three-jaw chuck lathe, as shown in Figure 2. The uncoated carbide inserts with grade H13A of designation CNMG 120,408 and material classification level ISO-TMC1 were used for the turning of Al–12%Si–6%TiB2 composites. The tool insert was tightly fixed on the tool holder with ISO code DCLNR 2525M12. Considering Al–Si as the matrix alloy and the orientation of TiB2 reinforcement, the selection of input parameters for the turning operation were finalized from previous experimental studies. The depth of cut was taken as 0.6 mm, 0.9 mm, and 1.2 mm.
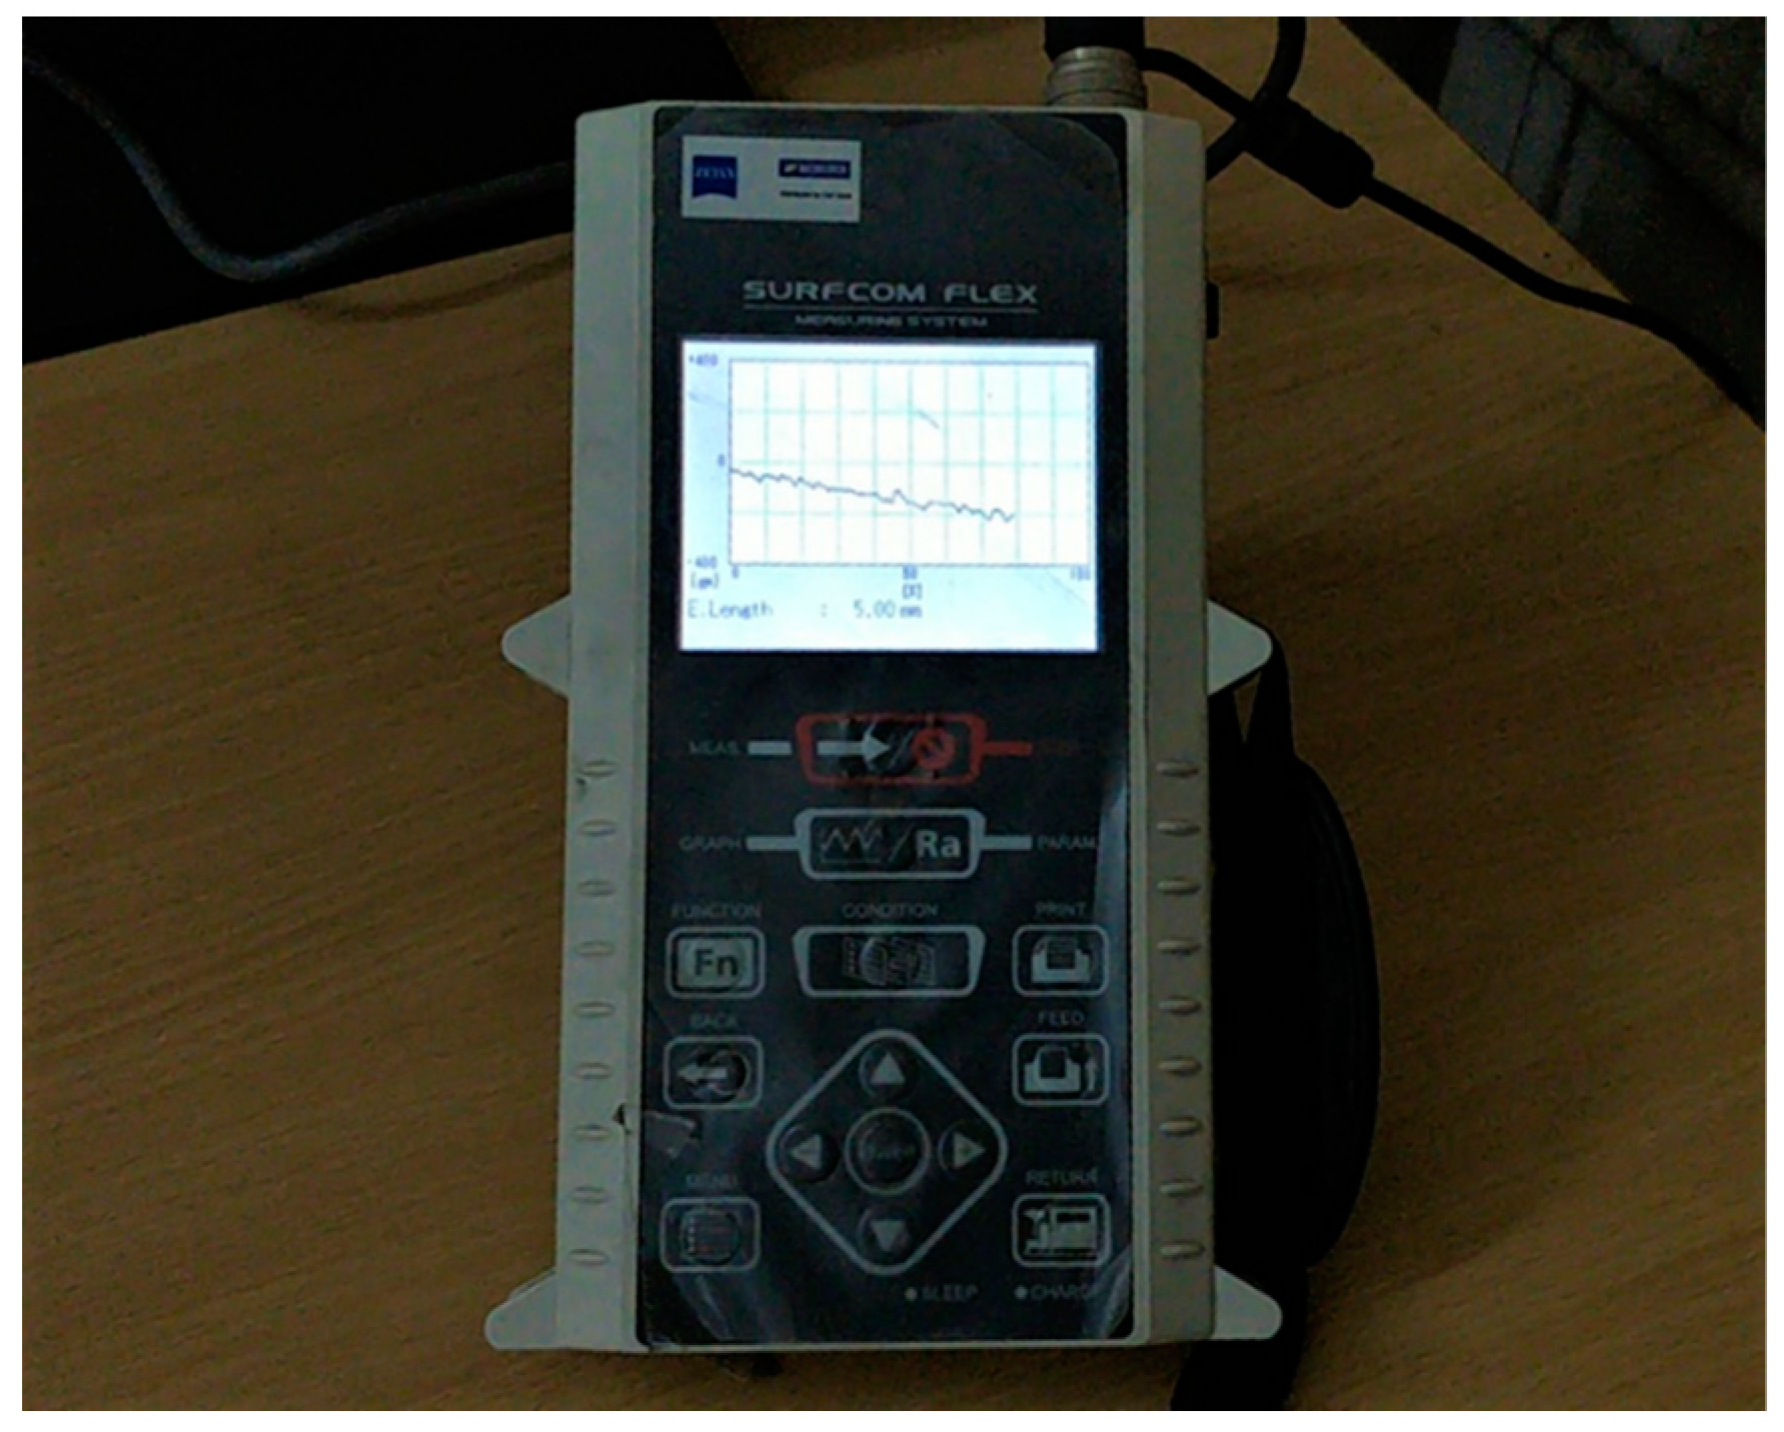
Cutting speeds were taken as 70, 110, and 190 m/min. Feed was taken as 0.07, 0.14, and 0.28 mm/rev, as presented in Table 1. Turning operation was conducted on a lathe manufactured by HMT Limited, and forces were recorded using a Kistler Piezoelectric Dynamometer of Type 9257B loaded with a multi-charge amplifier of type 5070. The machine’s data acquisition system was equipped with DynaWare software of type 2825A-02. Surface roughness was measured using Surfcom Flex 50A, which complies with ISO-1997 as mentioned in Figure 3. It was equipped with a pointed diamond probe with a scanning length of 5 mm. The experiments were planned as per full factorial design, as demonstrated in Table 2.
3. Results and Discussion
3.1. Effects of Machining Parameters on Feed Force, Cutting Forces, and Surface Roughness
3.1.1. Feed
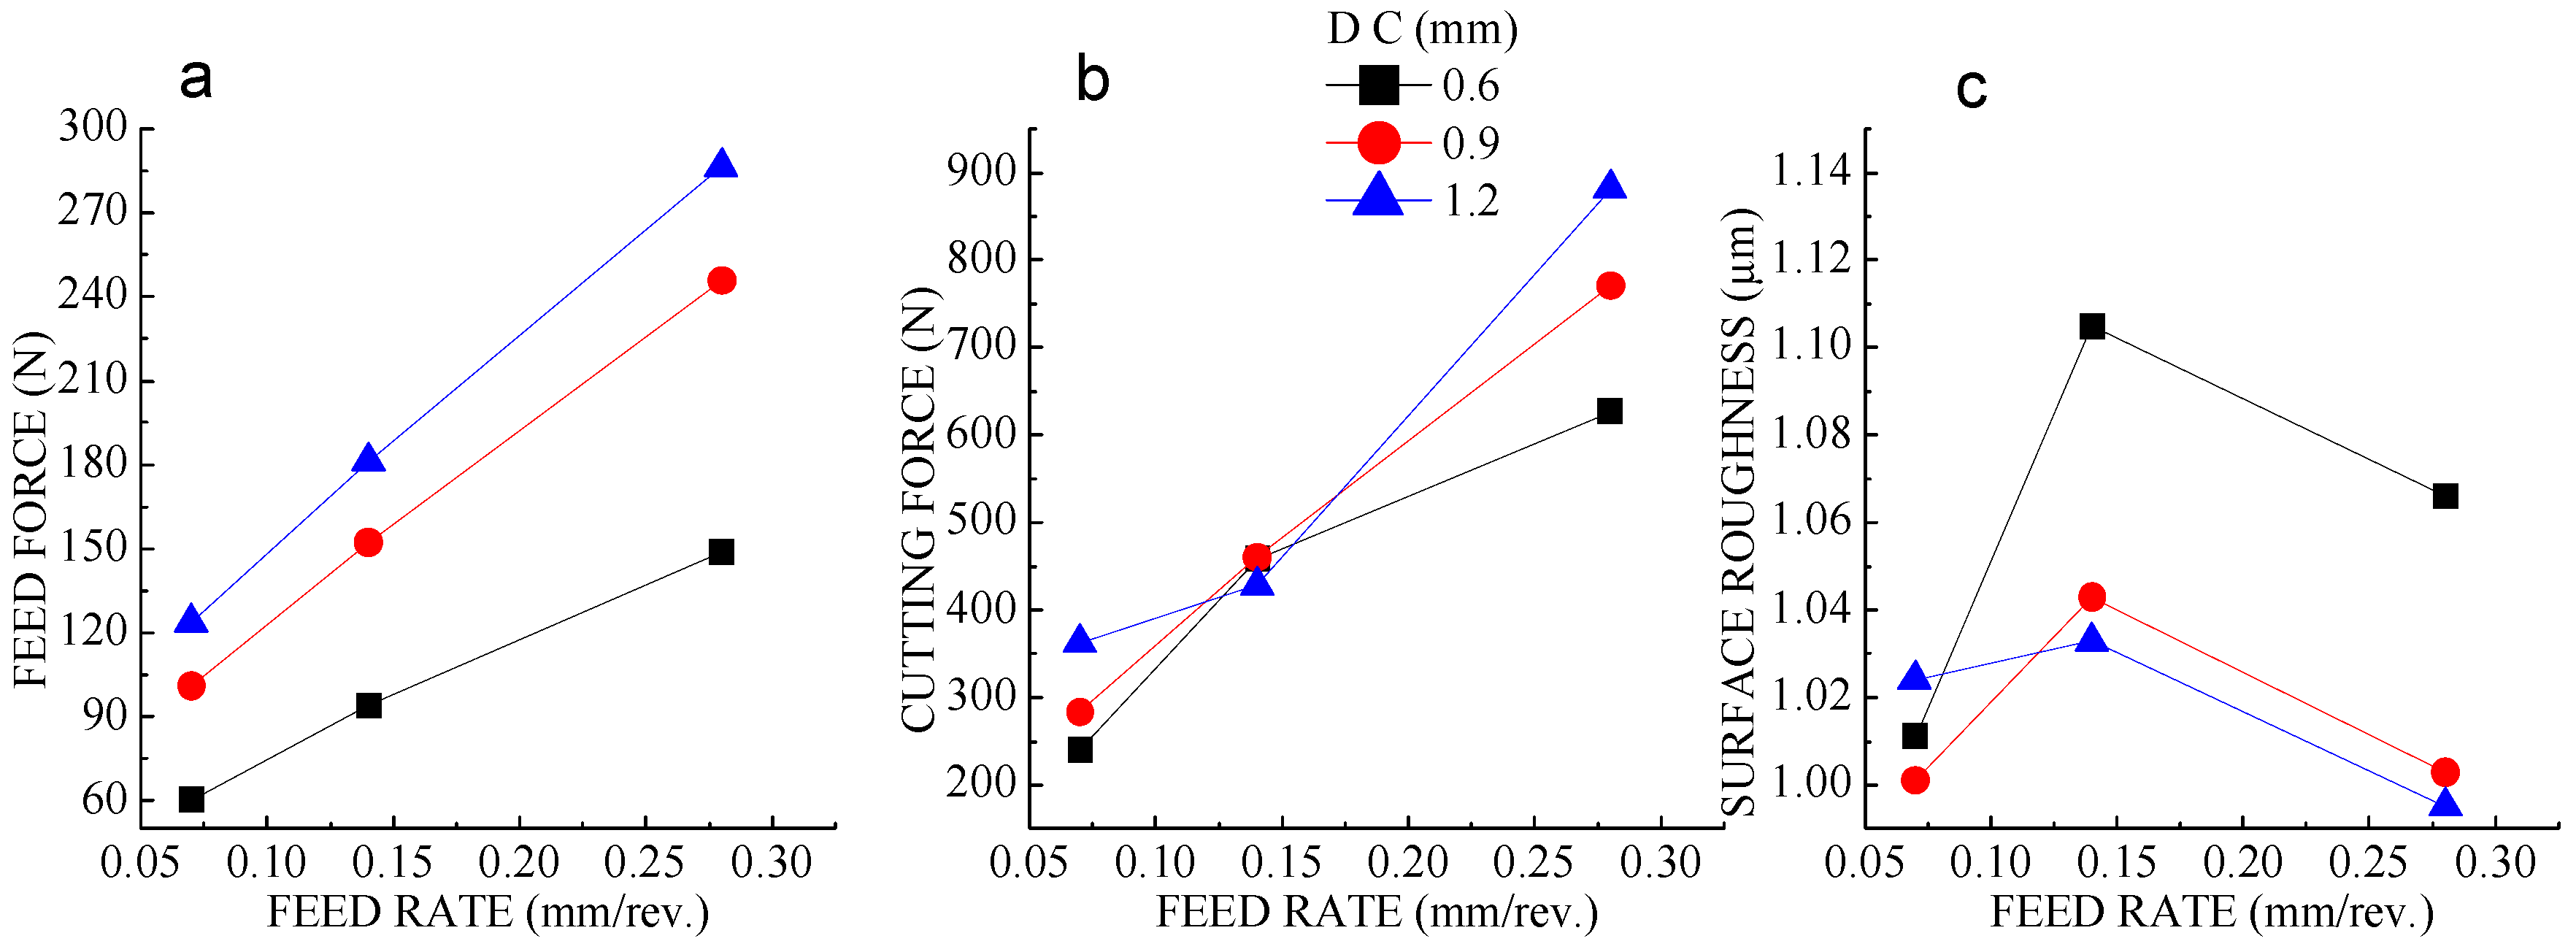
At a constant cutting speed of 190 m/min feed forces increased with the increase in feed with every depth of cut, as demonstrated in Figure 4a. Figure 4b shows that cutting force increased with an increase in feed at every depth of cut. This was due to an increase in the chip load per tool edge. The increase in tool feed increased the contact area between the workpiece material and the cutting tool, resulting in the generation of a higher feed force. Figure 4c shows a medium feed range (i.e., 0.14 mm/rev), which produced a relatively rough machined surface. This was due to the pulling action and the fracture of the TiB2 particles from its base material.
3.1.2. Cutting Speed
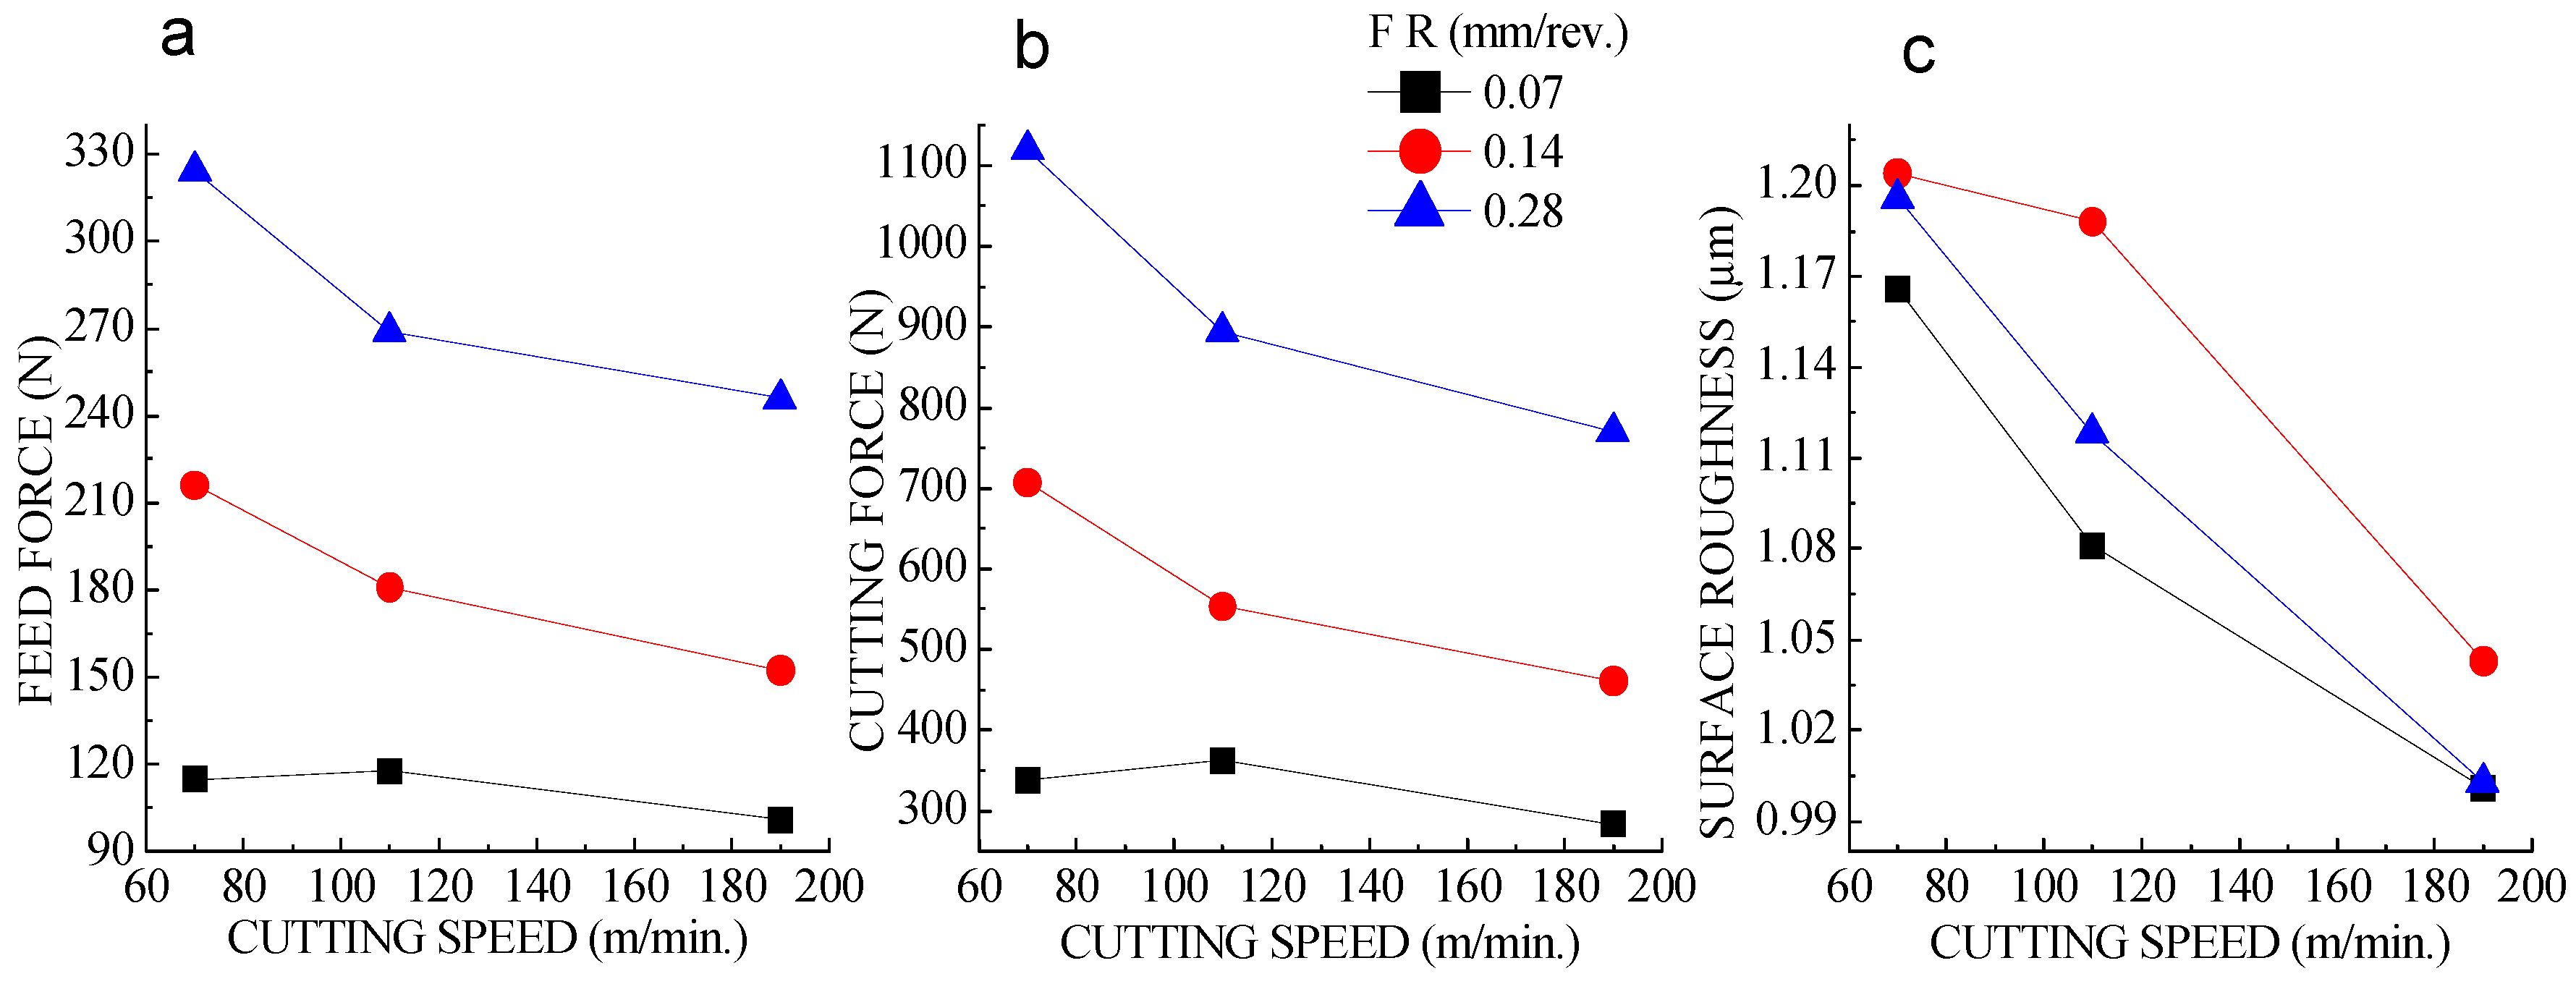
At a constant depth of cut of 0.9 mm, feed forces decreased with an increase in cutting speed at a higher feed rate, as demonstrated in Figure 5a. Cutting forces hardly varied with an increase in cutting speed at a lower feed rate, as shown in Figure 5b. However, at a high feed rate, the cutting force decreased quite sharply. Figure 5c shows that surface roughness decreased with the increase in cutting speed. This is because increasing cutting speed decreases the chip–tool contact length. This resulted in a reduction of friction on the machined surface, which produced minimum fracture and protruded TiB2 particles and led to a better surface roughness.
3.1.3. Depth of Cut
At a constant feed of 0.07 mm/rev, feed forces increased with an increase in depth of cut (Figure 6a). When the cutting speed increased from 70 to 190 m/min, the cutting forces also increased, as shown in Figure 6b. This was due to the thermal softening of the work material. This may be attributable to the influence of the change in working rake angle due to the formation of built up edge (BUE). Surface roughness decreased with the increase in depth of cut (Figure 6c). At lower feed rates and cutting forces, the hard ceramic TiB2 particulates were broken and voids formed on the machined surface, contributing high surface roughness.
3.2. Regression Models
Regression equations for feed force, cutting force, and surface roughness were formulated based on the results of ANOVA using adjusted sum of squares of experimental tests during turning operation in dry conditions. The control factors and the interactions were recorded based on p-values. To establish a relationship between the machining parameters and measured parameters, only the most significant terms were considered by the developed models.
3.2.1. First Order
The resulting regression equations are as follows:
where D.C = depth of cut, C.S = cutting speed, and F.R = feed rate. Fy, Fz and surface roughness can be calculated by substituting the value of the variables into Equations (1)–(3). The positive value of the coefficients suggests that the measured output variables increased with their associated input variables. However, the negative value of the coefficients proposes the measured output variables decreased due to an increase in associated input variables. These equations can help to determine the most influential input parameter for a particular output parameter. For example, the feed was the most impelling parameter in surface roughness, implicated from the big crest and trough at a high feed, hence a poor surface finish. Since the error in the prediction of Fy and Fz was too high, a regression model was formed with two degrees.
Fy = −71.1 + 201.0 × D.C – 0.4216 × C.S + 756.8 × F.R,
Fz = 45.0 + 302.3 × D.C − 1.560 × C.S + 2880 × F.R,
Surface roughness = 1.3292 − 0.0948 × D.C − 0.001228 × C.S + 0.1282 × F.R,
3.2.2. Second Order
Second-degree regression model equations helped in the prediction of the output parameters, as proved by error calculation. All the calculated errors laid in the 0% to 10% range, which was quite accurate.
Fy = −233.88 + 500.6 × D.C − 0.083 × C.S + 995 × F.R − 166.4 × D.C × D.C + 0.00240 × C.S × C.S – 1152 × F.R × F.R − 0.672 × D.C × C.S + 506.8 × D.C × F.R − 2.271 × C.S × F.R
Fz = −340 + 923 × D.C − 2.23 × C.S + 4746 × F.R − 252 × D.C × D.C + 0.01566 × C.S × C.S − 2252 × F.R × F.R − 1.842 × D.C × C.S + 368 × D.C × F.R − 11.24 × C.S × F.R
Surface roughness = 1.323 − 0.276 × D.C − 0.00095 × C.S + 1.159 × F.R + 0.037 × D.C × D.C + 0.000000 × C.S × C.S − 3.21 × F.R × F.R + 0.000273 × D.C × C.S + 0.496 × D.C × F.R − 0.00261 × C.S × F.R
3.3. Response Surface Plot
The response surface plots of the cutting force (Fz), feed force (Fy), and surface roughness are shown in Figure 7, Figure 8 and Figure 9. These results demonstrate the combined effect of the machining parameters on the machinability output parameters. The shape of the plots also indicates the probable locations of optimum values of the individual and combined factors for optimum output.
Cutting forces were minimum when the lower feed combined with the lower depth of cut, as shown in Figure 7 and Figure 8. The minimum surface roughness was obtained when lower feed was combined with the lower depth of cut, larger cutting speed with lower depth of cut, and larger cutting speed with lower feed, as presented in Figure 9.
3.4. Effect of Input Parameters with Chip Formation
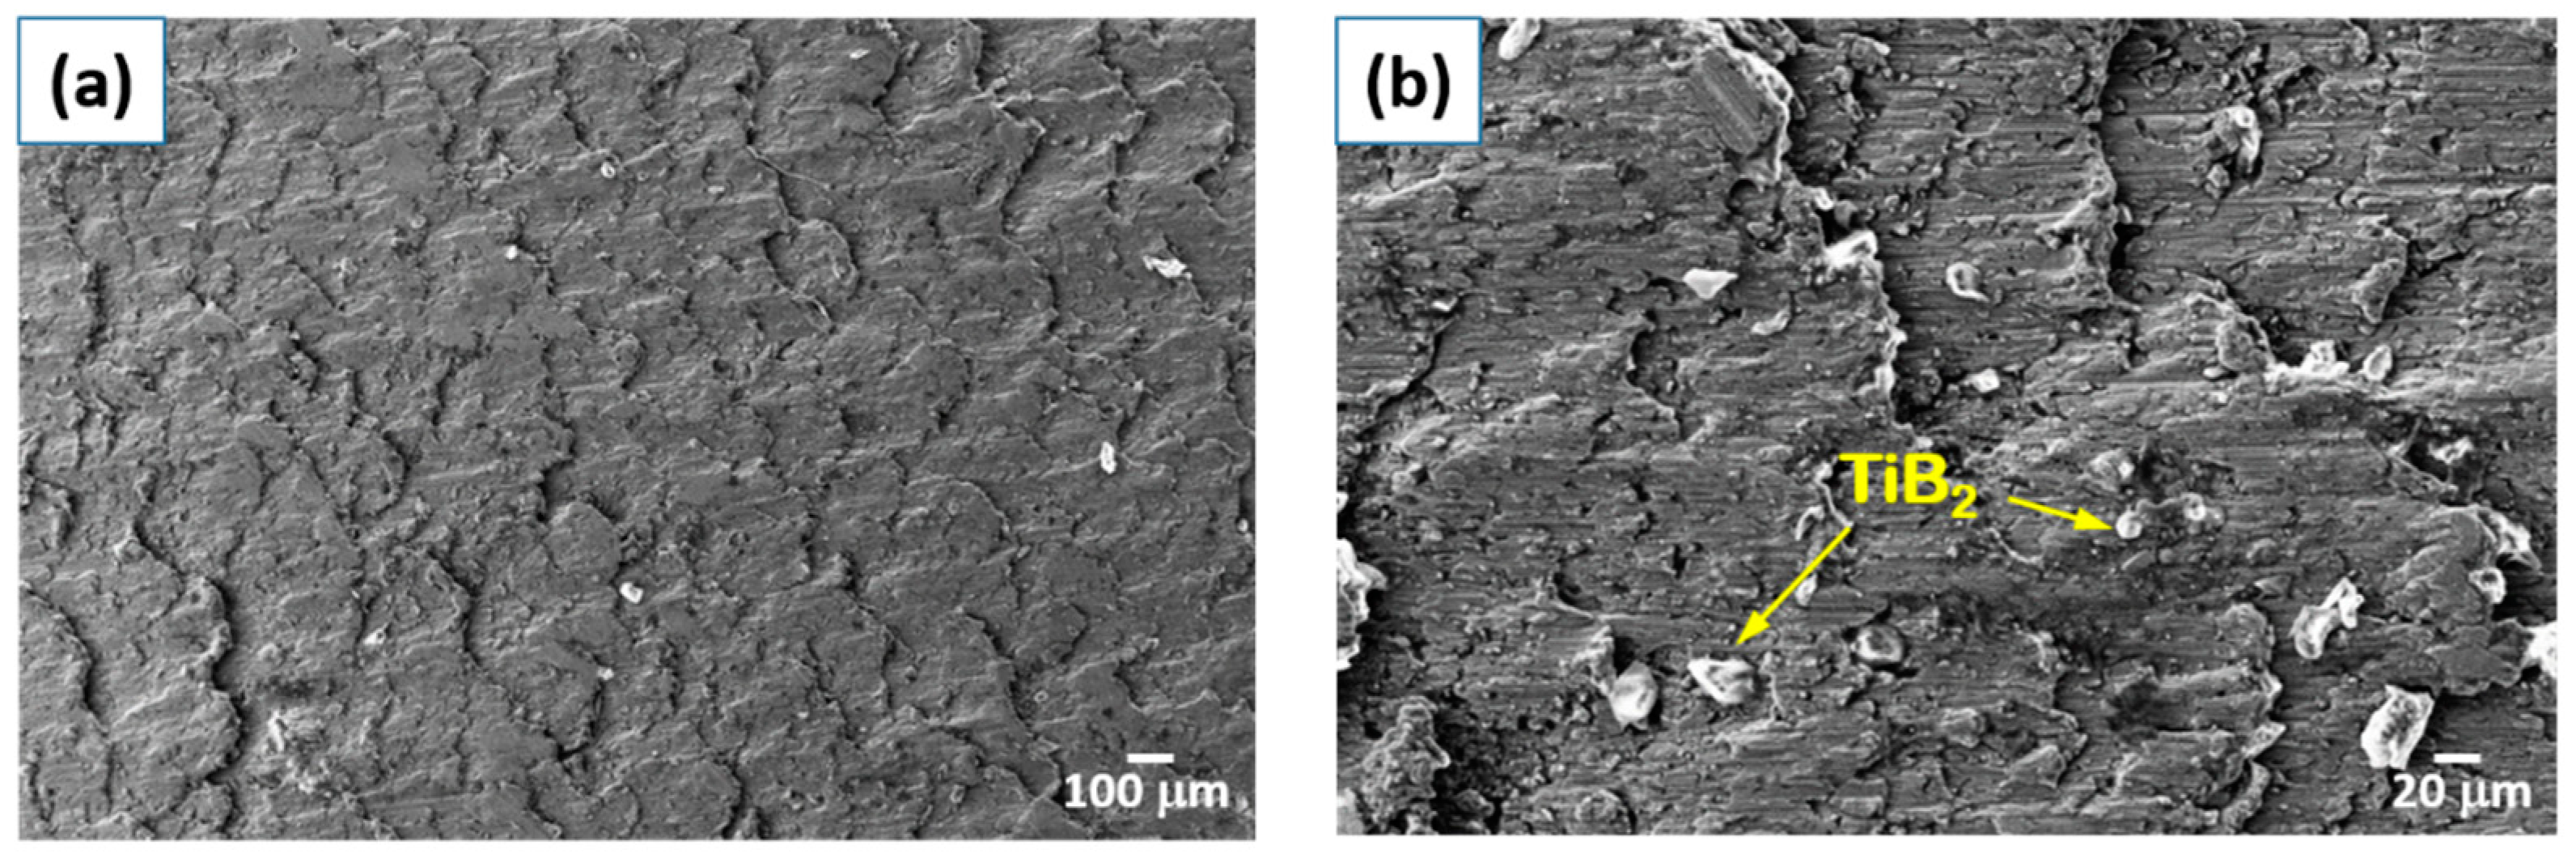
The chip formation in the course of turning Al–Si–TiB2 composite at 0.9 mm cut depth and varying cutting speed and feed are demonstrated in Figure 10. Chips were mostly discontinuous due to hard and brittle Al–Si matrix and ceramic reinforcement. With a discontinuous nature of chips, some variations in shape, size and thickness were also observed. The form of the chips generated at a cutting speed of 70 m/min was curly and short, and when cutting speed increased to 190 m/min the shape of chips became longer and curlier, as shown in Figure 10. If the chip thickness was high, the shear angle became small. This caused the cutting force and the energy required for deforming the material to increase, which means the smaller the chip thickness, the better the machinability will be. A typical machined surface of Al–12%Si/6wt.%TiB2 composite is presented in Figure 11. High-magnification SEM images revealed the formation of some crushed TiB2 particles with micro surface damage in the form of grooves and cavities.
4. Conclusions
- At constant cutting speed, feed forces increased with the increase in feed rate at every depth of cut, the cutting force increased with increasing feed rate at every depth of cut, surface roughness increased with increasing feed rate and then decreased with feed rate at every depth of cut.
- At a constant depth of cut, feed forces increased with increasing cutting speed at a higher feed rate, cutting forces hardly varied with increases in the cutting speed at a lower feed rate, and surface roughness decreased with increasing cutting speed.
- At constant feed, feed forces increased with increasing depth of cut, the cutting force increased with increasing depth of cut, surface roughness decreased with increasing depth of cut.
- Short length and discontinuous chips were produced at lower feed rate and lower cutting speeds, while helical-shaped chips were seen at higher ranges of feed rate and cutting speed.
- A two-degree model helped in the accurate prediction of output parameters, which was proved during error calculations using regression equations with a low range of error between 3%–9%.
Author Contributions
Conceptualization, J.K.; methodology, J.K.; formal analysis, J.K., S.M. and P.K.J.; Writing—Original Draft preparation, J.K.; Writing—Review and Editing, J.K.; supervision, P.K.J.
Funding
This research received no external funding.
Conflicts of Interest
The authors declare no conflict of interest.
References
- Lin, J.T.; Bhattacharyya, D.; Lane, C. Machinability of a silicon carbide reinforced matrix composite aluminium metal. Wear 1995, 183, 883–888. [Google Scholar] [CrossRef]
- Looney, L.A.; Monaghan, J.M.; O’Reilly, P.; Taplin, D.M.R. The turning of an Al/SiC metal-matrix composite. J. Mater. Process. Technol. 1992, 33, 453–468. [Google Scholar] [CrossRef]
- Manna, A.; Bhattacharayya, B. A study on machinability of Al/SiC-MMC. J. Mater. Process. Technol. 2003, 140, 711–716. [Google Scholar] [CrossRef]
- El-Hossainy, T.M.; El-Zoghby, A.A.; Badr, M.A.; Maalawi, K.Y.; Nasr, M.F. Cutting parameter optimization when machining different materials. Mater. Manuf. Process. 2010, 25, 1101–1114. [Google Scholar] [CrossRef]
- Chambers, A.R. The machinability of light alloy MMCs. Compos. Part A Appl. Sci. Manuf. 1996, 27, 143–147. [Google Scholar] [CrossRef]
- Muthukrishnan, N.; Davim, J.P. Optimization of machining parameters of Al/SiC-MMC with ANOVA and ANN analysis. J. Mater. Process. Technol. 2009, 209, 225–232. [Google Scholar] [CrossRef]
- Mahamani, A. Machinability study of Al-5Cu-TiB2 in-situ metal matrix composites fabricated by flux-assisted synthesis. J. Miner. Mater. Charact. Eng. 2011, 10, 1243–1254. [Google Scholar] [CrossRef]
- Rui-song, J.; Wen-hu, W.; Guo-dong, S.; Zeng-qiang, W. Experimental investigation on machinability of in situ formed TiB2 particles reinforced Al MMCs. J. Manuf. Process. 2016, 23, 249–257. [Google Scholar] [CrossRef]
- Horváth, R.; Sipos, S. Machinability of high silicon content aluminum alloys. In Proceedings of the XV Young Technologies Scientific Session, Cluj-napaoca, Romania, 25–26 March 2010; pp. 135–138. [Google Scholar]
- Koksal, S.; Ficici, F.; Kayikci, R.; Savas, O. Experimental optimization in turning of in-situ AlB2 reinforced AlMg3 matrix composites produced by centrifugal casting method. J. Compos. Mater. 2013, 1, 1–12. [Google Scholar] [CrossRef]
- Kumar, A.; Mahapatra, M.M.; Jha, P.K. Effect of machining parameters on cutting force and surface roughness of in situ Al-4.5%Cu/TiC metal matrix composites. Measurement 2014, 48, 325–332. [Google Scholar] [CrossRef]
- Behera, R.; Kayal, S.; Mohanta, N.R.; Sutradhar, G. Study on Machinability of Aluminium Silicon Carbide Metal Matrix Composites. In Proceedings of the Transactions of 61st Indian Foundary Congress, Kolkata, India, 27–29 January 2013; pp. 1–7. [Google Scholar]
Figure 1.
Machining specimens: (a) metal matrix composite (MMC), as casted; (b) MMC, after machining; (c) Base alloy, after machining.
Figure 1.
Machining specimens: (a) metal matrix composite (MMC), as casted; (b) MMC, after machining; (c) Base alloy, after machining.

Figure 2.
Turning operation: (a) schematic diagram; (b) experimental setup.

Figure 3.
Surfcom flex reading screen.

Figure 4.
Graphs of (a) feed rate vs. feed force; (b) feed rate vs. cutting force; and (c) feed rate vs. surface roughness at 190 m/min cutting speed.
Figure 4.
Graphs of (a) feed rate vs. feed force; (b) feed rate vs. cutting force; and (c) feed rate vs. surface roughness at 190 m/min cutting speed.

Figure 5.
Graphs of (a) cutting speed vs. feed force; (b) cutting speed vs. cutting force; and (c) cutting speed vs. surface roughness at 0.9 mm depth of cut.
Figure 5.
Graphs of (a) cutting speed vs. feed force; (b) cutting speed vs. cutting force; and (c) cutting speed vs. surface roughness at 0.9 mm depth of cut.

Figure 6.
Graphs of (a) depth of cut vs. feed force; (b) depth of cut vs. cutting force; and (c) depth of cut vs. surface roughness at 0.07 mm/rev feed rate.
Figure 6.
Graphs of (a) depth of cut vs. feed force; (b) depth of cut vs. cutting force; and (c) depth of cut vs. surface roughness at 0.07 mm/rev feed rate.

Figure 7.
Response surface plot for Fy.

Figure 8.
Response surface plot for Fz.

Figure 9.
Response surface plot for surface roughness.

Figure 10.
Chip length variations with various feed rates and cutting speed at a constant cut depth of 0.9 mm.
Figure 10.
Chip length variations with various feed rates and cutting speed at a constant cut depth of 0.9 mm.

Figure 11.
SEM micrographs of machined composite: (a) typical machined surface at 106×; (b) visible grooves of metal matrix and TiB2 particles at 500×.
Figure 11.
SEM micrographs of machined composite: (a) typical machined surface at 106×; (b) visible grooves of metal matrix and TiB2 particles at 500×.


Table 1.
Input machining parameters and their different levels.
| S. No | Depth of Cut (mm) | Cutting Speed (m/min) | Feed Rate (mm/rev) |
|---|---|---|---|
| Notation | D.C. | C.S. | F.R. |
| 1 | 0.6 | 70 | 0.07 |
| 2 | 0.9 | 110 | 0.14 |
| 3 | 1.2 | 190 | 0.28 |
Table 2.
Results of full factorial machining experiments.
| S. No. | Depth of Cut | Cutting Speed | Feed Rate | Feed Force (Fy) | Cutting Force (Fz) | Surface Roughness (Ra) |
|---|---|---|---|---|---|---|
| Units | mm | m/min | mm/rev | N | N | µm |
| 1 | 0.6 | 70 | 0.07 | 49.54 | 200.9 | 1.169 |
| 2 | 0.6 | 70 | 0.14 | 118.2 | 491.3 | 1.221 |
| 3 | 0.6 | 70 | 0.28 | 216.3 | 989.2 | 1.22 |
| 4 | 0.6 | 110 | 0.07 | 67.03 | 232 | 1.219 |
| 5 | 0.6 | 110 | 0.14 | 104.2 | 392 | 1.139 |
| 6 | 0.6 | 110 | 0.28 | 186.4 | 839.2 | 1.136 |
| 7 | 0.6 | 190 | 0.07 | 60.25 | 240.3 | 1.011 |
| 8 | 0.6 | 190 | 0.14 | 94.11 | 459 | 1.105 |
| 9 | 0.6 | 190 | 0.28 | 148.9 | 627.3 | 1.066 |
| 10 | 0.9 | 70 | 0.07 | 114.9 | 337.8 | 1.166 |
| 11 | 0.9 | 70 | 0.14 | 216.2 | 707.4 | 1.204 |
| 12 | 0.9 | 70 | 0.28 | 324.2 | 1120 | 1.196 |
| 13 | 0.9 | 110 | 0.07 | 117.8 | 362.8 | 1.081 |
| 14 | 0.9 | 110 | 0.14 | 180.9 | 553.7 | 1.188 |
| 15 | 0.9 | 110 | 0.28 | 269.1 | 894.8 | 1.118 |
| 16 | 0.9 | 190 | 0.07 | 101 | 283.7 | 1.001 |
| 17 | 0.9 | 190 | 0.14 | 152.2 | 460.7 | 1.043 |
| 18 | 0.9 | 190 | 0.28 | 246 | 770.7 | 1.003 |
| 19 | 1.2 | 70 | 0.07 | 170.2 | 455.4 | 1.063 |
| 20 | 1.2 | 70 | 0.14 | 266.7 | 773.8 | 1.141 |
| 21 | 1.2 | 70 | 0.28 | 388.2 | 1222 | 1.225 |
| 22 | 1.2 | 110 | 0.07 | 148.8 | 374.8 | 1.057 |
| 23 | 1.2 | 110 | 0.14 | 225 | 611.9 | 1.101 |
| 24 | 1.2 | 110 | 0.28 | 339.4 | 991.7 | 1.135 |
| 25 | 1.2 | 190 | 0.07 | 123.7 | 363.3 | 1.024 |
| 26 | 1.2 | 190 | 0.14 | 181.3 | 428.6 | 1.033 |
| 27 | 1.2 | 190 | 0.28 | 286.8 | 882.3 | 0.995 |
© 2019 by the authors. Licensee MDPI, Basel, Switzerland. This article is an open access article distributed under the terms and conditions of the Creative Commons Attribution (CC BY) license (http://creativecommons.org/licenses/by/4.0/).
Share and Cite
MDPI and ACS Style
Karloopia, J.; Mozammil, S.; Jha, P.K. Machinability, Modelling and Statistical Analysis of In-Situ Al–Si–TiB2 Composites. J. Compos. Sci. 2019, 3, 28. https://doi.org/10.3390/jcs3010028
AMA Style
Karloopia J, Mozammil S, Jha PK. Machinability, Modelling and Statistical Analysis of In-Situ Al–Si–TiB2 Composites. Journal of Composites Science. 2019; 3(1):28. https://doi.org/10.3390/jcs3010028
Chicago/Turabian StyleKarloopia, Jimmy, Shaik Mozammil, and Pradeep Kumar Jha. 2019. "Machinability, Modelling and Statistical Analysis of In-Situ Al–Si–TiB2 Composites" Journal of Composites Science 3, no. 1: 28. https://doi.org/10.3390/jcs3010028