Experimental and Numerical Investigation on the Steel Reinforced Grout (SRG) Composite-to-Concrete Bond


Department of Civil Engineering, University of Calabria, 87036 Cosenza, Italy
*
Author to whom correspondence should be addressed.
J. Compos. Sci. 2020, 4(4), 182; https://doi.org/10.3390/jcs4040182
Submission received: 10 November 2020
/
Revised: 30 November 2020
/
Accepted: 2 December 2020
/
Published: 4 December 2020
Abstract
:In the paper, the bond between a composite strengthening system consisting of steel textiles embedded into an inorganic matrix (steel reinforced grout, SRG) and the concrete substrate, is investigated. An experimental investigation was carried out on medium density SRG specimens; direct shear tests were conducted on 20 specimens to analyze the effect of the bond length, and the age of the composite strip on the SRG-to-concrete bond behavior. In particular, the tests were conducted considering five bond length (100, 200, 250, 330, and 450 mm), and the composite strip’s age 14th, 21st, and 28th day after the bonding. Test results in the form of peak load, failure modes and, bond-slip diagrams were presented and discussed. A finite element model developed through commercial software to replicate the behavior of SRG strips, is also proposed. The effectiveness of the proposed numerical model was validated by the comparison between its predictions and experimental results.
1. Introduction
Steel reinforced grout (SRG) composites made by steel textiles embedded into inorganic mortar (cement based or lime mortar) are commonly used to strengthen existing reinforced concrete and masonry structures.
Steel textiles comprise galvanized high strength steel wires twisted together to form cords which are assembled in the form of unidirectional fabrics. Steel wires have a small diameter (0.1–0.5 mm) and, generally, are coated to avoid corrosion. The tensile strength and Young’s modulus of the steel cords are in the range between 2800–3200 N/mm2 and 180–210 N/mm2, respectively. The steel cords can be arranged at different distances from each other; as a consequence, different values of the density can be obtained. Common values of the density of the SRGs are 600 g/m2 (low density, LD), 2000 g/m2 (medium density, MD), and 3300 g/m2 (high density, HD).
The effectiveness of the SRG systems for the strengthening of existing reinforced concrete and masonry structures has been proved by the results of experimental investigations [1,2,3,4,5,6,7,8,9,10,11]. Mechanical properties of the SRG systems have been investigated; testing procedures have been defined and the influence of the different parameters has been discussed in previous research [1,2,3]. The bond behavior SRG-to-concrete and SRG-to-masonry substrates is, generally, analyzed by single-lap or double-lap direct-shear tests. These tests allow to both define the bond-slip law at the interface SRG/substrate or SRG/matrix and to evaluate the maximum load and the maximum strain in the fibers at debonding.
Even limited in number, some investigations on the SRG-to concrete or masonry substrates bond have been conducted [2]. Shear bond tests were carried out by De Santis and de Felice [1] on low and high density SRG composites bonded on different masonry substrates (modern and historical bricks, tuff units): The obtained results evidenced that; (i) the failure modes are depending on both the mortar strength, the density of the steel textiles and the roughness of the masonry substrate; (ii) the exploitation ratio of the tensile strength of the textile varied between 9% and 16% for high density textiles and between 26% and 59% for low density textiles.
A round robin test initiative was organized by the Rilem TC 250-CSM (Composites for Sustainable strengthening of Masonry) to investigate the bond behavior of SRG systems [2]. The test comprised three textiles and four mortar types. The main results of this investigation evidenced that the SRG-to-masonry bond behavior depends on the strength of the steel textile, the cord-to-mortar bond interlocking, the mechanical properties of the mortar, the manufacturing and the curing conditions of the masonry substrates. In addition, it was found that the exploitation ratio of the tensile strength is related to the failure modes: high values (84%) were obtained when the failure occurred by detachment at the reinforcement-to-substrate or at the textile-to-mortar interface. Lower values (41%) were instead associated with the occurrence of textile sliding.
The SRG-to-masonry bond has been investigated also by Bencardino et al. [11]. Single lap shear bond tests have been carried out on prismatic specimens; SRG systems were tested varying both steel fibers (ultra-high tensile strength and stainless-steel fibers) and mortar types (mineral-NHL and lime-based mortars). The main results pointed out that failures occurred at the textile-to-mortar interface without detachment of the substrate. In addition, the load response of specimens was widely influenced by the capacity of impregnation of the steel fibers.
Ascione et al. [8,9] conducted a wide experimental investigation on the SRG-to-concrete bond behavior. The parameters varied were the concrete surface roughness, the density of the dry steel fibers (low and medium density), the bonded length and the concrete strength. The main results of the tests evidenced that: (i) the failures occurred due to sliding phenomena and cohesive failures in the matrix irrespective of the concrete strength and surface finishes; (ii) the bonded effective length ranges between 200 mm and 300 mm both for low density and medium density steel fibers; and (iii) increasing the number of the steel strips the maximum load resisted by the specimens increased but the average tensile strength of the SRG decreased (i.e., the exploitation ratio decreased).
Some shear bond tests have been carried out by Sneed et al. [6] to analyze the SRG-to-concrete bond performances. SRG composites consisted of medium density steel fibers embedded into mineral mortar were bonded to concrete prisms with a length of 330 mm. The parameter varied was the absence/presence of the external mortar layer. The results of tests evidenced that: (i) failures occurred by fiber slippage and fracture of the matrix layer; and (ii) the load response of the bonded composite exhibited no post-peak softening.
Results of tests, however, evidenced in many cases, a large scatter in the measurement of the slips between the textile and the matrix. This could be attributed to many reasons, among those the different failure modes, the non-homogeneous stress distribution among the steel cords, the different test rates, in particular in the post-peak phase, the stress distribution between the filaments in the cords, and the interaction/friction between the steel cord and the inorganic matrix layers. Nevertheless, some important aspects of the mechanical behavior of the SRG systems still need to be developed to identify design parameters, qualification and acceptance, and design criteria for structural rehabilitation. At this aim, great attention has been paid, recently, to the definition of acceptance criteria and testing procedures for the evaluation of mechanical properties of SRG systems [3].
The present paper, focused on the results of both experimental and numerical investigation, on the bond behavior of SRG-to-concrete joints. Direct shear tests have been carried out on 20 specimens in analyzing the effect of some parameters on the SRG-to-concrete bond performances. The SRG system used in this investigation consists of a medium-density steel fabric embedded into an inorganic matrix.
The aims of the experimental investigation are as follows:
- (i)
- Check the effectiveness of the medium density steel fabric as a reinforcement of an SRG strengthening system. Due to the reduced dimension of the spacing between steel cords in medium density steel fabrics, in fact, the inorganic matrix could not be able to penetrate and cover the individual steel cords reducing the bond between the strengthening system and the substrate.
- (ii)
- Evaluate the influence of some parameters on the bond performances of medium-density SRG to-concrete joints. In particular, the parameters considered were the bonded length (100, 200, 250, 330, and 450 mm) and the age of the composite (14th, 21st, and 28th day after the bonding).
The numerical investigation aims to give a contribution to the definition of adequate design models; the use of the SRGs as strengthening systems is, in fact, relatively recent and limited is the number of studies and research devoted to this purpose.
In the paper, a numerical model founded on a finite element procedure, developed through the commercial software Abaqus Code [12] was proposed. A cohesive model to reproduce the SRG-to-concrete interface and a bilinear local bond-slip law were adopted. The constitutive law of the concrete was described by the concrete damage plasticity (CDP) function while the plastic (P) function was used to represent the constitutive law of the external reinforcements. A perfect bond was assumed at the interface concrete substrate-internal matrix layer, while, at both the interfaces’ internal side of the steel fibers—internal matrix layer and external side of the steel fiber—external matrix layer the “traction separation approach”, was used. The numerical procedure was adopted to predict the structural response of the SRG-to-concrete joints in terms of applied load—global slip curves.
To validate the accuracy of the proposed numerical model, its predictions were compared with both the experimental results obtained in this study and some others available in literature.
2. Experimental Investigation
The experimental investigation was carried out by direct single-lap shear tests conducted on SRG specimens prepared and tested as described in the following section. The results presented in this study are part of an extensive experimental work: some of the obtained results were reported in a previous paper [6].
2.1. Materials
A normal weight concrete with Portland cement (Type 1) without admixtures was used to construct concrete prisms. The aggregate used was dolomite and the maximum size was 25.4 mm. Two concrete batches, named C1 and C2, were manufactured. Their mix design was similar; it differs only for the water/cement (w/c) ratio (w/c = 0.52 and 0.4 for the batches C1 and C2, respectively). Six 100 × 200 mm concrete cylinders were cast from each batch and tested according to the ASTM standards to determine mechanical properties of the concrete. Table 1 reports the average values and coefficients of variation of the compressive [13] and splitting tensile [14] strengths of the concrete obtained from tests at 28 days of curing.
The SRG system consisted of steel fibers sheet and a cementitious matrix [15]. The steel sheet consisted of unidirectional twisted steel wire cords; each cord included five filaments, three of which were straight, and the remaining two were wound around the other three at a high twist angle (Figure 1). The weight of the fibers was 2000 g/m2, the cord density was 0.427 cords/mm, and the cross-sectional area of each cord was 0.538 mm2.
Mechanical properties of the fiber mesh were determined by tensile tests performed on five dry textile coupons (Figure 2a). The coupons were 560 mm long and 50 mm wide; the cross-section consisted of 8 steel cords and its area was Af = 4.30 mm2. Specimens were clamped at both ends with thin steel plates 80 mm long; tensile tests were conducted in stroke control with a displacement rate of 1.25 mm/s. An extensometer with a gauge length equal to 50 mm was used to record the axial strain. The tensile stress was determined as σf = F/Af being F the tensile force applied to the specimens; the elastic modulus, was determined as Ef = (0.5σfu − 0.1σfu)/(εf(0.5σfu) − εf(0.1σfu)) being σfu the ultimate stress, (εf(0.5σfu) and εf(0.1σfu)) the axial strain values measured by the extensometer at the 0.5σfu and 0.1σfu, respectively. The values of the elastic modulus, tensile strength and ultimate strain obtained by tests are reported in Table 2, while in Figure 2b the experimental stress–strain curves are drawn.
Since the experimental investigation described in this work is part of an extensive experimental investigation presented in [6], the packaging of the specimens was performed at different times and under different environmental conditions. For this reason, four different mortar batches were obtained, each one characterized by a different water content and compressive strength values. It is, then, possible to analyze also the influence of the mortar strength on the SRG-to-concrete bond. Six cylinders with a diameter and height equal to 50 mm and 100 mm, respectively, were manufactured for each single batch and tested to determine their mechanical properties. Table 3 summarizes the results in terms of average compressive strength and splitting tensile strength determined by tests performed in accordance to [14,16] (the batches of matrix were named Mi, where i indicates the batch number).
2.2. Specimen Preparation
Twenty specimens were tested using the single-lap (direct) shear test set-up to investigate the bond behavior between SRG composite and concrete substrate. Concrete prisms had 125 mm square cross-section on the side and two different lengths Lcp equal to 375 mm and 510 mm, respectively. The different block lengths correspond to different bonded length l of the composite bonded area. All the SRG strips were cast with a 50 mm width; they were bonded on three formed faces of the prisms (one strip on one side of the concrete prism for each single lap shear test; in this way the same concrete prism was used to perform three single lap shear tests). In order to reach a roughness profile of a 5 mm depth, as suggested by the manufacturer [15], the faces were sandblasted prior to applying the first (internal) layer of the matrix. After the concrete surface was wetted, the matrix was applied only to the bonded area to embed the fibers and bond the composite to the concrete substrate (Figure 3a). The composite was bonded starting at a distance d = 38 mm from the prism edge at the loaded end. Fibers were bare outside the bonded area. A 4 mm thick layer of the matrix (internal layer) was applied to the concrete, then a single layer of steel fibers was applied onto the internal matrix layer, and the fibers were pressed onto the matrix to maintain their alignment and assure proper impregnation by the matrix. The fiber strip was positioned such that it extended slightly beyond the end of the matrix at the free end of the composite strip. A second (external) 4 mm thick layer of the matrix was applied over the steel fibers.
2.3. Test Set-Up
The push–pull configuration illustrated in Figure 3 was adopted to perform single lap shear tests on SRG–concrete joints [6,10]. To grip the steel fibers during testing, two steel plates were glued with epoxy to the end of the strip. The steel plates were also bolted between them to avoid any possible slippage of the strip and to guarantee a uniform distribution of pressure on the steel fibers.
A steel frame, made up with a flat 48 mm wide and 9 mm thick bar, was bolted to the testing machine base and used to restrain concrete prisms against movement [10]. A steel plate was inserted between the steel frame and the top face of the prism to distribute uniformly the load on the concrete prism. Four LVDTs were used to measure the displacements during the tests. Two of them (named LVDTa and LVDTb), mounted on the face of the prism where the SRG strip was bonded, measured the slip of the fibers at the beginning of the bonded area. They reacted off a thin aluminum Ω-shaped plate attached to the first transversal steel fibers bundle outside the bonded area [17].
Tests were conducted under displacement control using a close-loop servo-hydraulic universal testing machine; in particular, the displacement rate was controlled by the average value measured from LVDTa and LVDTb. This technique was used in previous papers present in literature [6,10,17], and the average value measured is called global slip sg.
The tested specimens were named following the notation S-L-V-λd-(E)-n, where S indicates that the specimen was tested using the single-lap direct-shear test setup, L = bonded length (l) in mm; V indicates the testing rate employed (V1 = 0.00084 mm/s is the reference rate, which was used in previous experimental campaigns [10]); λd (if present) indicating the age of the composites, E (if present) indicates the external layer of the matrix was omitted, and n is the specimen number. All tested specimens are listed in Table 4. Some photos during testing are shown in Figure 4.
3. Results
The main results of the experimental investigation are reported and discussed in the following in terms of failure modes, peak load, strain values, and load–slip diagrams. In this analysis, some results reported in a previous paper [6] were also considered.
3.1. Failure Modes
The failure of all tested specimens was characterized by a sudden and brittle detachment of the fiber strip and the external matrix layer (interlaminar failure). This failure mode is not influenced from the mortar strength. As reported in technical literature [1,2,3], this failure mode occurred in the majority of direct shear tests carried out on SRG specimens. In all specimens tested in this investigation, the interfacial crack formed along the fibers (Figure 5a). Debonding occurred at the internal matrix–fiber interface and was the result of the fracture of the matrix between the fibers. Figure 5b shows a representative photo of the S-330 series specimens after failure, while Figure 5c shows thin transversal cracks formed as the global slip increases. The first crack generally formed near the composite loaded end, then as the global slip increased, additional cracks formed progressively towards the composite free end. The cracks were visible on the external surface of the composite and appeared to extend from the external surface to the steel fiber strip.
3.2. Peak Stress and Strains
Table 4 reports the results of tests in terms of peak load P* and corresponding peak stress evaluated as
n being the number of longitudinal fiber cords (24 for each SRG strip), and A* the area of each cord (0.538 mm2).
In Table 4, values of the exploitation ratio i.e., the ratio σ*/ffu being ffu the ultimate strength of the fibers, are also reported. This latter was assumed to be equal to the tensile dry steel fabric strength reported in Table 3 (ffu = 3010 MPa). Figure 6 reports the applied load-exploitation ratio diagram: as expected, σ* being linearly dependent to the applied load, the diagram is linear.
From the results reported in Table 5 emerge that the exploitation ratio is in the range 0.27–0.40. However, excluding values corresponding to specimens in which l < leff and those in which the curing time of the SRG composite was lesser than 28th day, it results, on average, that the exploitation ratio is approximatively equal to 0.40. This result evidences a low efficiency of the SRG system that can be related to the density of the steel fabric; as reported in [2], the same value of the exploitation ratio (0.41) is reached in low density SRGs when the failure is associated to the occurrence of textile sliding.
3.3. Load–Slip Diagrams
The response of the tested specimens in terms of applied load-global slip diagrams is described in the following section for each varied parameter. For all tested specimens, three branches characterize the load–slip response. The first part of the response is a linear branch associated with the elastic behavior of the interface between the longitudinal fiber bundles and the matrix. The subsequent non-linear branch is associated with a slight reduction in stiffness due to the occurrence of a micro-damage at the interface between the steel fibers and the matrix. After the peak load P* is reached, further increases in global slip generally result in a near-constant applied load until a sudden and rapid degradation of load occurs with no distinct softening response.
3.3.1. Effect of the Bonded Length
In Figure 7, the experimental load–global slip diagrams for each bonded length l considered, are reported. The analysis of the obtained diagrams evidences that the response of the S-100-50-V1-1 specimen has been very different to that of the other specimens: its response, in fact, has been brittle and the peak load was lower than those reached by the other specimens. The bonded length l = 100 mm, then, has not been adequate to the development of the stress transfer mechanism at the interface SRG-to-concrete. By increasing the bonded length, the load–slip diagrams developed as expected.
The influence of the bonded length l on the peak load value P* is reported in Figure 8; in the same Figure is also reported, as marked line the average value of the peak load, P* for each bonded length value. It should be noted that peak load P* increases linearly until l = 200 mm, then for l > 200 mm its value is almost constant. As a consequence, the effective bonded length leff (defined as the minimum bonded length needed to obtain the maximum applied load P) is about 200 mm.
3.3.2. Effect of Age of the SRG Strips
To evaluate the influence of the age of the SRG specimens with bonded length l = 330 mm were tested. Tests were conducted at the 14th, 21st, and 28th day of the SRG curing time. The results of the tests on specimens at 28th day of curing time were described in [6]. The obtained load–global slip diagrams were illustrated in Figure 9.
Being the considered bonded length higher than the effective bonded length, all diagrams developed satisfactorily; their shape is similar for each value of the curing time. The peak load increases with the curing time while the maximum slip value is almost coincident for all tested specimens. Figure 10 reports the variation of the peak load, P* with the curing time. The average value of P* is equal to 6.66 kN, 7.80 kN, and 9.27 kN at 14th, 21st, and 28th day of the SRG curing time, respectively; its variation is almost linear. The SRG-to-concrete bond is, then, significantly influenced by of the curing time of the composite system.
3.3.3. Influence of the Rotation of the Concrete Block
The analysis of the bond through direct shear tests is generally conducted neglecting the rotation of the concrete block. As well-known, the rotation of the block is due to the deformation of concrete (typically neglected) and the deformation of the steel plates used to restrain the block [17]. Neglecting the deformation of the concrete block, an out-of-plane displacement takes place which corresponds to an out-of-plane Mode-I loading condition (peeling) of the composite. To monitor the out-of-plane displacements of the concrete block during the tests, two LVDTs, named LVDTc and LVDTd, were placed in the back of the specimen (see Figure 3). Table 5 reports the average values w* of the displacements measured at the peak load P* by the two LVDTs for all tested specimens together with the average value w*avg for each group of specimens. The analysis of the obtained values evidences that out-of-plane displacements at the peak load were less than 1 mm for all specimens. Given the bonded length adopted, the values reported in Table 5, indicate that the Mode-I component might be neglected.
4. Numerical Modeling
In this Section the FE modeling of the concrete joint externally bonded with a SRG system was analyzed by numerical approach through an FE Software package by Abaqus Code [12]. The main aspects of the procedural details, reported in [18,19,20], are summarized in the following section.
4.1. Geometrical Modeling
The matrix and the concrete joint were modeled in three-dimension (3D). The element adopted is a 3D-Stress element called C3D4. It has four nodes, tetrahedral geometry and linear interpolation functions. While, the steel fiber was modeled in two-dimension (2D) through a shell element called S4R. The S4R is a quadrilateral element with reduced integration. The mesh sensitivity of the model was investigated by a different configuration variation. The FE mesh adopted is shown in Figure 11. At the base of the concrete joint the displacements in the x-z plane were blocked, while at the top of the concrete joint the displacements along the y-axis were blocked. Finally, at the opposite face, where the composite strip was attached, only the displacements in the x-z plane were blocked.
4.1.1. Materials and Interface Modeling
The mechanical behavior of the concrete was defined with the concrete damage plasticity (CDP) function provided in the Abaqus Code [12]. The Hognestad [21] constitutive law of the concrete in compression was adopted. As reported in Figure 12a the Hognestad’s law is described by a quadratic function up to the peak stress, and by a descending linear curve which represents the damage behavior of the concrete. The descending curve was defined until reaching a reduction of the 15% of the peak stress. The model proposed by Kara et al. [22] was used to define the constitutive law of the concrete in tension (Figure 12b). The law is described by two linear branches; the first one is ascending up to the tensile strength of the concrete while the other branch is descending until the tensile stress becomes zero. The descending branch is defined through the parameter μ which describes the tensile strength decay of the concrete.
The Hognestad [21] and Kara et al. [22] (Figure 12b) stress–strain models were also adopted to describe the behavior of the matrix used in the SRG system, in particular, as value of compressive and tensile strength were evaluated the average values reported in Table 3. The CDP function was used to correlate the stress–strain relationships in compression and in tension.
The steel fibers were modeled as a homogenous elastic material until failure (Figure 12c); the input parameters were defined by density (ρ = 2.5 g/cm3), elastic modulus evaluated in Section 2.1, and Poisson’s ratio (υ = 0.3). Particular attention was dedicated to the interaction among all the parts that made up the numerical model. In Figure 13, the contact surfaces (i) concrete substrate—internal matrix layer; (ii) internal matrix layer—bottom side of the steel fabric; and (iii) external matrix layer —top side of the steel fabric are illustrated.
As discussed above, the debonding phenomenon in SRG systems occurs at the interface between the steel fibers and the matrix. Consequently, a perfect bond was used at the interaction surface between the concrete substrate and the internal matrix layer. While, at both the interaction surface internal side of the steel fibers–internal matrix layer and external side of the steel fiber–matrix external layer, the “traction separation approach” function was used. This function can be used in describing the relative displacement of the points that belong to the interaction surface. The function is a bilinear type, associated to the failure modes (Mode I and Mode II), the initialization of the damage (at the normal or shear stress peak) and the evolution of the damage. The bond slip law adopted is composed by three linear branches [23]; it has been proposed for the analysis of the FRP–concrete joints. However, FRP and SRG have the similar response in terms of load versus slip and, then, it is possible to adopt the same bond-slip law to analyze the bond behavior of SRG–concrete joints. The parameters that describe the bond slip law are the initial stiffness k0, the shear stress τmax and the fracture energy Gf. The values of these parameters estimated through the experimental results, are summarized in Table 6. In addition, since in the SRG systems the debonding takes place at the fiber matrix interface, in the bond-slip law the parameter fct represents the tensile strength of the matrix.
4.1.2. Numerical Solution
The numerical tests were conducted in displacement control. In particular, at the top of the steel fibers an enforcing displacement λu, was applied. In order to solve the non-linear equation that composes the numerical model, a dynamic (explicit) approach was used. This approach was first used by Chen [24] in order to analyze RC beams strengthened in flexure with an FRP system. The variable mass scaling and the ratio between the kinetic/internal energy are the main parameters to obtain the static solution. The variable mass scaling adopted was equal to 0.00005 for all the parts of the model, while the ratio must not exceed 5% during the analysis.
4.2. Experimental/Numerical Comparison
To evaluate the effectiveness of the proposed numerical procedure, a comparison between numerical predictions and experimental results was carried out. The results of the comparison are described in the following.
Present and Sneed et al. Investigations
In Figure 14a,b the comparisons between the numerical applied load–global slip curves and those obtained by tests are reported [6]. The comparison with the results of the tests performed in the present investigation is illustrated in Figure 14a while that with the results of tests conducted by Sneed et al. [6] is reported in Figure 14b. It should be noted that the numerical curve is in good agreement, in terms of global slip sg, peak load P* with respect to the experimental curves. In both cases, in average, the numerical predictions of the peak load P* differ, in fact, by 3% with respect to experimental values. Furthermore, the numerical curve has a sensible overestimation of the initial slope, probably due to the stiffness of the FE model or FE element adopted.
In Figure 15, the crack pattern obtained from the numerical model at different level of applied load (red points); in the same Figure the stress-transfer mechanism along the entire bonded length during the analysis is also reported.
During the entire analysis the peeling stress at all interfaces considered were checked in order to evaluate the values would not exceed the elastic limit. Furthermore, the numerical load response showed in Figure 14, only the damage effect of Mode-II. In Figure 16, the comparison between the crack pattern observed in the experimental and in the numerical model at load level E, was reported. In the same figure, the black highlighted marker lines indicate the cracks present on the external layer. From the comparison, it is possible to note that the crack pattern of the numerical model is very similar to the experimental one.
Moreover, an enlargement of the interaction zone between the external matrix layer, steel fibers, and internal matrix at level load E, was reported. It should be noted that a crack, evidenced by the red zone, develops along the entire bonded length of the composite strip, indicates the complete detachment of both the external matrix layer and steel fibers with respect to the internal matrix layer and the concrete substrate. The type of failure observed is identical to the one shown in Figure 5b. Similar technique was used in [25].
Finally, in regards to the external–internal matrix layer (Figure 13), the load was transferred from the fiber to the composite strip and then to the concrete substrate during the test. When the limit stress is reached (in a determined point of the composite strip) the external matrix layer and the steel fiber detach from the internal matrix layer (see Figure 13), the load continues to be transferred to the substrate thanks to the remaining part of the bond length.
5. Conclusions
The results of the experimental investigation focused on the influence of the bonded length, age of the composite strip, and mortar strength on the bond performances of medium density SRG-to-concrete joints, and the main results of the proposed numerical model, presented and discussed in the paper, allow us to draw the following concluding remarks:
- The medium density SRG system adopted in this investigation, as evidenced by the results of the experimental investigation described in [6] is effective as strengthening system. The bond SRG-to-concrete, analyzed in this investigation is, in fact, satisfactory (i.e., the values of the maximum load reached for bonded lengths greater than 200 mm are similar with a difference of around 5%).
- The efficiency of the medium density SRG system adopted in this investigation expressed by the exploitation ratio of the tensile strength of the textile was lower than 40%. This low efficiency is related to the occurrence of the interlaminar failure in all tested specimens.
- The effective bonded length of the SRG-to-concrete joints, referred to the end of the curing time of the SRG system (28th days), is about l = 200 mm.
- The curing time of the SRG system influences the bond; the peak load increased linearly with the age of the composite.
- The average of the out-of-plane displacements wc and wd of the specimens at the peak load increase with the age of the composite and bonded length; their values, however, appear to be small and allow to assume that the Mode-I component is negligible.
- The numerical approach furnishes good predictions of the experimental results mainly in terms of applied load–global slip curves. In particular, the predicted values of the peak load differ only by 3% with respect to the experimental values.
However, the obtained results are valid only for the tested strengthening system, due to different fiber sheet density and inorganic matrix for different substrate. As a consequence, further experimental investigations in which the influence of some other parameters—such as the number of steel textile layers, the concrete substrate strength, and the curing conditions of the mortar—are needed for their validation.
Author Contributions
Conceptualization, L.O. and S.V.; Methodology, L.O.; Software, S.V.; Validation, L.O., and S.V.; Formal analysis, L.O. and S.V.; Investigation, L.O. and S.V.; Resources, L.O. and S.V.; Data curation, L.O. and S.V.; Writing—original draft preparation, L.O., and S.V.; Writing—review and editing, L.O. and S.V Visualization, L.O. and S.V.; Supervision, L.O. All authors have read and agreed to the published version of the manuscript.
Funding
This research received no external funding.
Acknowledgments
Kerakoll S.p.A. of Sassuolo, Italy, is gratefully acknowledged for providing the composite materials used in this experimental investigation.
Conflicts of Interest
The authors declare no conflict of interest.
References
- De Santis, S.; de Felice, G. Steel reinforced grout systems for the strengthening of masonry structures. Comp. Struct. 2015, 134, 533–548. [Google Scholar] [CrossRef]
- De Santis, S.; Ceroni, F.; de Felice, G.; Fagone, M.; Ghiassi, B.; Kwiecień, A.; Lignola, G.P.; Morganti, M.; Santandrea, M.; Valluzzi, M.R.; et al. Round robin test on tensile and bond behaviour of steel reinforced grout systems. Comp. Part B Eng. 2017, 127, 100–120. [Google Scholar] [CrossRef]
- Ascione, L.; de Felice, G.; De Santis, S. A qualification method for externally bonded fibre reinforced cementitious matrix (FRCM) reinforcement systems. Comp. Part B Eng. 2015, 78, 497–506. [Google Scholar] [CrossRef]
- Huang, X.; Birman, V.; Nanni, A.; Tunis, G. Properties and potential for application of steel reinforced polymer and steel reinforced grout composites. Comp. Part B Eng. 2005, 36, 73–82. [Google Scholar] [CrossRef]
- Razavizadeh, A.; Ghiassi, B.; Oliveira, D.V. Bond behavior of SRG-strengthened masonry units: Testing and numerical modeling. Const. Build. Mater. 2014, 64, 387–397. [Google Scholar] [CrossRef]
- Sneed, L.H.; Verre, S.; Carloni, C.; Ombres, L. Flexural behavior of RC beams strengthened with steel-FRCM composite. Eng. Struct. 2016, 127, 686–699. [Google Scholar] [CrossRef]
- Napoli, A.; Realfonzo, R. Reinforced concrete beams strengthened with SRP/SRG systems: Experimental investigation. Constr. Build. Mater. 2015, 93, 654–677. [Google Scholar] [CrossRef]
- Ascione, F.; Lamberti, M.; Napoli, A.; Realfonzo, R. Experimental bond behavior of Steel Reinforced Grout systems for strengthening concrete elements. Constr. Build. Mater. 2020, 232, 117105. [Google Scholar] [CrossRef]
- Ascione, F.; Faella, C.; Lamberti, M.; Napoli, A.; Realfonzo, R. Strengthening of RC structures with SRP/SRG systems: Bond test. In Proceedings of the Durability and Sustainability of Concrete Structures (DSCS-2018)—Proc. of Durability and Sustainability of Concrete Structures (DSCS-2018), Moscow, Russia, 6–7 June 2018. [Google Scholar]
- Carloni, C.; Verre, S.; Sneed, L.H.; Ombres, L. Loading rate effect on the debonding phenomenon in fiber reinforced cementitious matrix-concrete joints. Comp. Part B Eng. 2017, 108, 301–314. [Google Scholar] [CrossRef]
- Bencardino, F.; Nisticò, M.; Verre, S. Experimental investigation and numerical analysis of bond behavior in SRG-strengthened masonry prisms using UHTSS and stainless-steel fibers. Fibers 2020, 8, 8. [Google Scholar] [CrossRef] [Green Version]
- Abaqus Code. Finite Element Code; Karlsson, Hibbitt & Sorensen, Inc.: Pawtucket, RI, USA, 2012. [Google Scholar]
- ASTM C39 Standard Test Method for Compressive Strength of Concrete Cylinder Specimens; ASTM: West Conshohocken, PA, USA, 2016; 7p.
- ASTM C496 Standard Test Method for Splitting Tensile Strength of Cylindrical Concrete Specimens; ASTM: West Conshohocken, PA, USA, 2011; 5p.
- Kerakoll, S.p.A. Available online: www.kerakoll.com (accessed on 1 February 2016).
- ASTM. Standard Practice for Use of Unbonded Caps in Determination of Compressive Strength of Concrete Cylinders (C1231); ASTM: West Conshohocken, PA, USA, 2014; 5p. [Google Scholar]
- D’Antino, T.; Carloni, C.; Sneed, L.H.; Pellegrino, C. Effect of the inherent eccentricity in a single-lap direct-shear tests of PBO FRCM-concrete joints. Comp. Struct. 2016, 142, 117–129. [Google Scholar] [CrossRef]
- Ombres, L.; Iorfida, A.; Verre, S. FRCM/SRG—Masonry Joints: Experimental Investigation and Numerical Modelling. Key Eng. Mater. 2019, 817, 3–8. [Google Scholar] [CrossRef]
- Ombres, L.; Verre, S. Flexural Strengthening of RC Beams with Steel-Reinforced Grout: Experimental and Numerical Investigation. J. Comp. Const. 2019, 23. [Google Scholar] [CrossRef]
- Ombres, L.; Verre, S. Numerical Modeling Approaches of FRCMs/SRG Confined Masonry Columns. Front. Built Environ. 2019, 5, 143. [Google Scholar] [CrossRef] [Green Version]
- Hognestad, E. Study of Combined Bending and Axial Load in Reinforced Concrete Members. University of Illinois. Engineering Experiment Station. Available online: https://trid.trb.org/view/618359 (accessed on 3 December 2020).
- Kara, I.F.; Ashour, A.F.; Köroğlu, M.A. Flexural behavior of hybrid FRP/steel reinforced concrete beams. Comp. Struct. 2015, 129, 111–121. [Google Scholar] [CrossRef]
- Lu, X.Z.; Teng, J.G.; Ye, L.P.; Jiang, J.J. Bond slip models for FRP sheet/plates bonded to concrete. Eng. Struct. 2005, 27, 920–937. [Google Scholar] [CrossRef]
- Chen, G.M.; Teng, J.G.; Chen, J.F.; Xiao, Q.C. Finite element modeling of the debonding failures in FRP-strengthened RC beams: A dynamic approach. Comp. Struct. 2015, 158, 167–183. [Google Scholar] [CrossRef] [Green Version]
- Carloni, C.; D’Antino, T.; Sneed, L.H.; Pellegrino, C. Three-Dimensional Numerical Modeling of Single-Lap Direct Shear Tests of FRCM-Concrete Joints Using a Cohesive Damaged Contact Approach. J. Compos. Constr. 2018, 22. [Google Scholar] [CrossRef]
Figure 1.
Medium steel mesh.

Figure 2.
Tensile test on the steel fabric.
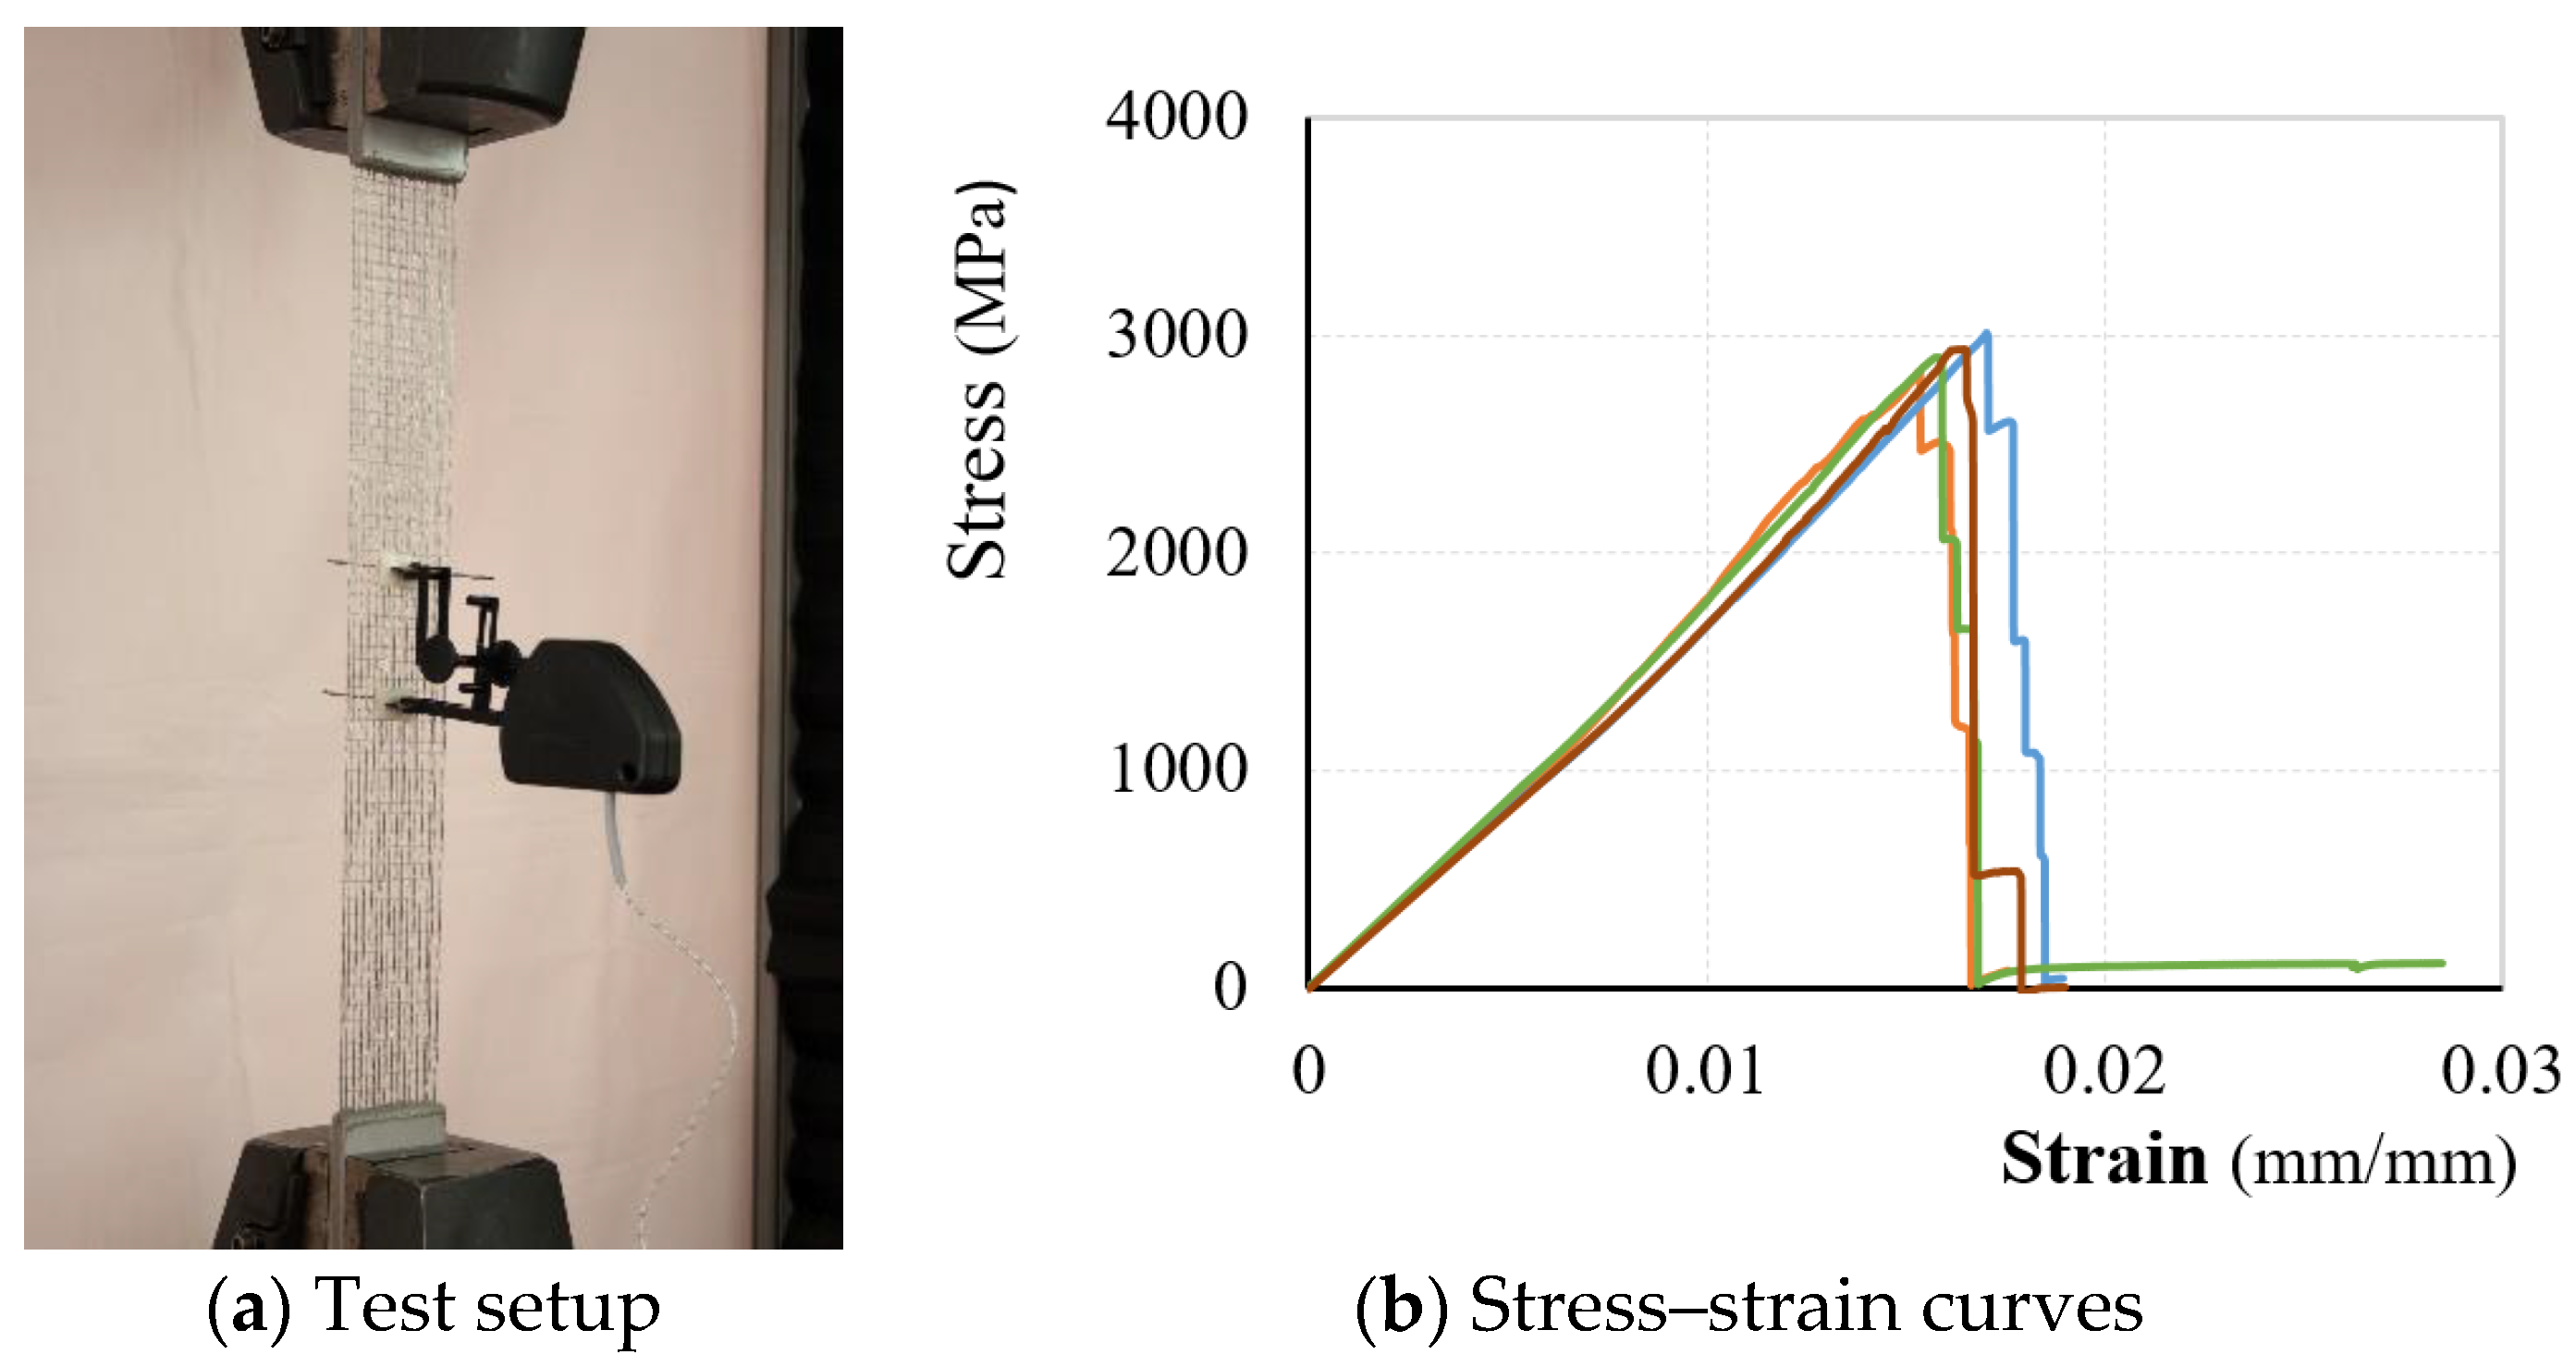
Figure 3.
Single-lap shear test set-up: (a) front view, (b) side view, and (c) top view (dimensions are in mm).
Figure 3.
Single-lap shear test set-up: (a) front view, (b) side view, and (c) top view (dimensions are in mm).

Figure 4.
Photos of single-lap direct-shear tests: (a) S-100-V1-2 specimen (bonded length l = 100 mm), (b) S-250-V1-1 specimen (bonded length l = 250 mm), and (c) S-330-V1-E-1 specimen (bonded length l = 330 mm).
Figure 4.
Photos of single-lap direct-shear tests: (a) S-100-V1-2 specimen (bonded length l = 100 mm), (b) S-250-V1-1 specimen (bonded length l = 250 mm), and (c) S-330-V1-E-1 specimen (bonded length l = 330 mm).

Figure 5.
S-330 series specimens: (a) crack along interface of chords and matrix, (b) surface of internal matrix layer after failure, and (c) cracking observed on surface of external matrix layer.
Figure 5.
S-330 series specimens: (a) crack along interface of chords and matrix, (b) surface of internal matrix layer after failure, and (c) cracking observed on surface of external matrix layer.
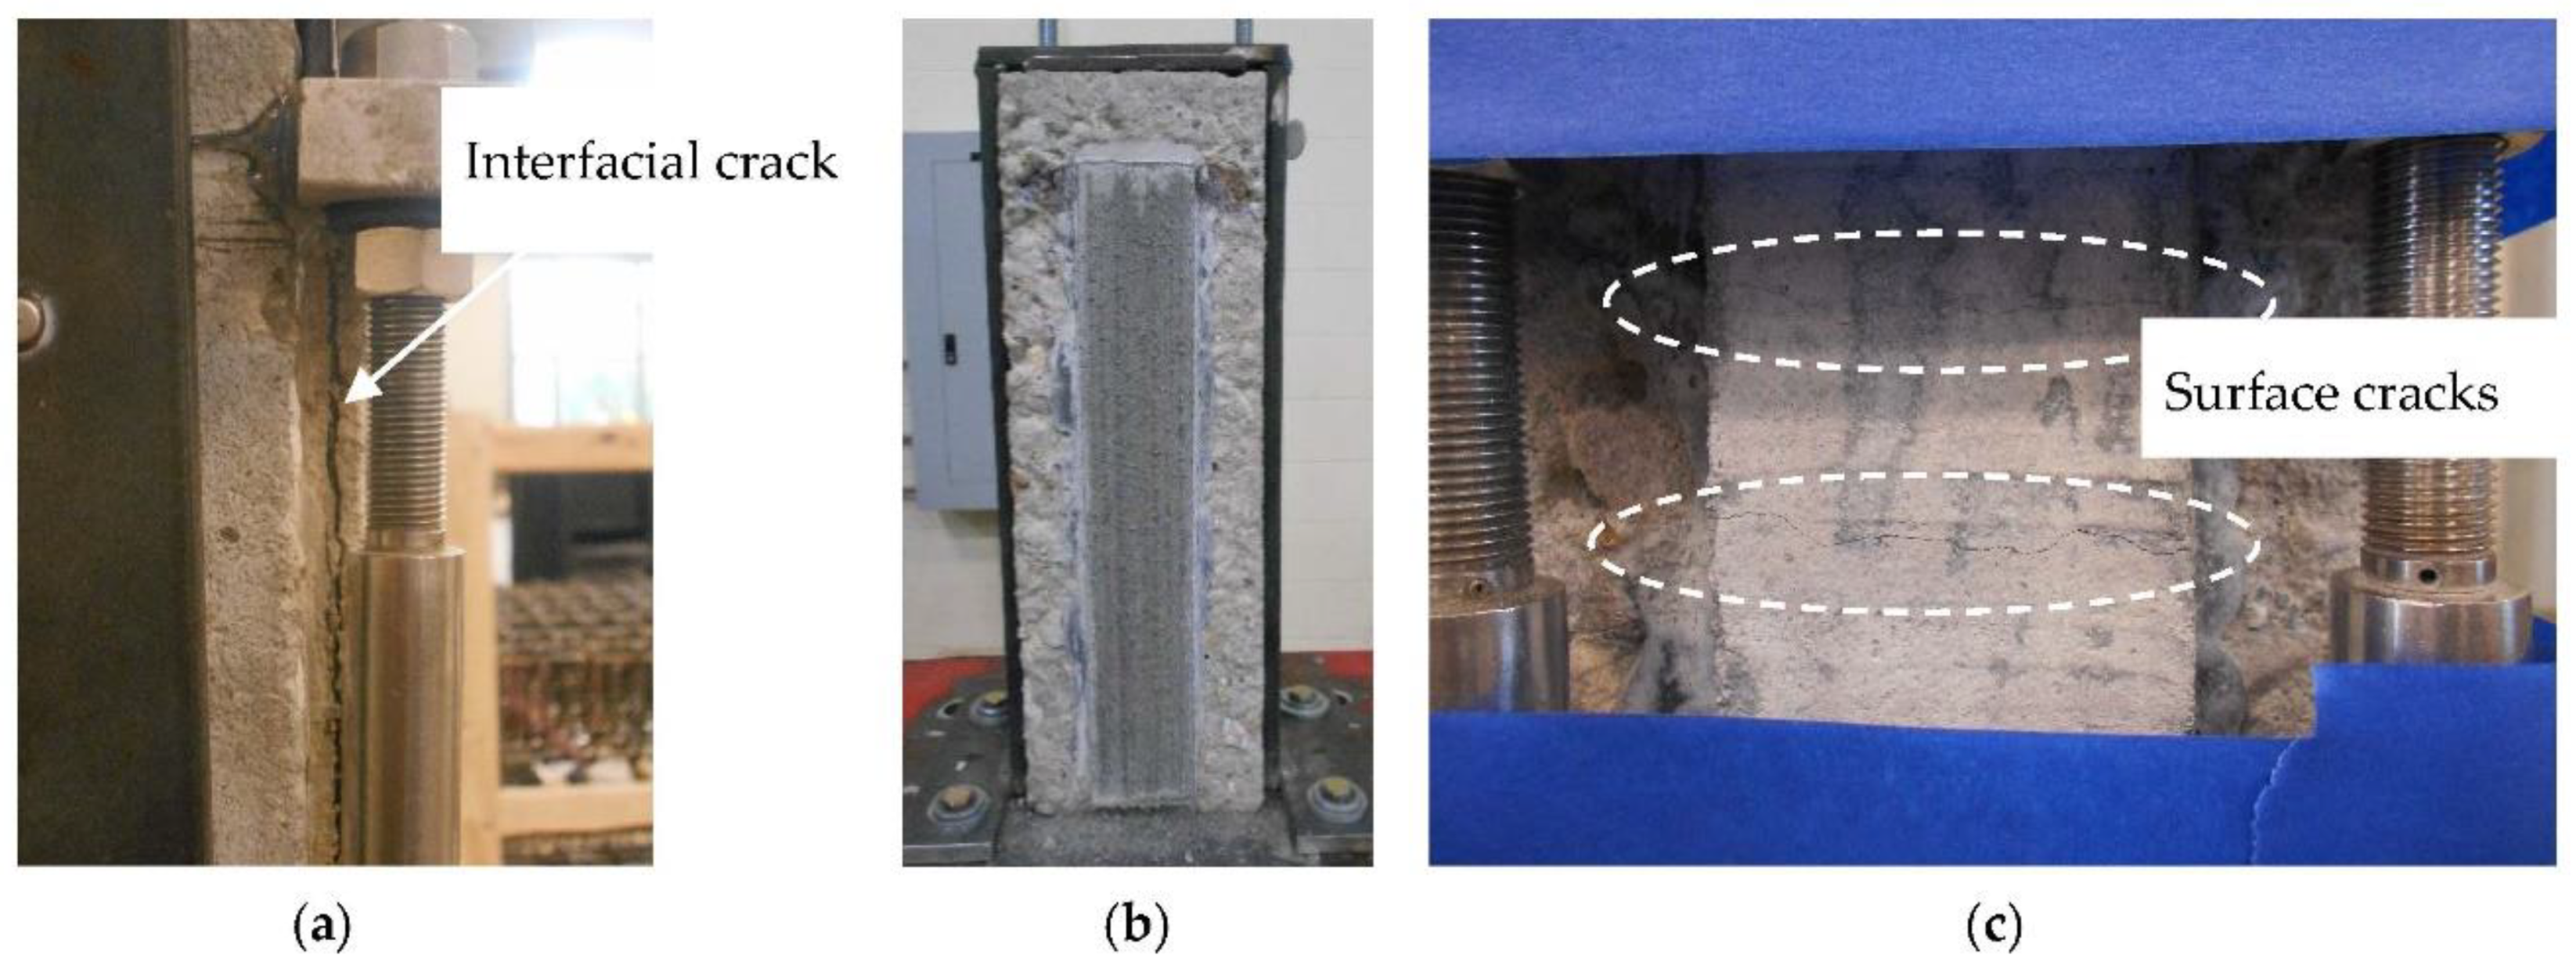
Figure 6.
Load-exploitation ratio diagram.
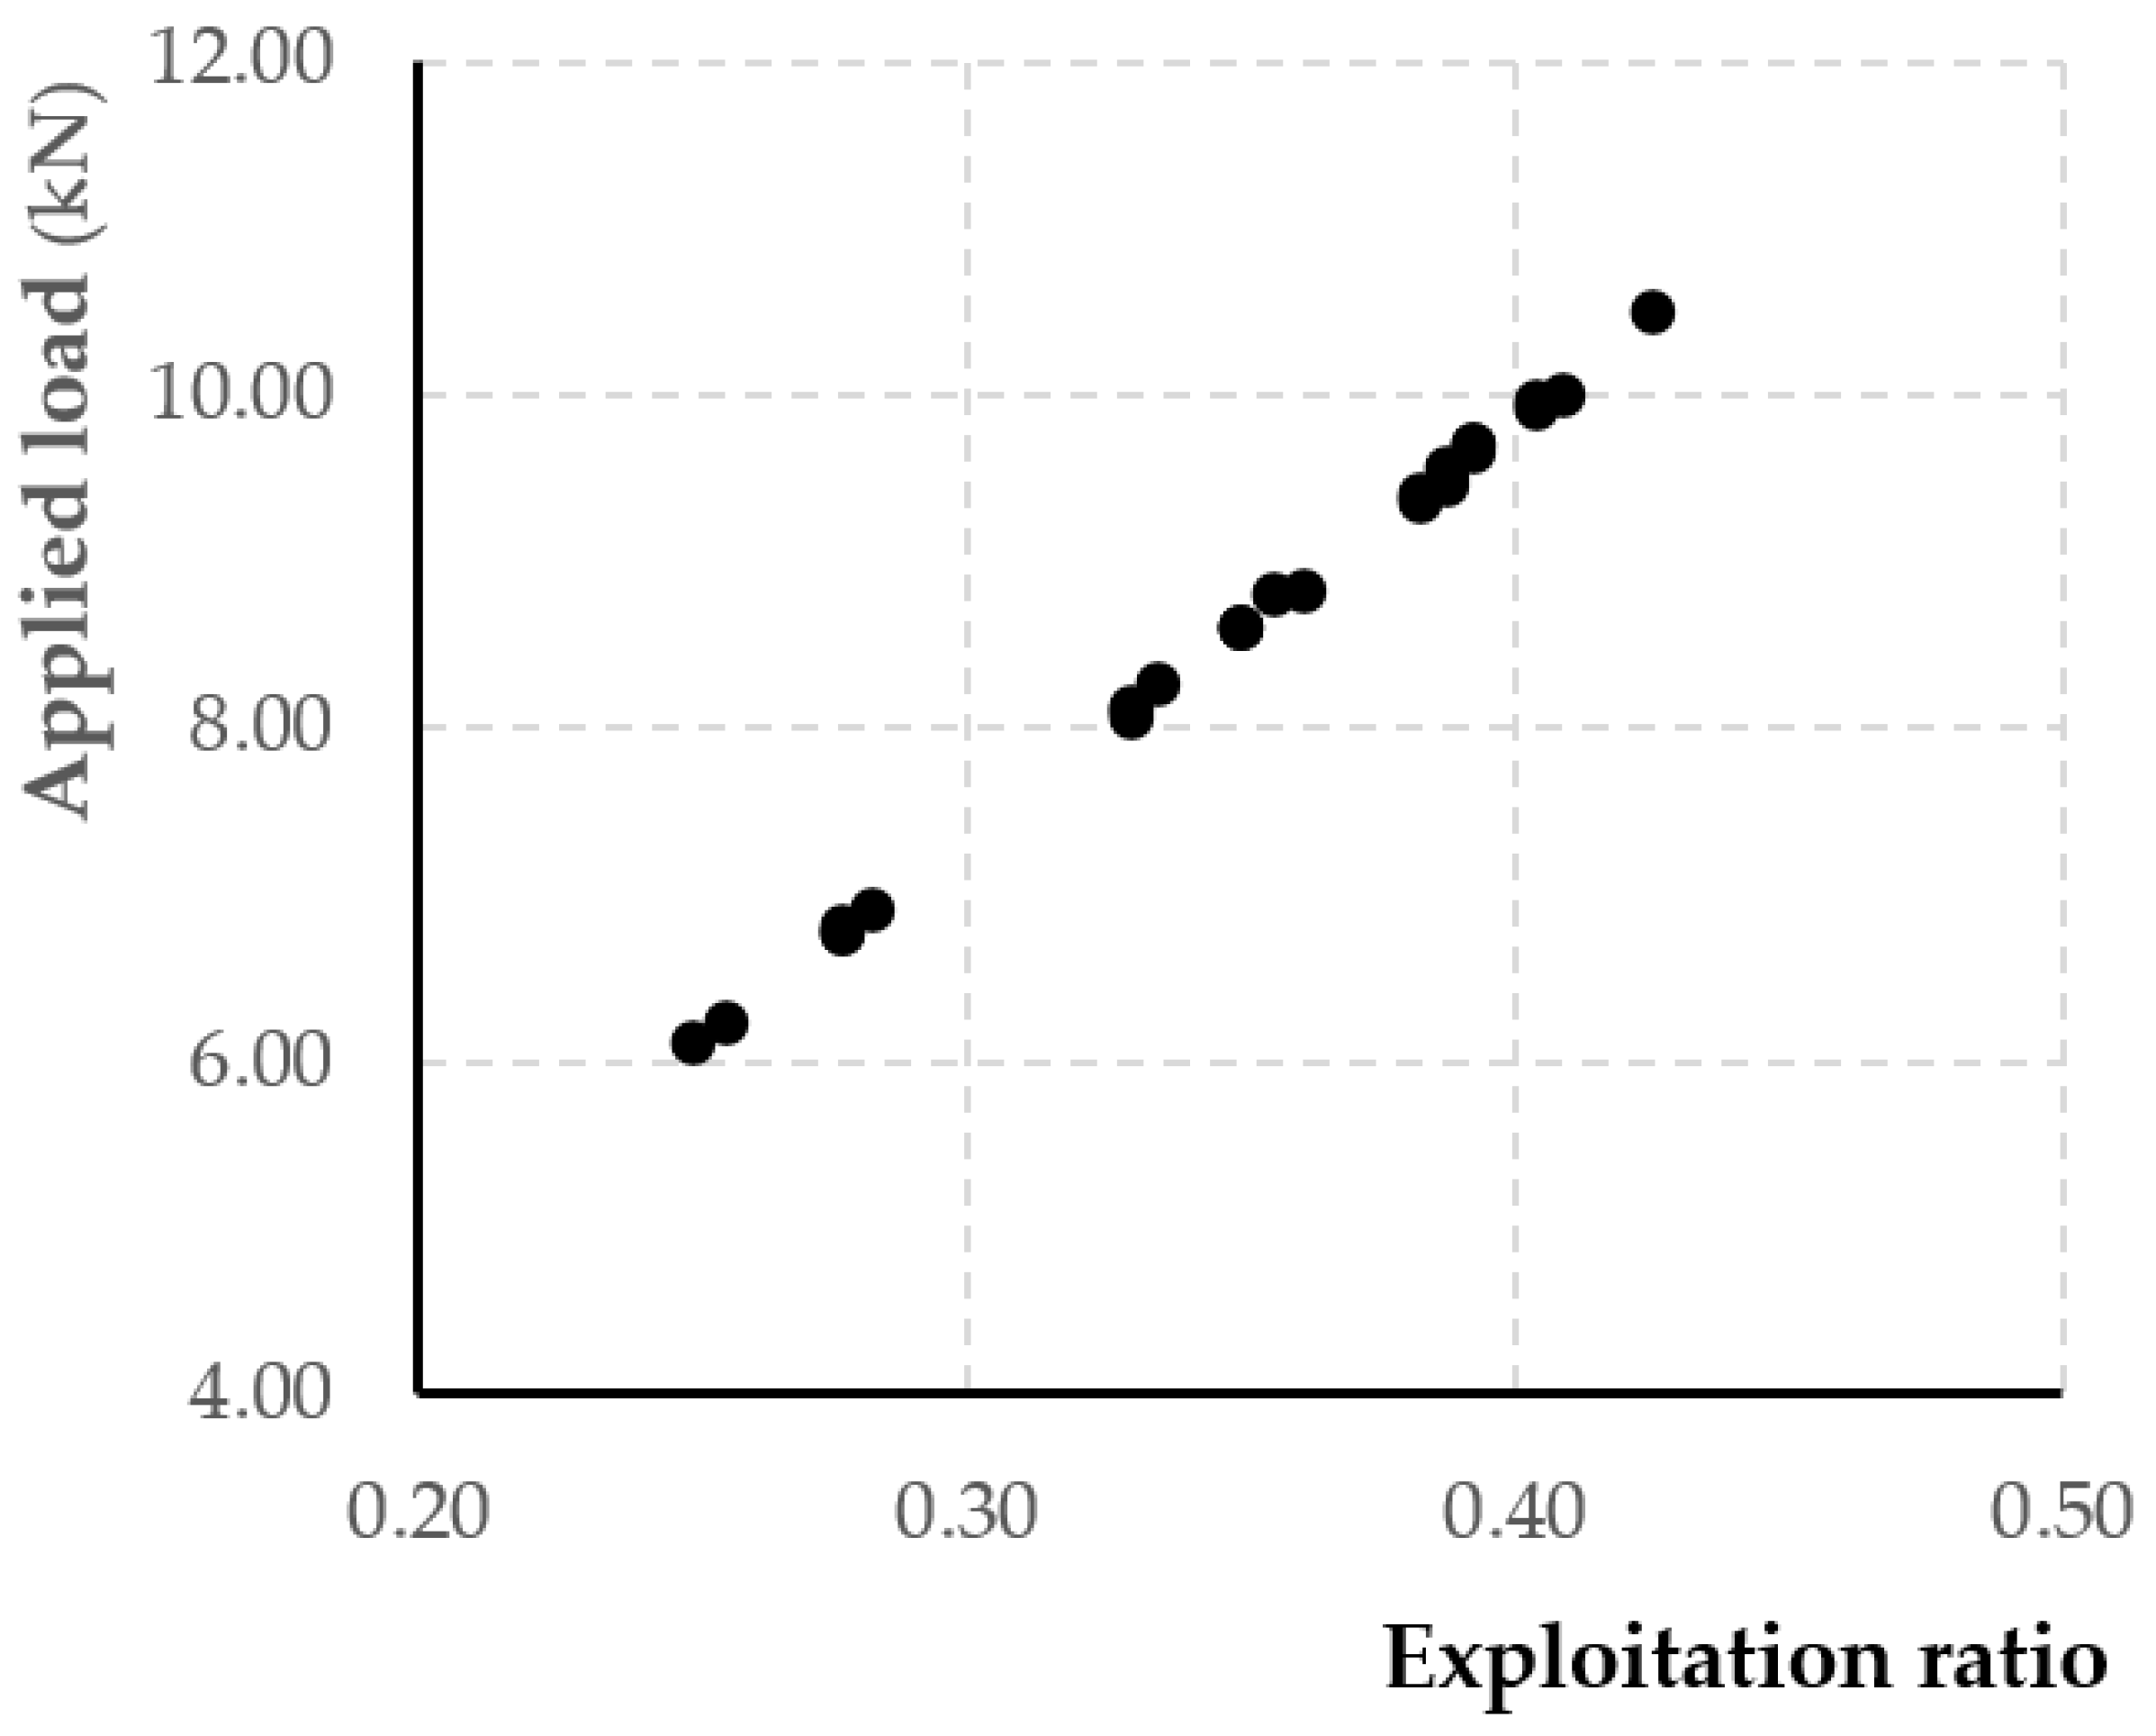
Figure 7.
Applied load P-global slip sg response of specimens with different bonded length.
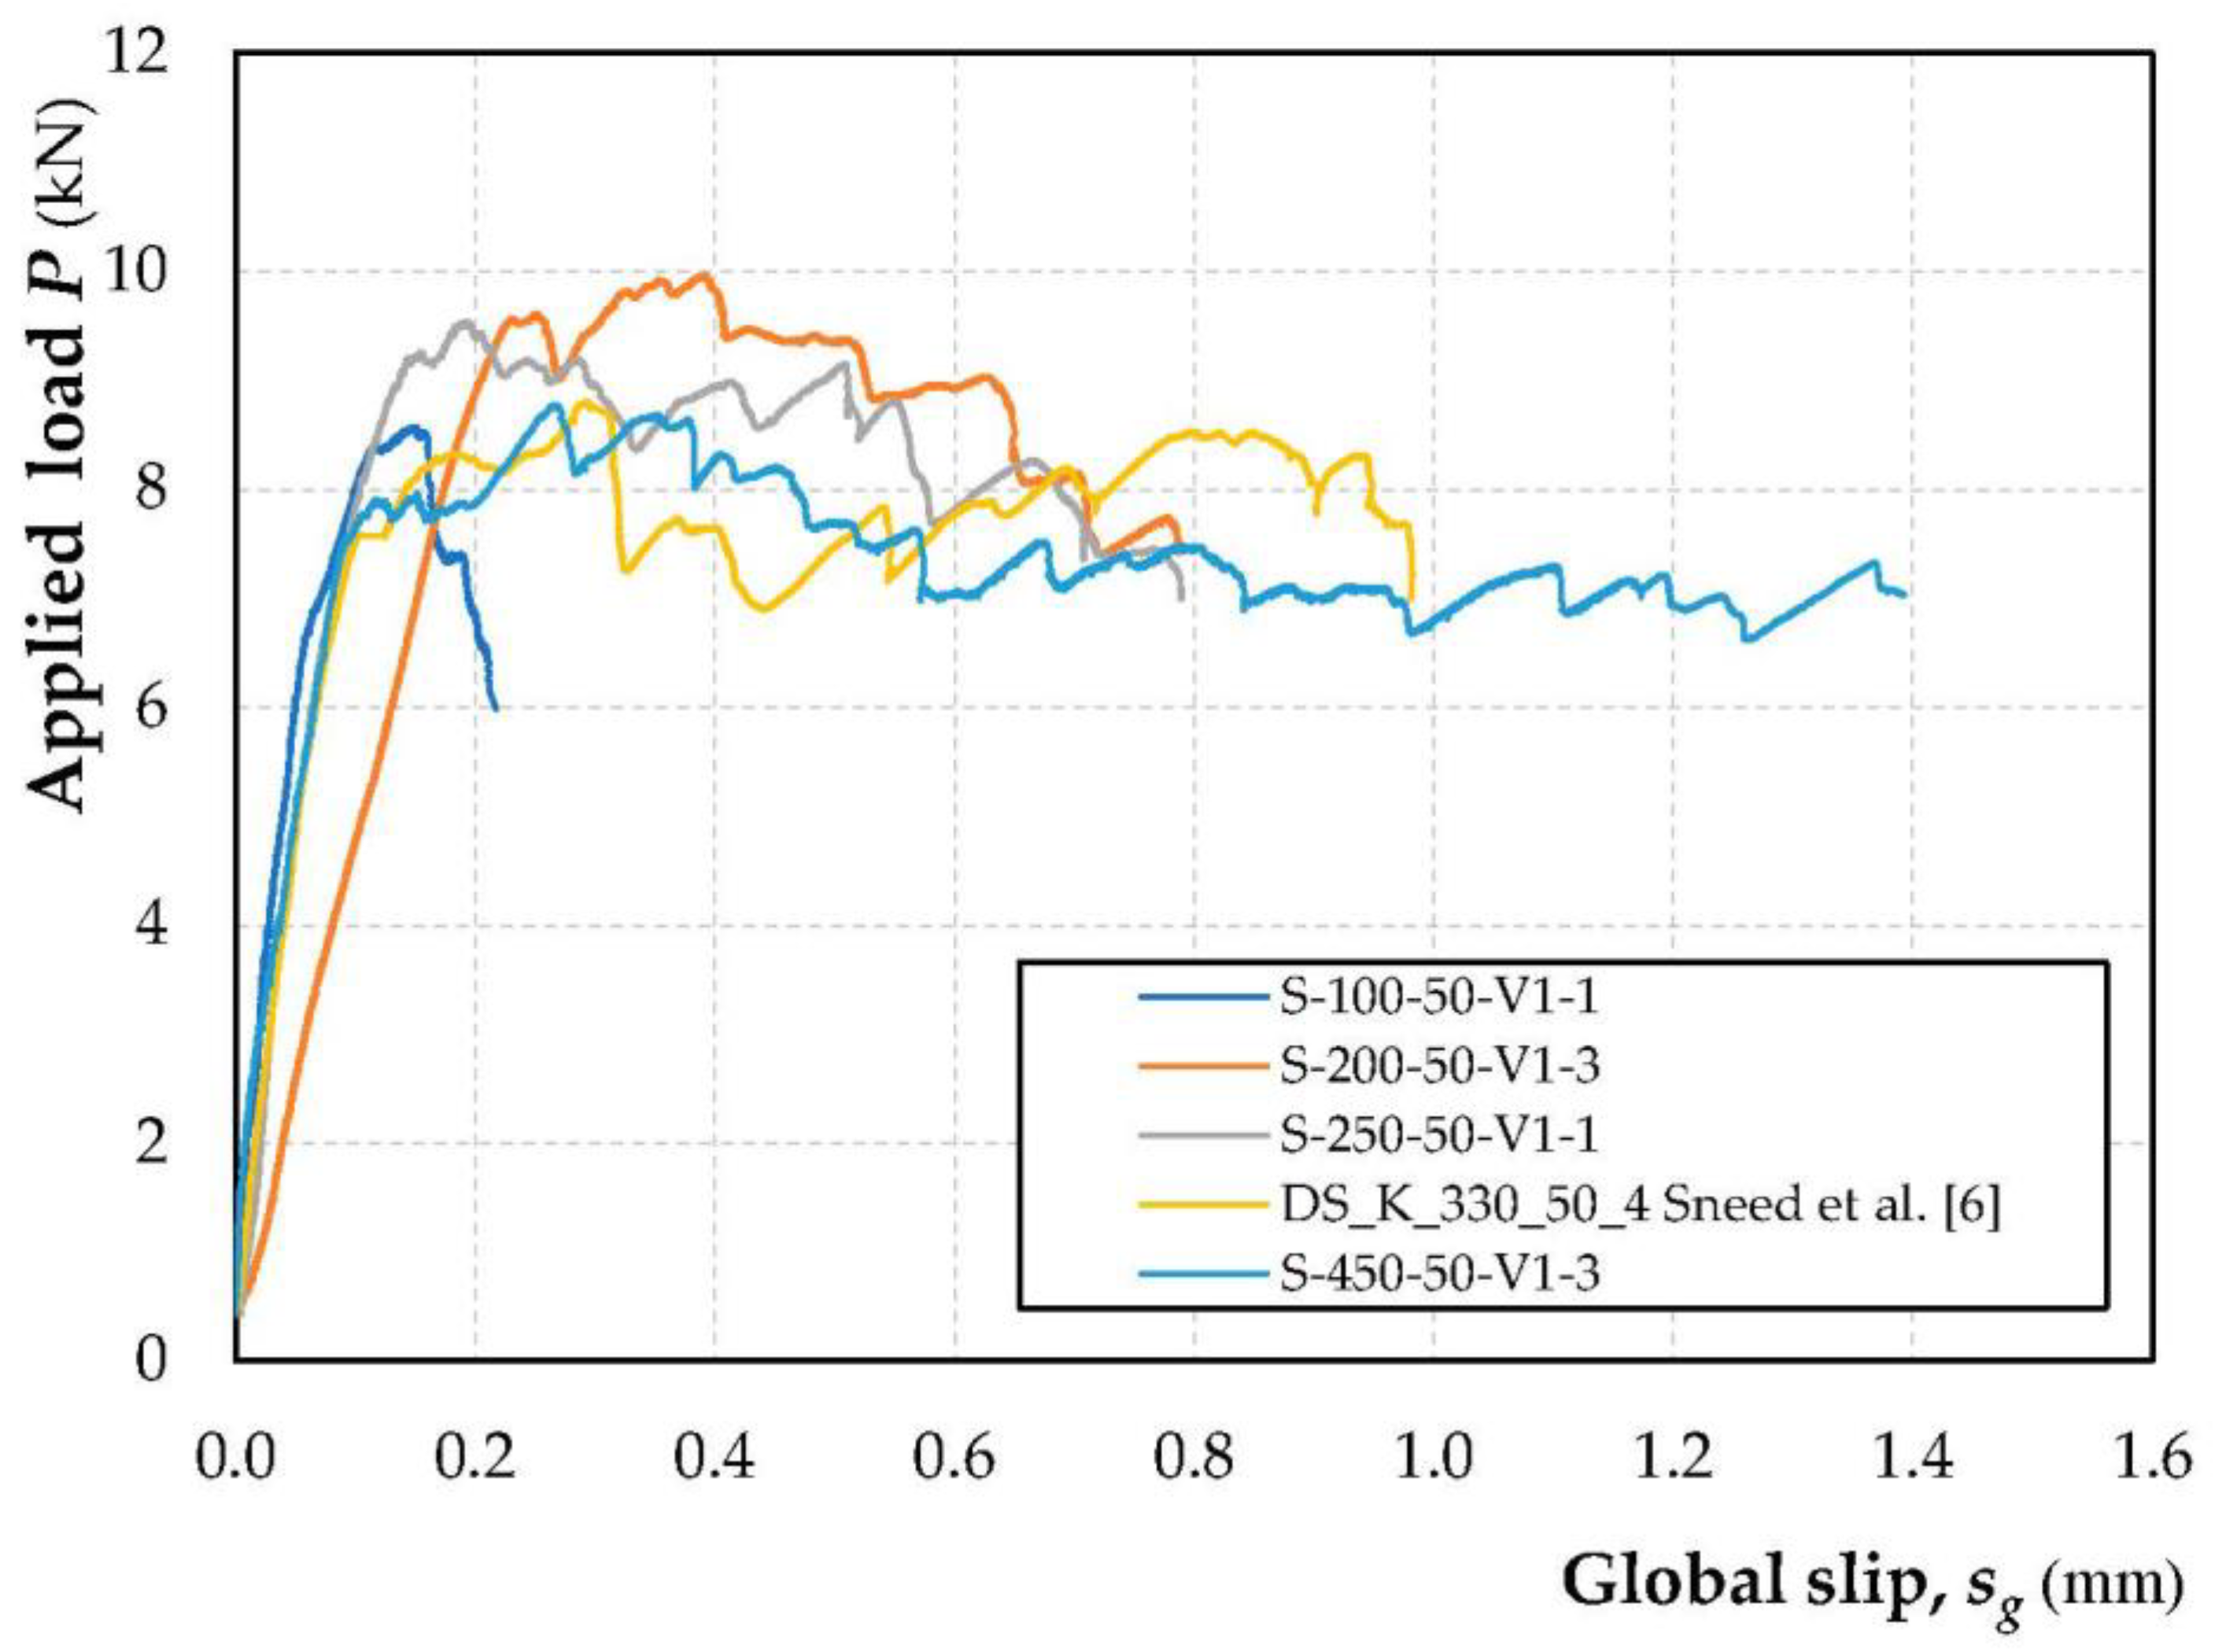
Figure 8.
Peak load, P*-bonded length specimens l.
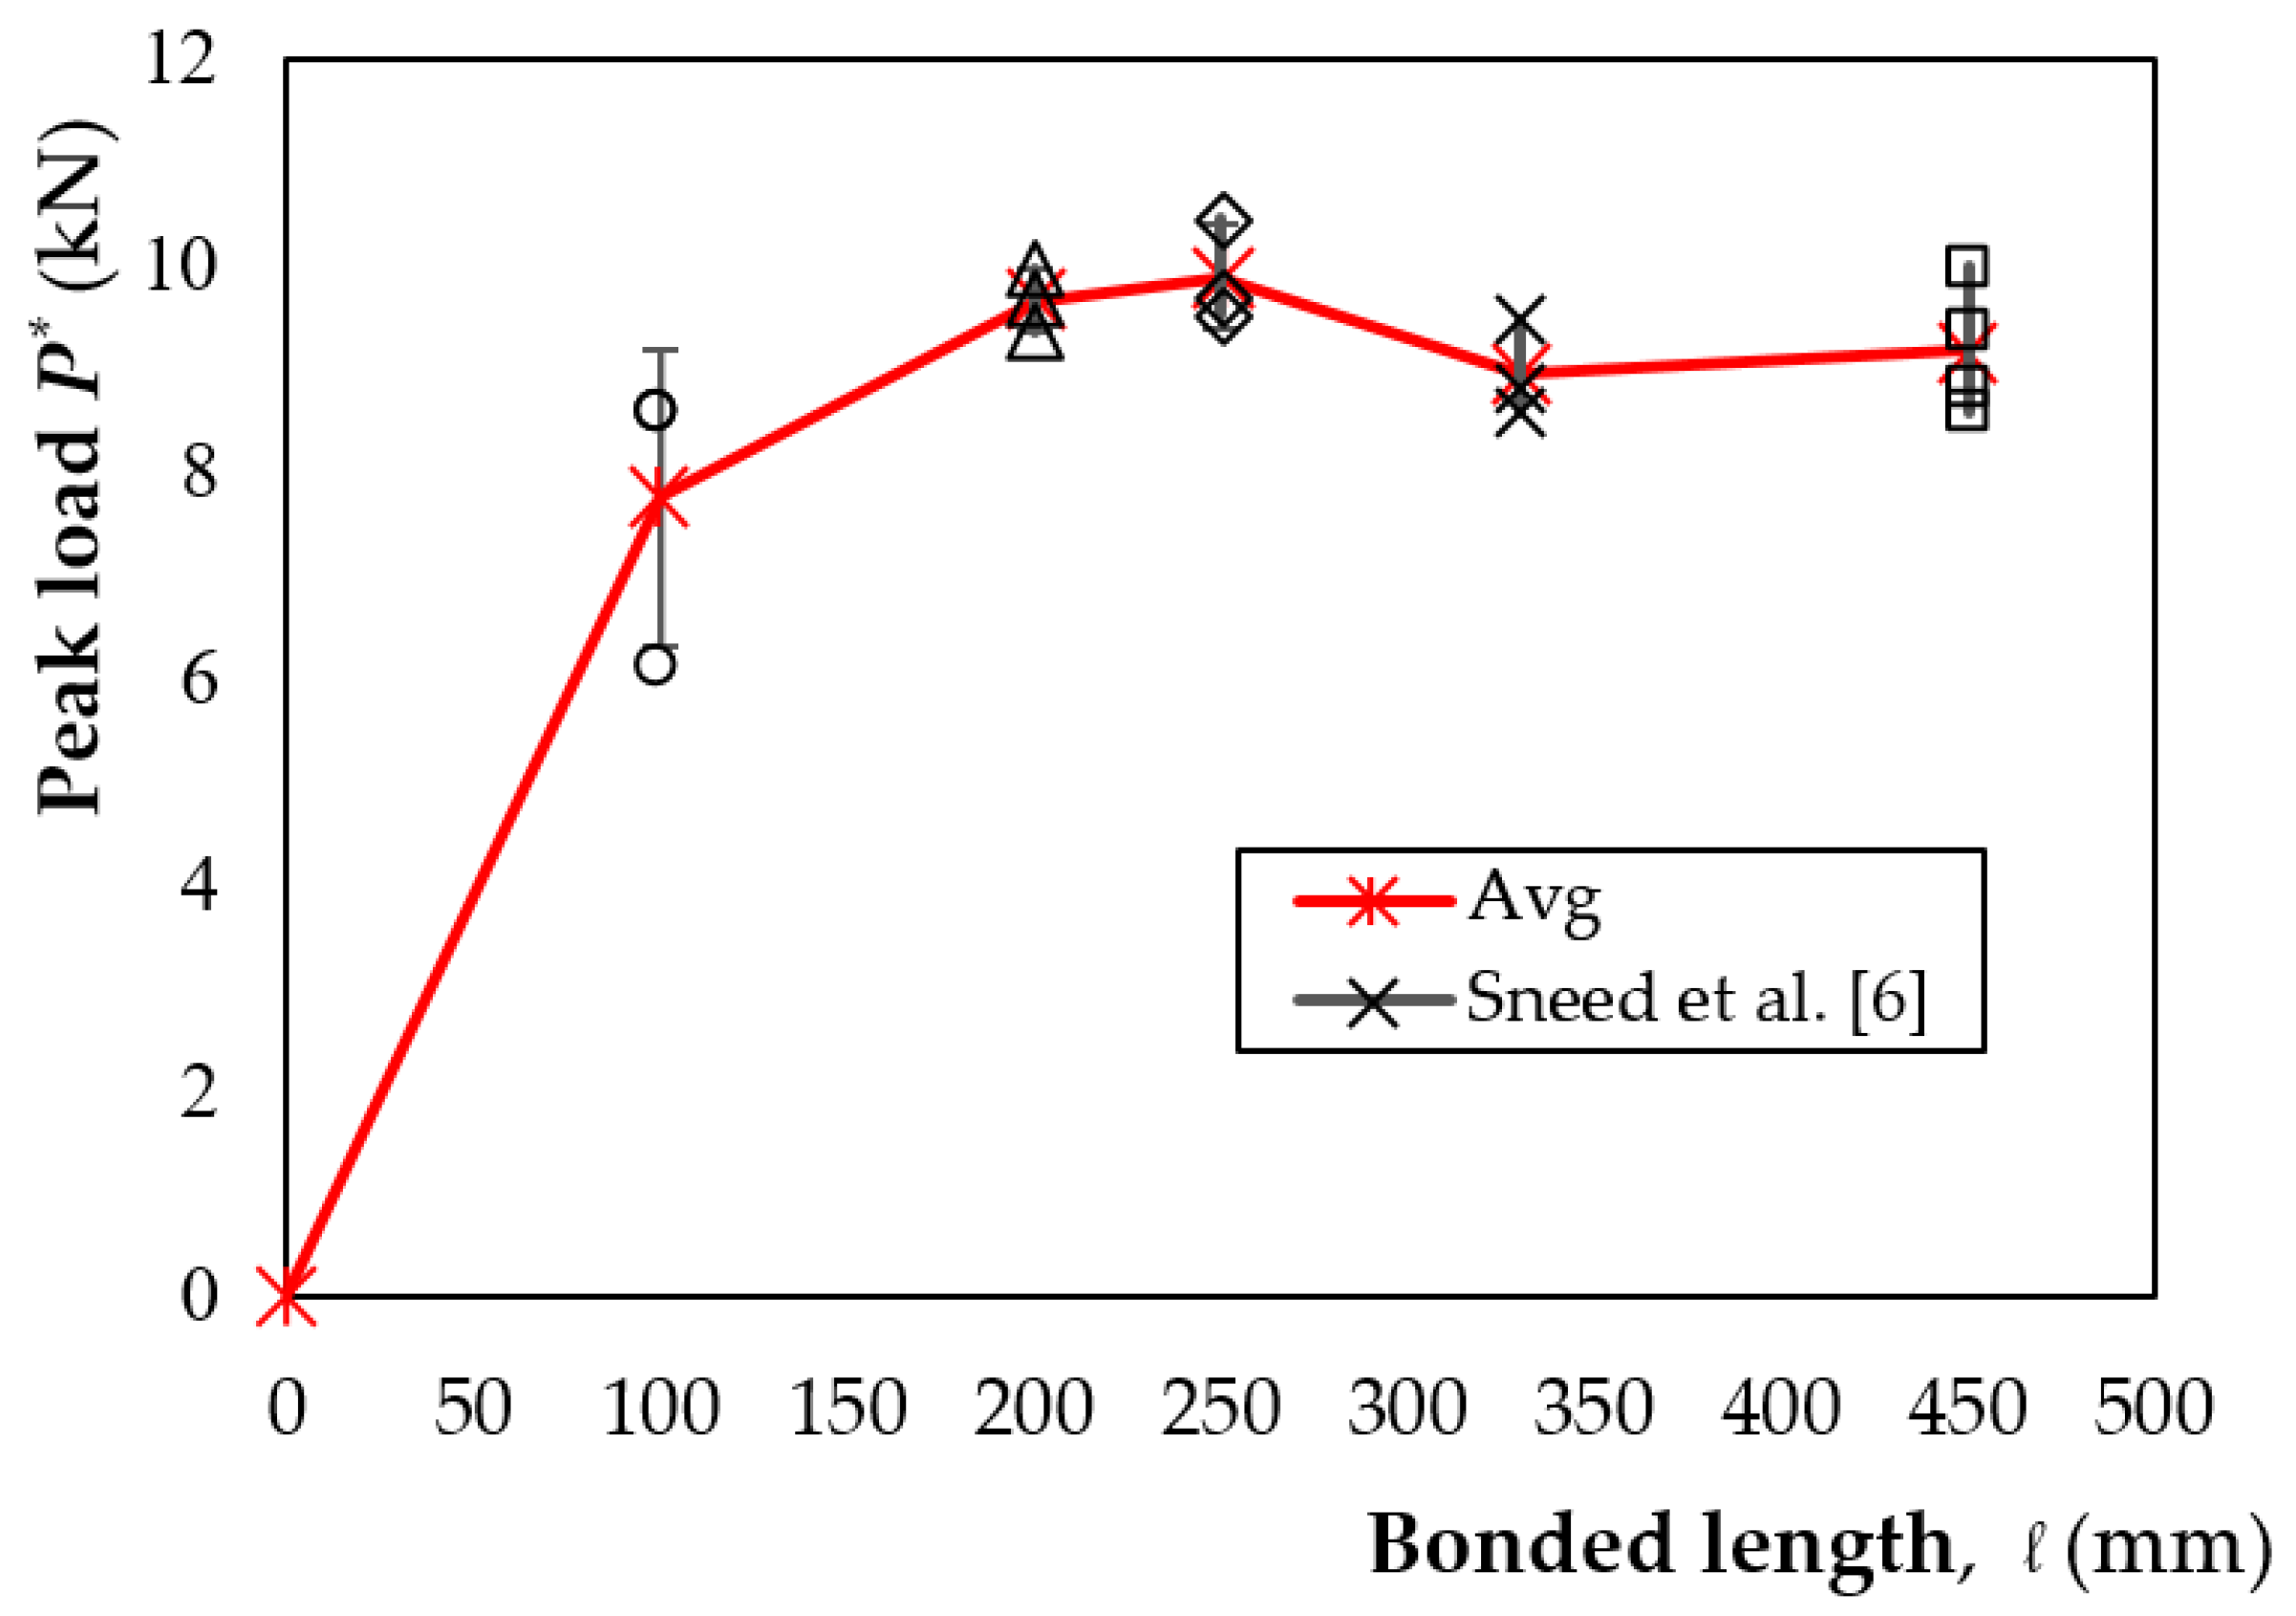
Figure 9.
Applied load, P-global slip sg response of specimens with different ages of the SRG.
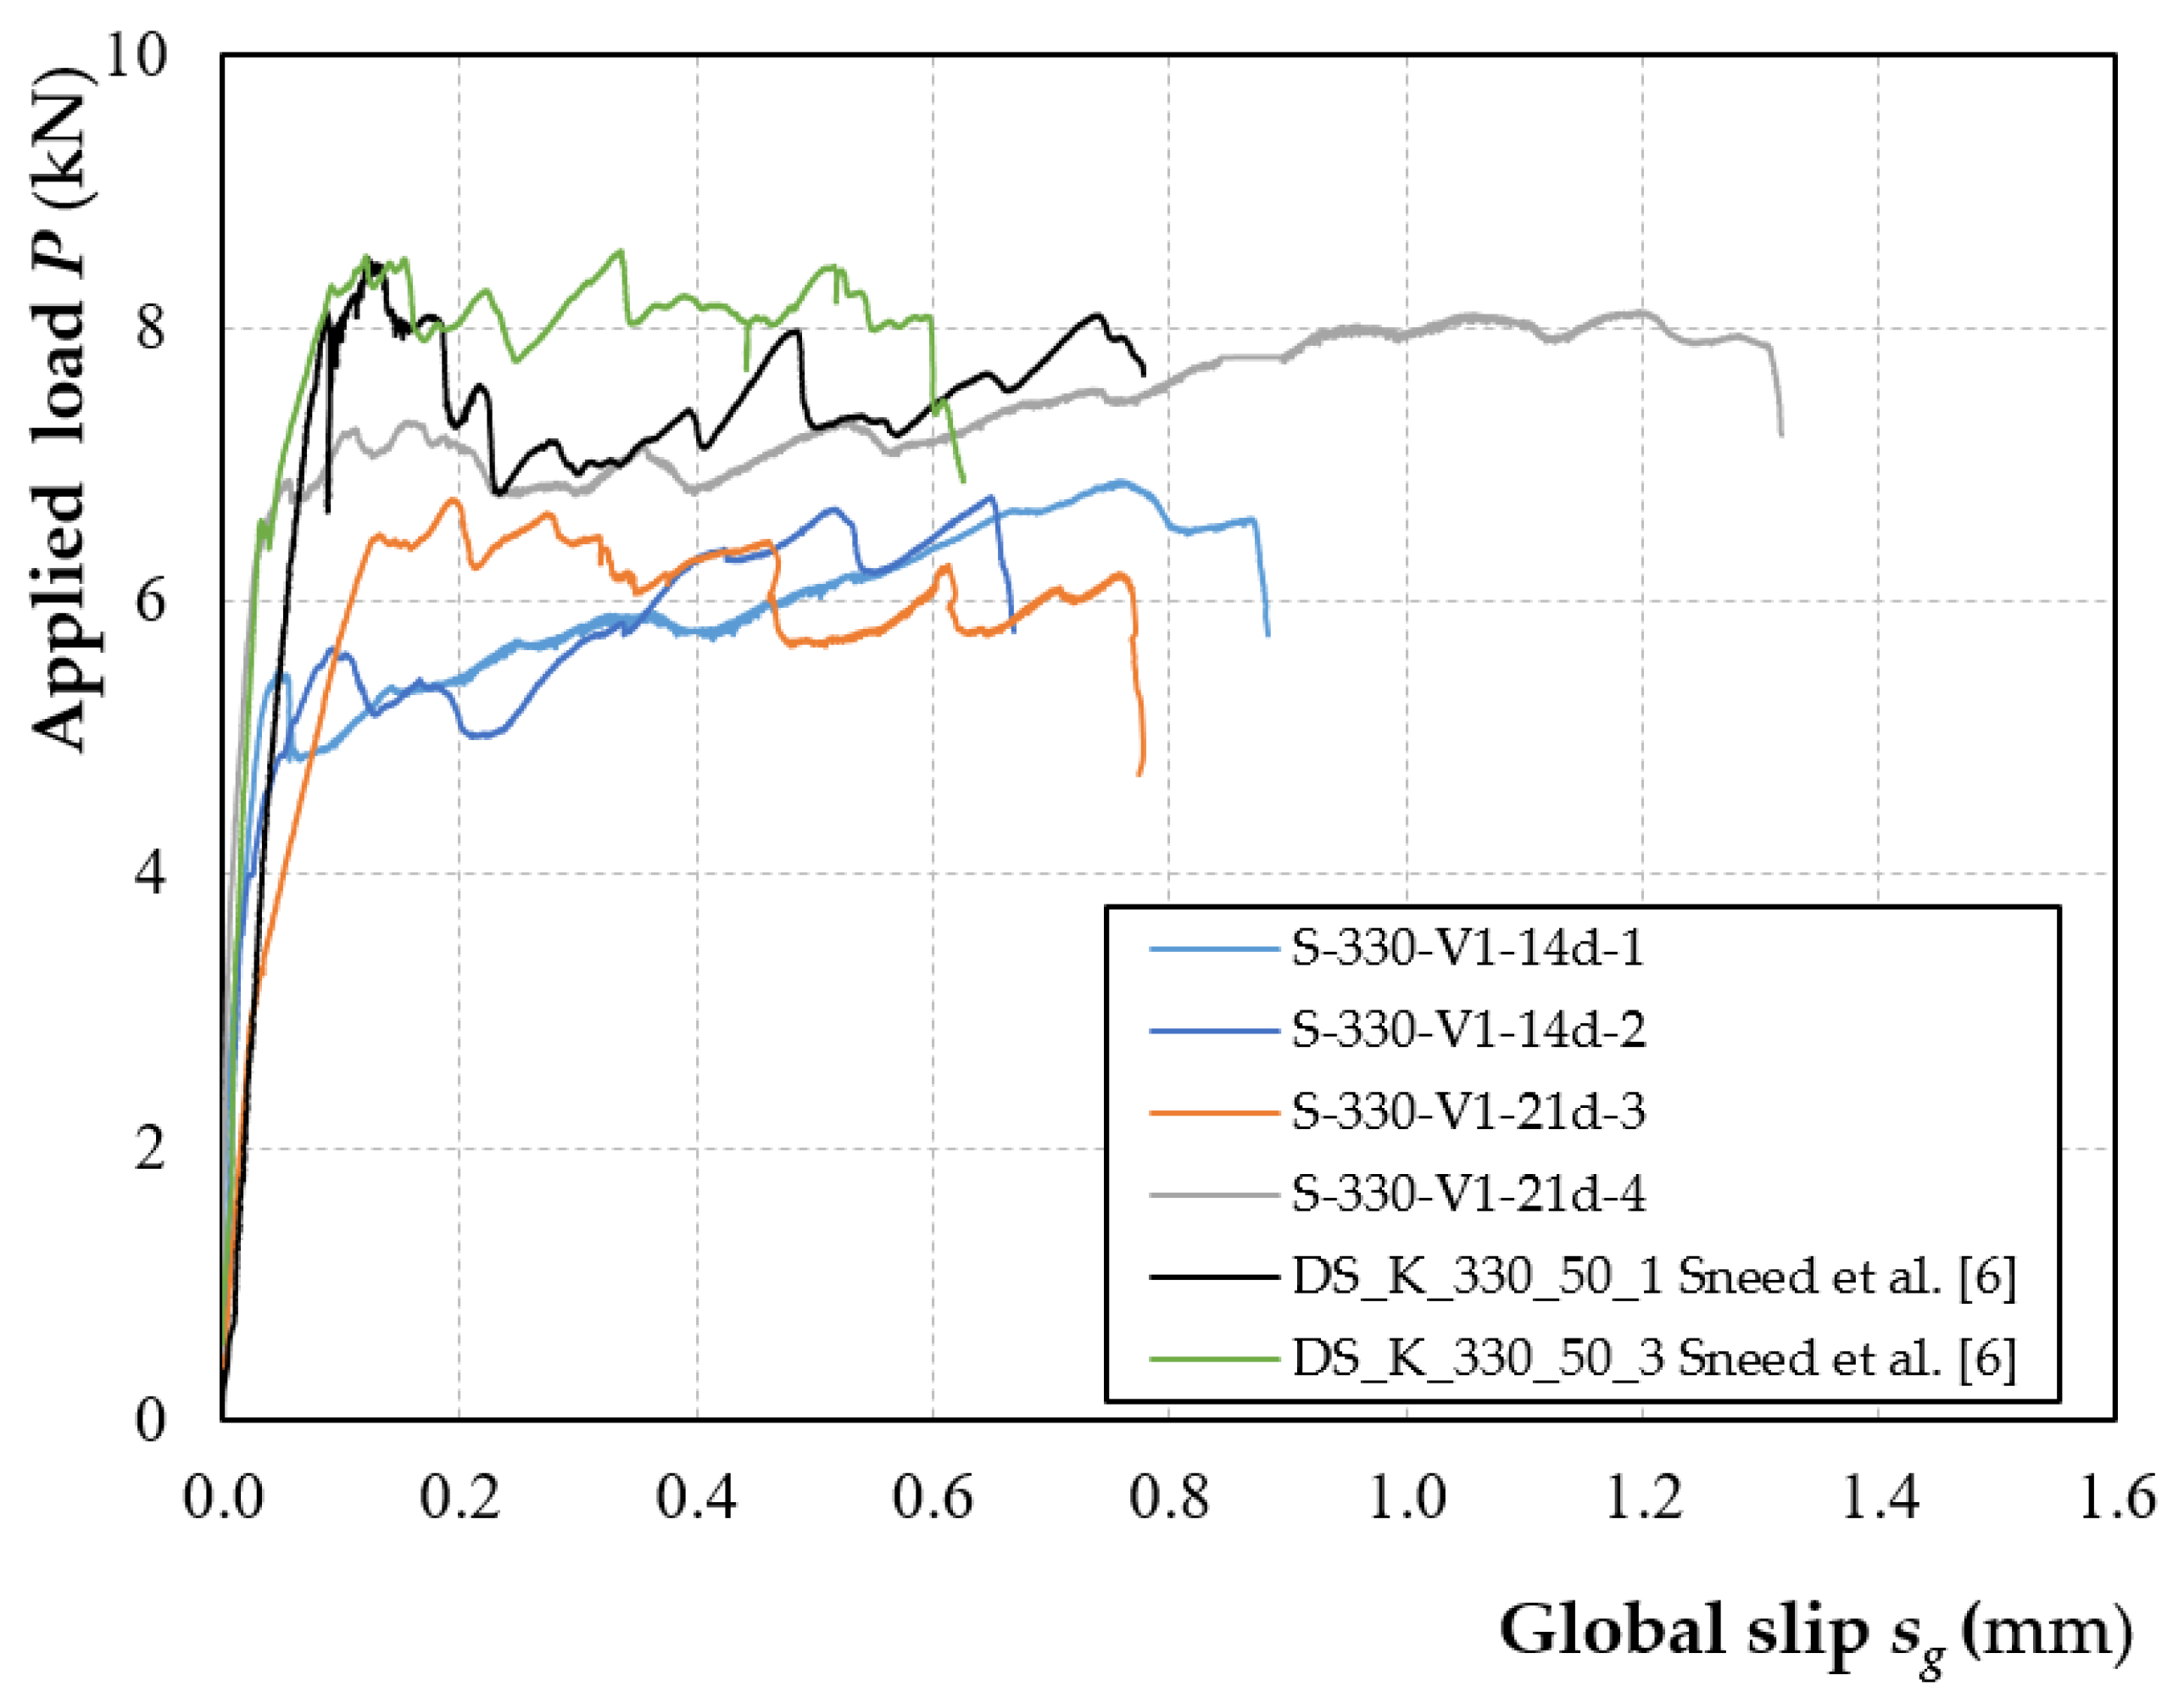
Figure 10.
Peak load, P*-curing time.

Figure 11.
Geometrical modeling and FE resolution.
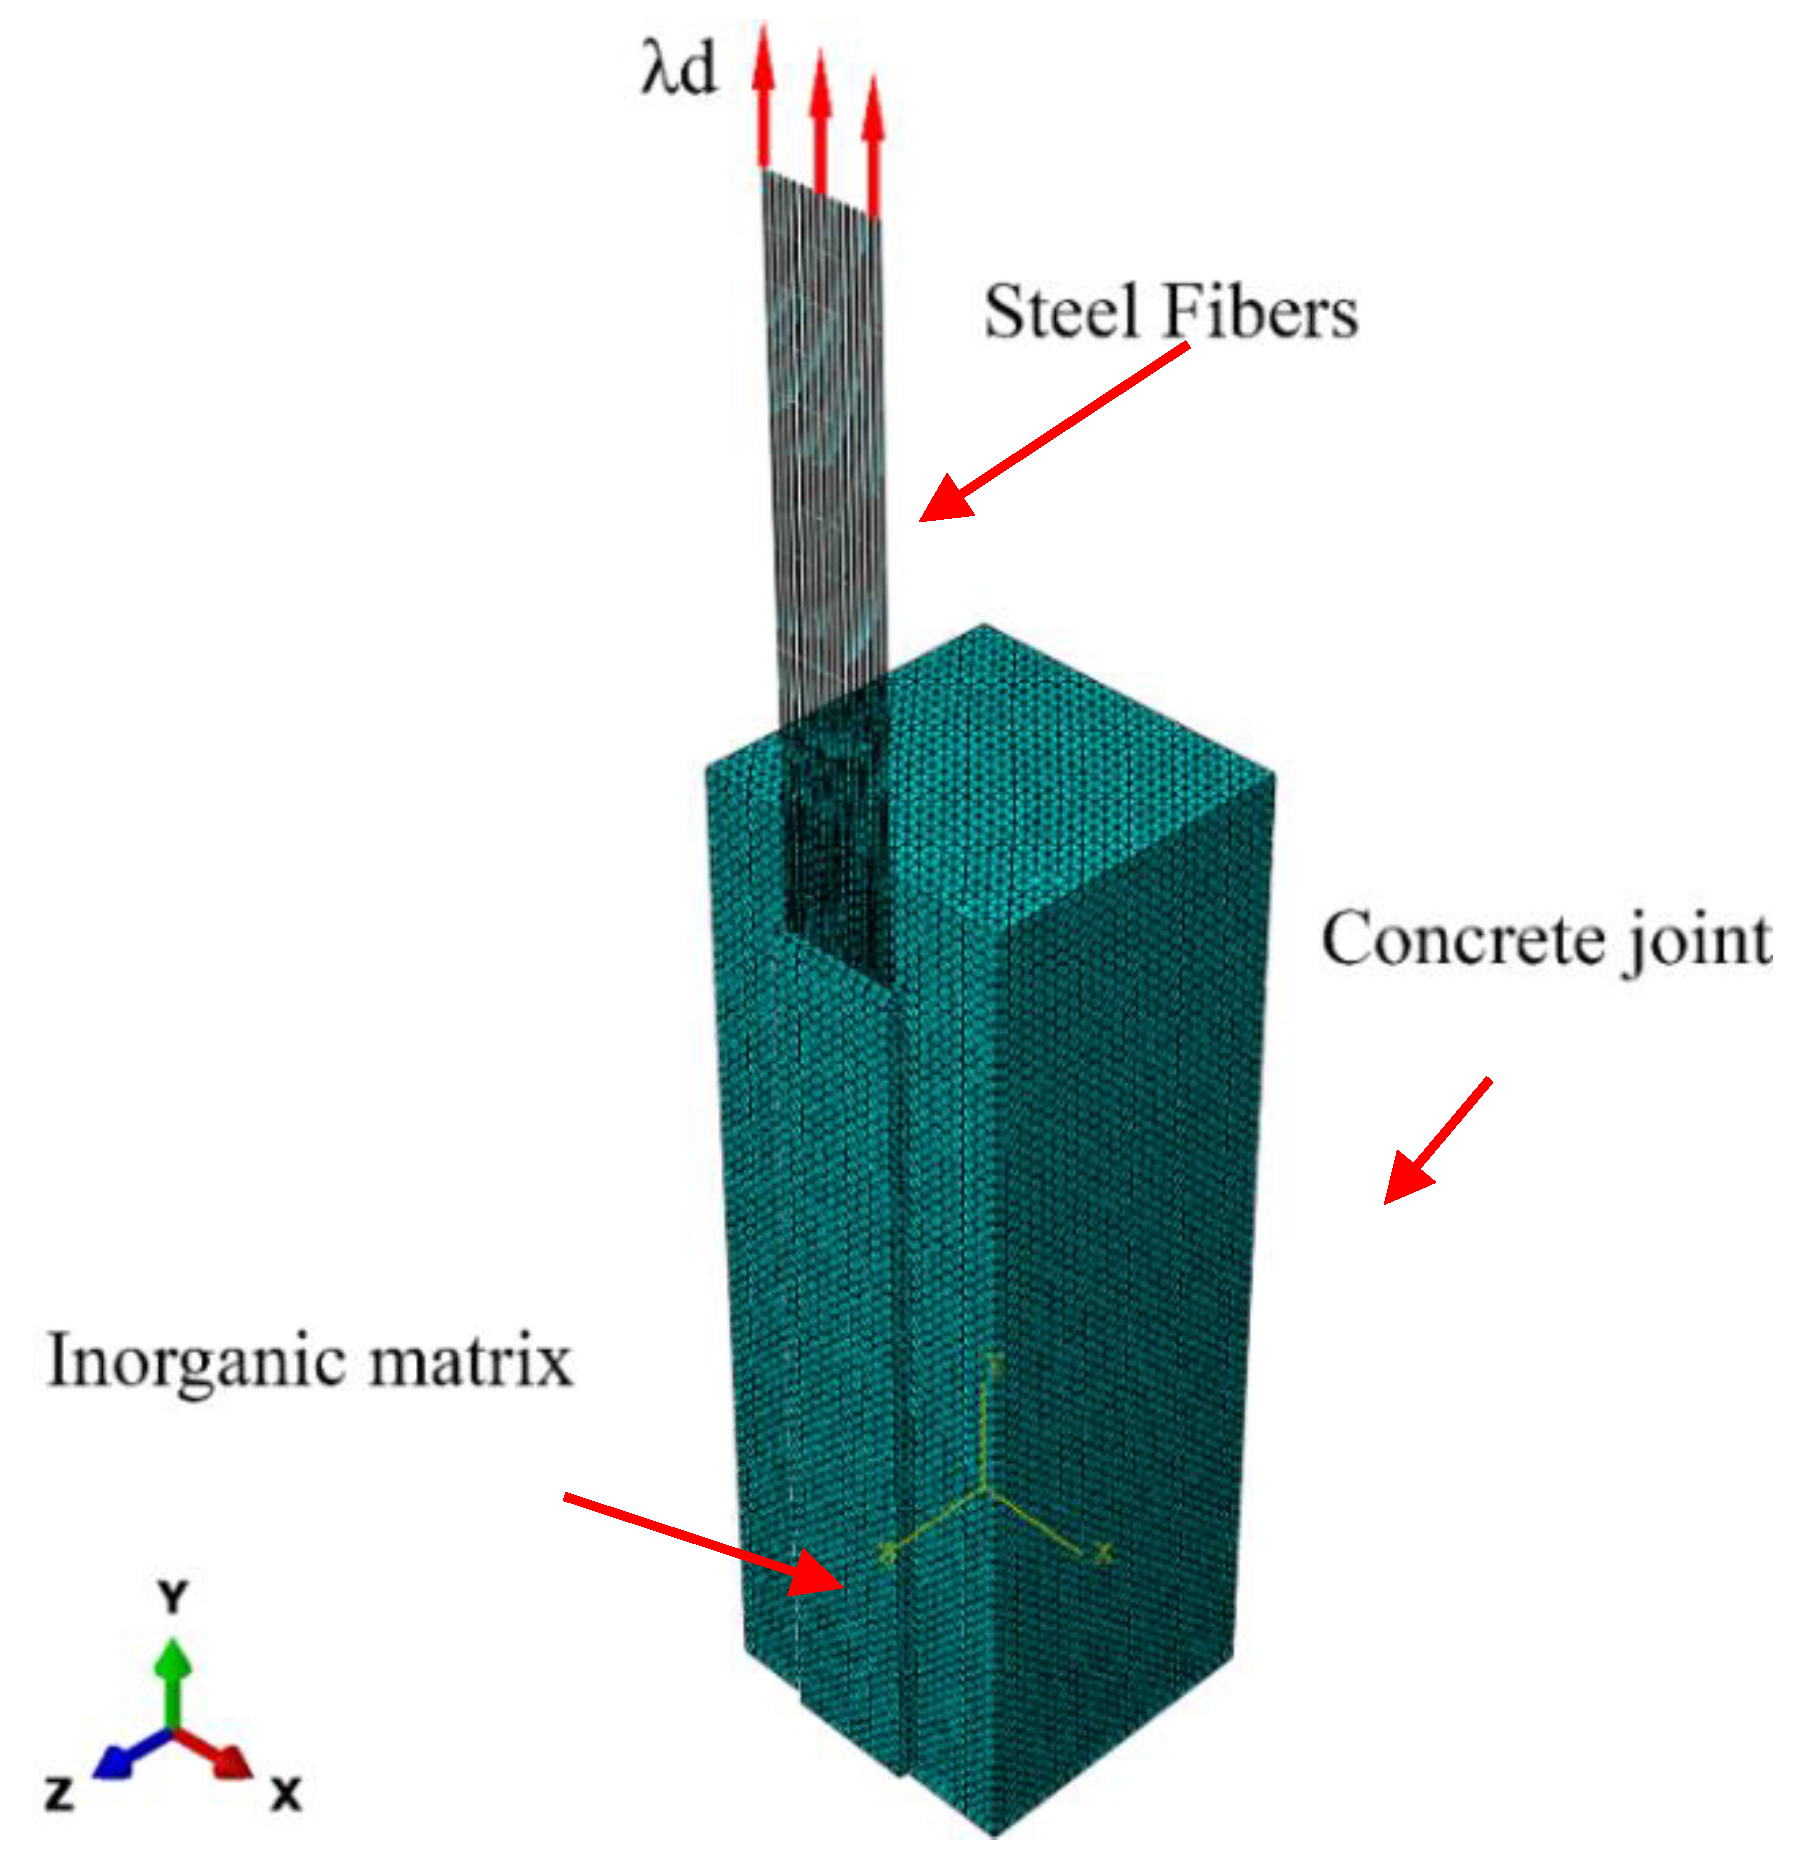
Figure 12.
Stress–strain relationship: (a) compression, (b) tension for concrete and matrix, and (c) tension for steel fibers.
Figure 12.
Stress–strain relationship: (a) compression, (b) tension for concrete and matrix, and (c) tension for steel fibers.
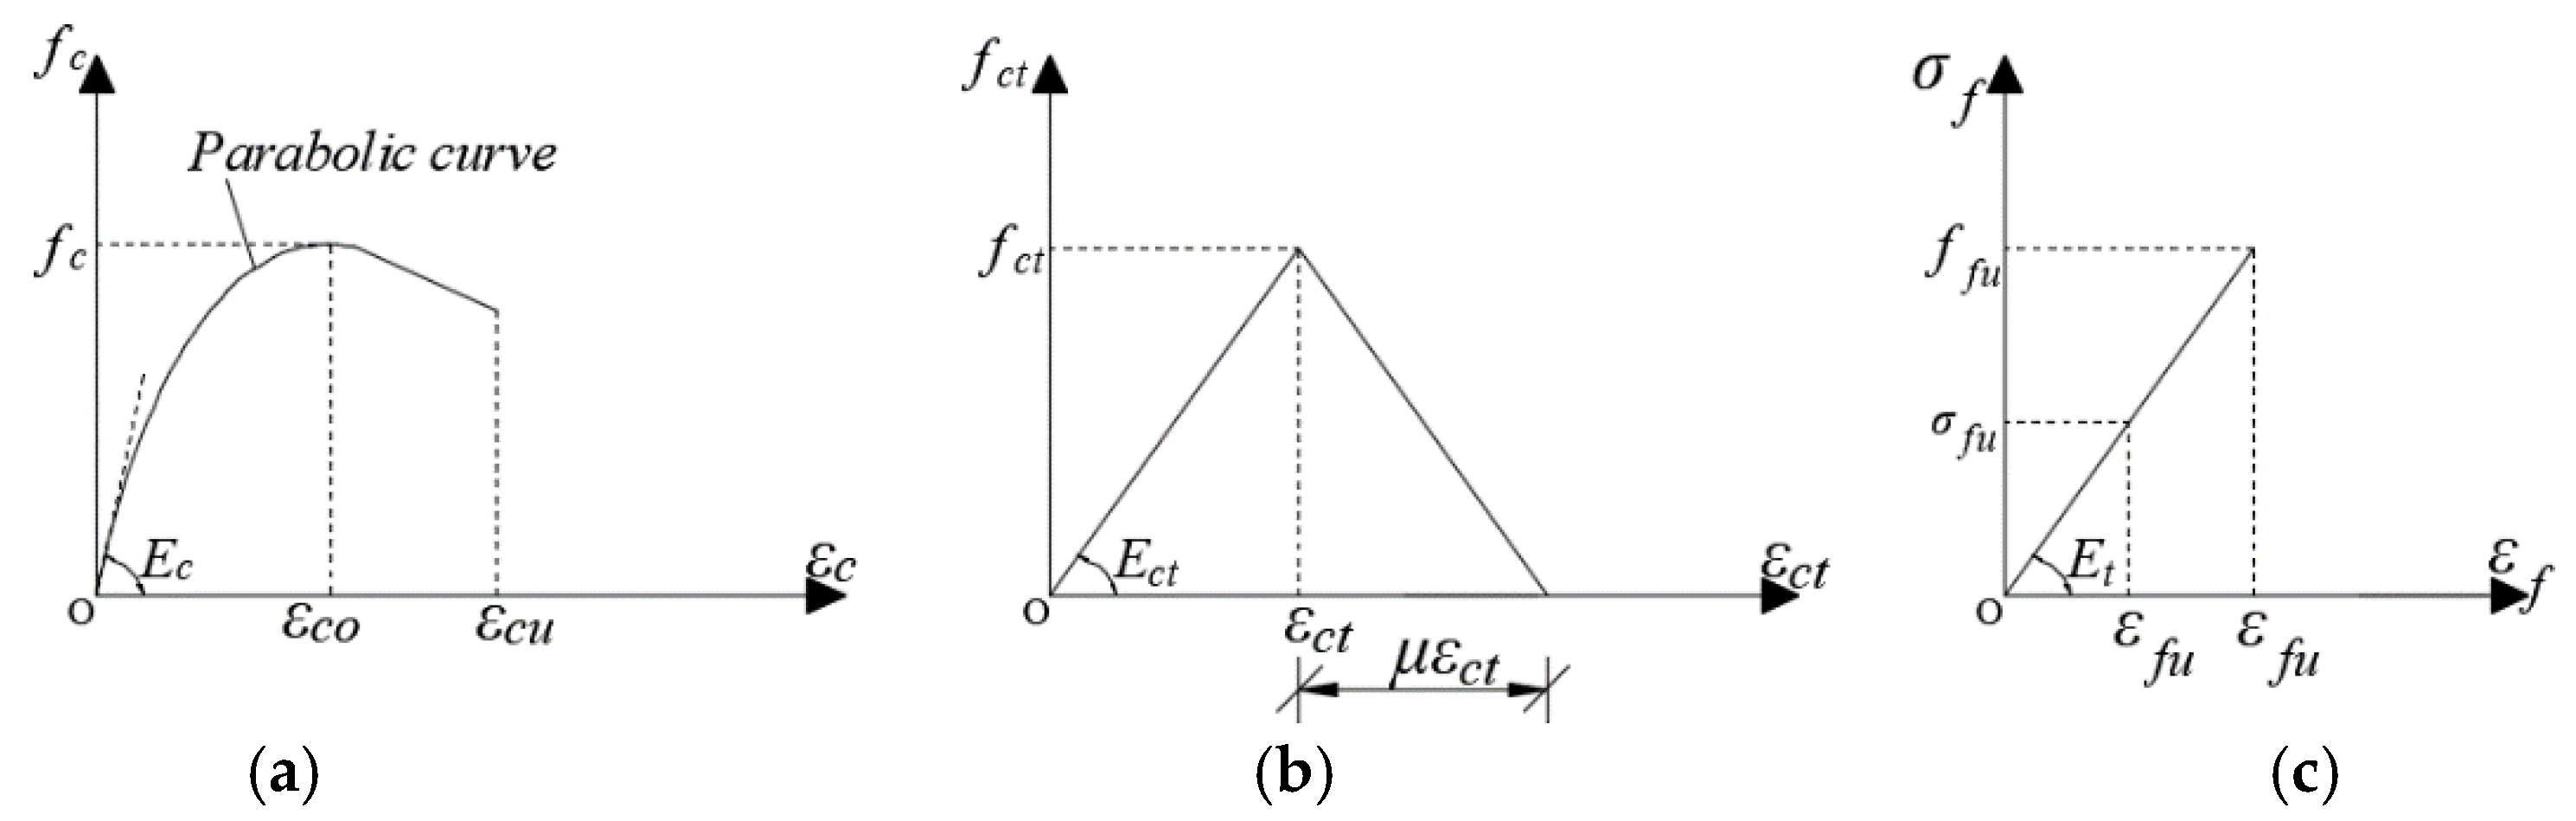
Figure 13.
Interaction surfaces: (a) front view and (b) back view.

Figure 14.
Comparison between the experimental curves and numerical model: (a) present investigation (specimens with bonded length l = 250 mm), and (b) Sneed et al. [6] investigation (l = 330 mm).
Figure 14.
Comparison between the experimental curves and numerical model: (a) present investigation (specimens with bonded length l = 250 mm), and (b) Sneed et al. [6] investigation (l = 330 mm).

Figure 15.
Crack pattern at different load level for the numerical model.

Figure 16.
Comparison between the crack pattern: (a) of the numerical model and (b) of the specimen S-250-V1-2.
Figure 16.
Comparison between the crack pattern: (a) of the numerical model and (b) of the specimen S-250-V1-2.


Table 1.
Mechanical properties of concrete batches.
| Concrete Batch | Compressive Strength (MPa) (C.o.V.) | Tensile Strength (MPa) (C.o.V.) |
|---|---|---|
| C1 | 31.5 (0.02) | 3.1 (0.05) |
| C2 | 40.9 (0.03) | 3.5 (0.08) |
Table 2.
Mechanical properties of the steel fiber sheet.
| Elastic Modulus (GPa) (C.o.V.) | Tensile Stress (GPa) (C.o.V.) | Ultimate Strain (mm/mm) (C.o.V.) | |
|---|---|---|---|
| Steel fabric | 200 (0.081) | 3.01 (0.010) | 0.020 (0.08) |
Table 3.
Mechanical properties of matrix batches.
| Matrix Batch | Compressive Strength (MPa) (C.o.V.) | Tensile Strength (MPa) (C.o.V.) |
|---|---|---|
| M1 | 20.53 (0.12) | 2.65 (0.21) |
| M2 | 25.96 (0.03) | 2.61 (0.27) |
| M3 | 28.27 (0.14) | 2.63 (0.21) |
| M4 | 37.31 (0.04) | 4.22 (0.18) |
Table 4.
Test results.
| Specimens | Concrete/Mortar Batch | Peak Load, P* (kN) | Peak Stress, σ* (MPa) | Exploitation Ratio, σ*/ffu | Average Values of σ*/ffu | εf |
|---|---|---|---|---|---|---|
| S-100-V1-1 | C2/M4 | 8.57 | 670 | 0.351 | 0.301 | 0.003268 |
| S-100-V1-2 | C2/M4 | 6.09 | 480 | 0.251 | 0.002341 | |
| S-200-V1-1 | C2/M4 | 9.34 | 730 | 0.383 | 0.393 | 0.003561 |
| S-200-V1-2 | C2/M4 | 9.67 | 750 | 0.393 | 0.003659 | |
| S-200-V1-3 | C2/M4 | 9.95 | 770 | 0.404 | 0.003756 | |
| S-250-V1-1 | C2/M4 | 9.53 | 740 | 0.388 | 0.402 | 0.003610 |
| S-250-V1-2 | C2/M4 | 9.67 | 750 | 0.393 | 0.003659 | |
| S 250-V1-3 | C2/M4 | 10.46 | 810 | 0.425 | 0.003951 | |
| DS_K_330_50_1 | C1/M3 | 9.48 | 740 | 0.388 | 0.367 | 0.003610 |
| DS_K_330_50_3 | C1/M3 | 8.57 | 670 | 0.351 | 0.003268 | |
| DS_K_330_50_4 | C1/M3 | 8.80 | 690 | 0.362 | 0.003366 | |
| S-450-V1-1 | C1/M3 | 8.57 | 670 | 0.351 | 0.375 | 0.003268 |
| S-450-V1-2 | C1/M3 | 9.37 | 730 | 0.383 | 0.003561 | |
| S-450-V1-3 | C1/M3 | 8.77 | 680 | 0.357 | 0.003317 | |
| S-450-V1-4 | C1/M2 | 9.99 | 780 | 0.409 | 0.003805 | |
| S-330-14d-1 | C2/M1 | 6.88 | 540 | 0.283 | 0.274 | 0.002634 |
| S-330-14d-2 | C2/M1 | 6.76 | 530 | 0.278 | 0.002585 | |
| S-330-14d-3 | C2/M1 | 6.22 | 490 | 0.257 | 0.002390 | |
| S-330-14d-4 | C2/M1 | 6.78 | 530 | 0.278 | 0.002585 | |
| S-330-21d-1 | C2/M1 | 8.26 | 640 | 0.336 | 0.318 | 0.003122 |
| S-330-21d-2 | C2/M1 | 8.05 | 630 | 0.330 | 0.003073 | |
| S-330-21d-3 | C2/M1 | 6.75 | 530 | 0.278 | 0.002585 | |
| S-330-21d-4 | C2/M1 | 8.13 | 630 | 0.330 | 0.003073 | |
| DS_K_330_L_1 | C1/M3 | 8.07 | 630 | 0.330 | 0.379 | 0.003073 |
| DS_K_330_L_2 | C1/M3 | 9.64 | 750 | 0.393 | 0.003659 | |
| DS_K_330_L_3 | C1/M3 | 9.92 | 770 | 0.404 | 0.003756 | |
| DS_K_330_L_4 | C1/M3 | 9.45 | 740 | 0.388 | 0.003610 |
Note: Specimens missing from the sequence were omitted due to problems during testing.
Table 5.
Displacements w* and w*avg.
| Specimens | w* (mm) | w*avg (mm) |
|---|---|---|
| S-100-V1-1 | 0.12 | 0.12 |
| S-100-V1-2 | 0.11 | |
| S-200-V1-1 | 0.29 | 0.31 |
| S-200-V1-2 | 0.31 | |
| S-200-V1-3 | 0.33 | |
| S-250-V1-1 | 0.42 | 0.40 |
| S-250-V1-2 | 0.37 | |
| S 250-V1-3 | 0.42 | |
| DS_K_330_50_1 | 0.50 | 0.45 |
| DS_K_330_50_3 | 0.48 | |
| DS_K_330_50_4 | 0.38 | |
| S-450-V1-1 | 0.51 | 0.76 |
| S-450-V1-2 | 0.78 | |
| S-450-V1-3 | 0.87 | |
| S-450-V1-4 | 0.90 | |
| S-330-14d-1 | 0.33 | 0.33 |
| S-330-14d-2 | 0.35 | |
| S-330-14d-3 | 0.32 | |
| S-330-14d-4 | 0.31 | |
| S-330-21d-1 | 0.40 | 0.38 |
| S-330-21d-2 | 0.40 | |
| S-330-21d-3 | 0.30 | |
| S-330-21d-4 | 0.42 | |
| DS_K_330_50_L_1 | 0.57 | 0.68 |
| DS_K_330_50_L_2 | 0.62 | |
| DS_K_330_50_L_3 | 0.79 | |
| DS_K_330_50_L_4 | 0.73 |
Publisher’s Note: MDPI stays neutral with regard to jurisdictional claims in published maps and institutional affiliations. |
© 2020 by the authors. Licensee MDPI, Basel, Switzerland. This article is an open access article distributed under the terms and conditions of the Creative Commons Attribution (CC BY) license (http://creativecommons.org/licenses/by/4.0/).
Share and Cite
MDPI and ACS Style
Ombres, L.; Verre, S. Experimental and Numerical Investigation on the Steel Reinforced Grout (SRG) Composite-to-Concrete Bond. J. Compos. Sci. 2020, 4, 182. https://doi.org/10.3390/jcs4040182
AMA Style
Ombres L, Verre S. Experimental and Numerical Investigation on the Steel Reinforced Grout (SRG) Composite-to-Concrete Bond. Journal of Composites Science. 2020; 4(4):182. https://doi.org/10.3390/jcs4040182
Chicago/Turabian StyleOmbres, Luciano, and Salvatore Verre. 2020. "Experimental and Numerical Investigation on the Steel Reinforced Grout (SRG) Composite-to-Concrete Bond" Journal of Composites Science 4, no. 4: 182. https://doi.org/10.3390/jcs4040182