Review

Synthesis, Characterization, and Photocatalytic Performance of ZnO–Graphene Nanocomposites: A Review

by
Elim Albiter
1,
Aura S. Merlano
2,
Elizabeth Rojas
3,
José M. Barrera-Andrade
1,
Ángel Salazar
2 and
Miguel A. Valenzuela
1,*
1
Laboratory de Catálisis y Materiales, ESIQIE-Instituto Politécnico Nacional, Zacatenco, Ciudad de México 07738, Mexico
2
Grupo de Óptica y Espectroscopía (GOE), Centro de Ciencia Básica, Universidad Pontificia Bolivariana, Medellín 050031, Colombia
3
Área de Ingeniería Química, Universidad Autónoma Metropolitana-Iztapalapa, Iztapalapa, Ciudad de México 09340, Mexico
*
Author to whom correspondence should be addressed.
J. Compos. Sci. 2021, 5(1), 4; https://doi.org/10.3390/jcs5010004
Submission received: 14 December 2020 / Revised: 22 December 2020 / Accepted: 22 December 2020 / Published: 25 December 2020
(This article belongs to the Special Issue Feature Papers in Journal of Composites Science in 2020)

Abstract

:
ZnO is an exciting material for photocatalysis applications due to its high activity, easy accessibility of raw materials, low production costs, and nontoxic. Several ZnO nano and microstructures can be obtained, such as nanoparticles, nanorods, micro flowers, microspheres, among others, depending on the preparation method and conditions. ZnO is a wide bandgap semiconductor presenting massive recombination of the generated charge carriers, limiting its photocatalytic efficiency and stability. It is common to mix it with metal, metal oxide, sulfides, polymers, and nanocarbon-based materials to improve its photocatalytic behavior. Therefore, ZnO–nanocarbon composites formation has been a viable alternative that leads to new, more active, and stable photocatalytic systems. Mainly, graphene is a well-known two-dimensional material, which could be an excellent candidate to hybridize with ZnO due to its excellent physical and chemical properties (e.g., high specific surface area, optical transmittance, and thermal conductivity, among others). This review analyses ZnO–graphene nanocomposites’ recent advances, addressing the synthesis methods and the resulting structural, morphological, optical, and electronic properties. Moreover, we examine the ZnO–graphene composites’ role in the photocatalytic degradation of organic/inorganic pollutants.

Graphical Abstract

1. Introduction

Heterogeneous photocatalysis has been studied since the 1960s as a viable alternative for using solar energy in the air/water polluted purification, decomposition of water into hydrogen and oxygen, and reduction of CO2 into high-value organic compounds, among other examples [1]. Photocatalysis deals with the study of photo-redox reactions occurring in the presence of light and a semiconductor. Briefly, the photocatalytic process consists mainly of three stages (Figure 1): electron–hole pair generation by photoexcitation, separation/diffusion of the photo-generated charge carriers, and the surface reduction/oxidation reactions [2].
In general terms, the main success factors are the availability of the right catalyst for each application and the optimal operating conditions. A wide variety of oxides, sulfides, carbonaceous materials, conjugated microporous polymers, and others have been evaluated, looking for the highest photoactivity, selectivity, and stability, in addition to using visible light as an activation source [3]. The ideal catalyst should comply with the indications marked in Figure 2, depending on the type of application and the established operating conditions.
However, the photocatalyst selection remains the bottleneck in attempting a commercial application of photocatalysis. Many essays have been made, mainly in environmental remediation, to develop a technology integrated into existing ones [5]. As is well known, the most widely used and studied semiconductor in photocatalysis has been TiO2 [44,307 publications until 2020, Scopus], and the second place is undoubtedly occupied by ZnO (10,817 papers, until 2020, Scopus). Zinc oxide powder has a long history with successful and well-established applications in cosmetics, sunscreens, paints, and coatings [6]. ZnO is considered as a mature n-type semiconducting material with hexagonal wurtzite crystal structure as the most stable. It displays high electrical and thermal conductivity, optical absorption in the UV zone (direct bandgap at about 3.4 eV), high-temperature stability, increased stability at neutral pH, antimicrobial action, and reasonable cost [7]. On the other hand, ZnO nanostructures are now in research and development for new applications, such as gas sensors [8,9], nanomedicine [10], batteries [11], solar cells [12], inks [13], agriculture, animal feed supplement [14], and photocatalysis [15,16,17].
This boom in new and emerging ZnO applications is due to its versatility in morphology, dimensionality, size, and shape, leading to a significant variation in its physical and chemical properties. ZnO nanostructures can be classified as zero-dimensional (0D), one-dimensional (1D), two-dimensional (2D), and three-dimensional (3D), which include quantum dots arrays, elongated arrays, planar arrays, and ordered structures, respectively; some examples are shown in Figure 3.
The size and morphology of the employed ZnO nanostructures can influence the observed photocatalytic activity [19,20]. It is well- known that ZnO low-dimensional (e.g., 1D) nanostructures present short photo-generated carrier migration paths, fast carriers migration efficiency, and a large surface area, which would improve the photocatalytic activity [18,21]. In other words, controlled synthesis of ZnO nanocrystals with reduced dimensionality and well-defined morphologies presenting different exposed crystal facets (i.e., polar and nonpolar facets with varying energies of the surface) can determine their properties and potential applications [22,23]. There are still several drawbacks to ZnO’s commercial application in photocatalysis using sunlight, such as wide bandgap, rapid charge carrier recombination, and the photoinduced corrosion-dissolution at extreme pH conditions.
Coupling ZnO with other semiconductors, doping with foreign ions, decorating with noble metal nanoparticles, supporting on carbonaceous materials, among others, may solve deficiencies and obtain an efficient, robust, and stable ZnO photocatalyst [24,25]. Particularly, carbonaceous materials, including fullerenes, carbon nanotubes, graphene, and graphitic carbon nitride, have led to nanocomposites’ synthesis with semiconductors new photocatalysts with improved properties, such as high surface area, excellent conductivity, high chemical, and thermal stability [25,26].
Graphene, the focus of this review, has been one of the most studied nanocarbon since its discovery in 2004 (i.e., 1.7 × 10⁵ publications, until 2020, Scopus). This material is composed of a single layer of interconnected hexagons of carbon atoms, and it is considered the basic building block of other nanocarbons [26]. Graphene has excellent electrical and thermal conductivity, derived from its long-range conjugated structure; it also has a substantial theoretical surface area (2630 m2/g). Graphene oxide (GO) and reduced graphene oxide (rGO) are widely used derivatives of graphene (see Figure 4), both in their pristine and composite form. Their main applications are supercapacitors, photovoltaics, adsorbents, filtration membrane, sensors, lithium-ion batteries, anti-corrosion materials, sodium-ion batteries, and drug delivery solar cells, and photocatalysis [27]. GO, as a product of delamination of oxidized graphite, contains numerous oxygen functional groups, structural defects, and chemically bonded impurities. In contrast, rGO is a product of intensive reduction of GO, with chemical composition and properties different than those of graphene [28].
A fundamental question on ZnO–graphene’s topic would be: what are the advantages of coupling ZnO with graphene species? According to previous studies related to semiconductor–graphene composites, the latter can reduce the semiconductor bandgap energy, enabling visible light absorption. In addition, graphene avoids charge carriers recombination, improves reactant’s adsorption, and changes redox potential, giving rise to higher photocatalytic activity and stability [30], as illustrated in Figure 5.
ZnO has exponential growth in the number of publications related to photocatalysis for several years. Still, since 2010, a growing interest in using ZnO–graphene composites in different photocatalytic applications is perceived, Figure 6. It can be observed that the increase in the number of publications regarding the application of ZnO in photocatalysis showed a six-fold increase in the last decade. In the ZnO–graphene composites, the number of publications showed a similar trend in the same period, with a five-fold increase. The bibliographic records, published between 2016 and 2020, obtained using the keywords described in Figure 6 were used to perform a bibliometric analysis and construct a keyword co-occurrence map, as shown in Figure 7, made using the VOSViewer software. The analysis of ZnO’s use in photocatalysis (Figure 7a) showed that the main application is in the degradation of organic dyes (green region) dissolved in wastewater or model aqueous solutions. Among the most employed dyes are methacrylate blue, methylene blue, methyl orange, and rhodamine B. In this map, it can be observed that the primary approach to improving the photocatalytic performance of ZnO is the use of nanocomposites (blue region). Among the used materials to obtain these nanocomposites are different graphene species and graphitic carbon nitride. Finally, the red area of Figure 7a shows the most reported morphologies of ZnO: nanorods, nanowires, and nanoparticles.
Regarding the application of ZnO-graphene composites or hybrids in photocatalysis, it can be seen a similar trend (Figure 7b). The most reported application of these composites is the degradation of organic dyes, such as methylene blue, rhodamine C, and methyl orange, in aqueous solutions (green zone). The most reported morphologies of the composites include nanoparticles, nanorods, nanosheets, and nanowires (red zone). This can be attributed to the observed morphology of ZnO. In brief, it can be noted that the keyword occurrence in the case of ZnO-graphene composites follows a similar trend that the occurrence of ZnO. In subsequent sections of this review, a detailed analysis, about the reported morphologies, method of synthesis, ZnO precursors, among other topics, is presented.
Concerning the reviews’ number in the topics of ZnO-based materials and graphene-based materials applied in photocatalysis (i.e., 2010–2020), there are 265 and 230 publications, respectively (Figure 8). It is worth noting that most of the reviews are dedicated to analyzing the photocatalytic properties of these two materials in pristine form and forming composites with other semiconductors or polymers. In such a way, in the period 2016–2020, nine excellent reviews must directly or indirectly do with ZnO–graphene composites, as described in Table 1. Therefore, only two reviews were explicitly found focused on the study of ZnO–graphene composites for benzoic [31] and dye photo-oxidation [32].
The present work aims to address issues related to the effect of the type of ZnO structure (0D, 1D, 2D, 3D) linked mainly to graphene oxide (GO) and reduced graphene oxide (rGO), updating (2016–2020) the relevant aspects of the synthesis, characterization and photocatalytic properties. Indeed, there are currently significant advances with the use of ternary composites such as ZnO–metal–graphene or ZnO–semiconductor–graphene or using other types of carbonaceous materials, e.g., 3D graphene, graphene Q-dots, graphitic carbon nitride, among others [36]; nevertheless, they are outside the scope of this review. At the beginning of this work, the importance and foundations of photocatalysis are briefly described. Subsequently, the state of the art of ZnO, graphene, and composites in photocatalytic applications is addressed. Moreover, a chapter is specifically intended to synthesize ZnO–graphene composites, analyzing in detail the most used methods and the variables that affect their final properties. A detailed description of the main characterization techniques and some significant results with the ZnO–graphene composites are presented. Finally, the photocatalytic performance of ZnO–GO or ZnO–rGO in pollutants degradation is analyzed, focusing on the ZnO-type structure employed (0D, 1D, 2D, 3D) under UV and Vis light irradiation, as shown in Figure 9.

2. Synthesis Methods of ZnO–Graphene Nanocomposites

The implementation of efficient ways to prepare and process the nanocomposites for practical application has become very important. An appropriate synthesis method can lead to a strong influence on reaction time, yield, particle size, morphology, and photocatalytic performance of the material [38]. This section will analyze the experimental details andparameters of the most used synthesis methods to obtain ZnO–graphene nanocomposites materials, analyzing types of carbonaceous material, zinc oxide precursors, use of surfactants, and most frequent ZnO sizes and their morphologies.

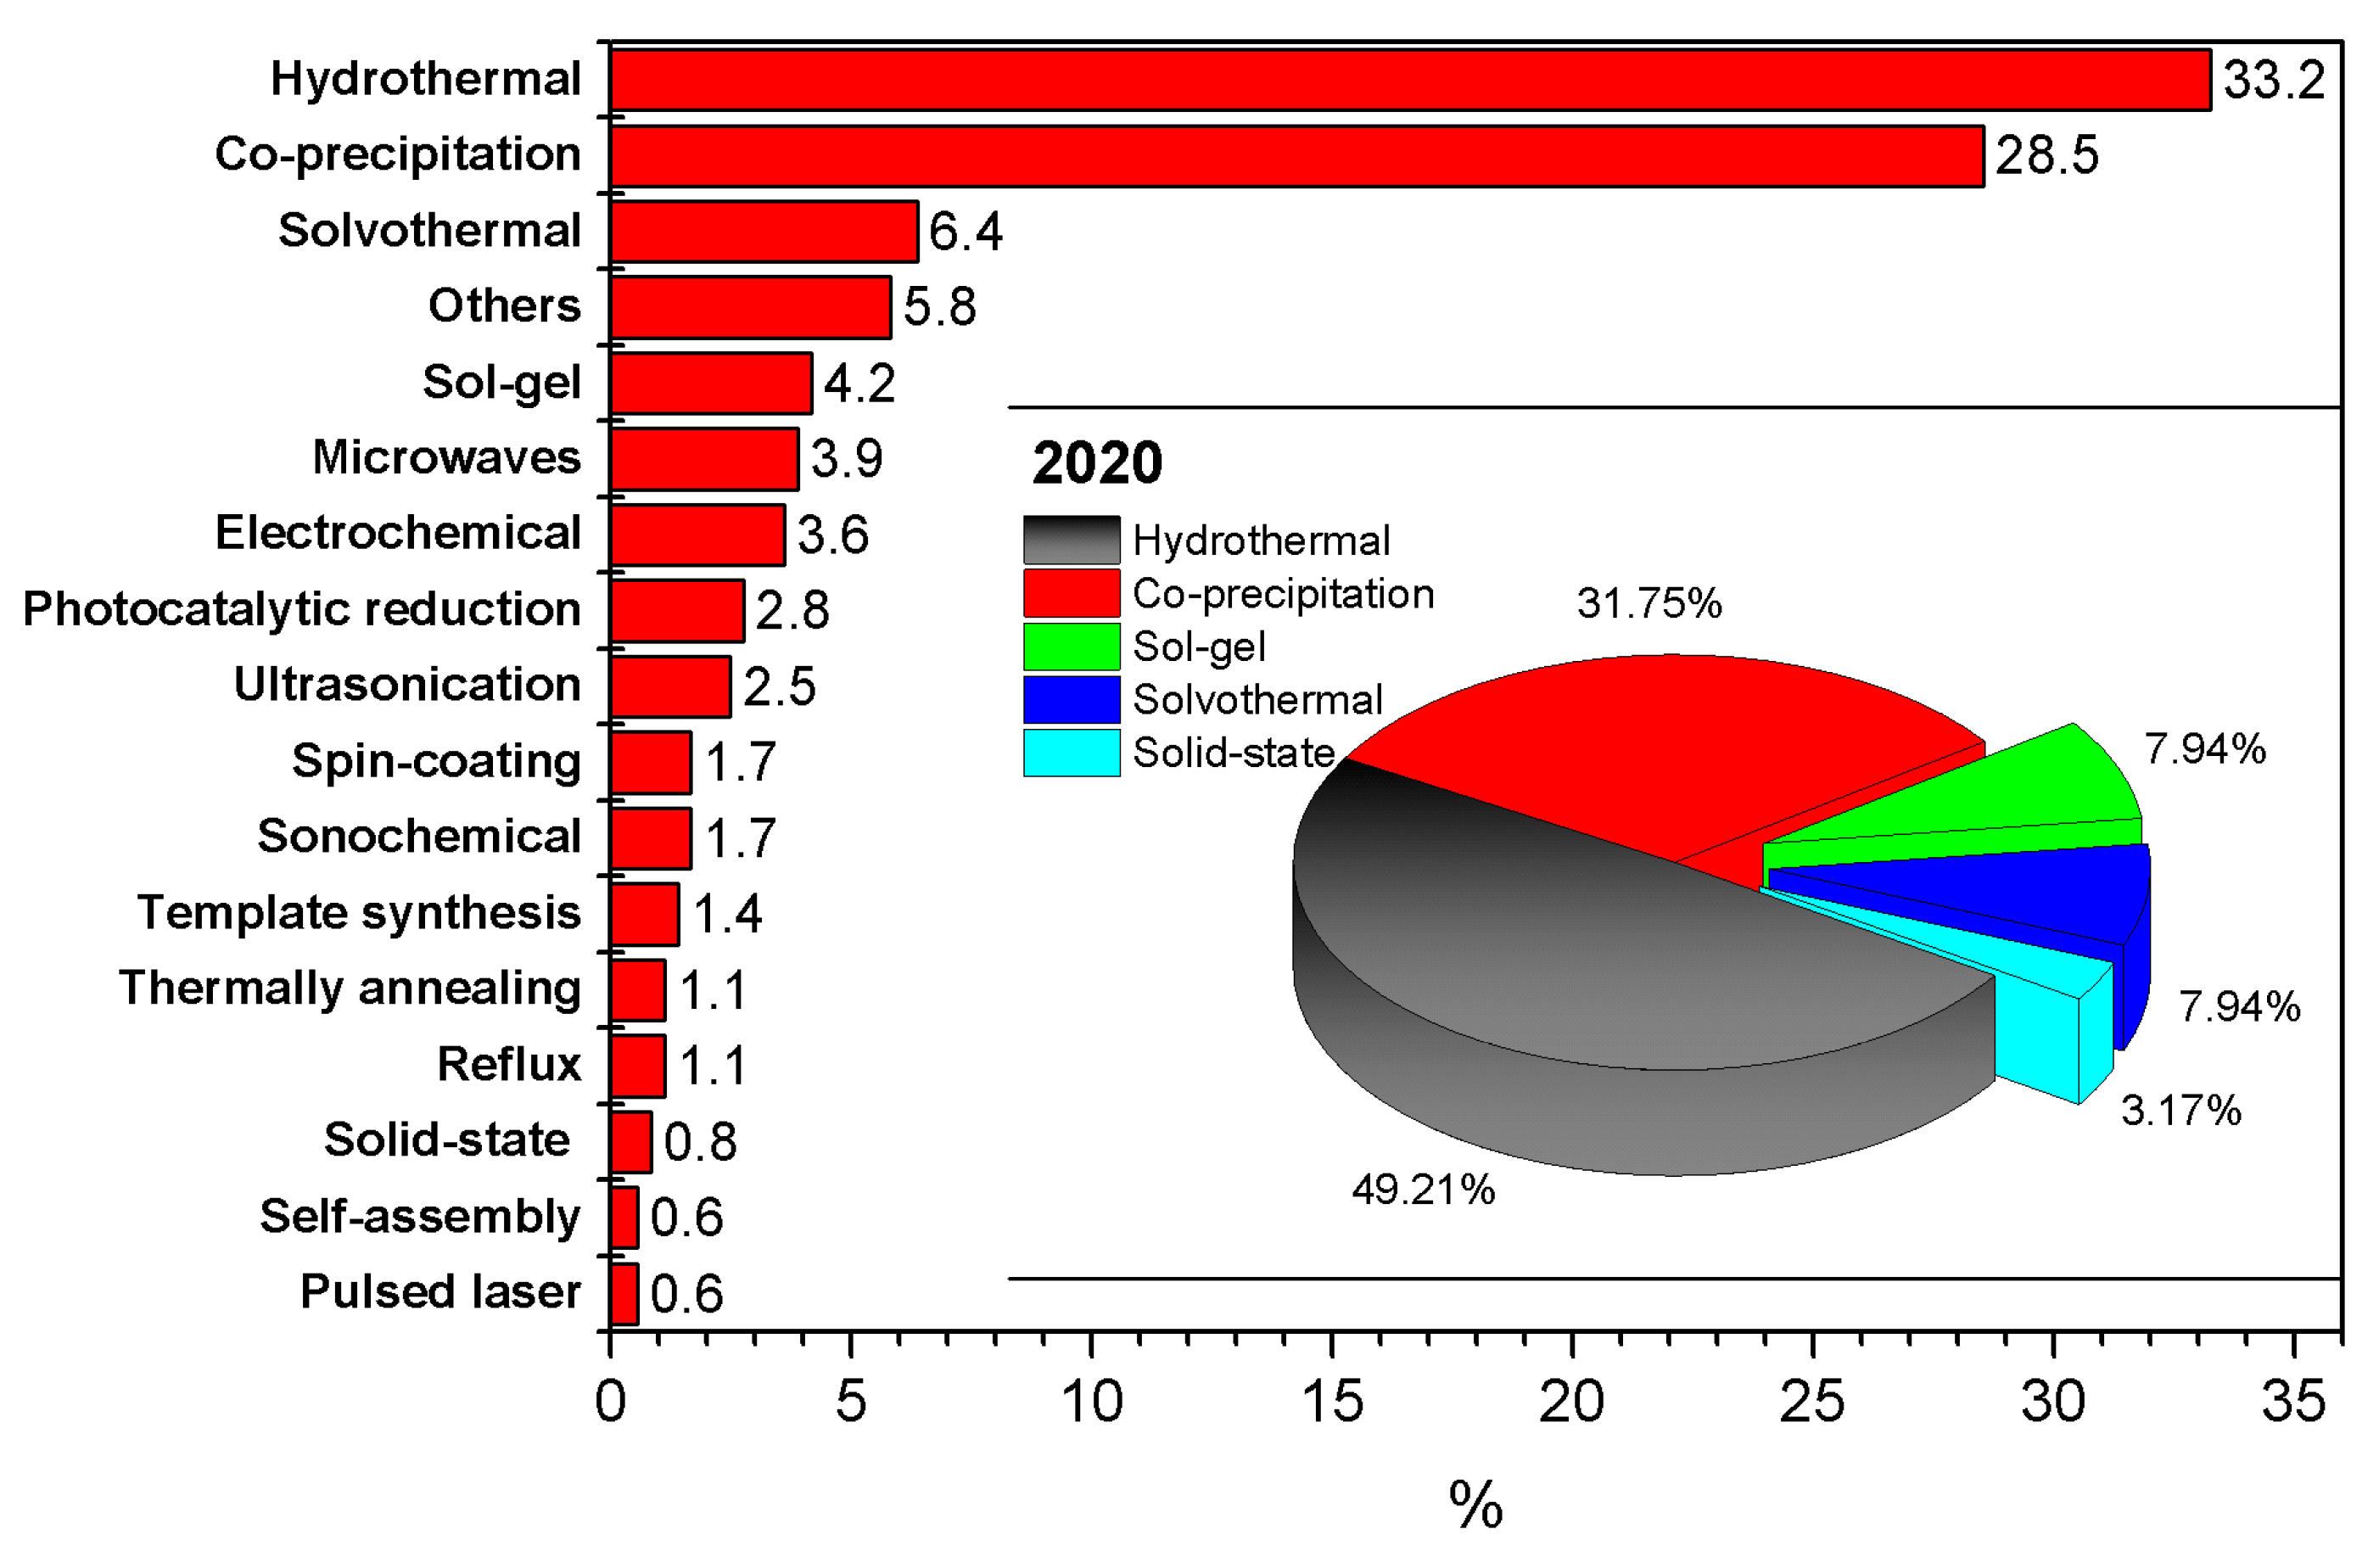
2.1. Main Methods to Obtain ZnO–Graphene

Actually, several synthesis methods have been used for the preparation of ZnO–graphene nanocomposites (see Figure 10). Among these, the most frequently reported methods are the hydrothermal, co-precipitation, solvothermal, sol–gel, microwaves, photocatalytic reduction, and electrochemical. These methods represent more than 80% of all synthesis methods. Until 2020, the most used methods were hydrothermal, co-precipitation, sol–gel, solvothermal, and solid-state synthesis. Therefore, the wet chemical methods will continue to be the main type of synthesis used. Although a particular interest in solid-state synthesis methods is growing due to its great simplicity and ease. Ultrasonication [39], spin coating [40], sonochemical [41], template synthesis [42], self-assembly [43], pulsed laser [44] and ionothermal precipitation [45] are others important methods, but they are less used. In the last decade, more elaborate and robust synthesis methods were reported, but today increasingly simple methods are being sought in favor of green chemistry and scalability.

2.1.1. Hydrothermal and Solvothermal

Both methods are some of the most versatile to synthesize nanomaterials [46]. Hydrothermal or solvothermal synthesis route is so-called depending upon the solvent utilized during the synthesis process. In the hydrothermal method, water is taken as the solvent, whereas in the solvothermal process, generally organic solvents (DMF, ethylene glycol, THF, PVP) are used. These synthesis methods were defined as a process in a closed system, in which chemical reactions occurred at temperatures above the boiling point and pressures above 1 bar [19,38]. In this case, zinc precursor is first reduced with a hydroxide (KOH/NaOH/NH4OH) to produce a precursor Zn(OH)2 nH2O and heated at different times and temperatures (8–20 h, 120–300 °C) in a Teflon-lined stainless-steel autoclave.
Moreover, some works also report the use of surfactants. Conditions such as precursors, concentration of the mixture, reaction temperature, and pressure contribute to deciding the ZnO nanoparticles’ dimensions. ZnO/carbon nanocomposites with different ZnO shapes and sizes have been synthesized using hydrothermal [47,48,49] and solvothermal synthesis [50,51,52].

2.1.2. Co-Precipitation

It is a well-established method of synthesis of nanocomposites in an aqueous solution [53]. It is a rapid and straightforward preparation at low temperatures, in which the products are generally insoluble species formed under conditions of high supersaturation. Nucleation is a crucial step. A large number of small particles will be created, and secondary processes, such as Ostwald ripening and aggregation, dramatically affect the products’ size, morphology, and properties [54]. When inorganic metal salt (zinc acetate, zinc nitrate, zinc chloride, among others) is dissolved in water, the metal cations exist in the form of metal hydrate species. These hydrates are then condensed by lowering the pH of the solution, commonly using NaOH or NH4OH. Finally, they are washed, filtered, dried, and calcined to obtain the final product [55]. Co-precipitation is the second most used synthesis method to obtain ZnO–graphene nanocomposites [56,57].

2.1.3. Sol–Gel

It is one of the famous wet-chemical methods and is widely used to synthesize various transition metal oxides. It was recently used to form ZnO/GO nanocomposites by incorporating ZnO nanoparticles on the surface of GO sheets or the formation of ZnO–rGO nanostructures, among others. All those systems afford a high surface area with enhanced adsorption capabilities and improved photocatalytic performance, facilitating dyes’ degradation [32]. Sol-gel technique enables synthesis at a low temperature and fine control of the product’s chemical composition. Different shapes and sizes of ZnO–graphene nanocomposites have been reported using this technique. Ahmad et al. reported spherical ZnO nanoparticles on graphene sheets [58]. Pogacean et al. presented ZnO cauliflowers varying from 100 to 500 nm on rGO sheets [59], and Yadav et al. successfully obtained lotus-like ZnO morphologies with variable sizes in the micrometer range supported on rGO flakes [60].

2.1.4. Microwave-Assisted

This synthesis is a popular and cost-effective method because it does not require expensive instrumentation. Chemical reactions are often faster than traditional convection heating methods and have high yields and fewer side products. Microwave-assisted techniques improve the engineering control over the separation of the nucleation and growth stages of nanomaterial synthesis. Having significant influence on room temperature, reproducibility, short synthesis duration, low price, purity, and fulfillment of the eco-friendly approach criterion [19,54]. Wang et al. reported ZnO hollow on ZnO/rGO composites via a one-step microwave-assisted solvothermal process [61]. Kumar et al. obtained different ZnO structures (3D, 2D, and 1D) on GO by varying the microwave heating reaction time. In this work, GO-ZnO microcubes, GO-ZnO nanoflakes, and GO-ZnO nanoneedles are synthesized by a microwave-assisted exfoliation method [62].

2.1.5. Electrochemical

Electrochemical methods have a long history of synthesizing a wide variety of metal, semiconductor, metal oxide, and nanocomposite materials. These methods allow cleaner and cheaper syntheses with potentially low cost and have a high production yield. Furthermore, electrochemical synthesis techniques provide the possibility of both batch and continuous processes [63]. Electrochemical synthesis possesses significant benefits. Electrons are clean reagents; they do not generate any waste formation. Since reactions occur by a direct electron transfer at the electrode, the systems usually do not require any other activation. Thus, the conditions are mild, resulting in high selectivity [64]. The electrodeposition process and the resulting microstructure of composite coating can be affected by many parameters [65]. For example, the electrolyte bath’s chemical composition, additives, pH, temperature, electrolyte stirring, current density, type of applied current (pulse or DC), particle size, surface properties, and concentration and kind of dispersion in the electrolyte. Investigations have reported ZnO–graphene nanocomposites using electrochemical synthesis with various experimental detail parameters [66,67,68,69].

2.1.6. Photochemical

Among the numerous synthesis methods for nanosized materials, photochemical synthesis plays a significant role. This synthesis use irradiation of a reaction solution containing metal salt, surfactant, and a mild reducing agent to speed up the process [70]. Chen et al. [71] reported a ZnO nanowires composited with rGO via UV-assisted photochemical synthesis. In that work, the electrons generated by ultraviolet photons transfer from the excited ZnO nanowires to the GO to produce rGO in the presence of ethanol, as indicated by the following reactions:
ZnO + h ν     ZnO   ( e + h )   C 2 H 5 OH ZnO   ( e ) +   ° C 2 H 4 OH +   H +  
ZnO   ( e ) + GO     ZnO + rGO
Other researchers have reported ZnO–graphene nanocomposites using UV-assisted photochemical reduction [72,73,74].

2.2. Type of Carbonaceous Support
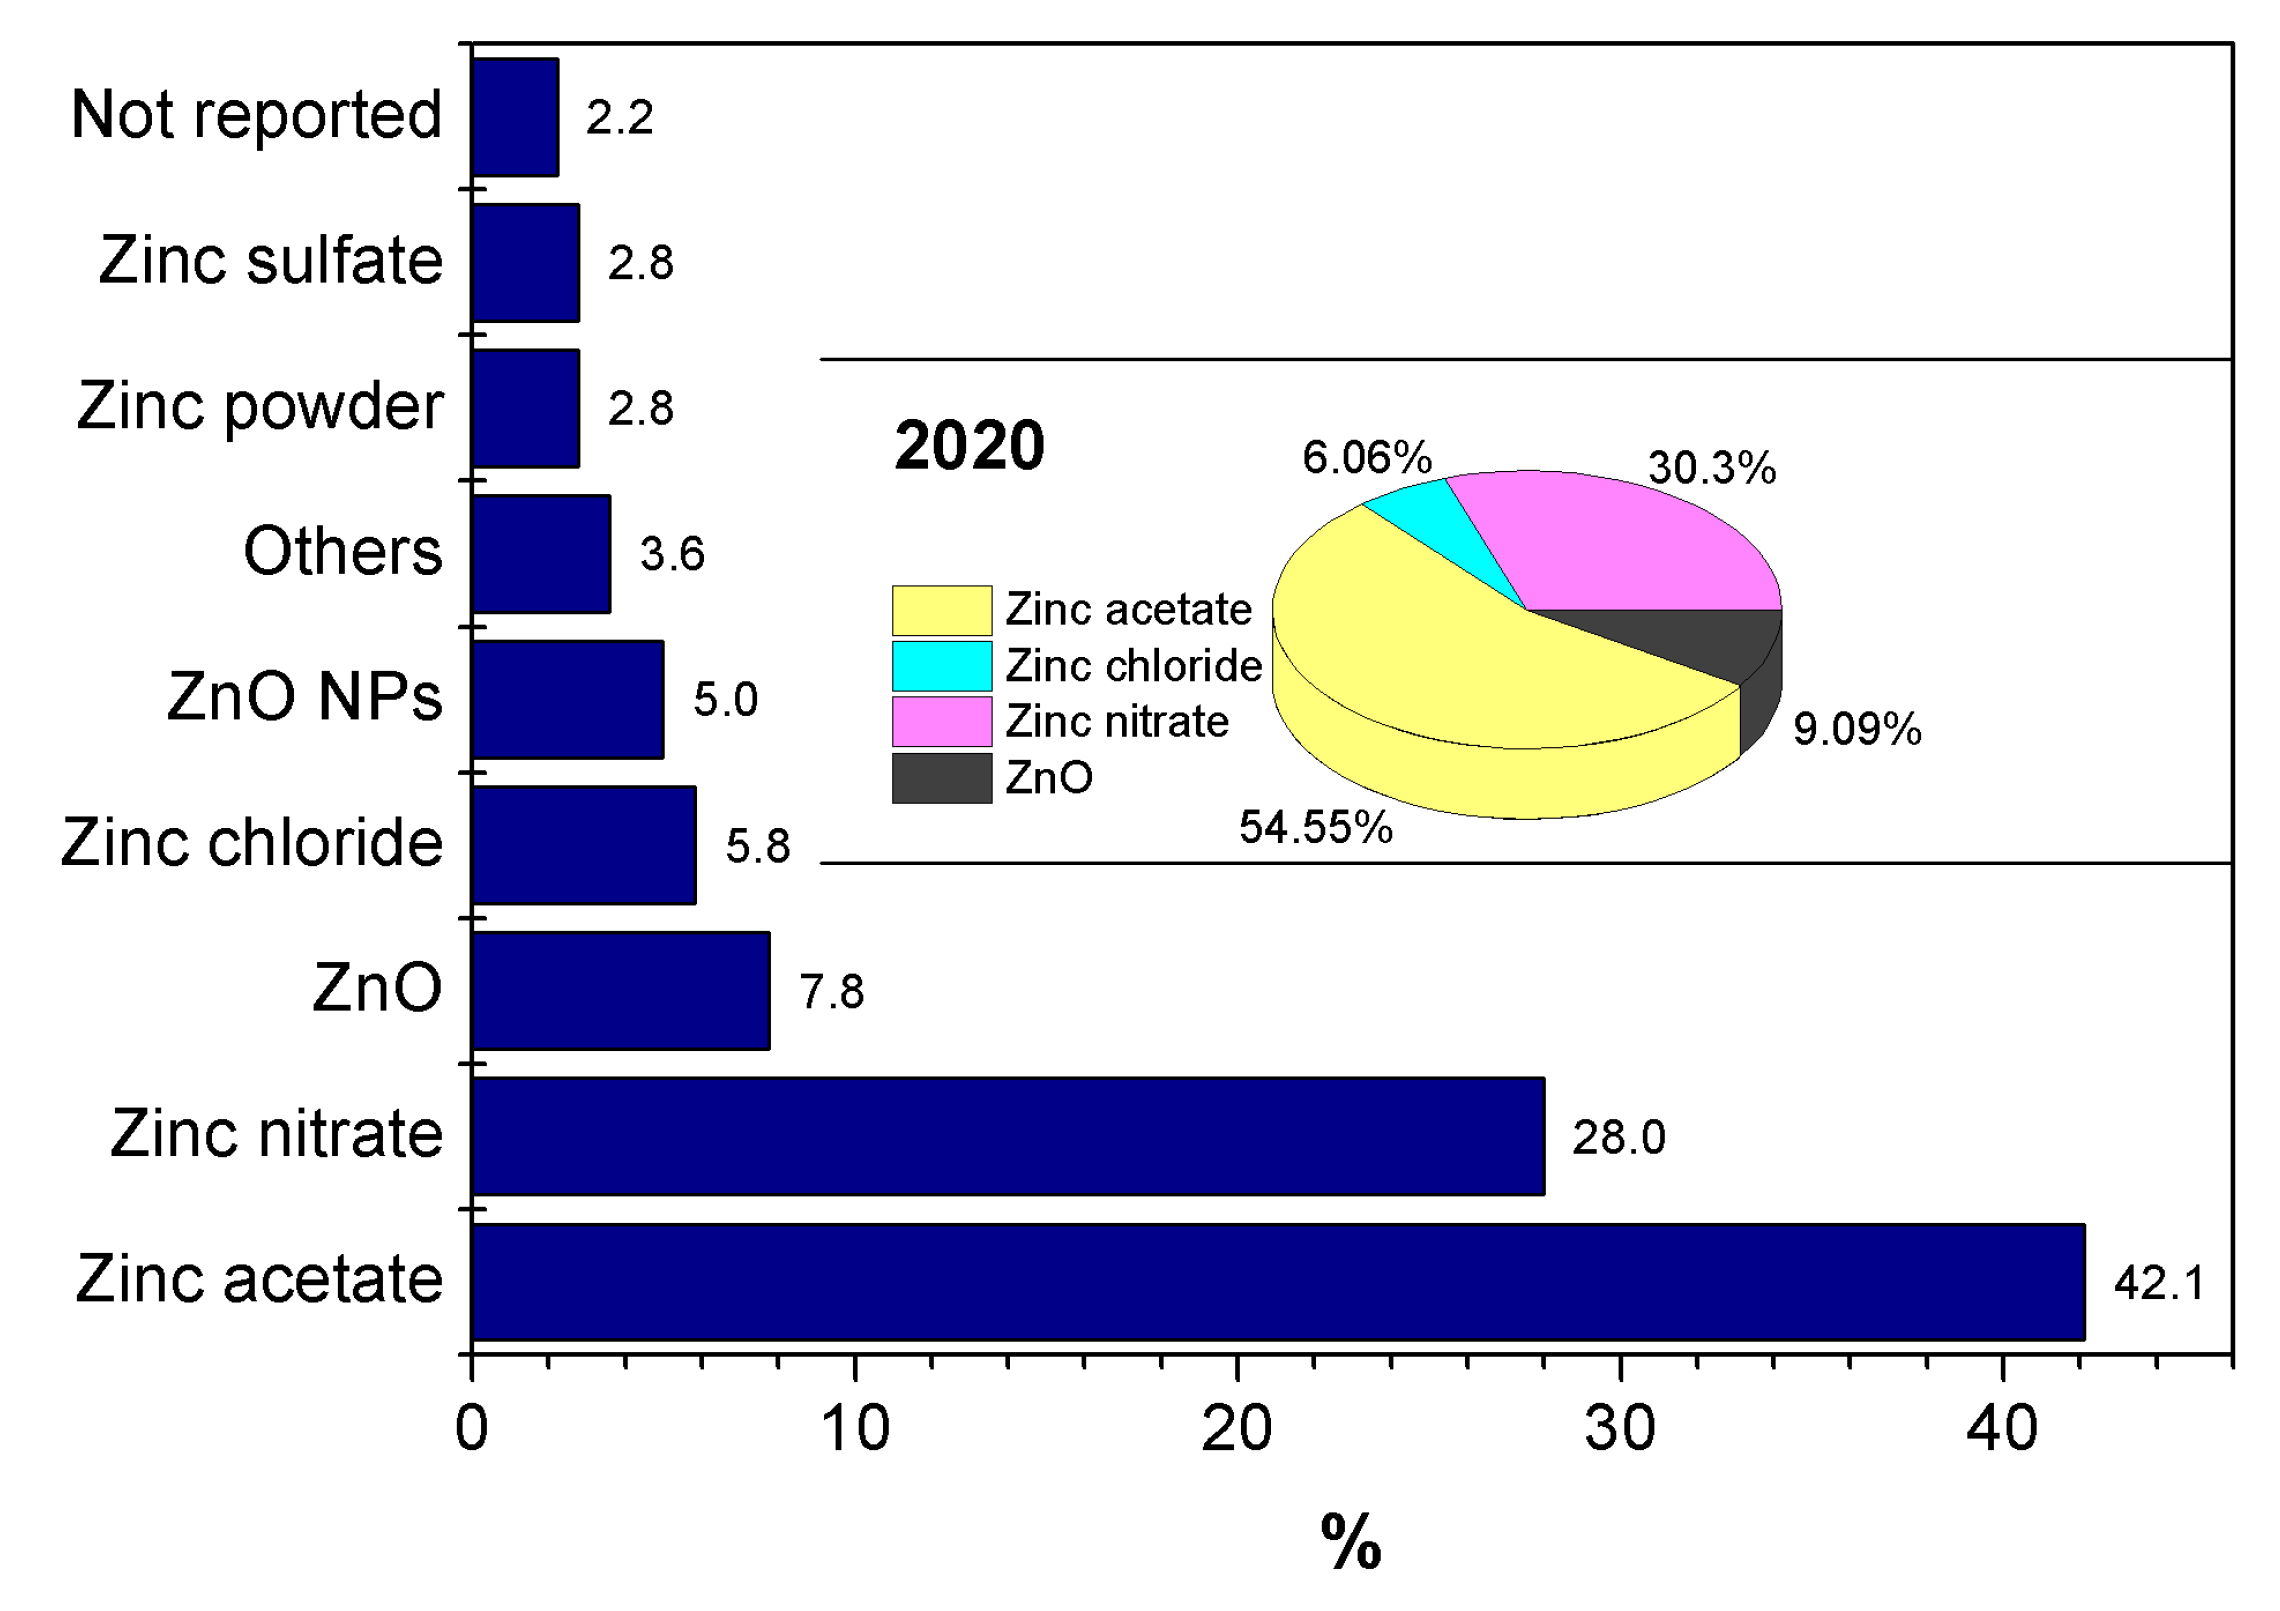
Coupling graphene-based materials with ZnO can enhance light absorption, charge separation, photostability, and adsorption. It seems to be one of the most promising strategies for developing robust and efficient photocatalysts [75]. It is for this reason that numerous carbonaceous supports have been reported for ZnO, such as graphene (G) [58,76,77], GO [78,79,80], rGO [81,82,83]. In Figure 11, the carbonaceous materials most used since 2016 and until 2020 were rGO, representing 48.68% of all carbonaceous materials used to synthesize nanocomposites. This high percentage is attributed to the use of synthesis methods. The nucleation and growth of ZnO nanostructures arise simultaneously by reducing GO using solvothermal, microwave, and photochemical syntheses. GO and rGO is especially promising templates for nanocomposites. The presence of defects and oxygen functional groups on their surfaces allows for the nucleation, growth, and attachment of ZnO nano and microstructures.

2.3. Zinc Precursor

According to the published references, the most popular zinc precursors used for ZnO–graphene composites synthesis are zinc acetate dihydrate, zinc nitrate hexahydrate, ZnO, and zinc chloride (see Figure 12). The popularity of these reactants results from their low price and easy availability. For the year 2020, the results are quite like the previous years.

2.4. Incorporation of the ZnO
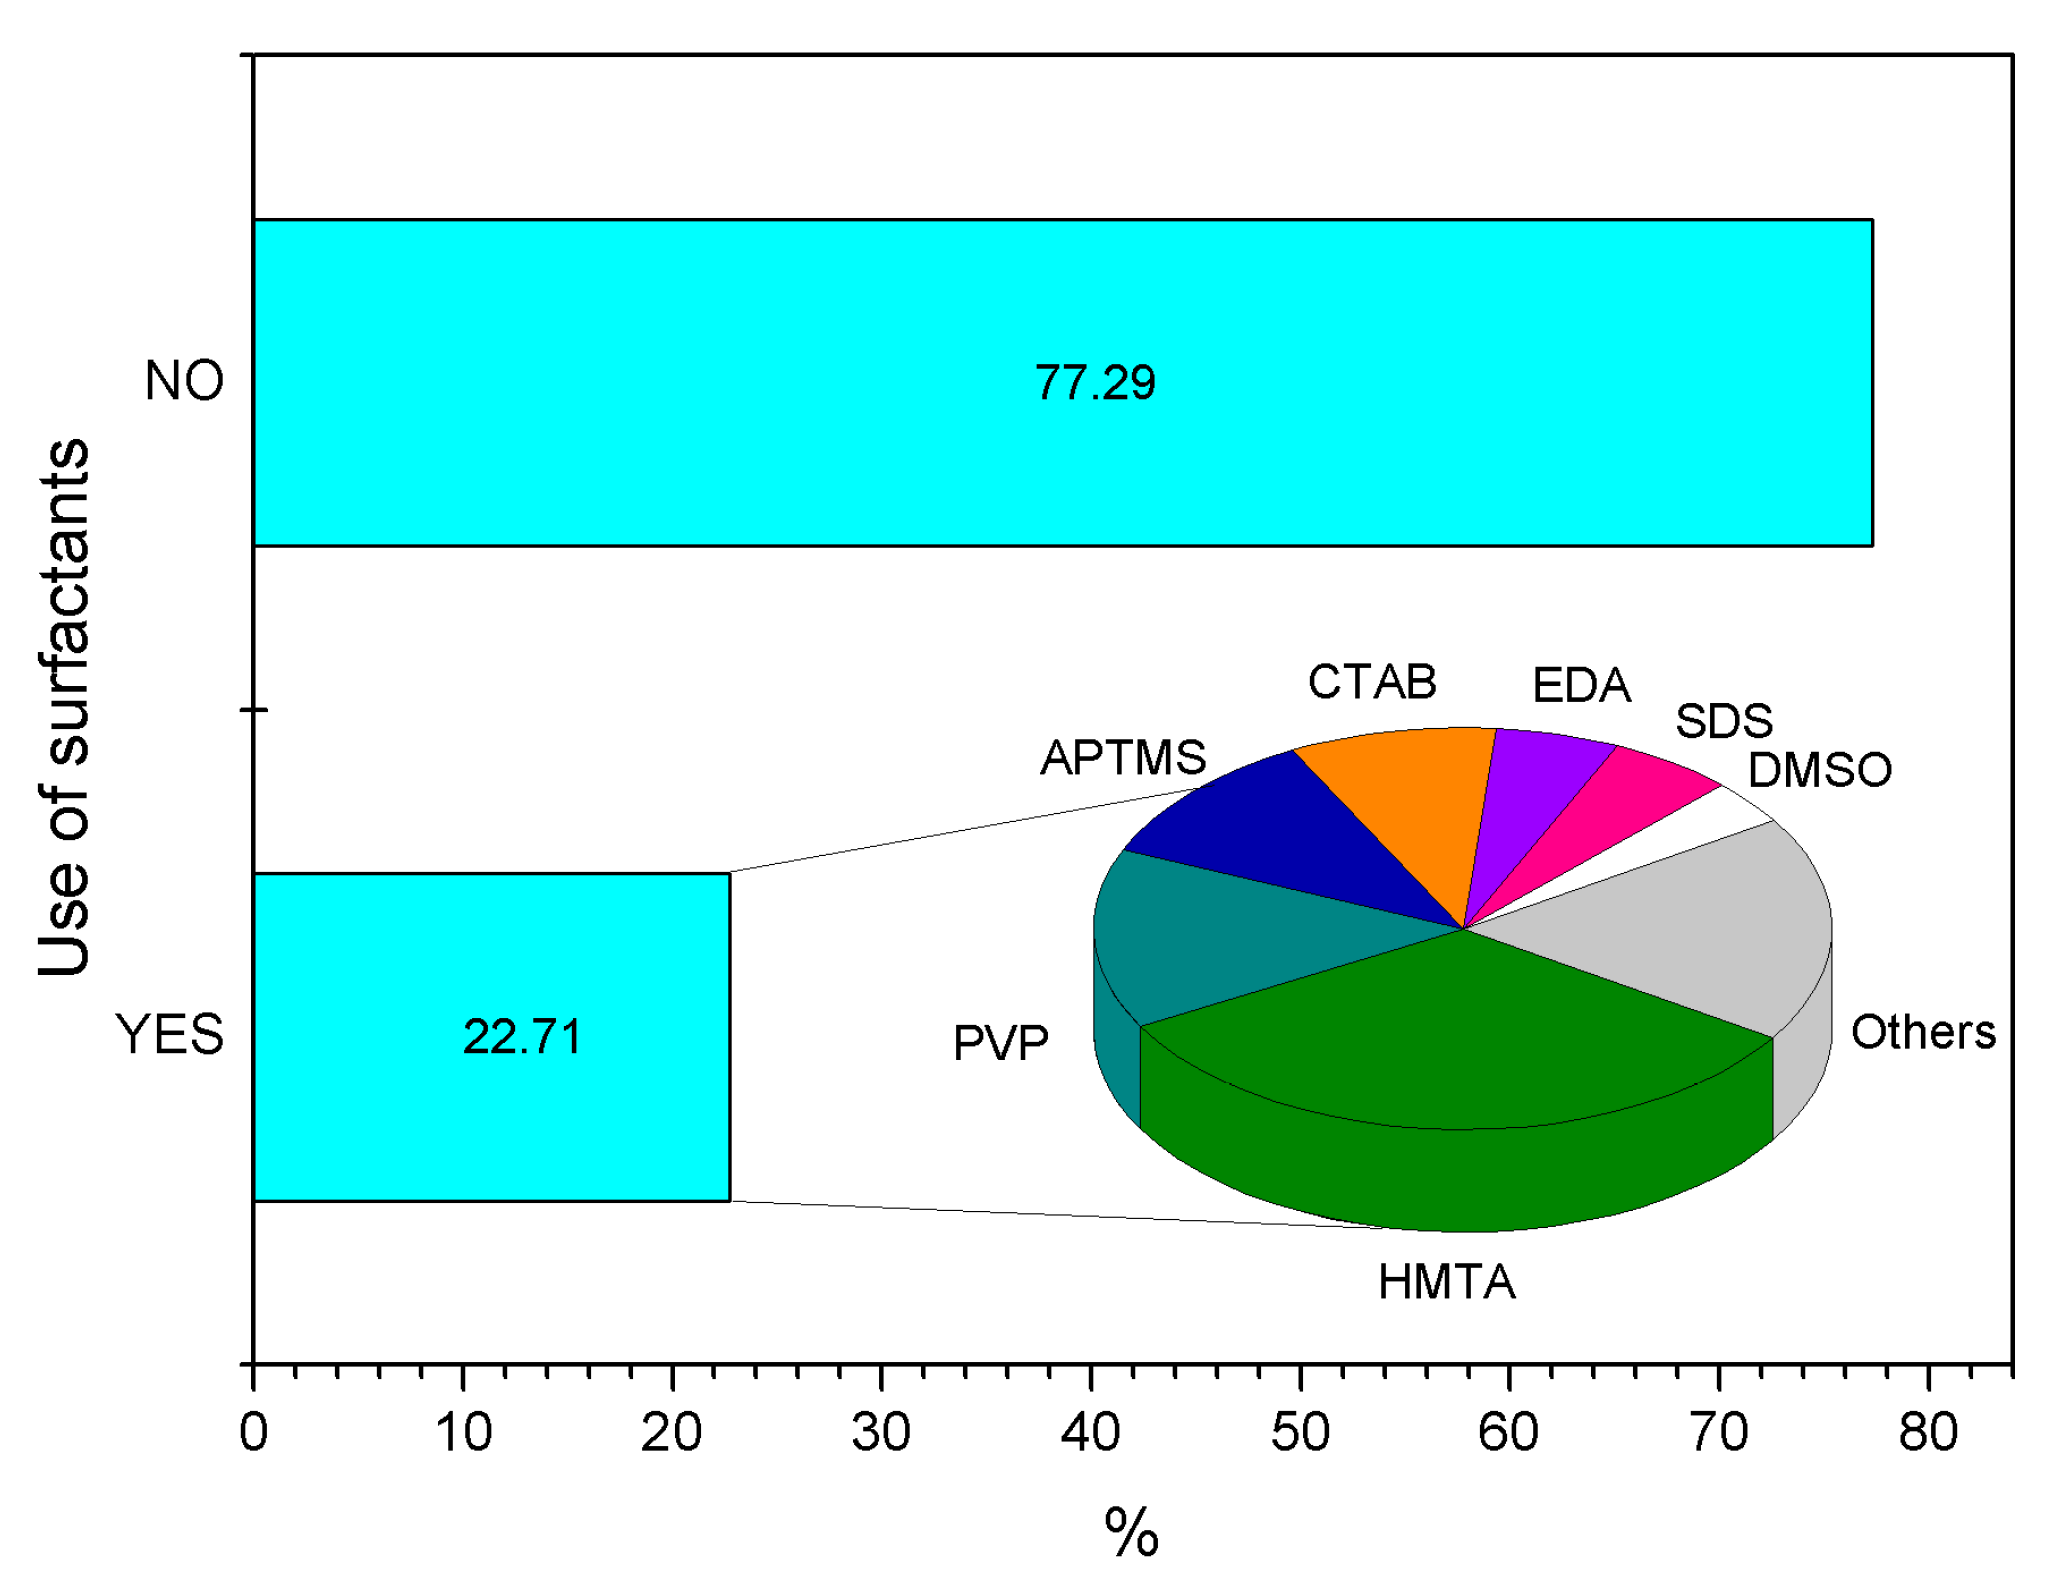
ZnO–graphene nanocomposites, wherein sheets of graphene, GO, or rGO, are decorated with nanoparticles of few nanometers to micrometers, can be obtained by anchoring ZnO nanoparticles to the surface through two types of incorporation. The first one is an in situ, growing the nanoparticles on the carbonaceous material and the second one, an ex situ method, attaching premade nanoparticles to the carbonaceous material [84]. According to the literature review, the primary type of incorporation used for ZnO’s anchoring in nanocomposites is an in situ method (See Figure 13).
The advantages of this type of incorporation are one-step synthesis and highly efficient and easy to perform since the nucleation of the ZnO nanoparticles and GO is carried out simultaneously [85,86,87,88]. However, it can be challenging to control the size and morphology of the ZnO nanostructures. In the ex situ method, the nanoparticles are synthesized previously and then attached to the graphene sheets’ surface via linking agents. This method can utilize either covalent or noncovalent interactions, including van der Waals interactions, hydrogen bonding, π−π stacking, or electrostatic interactions [89,90,91,92]. Although the ex situ method requires more time and steps to complete, it can offer several advantages compared to in situ growth. For instance, ex situ methods result in significantly narrower size distribution and better control over the size, shape, and density of the ZnO nanoparticles [93].
Recently, Ghanem et al. reported the ex situ technique through the mixing of GO with ZnO nanorods (EZG) and the in situ process by reducing GO in the presence of ZnO nanorods (IZG) [94]. For IZG, ZnO nanorods facilitate GO’s exfoliation during the reduction process as a few monolayers of rGO were obtained, and the nanorods were homogeneously dispersed over the nanosheets. EZG exhibited quite surface coverage of ZnO with the high probability for aggregation of rGO layers around the nanorods forming bundles like-structure. Furthermore, by comparing the photocatalytic performance of IZG and EZG, it is reported that the IZG showed better photoactivity than EZG. This behavior is attributed to the homogenous distribution of ZnO nanorods over graphene sheets of IZG. This work demonstrates morphological differences of the materials obtained and the effect of the type of incorporation on their photocatalytic performance.

2.5. Surfactants

Surfactants are commonly used in ZnO–graphene nanocomposite synthesis to control of ZnO shape. They give rise to better photophysical properties and obtain suspensions and colloids, in which they counteract the aggregation of nanoparticles [19,95]. From 2016 to 2020, only 22.71% of the reported syntheses used surfactants to obtain it (see Figure 14). Of that 22.71% the main surfactants were: hexamethylenetetramine (HMTA) (32.73%) [96], polyvinylpyrrolidone (PVP) (14.55%) [96], 3-aminopropyl-trimethoxysilane (APTMS) (10.91%) [97], cetyl trimethyl ammonium bromide (CTAB) (9.09%) [98], ethylenediamine (EDA)(5.45%) [99], sodium dodecyl sulfate (SDS) (5.45%) [100], and dimethyl sulfoxide (DMSO) (3.64%) In general, the use of surfactants has declined considerably due to the global trend in environmental protection. According to green chemistry principles, less dangerous chemical syntheses should be designed. The use of auxiliary substances such as surfactants should be reduced, expecting to decrease in the following years.

2.6. Morphologies and Sizes of ZnO

A great diversity of ZnO shapes has been reported in ZnO–graphene nanocomposites, as seen in Figure 15. The main ZnO morphologies are spheres (solid and hollow) [101], rods [102], flowers [103], core-shell [104], flakes [104], oval [105], wires [105], grains [106], cubes [107], quantum dots [108], trapezoids [109], tetrapods [110], and dumbbell [111]. The main problem in synthesizing this type of nanocomposites is the almost null control over ZnO’s morphology. 16.62% of the reviewed works do not achieve a clear and defined morphology; although they achieve the growth or anchoring of ZnO in graphene, GO, or rGO, it is impossible to determine dimension, shape, or size. Furthermore, 5.82% of the works reviewed do not make a morphological analysis of the nanocomposite obtained. On the other hand, very promising strategies have been designed, whereby changing a few parameters of the synthesis, various morphologies are obtained. Kumaresan and Ramamurthi reported ZnO rods and spheres on ZnO/rGO. The variation of the added amount of rGO can flexibly transform the morphology of ZnO from 1D rods to the architecture of a 0D sphere. Simultaneously, GO is converted to rGO using different amounts of rGO in a hydrothermal synthesis [112]. By hydrothermal synthesis, Zhou et al. obtained ZnO rods (l:18 μm d: 2.5 μm) and ZnO dumbbells (l:22 μm) onto rGO flakes. By controlling temperature, concentration of Zn2+/HMTA and reaction time [113]. Pruna et al. obtained by electrodeposition two morphologies using GO and rGO as carbonaceous material: ZnO pencil-shaped hexagonal nanorods on GO with a diameter of about 200 and 600 nm length. This morphology is attributable to higher negative charges of GO, which help in faster reduction of the sheets in the electrode’s vicinity. Thus, the growth of ZnO onto them, using the functional groups in GO as nucleation sites. On the other hand, ZnO hexagonal disks/plates of increasing size reached a diameter of about 500 nm and about 250 nm in length on rGO material [114].
In Figure 16, the main ZnO particle size ranges reported in the ZnO–graphene composites are presented. 33.67% of the works reviewed do not present information on the size of the ZnO structures obtained in the carbon material, which is associated with the fact that the morphology cannot be controlled. Therefore, it is a challenge to report a size. More than 50% of the ZnO sizes reported belong to the ranges: <50 nm, between 50 and 100 nm, and between 100 and 500 nm.

3. Characterization and Physicochemical Properties
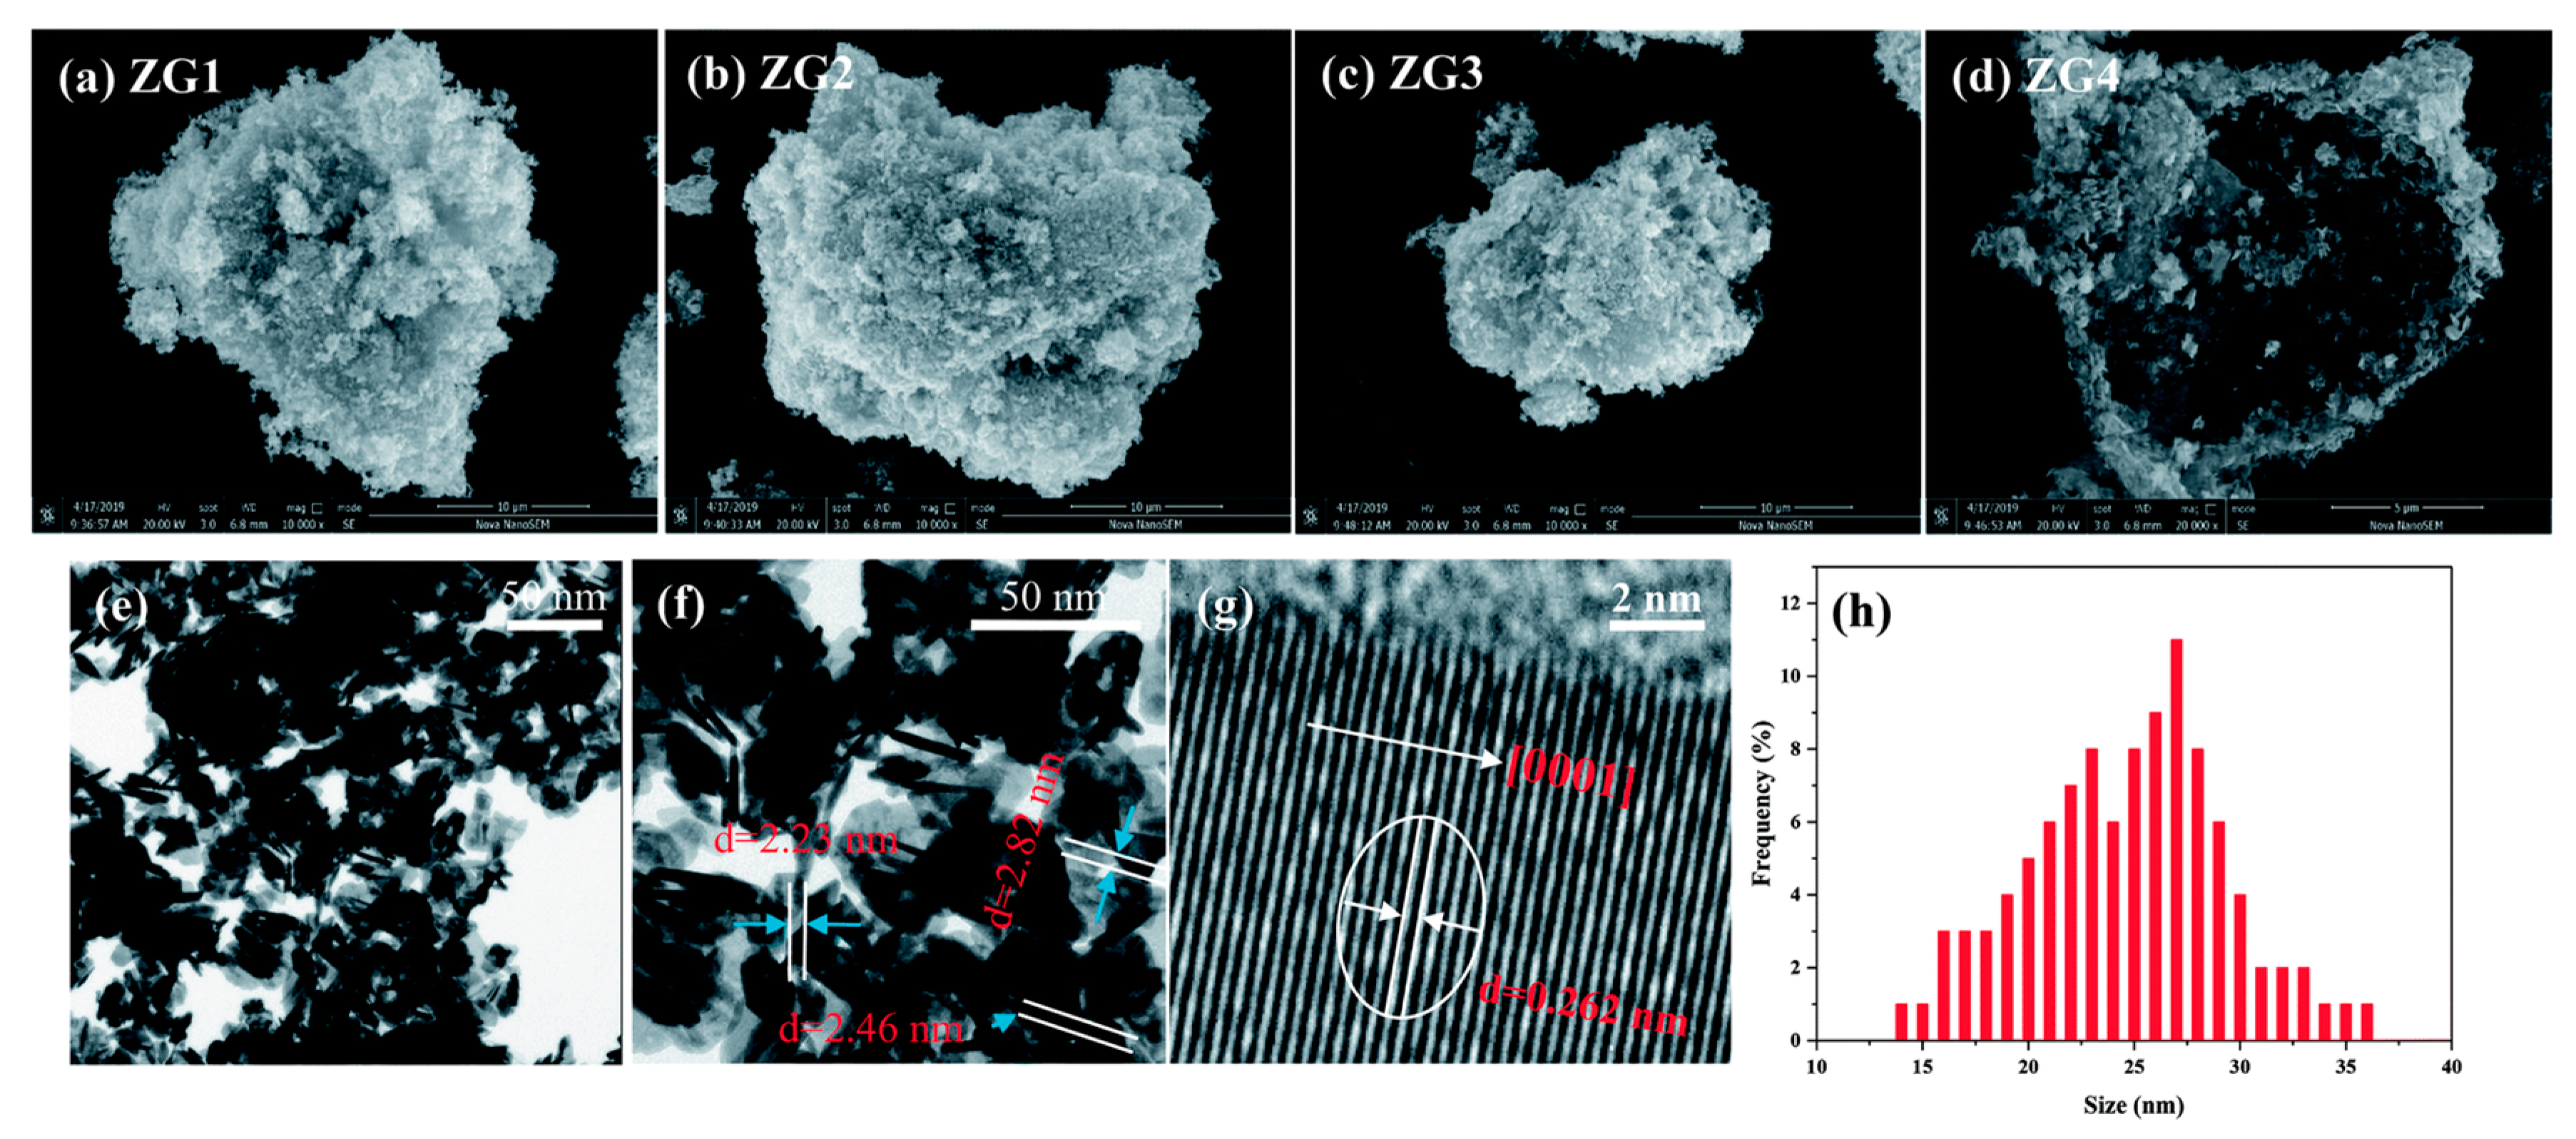
Physicochemical properties of nanomaterials are relevant because these indicate how the nanomaterial interacts or how it could interact with the surroundings under specific conditions. Depending on the purpose of the designed nanomaterial, specific physicochemical properties will be of greater interest than others. It will always be of interest to know the structural and morphological properties, texture, composition, optical and electronic properties, and possible reaction mechanisms depending on the interaction system, stability, and reusability possibilities. As it is known, the properties of materials can drastically change when the size is reduced to nanometric dimensions. Measuring these properties needs reliable characterization techniques to ensure a rigorous and credible analysis. Different techniques commonly used for the characterization of ZnO–graphene nanomaterials are described in the following sections. This section discusses the characterization techniques commonly used to study physicochemical properties on the size, shape, surface properties, composition, purity, and stability of nanomaterials. Specifically, to the case of ZnO–graphene nanocomposites applied to photocatalytic processes to organic/inorganic toxic pollutant degradation, hydrogen evolution/water splitting, and CO2 conversion to fuels.
It is valuable to understand that the characterization techniques are not exclusive but complementary in studying materials and nanomaterials’ physicochemical properties. For this reason, studying a specific property may require several techniques. In what follows, we have tried to group the techniques with which different physical and chemical aspects of ZnO–graphene composites are usually studied. Some characterizations are practically obligatory. For example, electron microscopy studies are necessary to identify that a nanocomposite has indeed been synthesized. Other studies, such as EDX, for example, are necessary to complete this information.
As a final note, it is worth noting that comparing different ZnO–graphene nanocomposites’ properties should be viewed with caution. For example, the different morphologies can depend on the synthesis method used, and the electrical properties can depend on the texture, that is, on the porosity of the material. Therefore, a comparison should be made having synthesized the samples under the same conditions, except for modifying specific parameters of interest, to observe how this influences the material’s performance in each application.

3.1. Morphology

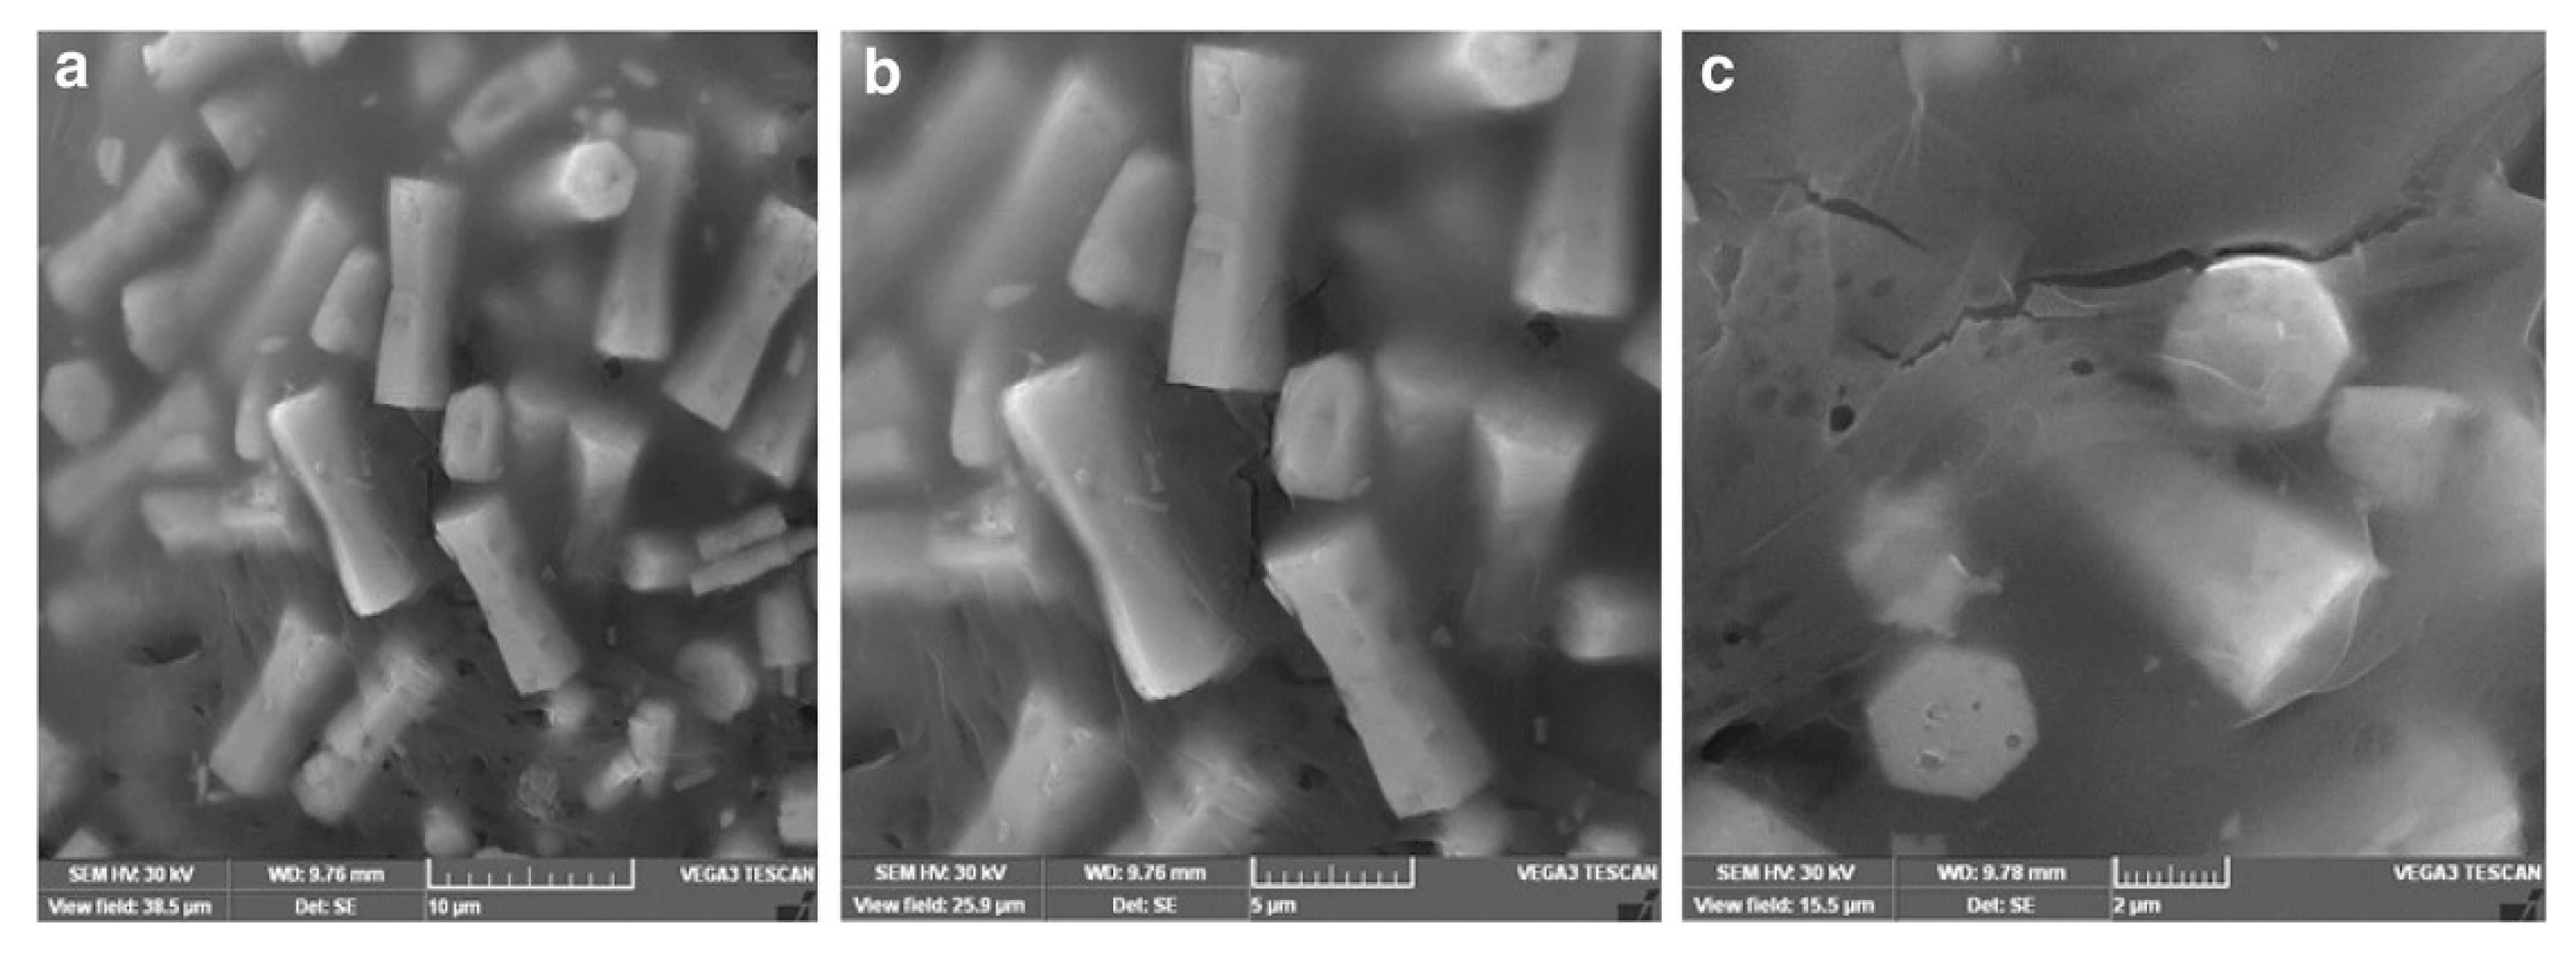
3.1.1. Scanning Electron Microscopy (SEM)

Unlike light microscopy, electron microscopy (EM) works with electron waves instead of light waves. Because the visible electromagnetic radiation has wavelengths between 400 and 700 nm approximately, optical microscopy is prevented from observing objects on the nanoscale for which at least one of the dimensions is under 100 nm. Unlike light microscopy, EM uses high-energy electron beams. High potential differences accelerate electrons for which sub-nanometric wavelengths are achieved, taking advantage of matter’s wave properties. Therefore, when these electrons impinge on the sample, images of much higher resolution are obtained. One of the more used EM in nanomaterial characterization is scanning electron microscopy (SEM). SEM is a technique to generate an image of the surface by scanning the sample with an electron beam. The interaction between the electrons of the beam and the sample produces other electron and X-ray signals from which the topography and atomic composition of the material surface are revealed.
In composite characterization, the topographic information helps to verify the presence of a determined morphology. It is possible to collect enough nanoparticle length and width data from the SEM image and obtain the average size using image visualization software. Therefore, SEM provides primordial information for morphological studies, and it turns essential in ZnO/graphene composites’ characterization; for example, composite materials based on reduced graphene oxide (rGO) reinforced with zinc oxide were synthesized [115]. In this study, SEM images (See Figure 17) showed that the Zn precursor concentration could change the final sizes and morphologies of the ZnO structures anchored in the composite. Two different morphologies, ZnO flowers (rGO/ZnO flowers) and ZnO rods (rGO/ZnO rods), were obtained.
SEM images do not give information about the composition of the sample, i.e., SEM images themselves do not tell if the sample is composed of ZnO and carbon nanomaterials. For this, additional analysis must be done, which can be achieved from the same SEM device. This analysis is called energy-dispersive X-ray spectroscopy (EDS or EDX). In EDS, X-ray signals emitted from the sample are detected. The incident electron beam can excite electrons from the innermost shells and, when the empty energy states formed are occupied by electrons from higher shells, X-rays are emitted. Due to the different atomic numbers of chemical elements, the energy differences between core levels are characteristic of each element. Thus, by examining these X-rays, the composition and relative abundance of elements in different surface points can be estimated, providing the distribution of such elements in the composite.
Field emission scanning electron microscopy (FESEM) is an improved SEM technique where the electron beams are produced by field emission effect, are very focused, and are produced at high and low accelerating voltages. Then, images obtained by FESEM are clearer and with a higher resolution. Moreover, the low voltages help reduce the damage in sensitive samples to the electron beam’s energy.
As previously mentioned, ZnO nanoparticles have different morphologies that mainly depend on the synthesis method. The photocatalytic efficiency of ZnO is strongly affected by its particles’ morphology. These morphologies have little impact on the structural or optical properties, such as crystal structure or bandgap. The incorporation of ZnO nanoparticles in carbon nanosheets (graphene, graphene oxide, or reduced oxide graphene) allows them to decorate [61] (see Figure 18), anchor [116] (see Figure 19), embed [117] (see Figure 20) in the surface of nanosheet or core-shell nanostructures [118]. Several authors have demonstrated that the incorporation of the ZnO nanoparticles in carbon nanosheets brings with it several advantages such as (a) increase in the crystallinity of ZnO, (b) more intimate contact between the ZnO–rGO interfaces, (c) an excellent graphitic sp2 C=C crystal structure of rGO nanosheets, (d) increase in the specific surfaces area of nanocomposites, (e) an enhanced in the absorption of visible light and an increase in the lifetime of charge carriers (electron (e-) hole (h+)), all of this resulting in a consequent increase of the photocatalytic activity of the nanocomposites. Wang et al. [61], for instance, showed that incorporation of ZnO hollow microspheres in rGO decorated the rGO nanosheets, allowing the easy transportation of the photo-generated electrons in the ZnO to rGO, increasing the separation of the charge carriers with a consequent enhancement in the photocatalytic activity.

3.1.2. Transmission Electron Microscopy (TEM)

Just like SEM, transmission electron microscopy (TEM) can provide morphology images. However, due to a higher acceleration potential, electron beams with smaller wavelengths are produced. Therefore, the detail level obtained in TEM images is superior compared with SEM images. In TEM, the electron beam is incident on a very thin specimen of the sample, such that electrons can be transmitted. Unlike SEM, where reflected electrons are collected to obtain the images, in TEM, the images are formed by detecting transmitted electrons, and, in this way, information about the internal structure can be obtained. For this reason, if the required information about the material is about roughness or surface morphology, SEM is enough. If crystal structure, defects, or impurities need to be studied, TEM is the indicated technique. EDS is also possible in TEM systems.
TEM samples must be carefully prepared. Apart from this, the intense ionizing radiation of the electron beam could damage the analyzed specimen. An additional disadvantage in TEM is projection limitation, which is because TEM presents a 2D image of a 3D specimen viewed in the transmission mode; therefore, care must be taken to interpret TEM images. It could be advisable to visualize the material at a lower resolution using SEM before rushing to use TEM if not necessary [119]. The scanning transmission electron microscopy (STEM) combines SEM and TEM in the same TEM device to take advantage of both techniques, that is, to scan the sample and obtain images in transmission mode.

3.1.3. Scanning Tunneling Microscopy (STM)

Scanning tunneling microscopy (STM) is based on quantum tunneling. In this technique, electrons that go through a potential barrier between a sharp scanning tip and the sample are detected. In one operation mode, the tip is maintained a few angstroms from the sample, and, applying a small voltage between both, the tunneling of electrons produces a current that can be recorded while the tip scans the sample. In this way, a charging map of the surface can be generated. In another mode, the current can be kept fixed while the tip scans the sample, obtaining a high spatial resolution image of the topography. The drawback of STM and electron microscopy techniques such as SEM and TEM is that the examined surface must be electrically conductive or coated to avoid the electrostatic charge. ZnO–graphene nanomaterials often have semiconductor properties, and this would not represent a significant inconvenience. The benefits of STM to investigate the properties of conductive samples are outstanding, and for that, STM constitutes an important technique to study the conductive atomic structures based on graphene.

3.1.4. Atomic Force Microscopy (AFM)

Unlike STM, AFM does not require conductive surfaces. It uses a cantilever with a sharp tip at one end to scan the sample. In this case, the cantilever’s deflection caused by electrostatic and Van der Waals forces when it goes across the sample surface is detected by a laser system. The vertical resolution for height difference measurement is sub-nanometric. AFM, as well as SEM and TEM, can be used to determine the size and shape of nanomaterials, their dispersion and aggregation and, therefore, it is also a useful technique in ZnO–graphene characterization.
Height imaging is a remarkable application of AFM useful for measuring 3D dimensions of nanomaterials and making it possible to analyze the surface roughness. Compared with SEM and TEM, AFM provides a three-dimensional surface profile of nanomaterials, including graphene, graphene oxide, carbon nanotube, and, naturally, nanocomposites. AFM samples’ sample preparation is more straightforward and can be measured in different environments such as liquid, atmospheric, or vacuum, for example [120].

3.2. Structure

3.2.1. X-Ray Diffraction (XDR)

X-ray diffraction (XRD) provides important information about the crystalline structure of nanomaterials. With XRD, lattice constants, bond angles, crystallinity degree, interplanar spacing, crystallite size, strain, dislocation density, and chemical composition can be accessed. XRD is based on the interference of X-rays that are diffracted from the plane set of a crystal. The diffracted waves’ constructive interference produces intensity peaks at certain angles, depending on the material’s crystalline structure. These angular positions satisfy Bragg’s law, and therefore, knowing the positions of these peaks, it is possible to calculate the separation between the crystalline planes of the crystal. In particular, this possibility is significant to identify graphene oxide-based nanomaterials, for example, because the separation between planes must be large enough to ensure it is graphene oxide.
For technical considerations, in an XRD record, the intensity of the peaks is reported as a function of 2θ and not θ. Hence, for example, if the XRD of graphite using an X-ray wavelength λ = 1.5406 Å corresponding to the Kα line of Cu, consists of a single peak in a position around 2θ = 26.7°, which correspond to an interlayer distance of ca. 3.34 Å. The chemical oxidation and exfoliation processes of the graphite to produce graphene oxide (GO) introduces oxygenated groups between the layers and separates them, such that the peak is shifted around 2θ = 10° or less, which indicates that the graphite is oxidized into GO, with an increased interlayer distance of 8.84 Å or larger. The method to incorporate ZnO nanoparticles in GO for photocatalytic applications, for instance, can eliminate a percentage of oxygenated groups in the GO to produce reduced graphene oxide (rGO). Therefore, it is expected that the interlayer distance in rGO is smaller than in GO. The XRD pattern of GO has a single peak in a position close, but less than the peak position for the graphite, 2θ = 25.4° (see Figure 21) [121]. This peak would suggest that, effectively, the XRD pattern corresponds to GO. In this case, the interlayer distance of rGO would be 3.50 Å, close to the graphite interlayer separation.
On the other side, studies of chemical composition are useful to identify different phases in composite characterization, in particular, to identify the presence of ZnO in ZnO–graphene composites [112,116,122,123]. For example, an eco-friendly and solar light-responsive graphene oxide wrapped zinc oxide nanohybrid was synthesized by a hydrothermal method using lemon and honey as chelating and complexing agents, respectively [123]. By tuning the reaction conditions, a heterostructure between GO and ZnO was formed during synthesis. The synthesized nanohybrid photocatalytic activity was investigated by the degradation of methylene blue and wastewater under natural solar light. Figure 22 shows XRD patterns of GO and ZnO, and the graphene oxide wrapped zinc oxide GO/ZnO nanohybrid.

3.2.2. Energy Dispersive X-Ray (EDX)

Energy-dispersive X-ray spectroscopy (EDS or EDX) is an analytical technique used for the elemental analysis or chemical characterization of a sample. It is based on the analysis of X-rays emitted by the sample bombarded with electrons in an SEM o TEM microscope. In this case, the high-energy beam of electrons generates the emission of X-rays from the sample studied. The fundamental physics is that the atoms in the sample contain electrons in shells around the nucleus with specific energy values. The incident electron beam may excite an electron in an inner shell and eject it from the shell, leaving a hole where the electron was. Then, an electron from an outer higher-energy shell fills the hole, and the difference in energy between these higher-energy and lower energy shells is released in the form of X-rays. An energy-dispersive spectrometer can measure the intensity and energy of the X-rays emitted from the sample. The energy of the emitted X-rays depends on the energetic difference between the two shells, which depends on the element’s unique atomic structure. This energy allows us to know the elemental composition of the sample. As mentioned, studies of chemical composition are useful to identify different phases in composite characterization, in particular, to identify the presence of ZnO in ZnO–graphene hybrids and to know the relative percentage of each element in the sample being analyzed [94,124,125,126].

3.2.3. Infrared (IR) Spectroscopy

A molecule absorbs infrared (IR) radiation if it possesses a time-variant dipole moment whose oscillation frequency is the same as the frequency of the incident IR wave. The IR radiation transfers energy to the molecule, inducing a bond stretching, bending, or twisting. Molecules without dipole moments, such as diatomic molecules O2 and N2, do not absorb IR radiation. Diatomic molecules, for symmetry, have a zero-dipole moment. Fourier-transform infrared (FTIR) spectroscopy is the technique used to obtain the absorption and transmission IR spectra of a material. When an IR beam containing many wavelengths is directed onto the sample, some wavelengths are absorbed, and others pass through it. In Fourier-transform infrared (FTIR) spectroscopy, a Michelson interferometer is used to produce an interferogram of the IR beams, a pattern of intensity as a function of the optical path difference between the beams when the length of one arm of the interferometer is modified. To contrast, two interferograms are produced, without and with the sample in the path of one of the beams. The intensity in an FTIR spectrum is obtained using a digital Fourier transform of the interferograms and expressed as a frequency or wavelength function.
An FTIR spectrum is usually given as a graph of transmittance or absorbance percentage as a wavelength function in the mid-infrared, with a wavelength range between 400 cm−1 to 4000 cm−1. It is employed for ZnO–graphene composites to verify the ZnO presence and identify functional groups bonded to graphene. The technique is beneficial for revealing the oxygenate groups present in graphene oxide obtained by chemical methods [50,127,128]. The wavenumber is related to the oscillating frequency of molecules or functional groups. For example, graphene oxide has a high hydrophilic character; therefore, its FTIR spectrum will show an intense wide band in the 3000–3600 cm−1 region due to the stretching vibrations of the O-H groups. The spectrum also will reveal the presence of oxygen functional groups, carbonyl (C=O), alkoxy (C-O), epoxy (C-O-C), and aromatic (C=C), around 1726, 1218, 1041, and 1622 cm−1 frequencies, respectively. In the case of reduced graphene oxide and ZnO composites (rGO/ZnO), the O-H band decreases substantially, and the typical C=O band at 1726 cm−1 does not appear, evidencing the reduction process. On the other hand, a band around 424 cm−1 should appear corresponding to hexagonal ZnO’s vibrating mode.

3.2.4. Raman Spectroscopy

Raman spectroscopy is a characterization technique to study nanomaterials based on photons’ detection inelastically scattered when a laser beam is pointed on the sample. In molecular studies, RS measures the frequency difference between the incident photons and the scattered photons associated with molecular vibrational states. A Raman spectrum consists of a graph of intensity versus the frequency difference measured in terms of wavenumber. Inelastically scattered photons with frequencies lower than the frequency of the incident photons generate Raman lines in the spectrum called Stokes lines. Inelastically scattered photons with frequencies higher than the incident photons’ frequency generate lines in the spectrum called anti-Stokes lines.
Raman spectroscopy is complementary to IR spectroscopy because Raman active vibrational modes of a molecule are IR inactive, and vice versa. In the study of solids, carbon-based nanomaterials, or composites, a Raman spectrum gives information about structural vibrations resulting from the interaction of the incident laser photons with phonons in the material. For example, graphene oxide presents a specific Raman band related to the graphitic structure’s vibration (the G band) and a band associated with the defect degree (the D band). Traditionally, defect degree has been evaluated by the intensity ratio between these two bands [74,129,130]; however, a new metric for this purpose has been reported [131].
In graphene oxide, the D band at 1359 cm−1 is caused by lattice disorders in the sp2-hybridized C atoms, and the G band at 1610 cm−1 is related to the highly oriented sp2 hexagonal graphitic lattice. However, the G band is an apparent bandgap that results from the real G band’s superposition and other band called D’. Therefore, because of this superposition, King et al. [131] reported that the intensity ID⁄IGapp ratio was not a suitable metric for distinguishing GO and rGO. A more secure metric was obtained by calculating the difference between the position of an inferred D’inf band, which is the half of an overtone 2D’ observed at ~3200 cm−1, and the band’s position Gapp. If the conditions D’inf − Gapp < 0 and the atomic ratio carbon to oxygen C/O < 10 are satisfied, the sample consists of GO. If 0< D’inf − Gapp < 25 and 10 < C/O < 500, the sample can be considered as rGO, and if D’inf − Gapp > 25 and C/O < 500, the sample consists of graphene. The C/O ratio can be obtained from X-ray photoelectron spectroscopy (XPS) compositional. For rGO/ZnO composites, new bands appear in the Raman spectrum related to vibration modes of ZnO [129,130,132].

3.2.5. X-ray Photoelectron Spectroscopy (XPS)

XPS is a technique for surface analysis based on the detection of low-energy electrons liberated from the sample by a photoemission process when soft X-rays are incident on it. An XPS spectrum consists of a graph of intensity expressed in counts or counts per second as a function of the electrons’ binding energy. The electrons’ kinetic energy is the experimental quantity measured by the spectrometer. The binding energy provided by it results from the difference between the X-ray photon energy and the sum of the kinetic energy acquired by the electron and the spectrometer’s work function. From that information, it is possible to know what elements are present on the surface and their chemical states. It is usual in XPS to use spectroscopist notation to label the different peaks in the spectrum. In this way, a peak represented, for example, by 3 s, indicates electrons coming from the shell corresponding to the principal quantum number n = 3 and the orbital angular momentum number l = 0. Peaks corresponding to orbital angular momentum numbers higher than 0 are split into two due to the spin–orbit interaction. For example, 3p1/2 and 3p3/2 represent peaks of electrons coming from 3p orbitals, where subscripts 1/2 and 3/2 are the result to add the orbital angular momentum number l = 1 and the spin angular momentum numbers s = 1/2 and s = −1/2 of the two possible spin states.
XPS constitutes a valuable technique for the chemical analysis of ZnO/GO composites. The XPS survey scan spectrum of GO shows two binding energy peaks around 284.5 and 532.5 eV, which are assigned to the orbital 1 s of carbon atoms (C1s) and the orbital 1 s of oxygen atoms (O1s), respectively [133]. In ZnO/GO composites, two more peaks appear around 1023.5 and 1045.5 eV, corresponding to electrons of the orbital 2p of zinc, 2p3/2, and 2p1/2 levels, respectively [47,74,134]. For ZnO/GO composites synthesized by microwave irradiation method, for instance, it is expected that the carbon percentage increases in comparison with GO because a reduction process occurs in this case where oxygenated groups are removed and, therefore, the C/O atomic ratio is higher for composites [115].

3.3. Texture

Analysis BET

The BET method (Brunauer–Emmett–Teller) is used to estimate the specific surface area (SSA) of a material, which constitutes a quantity of interest for several applications in photocatalysis. This method is based on the adsorption/desorption of gas on the surface of the sample. Knowing the molecular mass M of the gas, the mass WmL of gas required to form a complete monolayer on the sample, the sample mass m, and the molecular cross-sectional area A of the gas molecules, it is possible to estimate the specific surface area as SSA = (WmL/Mm)NA [135]. In this expression, N is the Avogadro’s number. WmL can be calculated from physisorption equilibrium isotherms, where the mass W or volume V of gas absorbed on the sample is obtained as a function of the relative vapor pressure P/Po, where P is the pressure of the adsorbate and Po its saturation vapor pressure. The isotherms are obtained at the normal boiling point of the adsorbate.
Usually, nitrogen gas is used, which has a boiling point of 77 K and is preferred because it is inert, inexpensive, and available in high purity. At temperatures below 100 K, Van der Waals’ forces govern the interaction between gas molecules and surfaces with the heat of adsorption lower than 4 kJ/mol, such that these forces allow the reversible physisorption of gas molecules in multiple layers on the material surface [135]. According to IUPAC [136], nitrogen physisorption isotherms can be categorized into six types, and the identification of an isotherm with these types allows one to have an idea of the porosity or non-porosity of the sample. For porous materials, the BJH (Barrett–Joyner–Halenda) method is used to estimate pore size distribution from the physisorption equilibrium isotherms. The BJH theory assumes that the pore’s shape is cylindrical and that the adsorbed mass results from physical adsorption on the pore walls and the liquid condensed in mesopores. This method fails to calculate micropore or narrow mesopore diameters. Pores with a diameter d < 2 nm are considered micropores, those with a diameter 2 nm < d < 50 nm are mesopores, and macropores are pores with d > 50 nm. Micropores are also subdivided into ultra-micropores with d < 0.7 nm, medium-sized micropores 0.7 nm < d < 0.9 nm, and super-micropores with d > 0.9 nm. The International Standard Organization (ISO) highlights non-local density functional theory (NLDFT) methods to calculate pore size distribution, which has higher accuracy than the BJH method [135].

3.4. Thermal Properties

Thermogravimetric Analysis/Differential Thermal Analyzer (TG/DTA)

In a thermogravimetric analysis (TGA), the weight change in a material is measured as a temperature and time function. Hence, the output is a graph of weight loss percentage vs. temperature. This type of graph is useful to investigate the thermal stability of a material. Hence, the characterization of ZnO–graphene composites provides valuable information about the thermal stability of an improved photocatalyst. From TGA data, it is possible to make a related analysis called differential thermal analysis (DTA), where the derivative of the weight loss curve is obtained and plotted versus temperature. This graph is useful to identify phase transitions, such as melting or crystallization points. In this case, complementary information obtained by DRX is necessary to know the implied phases. The information obtained makes it possible to determine endothermic and exothermic processes where there is no associated weight loss, such as crystallization and melting, or, conversely, or where there is weight loss, i.e., degradation.

3.5. Optical Properties

Ultraviolet-Visible Spectroscopy (UV-vis)

As its name implies, ultraviolet-visible spectroscopy (UV-vis) explores the properties of a material for absorption of electromagnetic radiation in the spectrum’s ultraviolet and visible region. However, this range is usually extended to near-infrared radiation. In a UV-vis spectrophotometer, a light beam is directed to the sample, and the absorbance is measured between 200 and 800 nm. The idea is that when the energy of the incident photons equals the energy difference of electronic transitions, the light energy is absorbed by the material to promote these transitions of electrons from low to higher energy orbitals. The spectrophotometer records absorption at each wavelength to give a graph of absorbance versus wavelength. The information thus acquired, among other things, is useful to study the photocatalytic performance of nanocomposites ZnO–graphene. It is known that, for example, the interaction between ZnO and graphene can reduce the bandgap in the composites compared to that of the pure ZnO. Therefore, the incorporation of ZnO would improve the absorption and photocatalytic properties of the hybrid material [112].
From absorbance data, it is possible to obtain a Tauc graph to determine the material’s bandgap [137]. The Tauc method provides a procedure to estimate the bandgap energy of amorphous semiconductors because the absorption coefficient α and the photon energy hν are related by the equation (αhν)1/ϒ = B(hν − Eg), where h is the Plank’s constant, ν is the frequency of the photon, B is a constant, and Eg is the bandgap energy. If the graph of (αhν)2 as a function of hν shows a steep increase, that is, when ϒ = 1/2, then the semiconductor is direct. If the increase occurs when ϒ = 2, the semiconductor is indirect. In any case, the straight-line intercept with the x-axis gives an estimate of the bandgap.
For powder samples, the bandgap can be estimated from a diffuse reflectance spectrum [61,138]. In this case, the surface-reflected UV-vis radiation is collected as a function of the photon wavelength, and this reflectance spectrum is transformed to the corresponding absorption spectrum by finding the Kubelka−Munk function F(R) = K/S, where K and S are the absorption and scattering coefficients, respectively. The procedure that follows this is similar to the mentioned above, but replacing α with F(R). The equation used for the analysis would be [F(R)hν] 1/ϒ = B(hν − Eg). The results obtained from this approach are plausible if the semiconductor does not absorb radiation with energy lower than that of the bandgap. However, for defected, doped materials or surface modified materials, such as ZnO–graphene composites, localized intra bandgap states may be introduced, producing a sub-bandgap absorption. In the absorption spectrum, it appears as an exponential behavior tail below the optical bandgap’s energy, which is known as an Urbach tail. This behavior should be taken into account to determine the bandgap energy, such that a direct application of the Tauc or Kubelka-Monk methods would not be valid, and some modifications are necessary [137].

3.6. Electrical Propierties

Electrochemical Impedance Spectroscopy (EIS)

EIS is a characterization technique that seeks to analyze an electrochemical system’s electrical response by measuring its impedance over a specific range of frequencies of an alternating voltage signal. The electrochemical system is an experimental setup consisting of two or more electrodes placed separately in an ionic media, an electrolyte. As it is known, impedance is a generalized concept of resistance useful for analyzing alternating current circuits. The measurement of impedance is then made by applying an oscillating voltage to the system and measuring the current response. The impedance is a complex quantity that depends on the frequency of the applied voltage. Usually, each frequency value’s impedance’s real and imaginary parts are represented in an Argand diagram known as the Nyquist plot. In this way, a single point on the Nyquist plot corresponds to the impedance obtained for a certain frequency. The set of points for all frequencies considered is the impedance spectrum.
Fitting this spectrum according to the impedance response of a combination of basic electrical components such as resistors and capacitors allows insight into the electrical conduction properties of the system. In a Nyquist plot, points relatively close to the origin correspond to high frequencies, and points far from the origin correspond to low frequencies. That is so because the impedance increases when the frequency decreases. Certain forms exhibited by the dot pattern in the Nyquist plot are characteristic of specific electrical properties or processes in the system. For example, semicircles in the Nyquist plot are common and usually associated with charge transfer processes. When a fluid surrounds the surface of an electrode, two parallel layers of charge are formed. The first layer consists of ions adsorbed onto the electrode by chemical interactions, and the second layer is composed of ions attracted to this first layer by the Coulomb force. This double layer can be modeled as a capacitor. If a charge transfer occurs at the electrode surface, the double layer and the charge transfer can be modeled as a capacitor and a resistor in parallel, whose total impedance depends on the frequency in such a way that the Nyquist plot is a semicircle.
The various processes involved in a system’s electrochemical properties can complicate building a model for electrical conduction. However, in the EIS analysis of ZnO/graphene composites is common to compare the Nyquist plot between different synthesized composites and contrast with the Nyquist plot of the bare ZnO, looking for which of these shows a better charge transfer, which in turn, implies a better performance of the material for applications in photocatalysis [112,116], hydrogen evolution [61] or batteries [139].

3.7. Active Species Determination

3.7.1. Free-Radical-Capturing Experiments (Radical Scavengers)

When composites are designed for photocatalytic tests, and the degradation process needs to be explored, it is convenient to carry out free-radical capturing experiments to explore the reactive species in the photocatalysis process [77,140]. These essays are also called free-radical scavenging experiments. The identification of the active species will help to propose a reaction mechanism. Isopropyl alcohol (IPA), ethylenediaminetetraacetic acid disodium (EDTA-2Na), and benzoquinone (BQ) are usually used as traps or specific scavengers for hydroxyl (∙OH), holes (h+), and superoxide radicals (∙O2–), respectively. In this way, to determine what are the major active species, the photocatalytic tests are run over in similar conditions but using, in the reaction system, the same concentration of each one of the scavengers, one at a time. Then, the degradation efficiency for the pollutant is compared with the efficiency obtained without using any scavengers. The lowest degradation percentage obtained indicates that the respective scavenger captured the principal reactive species, and for this reason, the degradation efficiency was reduced. Comparing the results between the different scavengers allows us to identify the dominance of the reactive species. Reaction mechanisms of photocatalytic water oxidation on ZnO have been quite studied [141]; however, if possible, free-radical-capturing experiments are always welcome for new applications in photocatalysis of ZnO–graphene composites.

3.7.2. Electron Paramagnetic Resonance Spectroscopy (EPR)

EPR, also called electron spin resonance spectroscopy (ESR), is a technique used to identify atoms or molecules with unpaired electrons. Therefore, it is useful to detect radicals’ presence and contribute to the analysis of reaction mechanisms in applications of ZnO–graphene composites [140]. It is known that atoms and molecules with unpaired electrons create a magnetic moment of electronic origin, acting as paramagnetic centers. If initially the molecule has a certain energy in the absence of a magnetic field, and then the molecule is placed in a magnetic field, this field divides what was initially a single energy value into various energy levels separated by an interval that depends on the magnitude of the field. This separation is due to the Zeeman effect, the interaction of the molecule’s magnetic moment with the applied magnetic field.
By subjecting the molecule in the magnetic field to the subsequent action of an electromagnetic wave, transitions between the energy levels can be generated if the wave’s energy matches the energy separation between adjacent levels. These transitions lead to the absorption of energy from the electromagnetic wave, observed as a resonance peak in the absorption signal. This signal can provide information about the estimated number of paramagnetic centers in the sample. When the half-life time of radicals is too short to be detected using EPR, compounds known as spin traps are used, which react covalently with the radicals to form a more stable adduct with paramagnetic behavior. The most used spin traps are alpha-phenyl N-tertiary-butyl nitrone (PBN) and 5,5-dimethyl-pyrroline N-oxide (DMPO).

4. Photocatalytic Performance and Applications

Considering a future ZnO commercial application in photocatalysis, the drawbacks that it presents must be resolved: no absorption of visible light, high e - h+ pair recombination rate, the susceptibility to photo-corrosion, and dissolution in strongly acidic and basic conditions, as the most relevant aspects [24]. To improve the photocatalytic performance of bare ZnO in terms of inhibition of the electron–hole recombination, high surface area, elimination of photo-corrosion, and high stability/reusability, coupling ZnO with 2D graphene compounds seems to be the best option of all available (e.g., metal doping, nonmetal doping, coupling with other semiconductors, among others.) [25]. The benefits of using graphene to form composites with ZnO could include efficient charge separation and migration, extended light absorption, and improved photostability, among others [142]. Despite the mentioned drawbacks, the use of ZnO as a photocatalyst is widespread. Considering the number of works published about ZnO, graphene, and its composites, it can be observed that the interest is centered on the degradation of harmful pollutants (Figure 23a), followed by the H2 production and CO2 reduction. By the number of publications devoted to the study of the ZnO–graphene, it can be noted that this research topic is in its initial stages, despite the potential benefits of employing graphene to overcome the problems of ZnO.
The photocatalytic evaluation of the ZnO–graphene composites has been oriented mainly towards the degradation of organic compounds, highlighting the use of colorants (i.e., methylene blue, methyl orange, rhodamine B) as model pollutants, as depicted in Figure 23b, where this application comprises about the 84% of the publications, in the 2016–2020 timespan. Surprisingly, photocatalytic disinfection takes second place in the composites’ reported applications, with 7%. The hydrogen evolution reaction in the presence of sacrificial agents (i.e., methanol, ethanol, among others) occupies the third place of application [4,143] (ca. 4%), followed by the photocatalytic reduction of inorganic ions, such as Cr6+ [76,144,145,146,147], or organic compounds, such as several nitroarenes [148,149] (ca. 3%). To a lesser extent, these composites have been tested in the photocatalytic reduction of CO2 towards obtaining solar fuels [27,150] (ca. 2%). This means that we are in the initial stage of research and knowledge of the ZnO–graphene composites’ photocatalytic performance in the last three mentioned reactions.
Water and air pollution are critical global health issues that involve the removal or degradation of pollutants, such as dyes, pesticides, pharmaceutical ingredients, organohalides, phenols, surfactants, heavy metal ions, agricultural waste, pathogens, volatile organic compounds, nitrogen oxides, carbon monoxide, sulfur oxides, ozone, among others, for which physical, physicochemical, biological and chemical methods are used or investigated [151,152]. Photocatalysis belongs to chemical methods and is considered an advanced oxidation/reduction process, removing or degrading organic/inorganic compounds that do not completely decompose by using conventional biological methods [153]. It can generate high reactive oxygen species (ROS) concentration to fully oxidize most organic compounds into carbon dioxide, water, and mineral acids. For example, after irradiation of ZnO with a suitable energy source, see Figure 24, the set of reactions (3)–(8) can occur until the complete dye degradation in an aqueous medium is achieved [20,154].
ZnO + h ν   e   ( CB ) +   h + ( VB )
O 2   + e     · O 2
H 2 O +   h +   · OH +   H +
· O 2 +   H +     · OOH + e +   H +   H 2 O 2  
  H 2 O 2 +   e     · OH +   OH
dye + ( O 2 ,   e ,   · O 2   ,   and · OH )   Intermediate +   time Mineralized   products
It is worth highlighting at this point, the use of other types of oxidant agents other than oxygen, such as H2O2, KHSO5, KBrO3, and K2S2O8 into the reaction medium, which promotes the direct oxidation of pollutants through the valence band holes, facilitate the adsorption–desorption process by changing the surface acid–base properties, and the free-radical formation from the oxidants favor the pollutant degradation [35], as shown in Figure 25.
The morphology of ZnO nanostructures plays a crucial role in photocatalysis, which can drastically enhance the photocatalytic performance compared to the conventional ZnO [18,155]. In ZnO rods’ case, an explanation for its improved photocatalytic behavior is related to the exposition of a greater proportion of polar faces where hydroxyl ions are adsorbed and then transformed to OH radicals [155]. However, since most of the model reactions in photocatalysis are in the degradation of dyes, it has not yet been concluded whether the 1D nanostructures of ZnO are the most suitable for the entire range of reactions [15].
The reported morphologies include nanoparticles, nanorods, nanosheets, nanospheres, microspheres, spheres, nanoflowers, and nanorings, as shown in Figure 26. The most common form is the nanoparticle morphology followed by the nanorod structure, independent of the used light source (UV, Figure 26a, or visible light, Figure 26b). The rest of the morphologies comprises ca. 27% when UV light is used and ca. 23% when visible light is used. As a critical property, morphology could play an essential role in the ZnO–graphene composites’ photocatalytic performance. Next, some works are described, highlighting the effect of the ZnO’s morphology in the composites’ performance and photostability.
Neelgund and Oki [156] reported an interesting study on cyanide photo-oxidation using ZnO tetragonal trapezoid shape coupled to GO, and GR irradiated with UV, Vis, and NIR irradiation. The higher photocatalytic activity (ca. 100% at 60 min) was observed by NIR laser irradiation, which was explained in terms of a thermal effect and exhibiting outstanding stability at high alkaline pH.
Rakkesh et al. [157] investigated ZnO nanorods planted chemically on a few GO layers and applied to the degradation of acridine-3,6-diamine and methylene blue under sunlight. Results are presented in Figure 27, showing an outstanding pollutant degradation in 5 min with the ZnO–GO composite compared to the ZnO nanorods. Authors claimed that their results are attributed to the presence of C–Zn chemical bonds, which favors the interfacial charge transfer process between the graphene layers and 1D ZnO NRs.
Mohamed [82] synthesized ZnO hollow microspheres/rGO nanocomposites to be evaluated in the 2,4-dichlorophenoxy acetic acid (2,4-D) degradation under direct sunlight irradiation. He found that the photocatalytic activity was enhanced by the incorporation of several amounts of GO (Figure 28, depicted as ZGO0, ZGO1, ZGO2, and ZGO3), which was explained by enhancing the e h+ pair recombination, and by shifting the bandgap energy of ZnO from 3.1 eV and 2.7 eV, allowing the absorption of visible light.
Neena et al. [158] synthesized ZnO nanorods with nitrogen-doped reduced graphene oxide (N-rGO) for the degradation of 2,4-dichlorophenol (2,4-DCP) and degradation of rhodamine B. They compared the photocatalytic performance of ZnO, GO, N-rGO, ZnO/rGO, and ZnO/N-rGO, finding that in all the model study reactions, the ZnO/N-rGO composite showing the higher photocatalytic activity. Note that in this composite, the N-rGO acts as a photosensitizer that absorbs visible light and, after its excitation, injects electrons towards the ZnO conduction band, and then performs the photo-redox process, as shown in Figure 29. The authors also claimed that N-rGO could behave as p-type semiconduction, and after coupling with n-type ZnO nanorods, a p-n junction is formed.
Nguyen et al. [159] compared the photoactivity of ZnO–rGO with different ZnO morphologies, i.e., nanospheres (sZG), nanodisks (dZG), and nanorods (rZG), on the photocatalytic degradation of dyes (MB and Rh-B) under UV irradiation. As shown in Figure 30, the smallest particle size (15–35 nm) was obtained by the ZnO spheres, which results in rapid transport of excited electrons compared to short rods and disks. Note that higher adsorption and photocatalytic degradation of the dyes were observed with the ZnO spheres/rGO composites.
Tayebi et al. [160] carried out a detailed study on the effect of the morphology of ZnO bound with rGO on the photocatalytic activity using methyl orange (MO) degradation as a model reaction, highlighting the photo-corrosion suppression. Figure 30a,b compares the MO concentration profiles for ZnO nanoparticles (ZnO NP), ZnO NP-rGO (GNP), ZnO nanorods (ZnO NR), and ZnO NR-rGO (GNR) under UV and Visible light irradiation. It is clear from Figure 31 that the highest photocatalytic activity was obtained with the GNR composite, showing a remarkable photo-corrosion suppression (∼0.5%) compared to 10, 35, and 45% for ZnO/GNP, ZnO NR, and ZnO NP, respectively. The authors explained the greater effectiveness of the GNR system since the movement of photoexcited electron–hole in the longitudinal direction in ZnO nanorods decreases the probability of electron–hole recombination, compared to ZnO particles.
Hu et al. [76] synthesized a hierarchically nanostructured ZnO onto 2D neat graphene sheets for the Cr(VI) photoreduction reaction. The chrysanthemum-like ZnO microstructures exhibited a strong metal-support interaction at the interface with neat graphene, evidencing C–O–Zn bonds. Figure 32 displays the normalized concentration profiles of Cr (VI) employing ZnO, neat graphene (Gr), the mechanical mixture of Zn+Gr (ZnO-B-Gr), and ZnO–neat graphene (ZnO/Gr) under UV and visible light. It was evident that ZnO/Gr sample converted 100% of original Cr(VI) concentration at 60 min under UV-light, whereas almost 90% conversion of Cr(VI) to Cr(III) was reached at 180 min visible light. Interestingly, the presence of neat graphene favored the Cr(VI) adsorption, and it was also confirmed the photo-corrosion suppression. This remarkable photocatalytic performance was interpreted depending on the type of irradiation used. A common source of electrons comes from the excitation with UV light, both of ZnO and graphene, while with visible light, the electrons coming from the excitation of graphene are injected into the conduction band of ZnO.
Flores et al. [161] studied the removal of simazine (i.e., a triazine class herbicide) from an aqueous solution under visible light employing zinc oxide/graphene oxide composites (Figure 33). A defined ZnO morphology is not reported; however, it is assumed that nanoparticles of around 23 nm were found. It was investigated the effect of initial reaction pH, ZnO-loading onto GO, and mass of catalyst on removing the herbicide. Interestingly, the best photocatalytic performance was observed with the ZnO/GO composites at pH 2, which implies that the presence of GO inhibits the dissolution of ZnO in this strong acid medium.
Sharma et al. [86] reported the photocatalytic mineralization of ofloxacin (antibiotic) in an aqueous solution using reduced graphene oxide supported mesoporous zinc oxide (rGO@ZnO). The optimal conditions for the ofloxacin mineralization were as follows: 0.5 wt % rGO@ZnO, 1 g/L catalyst dose, pH 7, and UV light. The optimal composite showed photostability, and during six reaction cycles, the degradation efficiency decreases from 99% in the first cycle to 83.3% after the end of six cycles. The best photocatalytic performance of the rGO@ZnO composites compared to ZnO nanoflowers was interpreted by improving light-harvesting, enhancing the effective separation of the photo-generated charge carriers, and increasing the stability.
Comparing the photocatalytic performance of hybrid ZnO/graphene nanocomposites evaluated in pollutants’ degradation is not easy because they are not synthesized under similar conditions. The physical–chemical properties of the nanocomposites depend on the type- and synthesis conditions. Therefore, small chemical composition changes, or precursor selection, can impact the physical and chemical characteristics [162].

5. Conclusions

In summary, this work highlights the different preparation methods of ZnO–graphene composites, describes in detail the fundamentals and usefulness of characterization techniques, and analyses some case studies about the influence of ZnO’s morphology in photocatalytic behavior of the composites. Important conclusions can be drawn regarding the synthesis of composites. For instance, the conventional chemical methods, i.e., hydrothermal, sol–gel, and co-precipitation, persist as the favorite routes due to their ease and versatility. However, microwave and ultrasound-assisted methods have a growing interest due to the speed and effectiveness of producing ZnO composites. Regarding the graphene species used to form the composite with ZnO, reduced graphene oxide is used in 50%, 25% graphene oxide, and 20% graphene. Spherical nanoparticles, rods, and not defined ZnO nanostructures coupled with graphene species were the most reported morphologies, with 23, 19, and 17%, respectively. Regarding ZnO particle size, in ZnO–graphene nanocomposites, 33.67% of the reviewed works do not present information on the size of the ZnO structures on the carbonaceous material (rGO, GO, or graphene). This is because a clear and defined ZnO morphology is not achieved, and therefore reporting a size distribution is a great challenge.
Recently, there is a significant interest in synthesizing ZnO hierarchical 3D nanostructures formed by the assembly of simpler blocks. These 3D nanostructures inherit and reinforce the properties of their most basic components. They would constitute the study of a whole controlled bottom-up technique to design new nanodevices or nanomaterials. Further investigations are needed to improve these products’ quality and scale and develop new synthesis methods, novel morphologies, and understand the formation mechanism of the nanostructures [163].
Several characterization techniques used to analyze morphology (SEM/TEM), structure and chemical composition (XRD, XPS), texture (gas adsorption), thermal properties (TGA/DTA), optical properties (UV-vis spectroscopy), electrical properties (Electrochemical Impedance spectroscopy), active species determination (free-radical-capturing experiments, EPR), were described and highlighting its usefulness in the context of ZnO–graphene composites. It is convenient to carry out more investigative work around the control of the synthesis processes so that, for example, if a comparison of the performance of different morphologies is required, it can be evidenced which variable should be changed to obtain the different shapes.
For some time, it was demonstrated that the morphology influences the catalytic performance of the ZnO materials as a consequence of differences in polar planes, oxygen vacancies, and specific surface areas [164]. Moreover, ZnO nanocomposites-based materials can exhibit an enhanced photocatalytic activity due to improvements in their structural and electronic properties of pristine ZnO [165]. Consequently, different ZnO dimensionalities linked to carbon-based materials should be further investigated, including theoretical studies, to unravel the structure and properties with the photocatalytic performance.
According to bibliometric studies of the photocatalytic applications of ZnO, graphene, and the ZnO–graphene composites, a notable increase in composites’ use was not detected. However, a growing research niche is noted on the topic of disinfection, i.e., 7%, compared to 84% dedicated to the degradation of contaminants. On the other hand, photocatalytic applications aimed at producing hydrogen or the reduction of CO2 do not present a considerable interest in research with ZnO–graphene composites. In this period (2016–2020), the photocatalytic evaluation studies were dominated by dye degradation as model reactions, mainly methylene blue. Nevertheless, significant advances were observed in the stability and consequent suppression of photo-corrosion under basic (pH 11) and acidic conditions (pH 2).
ZnO nanoparticles and nanorods were the most reported morphologies, compared to the other commonly synthesized morphologies for ZnO, independently of the light wavelength used. The experimental evidence in the consulted works indicates that ZnO’s 1D structures (e.g., nanorods) coupled with graphene species are the most effective way to reduce the bandgap and the recombination of charge carriers and to suppress ZnO photo-corrosion. To date, considerable progress has been made regarding the possibility of forming a ZnO–graphene composite with good photophysical and photochemical properties to be used in photocatalysis with visible light. Hence, a meaningful increase in the use of visible light was perceived, mainly when the nanoparticles and nanorods were obtained.
Accordingly, more studies from the fundamental and engineering perspective must have a photocatalytic prototype with improved and controllable properties. For example, the hybridization of ZnO nanostructures with graphene species is not known with certainty, which could involve the ZnO morphology, the chosen graphene species, and of course, the preparation method used. In most study cases with ZnO–graphene composites, the best photocatalytic behavior is explained by each species’ bands’ structure and position. Still, no studies correlate the physicochemical properties of the composite with the activity and stability.
Better photocatalytic performance is always reported for the graphene composites containing low dimensional nanostructures, which is explained in terms of a more efficient charge separation and transfer, a higher specific surface area, and enhanced light absorption. However, some studies have shown that these properties could be improved further by metal doping and ternary composite synthesis; therefore, new possibilities can be explored in this direction. In all these nanostructures, more research should be focused on how the coupling between 0D, 1D, or 2D ZnO nanostructures and carbon-based nanomaterials, or vice versa, 0D, 1D or 2D nanostructures of G, GO or rGO, or rGO with ZnO, affect the physics of each nanostructure. In this sense, computational studies are necessary [166]. Another work that needs to be intensified is applying ZnO/Graphene composites in the degradation of persistent organic pollutants.
Regarding other photocatalytic applications of the ZnO–graphene composites, it is extraordinary the minimal amount of works devoted to water splitting or hydrogen production and, especially, CO2 reduction. Given ZnO’s excellent electron mobility, it could favor the simultaneous transfer of electrons and protons to reduce CO2 towards a gamma of organic compounds. Finally, studies related to the immobilization of these composites in flow reactors are needed. It would be useful to have a stable, low-cost, active material with visible light for photocatalytic reactions in the gas phase (e.g., VOCs degradation, CO2 reduction, methane reforming).

Author Contributions

Conceptualization, M.A.V., E.A.; formal analysis, E.A., A.S.M., E.R., J.M.B.-A., Á.S., and M.A.V.; investigation, E.A., A.S.M., E.R., J.M.B.-A., Á.S., and M.A.V.; data curation, E.A., A.S.M., and J.M.B.-A.; writing—original draft preparation, E.A., A.S.M., E.R., J.M.B.-A., Á.S., and M.A.V.; writing—review and editing, E.A., A.S.M., E.R., J.M.B.-A., Á.S., and M.A.V.; visualization, E.A. and M.A.V.; supervision, M.A.V.; project administration, M.A.V. and E.A.; funding acquisition, M.A.V. and E.A. All authors have read and agreed to the published version of the manuscript.

Funding

This research was funded by CONACyT México (project numbers 299909 and 807101) and Instituto Politécnico Nacional (SIP projects: 20200362 and 20200684).

Institutional Review Board Statement

Not applicable, studies not involving human or animals.

Informed Consent Statement

Not applicable, studies not involving human.

Data Availability Statement

Data is contained within the article.

Acknowledgments

Aura S. Merlano thanks Colciencias-Colombia (Convocatoria No. 727–2015) for the financial support for a research internship at the Instituto Politécnico Nacional, after which the scientific cooperation with the homologous groups in this work was strengthened.

Conflicts of Interest

The authors declare no conflict of interest.

References

  1. Luo, J.; Zhang, S.; Sun, M.; Yang, L.; Luo, S.; Crittenden, J.C. A Critical Review on Energy Conversion and Environmental Remediation of Photocatalysts with Remodeling Crystal Lattice, Surface, and Interface. ACS Nano 2019, 13, 9811–9840. [Google Scholar] [CrossRef]
  2. Li, C.; Xu, Y.; Tu, W.; Chen, G.; Xu, R. Metal-Free Photocatalysts for Various Applications in Energy Conversion and Environmental Purification. Green Chem. 2017, 19, 882–899. [Google Scholar] [CrossRef]
  3. Singla, S.; Sharma, S.; Basu, S.; Shetti, N.P.; Reddy, K.R. Graphene/Graphitic Carbon Nitride-Based Ternary Nanohybrids: Synthesis Methods, Properties, and Applications for Photocatalytic Hydrogen Production. FlatChem 2020, 24, 100200. [Google Scholar] [CrossRef]
  4. Tahir, M.; Tasleem, S.; Tahir, B. Recent Development in Band Engineering of Binary Semiconductor Materials for Solar Driven Photocatalytic Hydrogen Production. Int. J. Hydrog. Energy 2020, 45, 15985–16038. [Google Scholar] [CrossRef]
  5. Long, Z.; Li, Q.; Wei, T.; Zhang, G.; Ren, Z. Historical Development and Prospects of Photocatalysts for Pollutant Removal in Water. J. Hazard. Mater. 2020, 395, 122599. [Google Scholar] [CrossRef]
  6. Janković, N.Z.; Plata, D.L. Engineered Nanomaterials in the Context of Global Element Cycles. Environ. Sci. Nano 2019, 6, 2697–2711. [Google Scholar] [CrossRef] [Green Version]
  7. Moezzi, A.; McDonagh, A.M.; Cortie, M.B. Zinc Oxide Particles: Synthesis, Properties and Applications. Chem. Eng. J. 2012, 185–186, 1–22. [Google Scholar] [CrossRef]
  8. Bhati, V.S.; Hojamberdiev, M.; Kumar, M. Enhanced Sensing Performance of ZnO Nanostructures-Based Gas Sensors: A Review. Energy Rep. 2020, 6, 46–62. [Google Scholar] [CrossRef]
  9. Rackauskas, S.; Mustonen, K.; Järvinen, T.; Mattila, M.; Klimova, O.; Jiang, H.; Tolochko, O.; Lipsanen, H.; Kauppinen, E.I.; Nasibulin, A.G. Synthesis of ZnO Tetrapods for Flexible and Transparent UV Sensors. Nanotechnology 2012, 23, 095502. [Google Scholar] [CrossRef] [Green Version]
  10. Carofiglio, M.; Barui, S.; Cauda, V.; Laurenti, M. Doped Zinc Oxide Nanoparticles: Synthesis, Characterization and Potential Use in Nanomedicine. Appl. Sci. 2020, 10, 5194. [Google Scholar] [CrossRef]
  11. Wang, L.; Zhang, G.; Liu, Q.; Duan, H. Recent Progress in Zn-Based Anodes for Advanced Lithium Ion Batteries. Mater. Chem. Front. 2018, 2, 1414–1435. [Google Scholar] [CrossRef]
  12. Consonni, V.; Briscoe, J.; Kärber, E.; Li, X.; Cossuet, T. ZnO Nanowires for Solar Cells: A Comprehensive Review. Nanotechnology 2019, 30, 362001. [Google Scholar] [CrossRef] [PubMed]
  13. Arrabito, G.; Aleeva, Y.; Pezzilli, R.; Ferrara, V.; Medaglia, P.G.; Pignataro, B.; Prestopino, G. Printing ZnO Inks: From Principles to Devices. Crystals 2020, 10, 449. [Google Scholar] [CrossRef]
  14. Singh, A.; Singh, N.B.; Afzal, S.; Singh, T.; Hussain, I. Zinc Oxide Nanoparticles: A Review of Their Biological Synthesis, Antimicrobial Activity, Uptake, Translocation and Biotransformation in Plants. J. Mater. Sci. 2018, 53, 185–201. [Google Scholar] [CrossRef]
  15. Ong, C.B.; Ng, L.Y.; Mohammad, A.W. A Review of ZnO Nanoparticles as Solar Photocatalysts: Synthesis, Mechanisms and Applications. Renew. Sustain. Energy Rev. 2018, 81, 536–551. [Google Scholar] [CrossRef]
  16. Kegel, J.; Povey, I.M.; Pemble, M.E. Zinc Oxide for Solar Water Splitting: A Brief Review of the Material’s Challenges and Associated Opportunities. Nano Energy 2018, 54, 409–428. [Google Scholar] [CrossRef]
  17. Desai, M.A.; Vyas, A.N.; Saratale, G.D.; Sartale, S.D. Zinc Oxide Superstructures: Recent Synthesis Approaches and Application for Hydrogen Production via Photoelectrochemical Water Splitting. Int. J. Hydrog. Energy 2019, 44, 2091–2127. [Google Scholar] [CrossRef]
  18. Das, A.; Nikhil, S.K.; Nair, R.G. Influence of Surface Morphology on Photocatalytic Performance of Zinc Oxide: A Review. Nano-Struct. Nano-Objects 2019, 19, 100353. [Google Scholar] [CrossRef]
  19. Wojnarowicz, J.; Chudoba, T.; Lojkowski, W. A Review of Microwave Synthesis of Zinc Oxide Nanomaterials: Reactants, Process Parameters and Morphologies. Nanomaterials 2020, 10, 1086. [Google Scholar] [CrossRef]
  20. Samadi, M.; Zirak, M.; Naseri, A.; Kheirabadi, M.; Ebrahimi, M.; Moshfegh, A.Z. Design and Tailoring of One-Dimensional ZnO Nanomaterials for Photocatalytic Degradation of Organic Dyes: A Review. Res. Chem. Intermed. 2019, 45, 2197–2254. [Google Scholar] [CrossRef]
  21. Ma, M.; Huang, Y.; Liu, J.; Liu, K.; Wang, Z.; Zhao, C.; Qu, S.; Wang, Z. Engineering the Photoelectrochemical Behaviors of ZnO for Efficient Solar Water Splitting. J. Semicond. 2020, 41, 091702. [Google Scholar] [CrossRef]
  22. Chang, J.; Waclawik, E.R. Facet-Controlled Self-Assembly of ZnO Nanocrystals by Non-Hydrolytic Aminolysis and Their Photodegradation Activities. CrystEngComm 2012, 14, 4041–4048. [Google Scholar] [CrossRef] [Green Version]
  23. Peng, Y.-K.; Tsang, S.C.E. Facet-Dependent Photocatalysis of Nanosize Semiconductive Metal Oxides and Progress of Their Characterization. Nano Today 2018, 18, 15–34. [Google Scholar] [CrossRef]
  24. Kumar, S.G.; Rao, K.S.R.K. Zinc Oxide Based Photocatalysis: Tailoring Surface-Bulk Structure and Related Interfacial Charge Carrier Dynamics for Better Environmental Applications. RSC Adv. 2015, 5, 3306–3351. [Google Scholar] [CrossRef]
  25. Kumar, S.; Kumar, A.; Kumar, A.; Krishnan, V. Nanoscale Zinc Oxide Based Heterojunctions as Visible Light Active Photocatalysts for Hydrogen Energy and Environmental Remediation. Catal. Rev. 2020, 62, 346–405. [Google Scholar] [CrossRef]
  26. Albiter, E.; Barrera-Andrade, J.M.; Rojas-García, E.; Valenzuela, M.A. Recent advances of nanocarbon-inorganic hybrids in photocatalysis. In Nanocarbon and Its Composites; Khan, A., Jawaid, M., Inamuddin Asiri, A.M., Eds.; Woodhead Publishing Series in Composites Science and Engineering; Woodhead Publishing: Sawston, UK, 2019; pp. 521–588. ISBN 978-0-08-102509-3. [Google Scholar]
  27. Mamba, G.; Gangashe, G.; Moss, L.; Hariganesh, S.; Thakur, S.; Vadivel, S.; Mishra, A.K.; Vilakati, G.D.; Muthuraj, V.; Nkambule, T.T.I. State of the Art on the Photocatalytic Applications of Graphene Based Nanostructures: From Elimination of Hazardous Pollutants to Disinfection and Fuel Generation. J. Environ. Chem. Eng. 2020, 8, 103505. [Google Scholar] [CrossRef]
  28. Grajek, H.; Jonik, J.; Witkiewicz, Z.; Wawer, T.; Purchała, M. Applications of Graphene and Its Derivatives in Chemical Analysis. Crit. Rev. Anal. Chem. 2020, 50, 445–471. [Google Scholar] [CrossRef]
  29. Li, D.; Wang, T.; Li, Z.; Xu, X.; Wang, C.; Duan, Y. Application of Graphene-Based Materials for Detection of Nitrate and Nitrite in Water—A Review. Sensors 2020, 20, 54. [Google Scholar] [CrossRef] [Green Version]
  30. Sun, H.; Wang, S. Research Advances in the Synthesis of Nanocarbon-Based Photocatalysts and Their Applications for Photocatalytic Conversion of Carbon Dioxide to Hydrocarbon Fuels. Energy Fuels 2014, 28, 22–36. [Google Scholar] [CrossRef]
  31. Ashouri, R.; Ghasemipoor, P.; Rasekh, B.; Yazdian, F.; Mofradnia, S.R. The Effect of ZnO-Based Carbonaceous Materials for Degradation of Benzoic Pollutants: A Review. Int. J. Environ. Sci. Technol. 2019, 16, 1729–1740. [Google Scholar] [CrossRef]
  32. Yaqoob, A.A.; Serrà, A.; Ibrahim, M.N.M. Advances and Challenges in Developing Efficient Graphene Oxide-Based ZnO Photocatalysts for Dye Photo-Oxidation. Nanomaterials 2020, 10, 932. [Google Scholar] [CrossRef]
  33. Li, X.; Yu, J.; Wageh, S.; Al-Ghamdi, A.A.; Xie, J. Graphene in Photocatalysis: A Review. Small 2016, 12, 6640–6696. [Google Scholar] [CrossRef] [PubMed]
  34. Mohd, A.M.A.; Julkapli, N.M.; Abd, H.S.B. Review on ZnO Hybrid Photocatalyst: Impact on Photocatalytic Activities of Water Pollutant Degradation. Rev. Inorg. Chem. 2016, 36, 77–104. [Google Scholar] [CrossRef]
  35. Sushma, C.; Girish Kumar, S. Advancements in the Zinc Oxide Nanomaterials for Efficient Photocatalysis. Chem. Pap. 2017, 71, 2023–2042. [Google Scholar] [CrossRef]
  36. Hong, X.; Wang, X.; Li, Y.; Fu, J.; Liang, B. Progress in Graphene/Metal Oxide Composite Photocatalysts for Degradation of Organic Pollutants. Catalysts 2020, 10, 921. [Google Scholar] [CrossRef]
  37. Prasad, C.; Liu, Q.; Tang, H.; Yuvaraja, G.; Long, J.; Rammohan, A.; Zyryanov, G.V. An Overview of Graphene Oxide Supported Semiconductors Based Photocatalysts: Properties, Synthesis and Photocatalytic Applications. J. Mol. Liq. 2020, 297, 111826. [Google Scholar] [CrossRef]
  38. Gautam, S.; Agrawal, H.; Thakur, M.; Akbari, A.; Sharda, H.; Kaur, R.; Amini, M. Metal Oxides and Metal Organic Frameworks for the Photocatalytic Degradation: A Review. J. Environ. Chem. Eng. 2020, 8, 103726. [Google Scholar] [CrossRef]
  39. Adam, R.E.; Chalangar, E.; Pirhashemi, M.; Pozina, G.; Liu, X.; Palisaitis, J.; Pettersson, H.; Willander, M.; Nur, O. Graphene-Based Plasmonic Nanocomposites for Highly Enhanced Solar-Driven Photocatalytic Activities. RSC Adv. 2019, 9, 30585–30598. [Google Scholar] [CrossRef] [Green Version]
  40. Kindalkar, V.S.; Sandeep, K.M.; Kumara, K.; Dharmaprakash, S.M. Sol-Gel Synthesized Spin Coated GO: ZnO Composite Thin Films: Optical, Structural and Electrical Studies. Mater. Res. Express 2019, 6, 096435. [Google Scholar] [CrossRef]
  41. Yein, W.T.; Wang, Q.; Feng, X.; Li, Y.; Wu, X. Enhancement of Photocatalytic Performance in Sonochemical Synthesized ZnO–RGO Nanocomposites Owing to Effective Interfacial Interaction. Environ. Chem. Lett. 2018, 16, 251–264. [Google Scholar] [CrossRef]
  42. Samal, A.; Das, D.P. Transfiguring UV Light Active “Metal Oxides” to Visible Light Active Photocatayst by Reduced Graphene Oxide Hypostatization. Catal. Today 2018, 300, 124–135. [Google Scholar] [CrossRef]
  43. Yu, W.; Chen, X.; Mei, W.; Chen, C.; Tsang, Y. Photocatalytic and Electrochemical Performance of Three-Dimensional Reduced Graphene Oxide/WS2/Mg-Doped ZnO Composites. Appl. Surf. Sci. 2017, 400, 129–138. [Google Scholar] [CrossRef]
  44. Moqbel, R.A.; Gondal, M.A.; Qahtan, T.F.; Dastageer, M.A. Pulsed Laser Synthesis in Liquid of Efficient Visible-Light-Active ZnO/RGO Nanocomposites for Improved Photo-Catalytic Activity. Mater. Res. Express 2018, 5, 035050. [Google Scholar] [CrossRef]
  45. Jin, X.; Ma, Z.; Liu, G.; Hu, D.; Song, C.; Huang, Q. In-Situ Ionothermal Precipitation of Well-Dispersed ZnO Nanoparticles onto 2-Dimension Neat Graphene Sheets with Excellent Photocatalytic Activity. J. Environ. Chem. Eng. 2020, 8, 104030. [Google Scholar] [CrossRef]
  46. Shwetharani, R.; Chandan, H.R.; Sakar, M.; Balakrishna, G.R.; Reddy, K.R.; Raghu, A.V. Photocatalytic Semiconductor Thin Films for Hydrogen Production and Environmental Applications. Int. J. Hydrog. Energy 2020, 45, 18289–18308. [Google Scholar] [CrossRef]
  47. Neelgund, G.M.; Oki, A. ZnO Conjugated Graphene: An Efficient Sunlight Driven Photocatalyst for Degradation of Organic Dyes. Mater. Res. Bull. 2020, 129, 110911. [Google Scholar] [CrossRef]
  48. Van Tuan, P.; Phuong, T.T.; Tan, V.T.; Nguyen, S.X.; Khiem, T.N. In-Situ Hydrothermal Fabrication and Photocatalytic Behavior of ZnO/Reduced Graphene Oxide Nanocomposites with Varying Graphene Oxide Concentrations. Mater. Sci. Semicond. Process. 2020, 115, 105114. [Google Scholar] [CrossRef]
  49. Boukhoubza, I.; Khenfouch, M.; Achehboune, M.; Leontie, L.; Carlescu, A.; Doroftei, C.; Mothudi, B.M.; Zorkani, I.; Jorio, A. Graphene Oxide Coated Flower-Shaped ZnO Nanorods: Optoelectronic Properties. J. Alloy. Compd. 2020, 831, 154874. [Google Scholar] [CrossRef]
  50. Mahmud, R.A.; Shafawi, A.N.; Ahmed Ali, K.; Putri, L.K.; Md Rosli, N.I.; Mohamed, A.R. Graphene Nanoplatelets with Low Defect Density as a Synergetic Adsorbent and Electron Sink for ZnO in the Photocatalytic Degradation of Methylene Blue under UV–Vis Irradiation. Mater. Res. Bull. 2020, 128, 110876. [Google Scholar] [CrossRef]
  51. Lee, K.S.; Park, Y.J.; Shim, J.; Lim, G.-H.; Yim, S.-Y.; Seo, J.W.; Ryu, J.H.; Son, D.I. Inhibition of Photoconversion Activity in Self-Assembled ZnO-Graphene Quantum Dots Aggregated by 4-Aminophenol Used as a Linker. Molecules 2020, 25, 2802. [Google Scholar] [CrossRef]
  52. Yu, X.; Li, Z.; Dang, K.; Zhang, Z.; Gao, L.; Duan, L.; Jiang, Z.; Fan, J.; Zhao, P. Enhanced Photocatalytic Activity of Ag–ZnO/RGO Nanocomposites for Removal of Methylene Blue. J. Mater. Sci. Mater. Electron. 2018, 29, 8729–8737. [Google Scholar] [CrossRef]
  53. Varanda, L.C.; de Souza, C.G.S.; Perecin, C.J.; de Moraes, D.A.; de Queiróz, D.F.; Neves, H.R.; Souza Junior, J.B.; da Silva, M.F.; Albers, R.F.; da Silva, T.L. Inorganic and organic–inorganic composite nanoparticles with potential biomedical applications: Synthesis challenges for enhanced performance. In Materials for Biomedical Engineering; Grumezescu, V., Grumezescu, A.M., Eds.; Elsevier: Amsterdam, The Netherlands, 2019; pp. 47–99. ISBN 978-0-12-818431-8. [Google Scholar]
  54. Rane, A.V.; Kanny, K.; Abitha, V.K.; Thomas, S. Methods for Synthesis of Nanoparticles and Fabrication of Nanocomposites. In Synthesis of Inorganic Nanomaterials; Mohan Bhagyaraj, S., Oluwafemi, O.S., Kalarikkal, N., Thomas, S., Eds.; Micro and Nano Technologies; Woodhead Publishing: Sawston, UK, 2018; pp. 121–139. ISBN 978-0-08-101975-7. [Google Scholar]
  55. Prasad, S.; Kumar, V.; Kirubanandam, S.; Barhoum, A. Engineered nanomaterials: Nanofabrication and surface functionalization. In Emerging Applications of Nanoparticles and Architecture Nanostructures; Barhoum, A., Makhlouf, A.S.H., Eds.; Micro and Nano Technologies; Elsevier: Amsterdam, The Netherlands, 2018; pp. 305–340. ISBN 978-0-323-51254-1. [Google Scholar]
  56. Yao, C.; Zhu, J.; Li, H.; Zheng, B.; Wei, Y. Synthesis of ZnO Photocatalysts Using Various Surfactants. Russ. J. Phys. Chem. 2017, 91, 2680–2685. [Google Scholar] [CrossRef]
  57. Oppong, S.O.B.; Anku, W.W.; Shukla, S.K.; Govender, P.P. Synthesis and Characterisation of Neodymium Doped-Zinc Oxide–Graphene Oxide Nanocomposite as a Highly Efficient Photocatalyst for Enhanced Degradation of Indigo Carmine in Water under Simulated Solar Light. Res. Chem. Intermed. 2017, 43, 481–501. [Google Scholar] [CrossRef]
  58. Ahmad, I.; Akhtar, M.S.; Ahmed, E.; Ahmad, M. Highly Efficient Visible Light Driven Photocatalytic Activity of Graphene and CNTs Based Mg Doped ZnO Photocatalysts: A Comparative Study. Sep. Purif. Technol. 2020, 245, 116892. [Google Scholar] [CrossRef]
  59. Pogacean, F.; Ştefan, M.; Toloman, D.; Popa, A.; Leostean, C.; Turza, A.; Coros, M.; Pana, O.; Pruneanu, S. Photocatalytic and Electrocatalytic Properties of NGr-ZnO Hybrid Materials. Nanomaterials 2020, 10, 1473. [Google Scholar] [CrossRef]
  60. Yadav, R.; Kumar, V.; Saxena, V.; Singh, P.; Singh, V.K. Preparation of Controlled Lotus like Structured ZnO Decorated Reduced Graphene Oxide Nanocomposites to Obtain Enhanced Photocatalytic Properties. Ceram. Int. 2019, 45, 24999–25009. [Google Scholar] [CrossRef]
  61. Wang, J.; Wang, G.; Jiang, J.; Wan, Z.; Su, Y.; Tang, H. Insight into Charge Carrier Separation and Solar-Light Utilization: RGO Decorated 3D ZnO Hollow Microspheres for Enhanced Photocatalytic Hydrogen Evolution. J. Colloid Interface Sci. 2020, 564, 322–332. [Google Scholar] [CrossRef]
  62. Kumar, R.; Singh, R.K.; Singh, D.P.; Savu, R.; Moshkalev, S.A. Microwave Heating Time Dependent Synthesis of Various Dimensional Graphene Oxide Supported Hierarchical ZnO Nanostructures and Its Photoluminescence Studies. Mater. Des. 2016, 111, 291–300. [Google Scholar] [CrossRef]
  63. Bensebaa, F. Wet Production Methods. In Interface Science and Technology; Bensebaa, F., Ed.; Nanoparticle Technologies; Elsevier: Amsterdam, The Netherlands, 2013; Volume 19, pp. 85–146. [Google Scholar]
  64. Török, B.; Dransfield, T. (Eds.) Green Chemistry, 1st ed.; Elsevier: Amsterdam, The Netherlands, 2018; ISBN 978-0-12-809270-5. [Google Scholar]
  65. Abdel-Karim, R. Electrochemical Synthesis of Nanocomposites. Electrodepos. Compos. Mater. 2016. [Google Scholar] [CrossRef] [Green Version]
  66. Teh, S.J.; Lai, C.W.; Hamid, S.B.A. Novel Layer-by-Layer Assembly of RGO-Hybridised ZnO Sandwich Thin Films for the Improvement of Photo-Catalysed Hydrogen Production. J. Energy Chem. 2016, 25, 336–344. [Google Scholar] [CrossRef]
  67. Wang, P.; Wu, D.; Ao, Y.; Wang, C.; Hou, J. ZnO Nanorod Arrays Co-Loaded with Au Nanoparticles and Reduced Graphene Oxide: Synthesis, Characterization and Photocatalytic Application. Colloids Surf. A Physicochem. Eng. Asp. 2016, 492, 71–78. [Google Scholar] [CrossRef]
  68. Teh, S.J.; Yeoh, S.L.; Lee, K.M.; Lai, C.W.; Abdul Hamid, S.B.; Thong, K.L. Effect of Reduced Graphene Oxide-Hybridized ZnO Thin Films on the Photoinactivation of Staphylococcus Aureus and Salmonella Enterica Serovar Typhi. J. Photochem. Photobiol. B Biol. 2016, 161, 25–33. [Google Scholar] [CrossRef]
  69. Nanakkal, A.R.; Alexander, L.K. Photocatalytic Activity of Graphene/ZnO Nanocomposite Fabricated by Two-Step Electrochemical Route. J. Chem. Sci. 2017, 129, 95–102. [Google Scholar] [CrossRef] [Green Version]
  70. Liu, X.-S. Inorganic Photochemical Synthesis. In Modern Inorganic Synthetic Chemistry, 2nd ed.; Xu, R., Xu, Y., Eds.; Elsevier: Amsterdam, The Netherlands, 2017; pp. 143–165. ISBN 978-0-444-63591-4. [Google Scholar]
  71. Chen, C.; Zhou, P.; Wang, N.; Ma, Y.; San, H. UV-Assisted Photochemical Synthesis of Reduced Graphene Oxide/ZnO Nanowires Composite for Photoresponse Enhancement in UV Photodetectors. Nanomaterials 2018, 8, 26. [Google Scholar] [CrossRef] [PubMed] [Green Version]
  72. Abdolhosseinzadeh, S.; Asgharzadeh, H.; Sadighikia, S.; Khataee, A. UV-Assisted Synthesis of Reduced Graphene Oxide–ZnO Nanorod Composites Immobilized on Zn Foil with Enhanced Photocatalytic Performance. Res. Chem. Intermed. 2016, 42, 4479–4496. [Google Scholar] [CrossRef]
  73. Zhang, J.; Zhang, X.; Ding, Y.; Zhu, Y. ZnO/Graphene/Ag Composite as Recyclable Surface-Enhanced Raman Scattering Substrates. Appl. Opt. AO 2016, 55, 9105–9112. [Google Scholar] [CrossRef]
  74. Jabeen, M.; Ishaq, M.; Song, W.; Xu, L.; Maqsood, I.; Deng, Q. UV-Assisted Photocatalytic Synthesis of ZnO-Reduced Graphene Oxide Nanocomposites with Enhanced Photocatalytic Performance in Degradation of Methylene Blue. ECS J. Solid State Sci. Technol. 2017, 6, M36. [Google Scholar] [CrossRef]
  75. Li, X.; Yu, J.; Jaroniec, M.; Chen, X. Cocatalysts for Selective Photoreduction of CO2 into Solar Fuels. Chem. Rev. 2019, 119, 3962–4179. [Google Scholar] [CrossRef]
  76. Hu, D.; Song, C.; Jin, X.; Huang, Q. Polymer Solution-Assisted Assembly of Hierarchically Nanostructured ZnO onto 2D Neat Graphene Sheets with Excellent Photocatalytic Performance. J. Alloy. Compd. 2020, 843, 156030. [Google Scholar] [CrossRef]
  77. Moradi, S.; Sobhgol, S.A.; Hayati, F.; Isari, A.A.; Kakavandi, B.; Bashardoust, P.; Anvaripour, B. Performance and Reaction Mechanism of MgO/ZnO/Graphene Ternary Nanocomposite in Coupling with LED and Ultrasound Waves for the Degradation of Sulfamethoxazole and Pharmaceutical Wastewater. Sep. Purif. Technol. 2020, 251, 117373. [Google Scholar] [CrossRef]
  78. Labhane, P.K.; Sonawane, S.H.; Sonawane, G.H.; Patil, S.P.; Huse, V.R. Influence of Mg Doping on ZnO Nanoparticles Decorated on Graphene Oxide (GO) Crumpled Paper like Sheet and Its High Photo Catalytic Performance under Sunlight. J. Phys. Chem. Solids 2018, 114, 71–82. [Google Scholar] [CrossRef]
  79. Shi, X.; Zhang, J.; Cui, G.; Deng, N.; Wang, W.; Wang, Q.; Tang, B. Photocatalytic H2 Evolution Improvement for H Free-Radical Stabilization by Electrostatic Interaction of a Cu-BTC MOF with ZnO/GO. Nano Res. 2018, 11, 979–987. [Google Scholar] [CrossRef]
  80. Yuan, M.; Xiong, C.; Jiang, L.; Li, H.; Yuan, M. The Preparation, Characterization, Mechanical and Antibacterial Properties of GO-ZnO Nanocomposites with a Poly(l-Lactide)-Modified Surface. Materials 2018, 11, 323. [Google Scholar] [CrossRef] [PubMed] [Green Version]
  81. Xu, T.; Hu, J.; Yang, Y.; Que, W.; Yin, X.; Wu, H.; Chen, L. Solid-State Synthesis of ZnO Nanorods Coupled with Reduced Graphene Oxide for Photocatalytic Application. J. Mater. Sci. Mater. Electron. 2018, 29, 4888–4894. [Google Scholar] [CrossRef]
  82. Mohamed, H.H. Sonochemical Synthesis of ZnO Hollow Microstructure/Reduced Graphene Oxide for Enhanced Sunlight Photocatalytic Degradation of Organic Pollutants. J. Photochem. Photobiol. A Chem. 2018, 353, 401–408. [Google Scholar] [CrossRef]
  83. Yousefi, R.; Beheshtian, J.; Seyed-Talebi, S.M.; Azimi, H.R.; Jamali-Sheini, F. Experimental and Theoretical Study of Enhanced Photocatalytic Activity of Mg-Doped ZnO NPs and ZnO/RGO Nanocomposites. Chem. Asian J. 2018, 13, 194–203. [Google Scholar] [CrossRef]
  84. Guo, Q.; Ghadiri, R.; Weigel, T.; Aumann, A.; Gurevich, E.L.; Esen, C.; Medenbach, O.; Cheng, W.; Chichkov, B.; Ostendorf, A. Comparison of in Situ and Ex Situ Methods for Synthesis of Two-Photon Polymerization Polymer Nanocomposites. Polymers 2014, 6, 2037–2050. [Google Scholar] [CrossRef]
  85. Jafarisani, M.; Cheshme Khavar, A.H.; Mahjoub, A.R.; Luque, R.; Rodríguez-Padrón, D.; Satari, M.; Gharravi, A.M.; Khastar, H.; Kazemi, S.S.; Masoumikarimi, M. Enhanced Visible-Light-Driven Photocatalytic Degradation of Emerging Water Contaminants by a Modified Zinc Oxide-Based Photocatalyst; In-Vivo and in-Vitro Toxicity Evaluation of Wastewater and PCO-Treated Water. Sep. Purif. Technol. 2020, 243, 116430. [Google Scholar] [CrossRef]
  86. Sharma, P.; Kumar, N.; Chauhan, R.; Singh, V.; Srivastava, V.C.; Bhatnagar, R. Growth of Hierarchical ZnO Nano Flower on Large Functionalized RGO Sheet for Superior Photocatalytic Mineralization of Antibiotic. Chem. Eng. J. 2020, 392, 123746. [Google Scholar] [CrossRef]
  87. Hu, L.; Xing, X.; Zhang, W.; Hu, C.; Li, J. A Facile Chemical Solution Route to Synthesize ZnO/Graphene Composite and the Improved Photocatalytic Property. J. Nanosci. Nanotechnol. 2020, 20, 4480–4484. [Google Scholar] [CrossRef]
  88. Ramos, P.G.; Luyo, C.; Sánchez, L.A.; Gomez, E.D.; Rodriguez, J.M. The Spinning Voltage Influence on the Growth of ZnO-RGO Nanorods for Photocatalytic Degradation of Methyl Orange Dye. Catalysts 2020, 10, 660. [Google Scholar] [CrossRef]
  89. El-Fawal, E.M.; Younis, S.A.; Moustafa, Y.M.; Serp, P. Preparation of Solar-Enhanced AlZnO@carbon Nano-Substrates for Remediation of Textile Wastewaters. J. Environ. Sci. 2020, 92, 52–68. [Google Scholar] [CrossRef] [PubMed]
  90. Fakhri, H.; Bagheri, H. Two Novel Sets of UiO-66@ Metal Oxide/Graphene Oxide Z-Scheme Heterojunction: Insight into Tetracycline and Malathion Photodegradation. J. Environ. Sci. 2020, 91, 222–236. [Google Scholar] [CrossRef] [PubMed]
  91. Lei, Y.; Ding, J.; Yu, P.; He, G.; Chen, Y.; Chen, H. Low-Temperature Preparation of Magnetically Separable Fe3O4@ZnO-RGO for High-Performance Removal of Methylene Blue in Visible Light. J. Alloy. Compd. 2020, 821, 153366. [Google Scholar] [CrossRef]
  92. Murali, A.; Sarswat, P.K.; Free, M.L. Minimizing Electron-Hole Pair Recombination through Band-Gap Engineering in Novel ZnO-CeO2-RGO Ternary Nanocomposite for Photoelectrochemical and Photocatalytic Applications. Environ. Sci. Pollut. Res. 2020, 27, 25042–25056. [Google Scholar] [CrossRef]
  93. Yin, P.T.; Shah, S.; Chhowalla, M.; Lee, K.-B. Design, Synthesis, and Characterization of Graphene–Nanoparticle Hybrid Materials for Bioapplications. Chem. Rev. 2015, 115, 2483–2531. [Google Scholar] [CrossRef] [Green Version]
  94. Ghanem, A.F.; Badawy, A.A.; Mohram, M.E.; Rehim, M.H.A. Synergistic Effect of Zinc Oxide Nanorods on the Photocatalytic Performance and the Biological Activity of Graphene Nano Sheets. Heliyon 2020, 6, e03283. [Google Scholar] [CrossRef]
  95. Shamsuri, A.A.; Jamil, S.N.A. A Short Review on the Effect of Surfactants on the Mechanico-Thermal Properties of Polymer Nanocomposites. Appl. Sci. 2020, 10, 4867. [Google Scholar] [CrossRef]
  96. Muthukrishnaraj, A.; Kalaivani, S.S.; Manikandan, A.; Kavitha, H.P.; Srinivasan, R.; Balasubramanian, N. Sonochemical Synthesis and Visible Light Induced Photocatalytic Property of Reduced Graphene Oxide@ZnO Hexagonal Hollow Rod Nanocomposite. J. Alloy. Compd. 2020, 836, 155377. [Google Scholar] [CrossRef]
  97. Zhang, Y.; Zhang, Y.; Song, L.; Su, Y.; Guo, Y.; Wu, L.; Zhang, T. Illustration of Charge Transfer in Graphene-Coated Hexagonal ZnO Photocatalysts Using Kelvin Probe Force Microscopy. RSC Adv. 2018, 8, 885–894. [Google Scholar] [CrossRef] [Green Version]
  98. Louis, J.; Kavitha, M.K.; Anjana, V.; Jayaraj, M.K.; John, H. A Facile Surfactant Assisted Hydrothermal Synthesis of ZnO and Graphene Loaded ZnO for Efficient Photocatalytic Self-Cleaning. Mater. Res. Express 2020, 6, 1250i4. [Google Scholar] [CrossRef]
  99. Li, Y.-M.; Chen, X.; Liu, X.-J.; Li, W.-Y.; He, Y.-Q. Electrochemical Reduction of Graphene Oxide on ZnO Substrate and Its Photoelectric Properties. Acta Phys. Chim. Sin. 2017, 33, 554–562. [Google Scholar] [CrossRef]
  100. She, P.; Yin, S.; He, Q.; Zhang, X.; Xu, K.; Shang, Y.; Men, X.; Zeng, S.; Sun, H.; Liu, Z. A Self-Standing Macroporous Au/ZnO/Reduced Graphene Oxide Foam for Recyclable Photocatalysis and Photocurrent Generation. Electrochim. Acta 2017, 246, 35–42. [Google Scholar] [CrossRef]
  101. Bera, S.; Pal, M.; Naskar, A.; Jana, S. Hierarchically Structured ZnO-Graphene Hollow Microspheres towards Effective Reusable Adsorbent for Organic Pollutant via Photodegradation Process. J. Alloy. Compd. 2016, 669, 177–186. [Google Scholar] [CrossRef]
  102. Rokhsat, E.; Akhavan, O. Improving the Photocatalytic Activity of Graphene Oxide/ZnO Nanorod Films by UV Irradiation. Appl. Surf. Sci. 2016, 371, 590–595. [Google Scholar] [CrossRef]
  103. Hao, C.; Yang, Y.; Shen, Y.; Feng, F.; Wang, X.; Zhao, Y.; Ge, C. Liquid Phase-Based Ultrasonic-Assisted Synthesis of G–ZnO Nanocomposites and Its Sunlight Photocatalytic Activity. Mater. Des. 2016, 89, 864–871. [Google Scholar] [CrossRef]
  104. Bera, S.; Naskar, A.; Pal, M.; Jana, S. Low Temperature Synthesis of Graphene Hybridized Surface Defective Hierarchical Core–Shell Structured ZnO Hollow Microspheres with Long-Term Stable and Enhanced Photoelectrochemical Activity. RSC Adv. 2016, 6, 36058–36068. [Google Scholar] [CrossRef]
  105. Tie, W.; Bhattacharyya, S.S.; Wang, Y.; He, W.; Lee, S.H. Facile In-Situ Synthesis of a Zinc Oxide Crystals/Few-Layered Graphene Flake Composite for Enhanced Photocatalytic Performance. J. Photochem. Photobiol. A Chem. 2017, 348, 89–95. [Google Scholar] [CrossRef]
  106. Hu, W.-C.; Chen, Y.-A.; Hsieh, P.-Y.; Tsao, C.-W.; Chiu, Y.-H.; Chang, T.-F.M.; Chen, C.-Y.; Sone, M.; Hsu, Y.-J. Reduced Graphene Oxides-Wrapped ZnO with Notable Photocatalytic Property. J. Taiwan Inst. Chem. Eng. 2020, 112, 337–344. [Google Scholar] [CrossRef]
  107. Raja, A.; Rajasekaran, P.; Selvakumar, K.; Arunpandian, M.; Kaviyarasu, K.; Asath Bahadur, S.; Swaminathan, M. Visible Active Reduced Graphene Oxide-BiVO4-ZnO Ternary Photocatalyst for Efficient Removal of Ciprofloxacin. Sep. Purif. Technol. 2020, 233, 115996. [Google Scholar] [CrossRef]
  108. Mandal, S.K.; Dutta, K.; Pal, S.; Mandal, S.; Naskar, A.; Pal, P.K.; Bhattacharya, T.S.; Singha, A.; Saikh, R.; De, S.; et al. Engineering of ZnO/RGO Nanocomposite Photocatalyst towards Rapid Degradation of Toxic Dyes. Mater. Chem. Phys. 2019, 223, 456–465. [Google Scholar] [CrossRef]
  109. Neelgund, G.M.; Oki, A. Photothermal Effect: An Important Aspect for the Enhancement of Photocatalytic Activity under Illumination by NIR Radiation. Mater. Chem. Front. 2017, 2, 64–75. [Google Scholar] [CrossRef] [PubMed]
  110. Wu, C.; Kim, T.W.; Guo, T.; Li, F. Unique Visible-Light-Assisted Field Emission of Tetrapod-Shaped ZnO/Reduced Graphene-Oxide Core/Coating Nanocomposites. Sci. Rep. 2016, 6, 38613. [Google Scholar] [CrossRef] [PubMed]
  111. Prabhu, S.; Megala, S.; Harish, S.; Navaneethan, M.; Maadeswaran, P.; Sohila, S.; Ramesh, R. Enhanced Photocatalytic Activities of ZnO Dumbbell/Reduced Graphene Oxide Nanocomposites for Degradation of Organic Pollutants via Efficient Charge Separation Pathway. Appl. Surf. Sci. 2019, 487, 1279–1288. [Google Scholar] [CrossRef]
  112. Kumaresan, N.; Ramamurthi, K. Synthesis of ZnO/RGO Nanocomposites by Wet Impregnation Method for Photocatalytic Performance against RhB Dye and 4-Chlorophenol under UV Light Irradiation. J. Mater. Sci. Mater. Electron. 2020, 31, 3361–3374. [Google Scholar] [CrossRef]
  113. Zhou, Y.; Zhao, D.; Yang, L.; Zhao, Z.; Li, D.; Luo, Q.; Zhang, Y.; Cao, F. Influences of Graphene Nanosheets Coating on Selectively Exposed Crystal Facet ZnO. ChemistrySelect 2018, 3, 4495–4500. [Google Scholar] [CrossRef]
  114. Pruna, A.; Cembrero, J.; Pullini, D.; Mocioiu, A.M.; Busquets-Mataix, D. Effect of Reduced Graphene Oxide on Photocatalytic Properties of Electrodeposited ZnO. Appl. Phys. A 2017, 123, 792. [Google Scholar] [CrossRef]
  115. Merlano, A.S.; Hoyos, L.M.; Gutiérrez, G.J.; Valenzuela, M.A.; Salazar, Á. Effect of Zn Precursor Concentration in the Synthesis of RGO/ZnO Composites and Their Photocatalytic Activity. New J. Chem. 2020, 44, 19858–19867. [Google Scholar] [CrossRef]
  116. Zhu, Z.; Guo, F.; Xu, Z.; Di, X.; Zhang, Q. Photocatalytic Degradation of an Organophosphorus Pesticide Using a ZnO/RGO Composite. RSC Adv. 2020, 10, 11929–11938. [Google Scholar] [CrossRef] [Green Version]
  117. Padmalaya, G.; Sreeja, B.S.; Shoba, S.; Rajavel, R.; Radha, S.; Arivanandan, M.; Shrestha, S. Synthesis of Micro-Dumbbell Shaped RGO/ZnO Composite Rods and Its Application Towards as Electrochemical Sensor for the Simultaneous Determination of Ammonia and Formaldehyde Using Hexamine and Its Structural Analysis. J. Inorg. Organomet. Polym. 2020, 30, 943–954. [Google Scholar] [CrossRef]
  118. Wang, C.-C.; Shieu, F.-S.; Shih, H.C. Enhanced Photodegradation by RGO/ZnO Core-Shell Nanostructures. J. Environ. Chem. Eng. 2020, 8, 103589. [Google Scholar] [CrossRef]
  119. Williams, D.B.; Carter, C.B. Transmission Electron Microscopy: A Textbook for Materials Science, 2nd ed.; Springer: Berlin/Heidelberg, Germany, 2009; ISBN 978-0-387-76500-6. [Google Scholar]
  120. Zhong, J.; Yan, J. Seeing Is Believing: Atomic Force Microscopy Imaging for Nanomaterial Research. RSC Adv. 2015, 6, 1103–1121. [Google Scholar] [CrossRef]
  121. Jabbar, A.; Yasin, G.; Khan, W.Q.; Anwar, M.Y.; Korai, R.M.; Nizam, M.N.; Muhyodin, G. Electrochemical Deposition of Nickel Graphene Composite Coatings: Effect of Deposition Temperature on Its Surface Morphology and Corrosion Resistance. RSC Adv. 2017, 7, 31100–31109. [Google Scholar] [CrossRef] [Green Version]
  122. Sengunthar, P.; Bhavsar, K.H.; Balasubramanian, C.; Joshi, U.S. Physical Properties and Enhanced Photocatalytic Activity of ZnO-RGO Nanocomposites. Appl. Phys. A 2020, 126, 567. [Google Scholar] [CrossRef]
  123. Sharma, M.; Sondhi, H.; Krishna, R.; Srivastava, S.K.; Rajput, P.; Nigam, S.; Joshi, M. Assessment of GO/ZnO Nanocomposite for Solar-Assisted Photocatalytic Degradation of Industrial Dye and Textile Effluent. Environ. Sci. Pollut. Res. 2020, 27, 32076–32087. [Google Scholar] [CrossRef]
  124. Chidhambaram, N.; Valanarasu, S.; Ganesh, V.; Gobalakrishnan, S. Unraveling the Enhanced Photocatalytic Decomposition Efficacy of the Al-Doped ZnO Nanoparticles@graphene Sheets. J. Phys. D Appl. Phys. 2020, 53, 465111. [Google Scholar] [CrossRef]
  125. Kumaresan, N.; Sinthiya, M.M.A.; Ramamurthi, K.; Ramesh Babu, R.; Sethuraman, K. Visible Light Driven Photocatalytic Activity of ZnO/CuO Nanocomposites Coupled with RGO Heterostructures Synthesized by Solid-State Method for RhB Dye Degradation. Arab. J. Chem. 2020, 13, 3910–3928. [Google Scholar] [CrossRef]
  126. Naseem, T.; Waseem, M.; Hafeez, M.; Din, S.U.; Haq, S. Mahfoz-ur-Rehman Reduced Graphene Oxide/Zinc Oxide Nanocomposite: From Synthesis to Its Application for Wastewater Purification and Antibacterial Activity. J. Inorg. Organomet. Polym. 2020, 30, 3907–3919. [Google Scholar] [CrossRef]
  127. Aqad, K.M.A.; Basheer, C. Photocatalytic Degradation of Basic Blue Dye Using Zinc Nanoparticles Decorated Graphene Oxide Nanosheet. J. Phys. Org. Chem. 2020, 34, e4117. [Google Scholar] [CrossRef]
  128. Maruthupandy, M.; Qin, P.; Muneeswaran, T.; Rajivgandhi, G.; Quero, F.; Song, J.-M. Graphene-Zinc Oxide Nanocomposites (G-ZnO NCs): Synthesis, Characterization and Their Photocatalytic Degradation of Dye Molecules. Mater. Sci. Eng. B 2020, 254, 114516. [Google Scholar] [CrossRef]
  129. Zhou, Y.; Li, D.; Yang, L.; Li, C.; Liu, Y.; Lu, J.; Wang, Y. Preparation of 3D Urchin-like RGO/ZnO and Its Photocatalytic Activity. J. Mater. Sci. Mater. Electron. 2017, 28, 7935–7942. [Google Scholar] [CrossRef]
  130. Sreejesh, M.; Dhanush, S.; Rossignol, F.; Nagaraja, H.S. Microwave Assisted Synthesis of RGO/ZnO Composites for Non-Enzymatic Glucose Sensing and Supercapacitor Applications. Ceram. Int. 2017, 43, 4895–4903. [Google Scholar] [CrossRef]
  131. King, A.A.K.; Davies, B.R.; Noorbehesht, N.; Newman, P.; Church, T.L.; Harris, A.T.; Razal, J.M.; Minett, A.I. A New Raman Metric for the Characterisation of Graphene Oxide and Its Derivatives. Sci. Rep. 2016, 6, 19491. [Google Scholar] [CrossRef] [PubMed] [Green Version]
  132. Moorthy, S.K.; Viswanathan, C.; Ponpandian, N. Facile Approach for Synthesis of GO/ZnO Nanocomposite for Highly Efficient Photocatalytic Degradation of Organic Dyes under Visible Light. Nano Hybrids Compos. 2017, 17, 121–126. [Google Scholar] [CrossRef]
  133. Qin, J.; Zhang, X.; Yang, C.; Cao, M.; Ma, M.; Liu, R. ZnO Microspheres-Reduced Graphene Oxide Nanocomposite for Photocatalytic Degradation of Methylene Blue Dye. Appl. Surf. Sci. 2017, 392, 196–203. [Google Scholar] [CrossRef]
  134. Ong, C.B.; Mohammad, A.W.; Ng, L.Y.; Mahmoudi, E.; Azizkhani, S.; Hayati Hairom, N.H. Solar Photocatalytic and Surface Enhancement of ZnO/RGO Nanocomposite: Degradation of Perfluorooctanoic Acid and Dye. Process Saf. Environ. Prot. 2017, 112, 298–307. [Google Scholar] [CrossRef]
  135. Bardestani, R.; Patience, G.S.; Kaliaguine, S. Experimental Methods in Chemical Engineering: Specific Surface Area and Pore Size Distribution Measurements—BET, BJH, and DFT. Can. J. Chem. Eng. 2019, 97, 2781–2791. [Google Scholar] [CrossRef]
  136. Thommes, M.; Kaneko, K.; Neimark, A.V.; Olivier, J.P.; Rodriguez-Reinoso, F.; Rouquerol, J.; Sing, K.S.W. Physisorption of Gases, with Special Reference to the Evaluation of Surface Area and Pore Size Distribution (IUPAC Technical Report). Pure Appl. Chem. 2015, 87, 1051–1069. [Google Scholar] [CrossRef] [Green Version]
  137. Makuła, P.; Pacia, M.; Macyk, W. How To Correctly Determine the Band Gap Energy of Modified Semiconductor Photocatalysts Based on UV–Vis Spectra. J. Phys. Chem. Lett. 2018, 9, 6814–6817. [Google Scholar] [CrossRef] [Green Version]
  138. Ramírez-Amador, R.; Alvarado, J.; Flores-Carrasco, G.; Morales-de la Garza, L.; Alcántara-Iniesta, S.; Luna-Flores, A.; Bernal, Y.P.; Méndez Rojas, M.Á.; Gervacio-Arciniega, J.J.; Martínez Hernández, H.P.; et al. The Influence of Deposition Time on the Structural, Morphological, Optical and Electrical Properties of ZnO-RGO Nanocomposite Thin Films Grown in a Single Step by USP. Crystals 2020, 10, 73. [Google Scholar] [CrossRef] [Green Version]
  139. Yang, X.; Qiu, J.; Liu, M.; Ming, H.; Zhang, H.; Li, M.; Zhang, S.; Zhang, T. A Surface Multiple Effect on the ZnO Anode Induced by Graphene for a High Energy Lithium-Ion Full Battery. J. Alloy. Compd. 2020, 824, 153945. [Google Scholar] [CrossRef]
  140. Zhu, P.; Duan, M.; Wang, R.; Xu, J.; Zou, P.; Jia, H. Facile Synthesis of ZnO/GO/Ag3PO4 Heterojunction Photocatalyst with Excellent Photodegradation Activity for Tetracycline Hydrochloride under Visible Light. Colloids Surf. A Physicochem. Eng. Asp. 2020, 602, 125118. [Google Scholar] [CrossRef]
  141. Hamid, S.B.A.; Teh, S.J.; Lai, C.W. Photocatalytic Water Oxidation on ZnO: A Review. Catalysts 2017, 7, 93. [Google Scholar] [CrossRef]
  142. Fung, C.-M.; Tang, J.-Y.; Tan, L.-L.; Mohamed, A.R.; Chai, S.-P. Recent Progress in Two-Dimensional Nanomaterials for Photocatalytic Carbon Dioxide Transformation into Solar Fuels. Mater. Today Sustain. 2020, 9, 100037. [Google Scholar] [CrossRef]
  143. Kang, W.; Jimeng, X.; Xitao, W. The Effects of ZnO Morphology on Photocatalytic Efficiency of ZnO/RGO Nanocomposites. Appl. Surf. Sci. 2016, 360, 270–275. [Google Scholar] [CrossRef]
  144. Jia, W.; Yuan, X. Concurrent and Dual N-Doping of Graphene/ZnO Nanocomposites for Enhanced Cr(VI) Photoreduction Activity under Visible-Light Irradiation. RSC Adv. 2020, 10, 30832–30839. [Google Scholar] [CrossRef]
  145. Kumar, K.V.A.; Lakshminarayana, B.; Suryakala, D.; Subrahmanyam, C. Reduced Graphene Oxide Supported ZnO Quantum Dots for Visible Light-Induced Simultaneous Removal of Tetracycline and Hexavalent Chromium. RSC Adv. 2020, 10, 20494–20503. [Google Scholar] [CrossRef]
  146. Srirattanapibul, S.; Tang, I.-M.; Thongmee, S. Photo Catalytic Reduction of Cr6+ by ZnO Decorated on Reduced Graphene Oxide (RGO) Nanocomposites. Mater. Res. Bull. 2020, 122, 110705. [Google Scholar] [CrossRef]
  147. Yang, L.; Xu, C.; Wan, F.; He, H.; Gu, H.; Xiong, J. Synthesis of RGO/BiOI/ZnO Composites with Efficient Photocatalytic Reduction of Aqueous Cr(VI) under Visible-Light Irradiation. Mater. Res. Bull. 2019, 112, 154–158. [Google Scholar] [CrossRef]
  148. Kumar, S.; Pandit, V.; Bhattacharyya, K.; Krishnan, V. Sunlight Driven Photocatalytic Reduction of 4-Nitrophenol on Pt Decorated ZnO-RGO Nanoheterostructures. Mater. Chem. Phys. 2018, 214, 364–376. [Google Scholar] [CrossRef]
  149. Van Thuan, D.; Nguyen, T.K.; Kim, S.-W.; Chung, J.S.; Hur, S.H.; Kim, E.J.; Hahn, S.H.; Wang, M. Chemical-Hydrothermal Synthesis of Oval-Shaped Graphene/ZnO Quantum Hybrids and Their Photocatalytic Performances. Catal. Commun. 2017, 101, 102–106. [Google Scholar] [CrossRef]
  150. Ong, W.-J.; Putri, L.K.; Mohamed, A.R. Rational Design of Carbon-Based 2D Nanostructures for Enhanced Photocatalytic CO2 Reduction: A Dimensionality Perspective. Chem. A Eur. J. 2020, 26, 9710–9748. [Google Scholar] [CrossRef] [PubMed]
  151. Gusain, R.; Gupta, K.; Joshi, P.; Khatri, O.P. Adsorptive Removal and Photocatalytic Degradation of Organic Pollutants Using Metal Oxides and Their Composites: A Comprehensive Review. Adv. Colloid Interface Sci. 2019, 272, 102009. [Google Scholar] [CrossRef] [PubMed]
  152. Talaiekhozani, A.; Rezania, S.; Kim, K.-H.; Sanaye, R.; Amani, A.M. Recent Advances in Photocatalytic Removal of Organic and Inorganic Pollutants in Air. J. Clean. Prod. 2021, 278, 123895. [Google Scholar] [CrossRef]
  153. Lucas, M.S.; Dias, A.A.; Sampaio, A.; Amaral, C.; Peres, J.A. Degradation of a Textile Reactive Azo Dye by a Combined Chemical–Biological Process: Fenton’s Reagent-Yeast. Water Res. 2007, 41, 1103–1109. [Google Scholar] [CrossRef]
  154. Samadi, M.; Zirak, M.; Naseri, A.; Khorashadizade, E.; Moshfegh, A.Z. Recent Progress on Doped ZnO Nanostructures for Visible-Light Photocatalysis. Thin Solid Films 2016, 605, 2–19. [Google Scholar] [CrossRef] [Green Version]
  155. Mclaren, A.; Valdes-Solis, T.; Li, G.; Tsang, S.C. Shape and Size Effects of ZnO Nanocrystals on Photocatalytic Activity. J. Am. Chem. Soc. 2009, 131, 12540–12541. [Google Scholar] [CrossRef]
  156. Neelgund, G.M.; Oki, A. Graphene-Coupled ZnO: A Robust NIR-Induced Catalyst for Rapid Photo-Oxidation of Cyanide. ACS Omega 2017, 2, 9095–9102. [Google Scholar] [CrossRef]
  157. Rakkesh, R.A.; Durgalakshmi, D.; Balakumar, S. Beyond Chemical Bonding Interaction: An Insight into the Growth Process of 1D ZnO on Few-Layer Graphene for Excellent Photocatalytic and Room Temperature Gas Sensing Applications. ChemistrySelect 2018, 3, 7302–7309. [Google Scholar] [CrossRef]
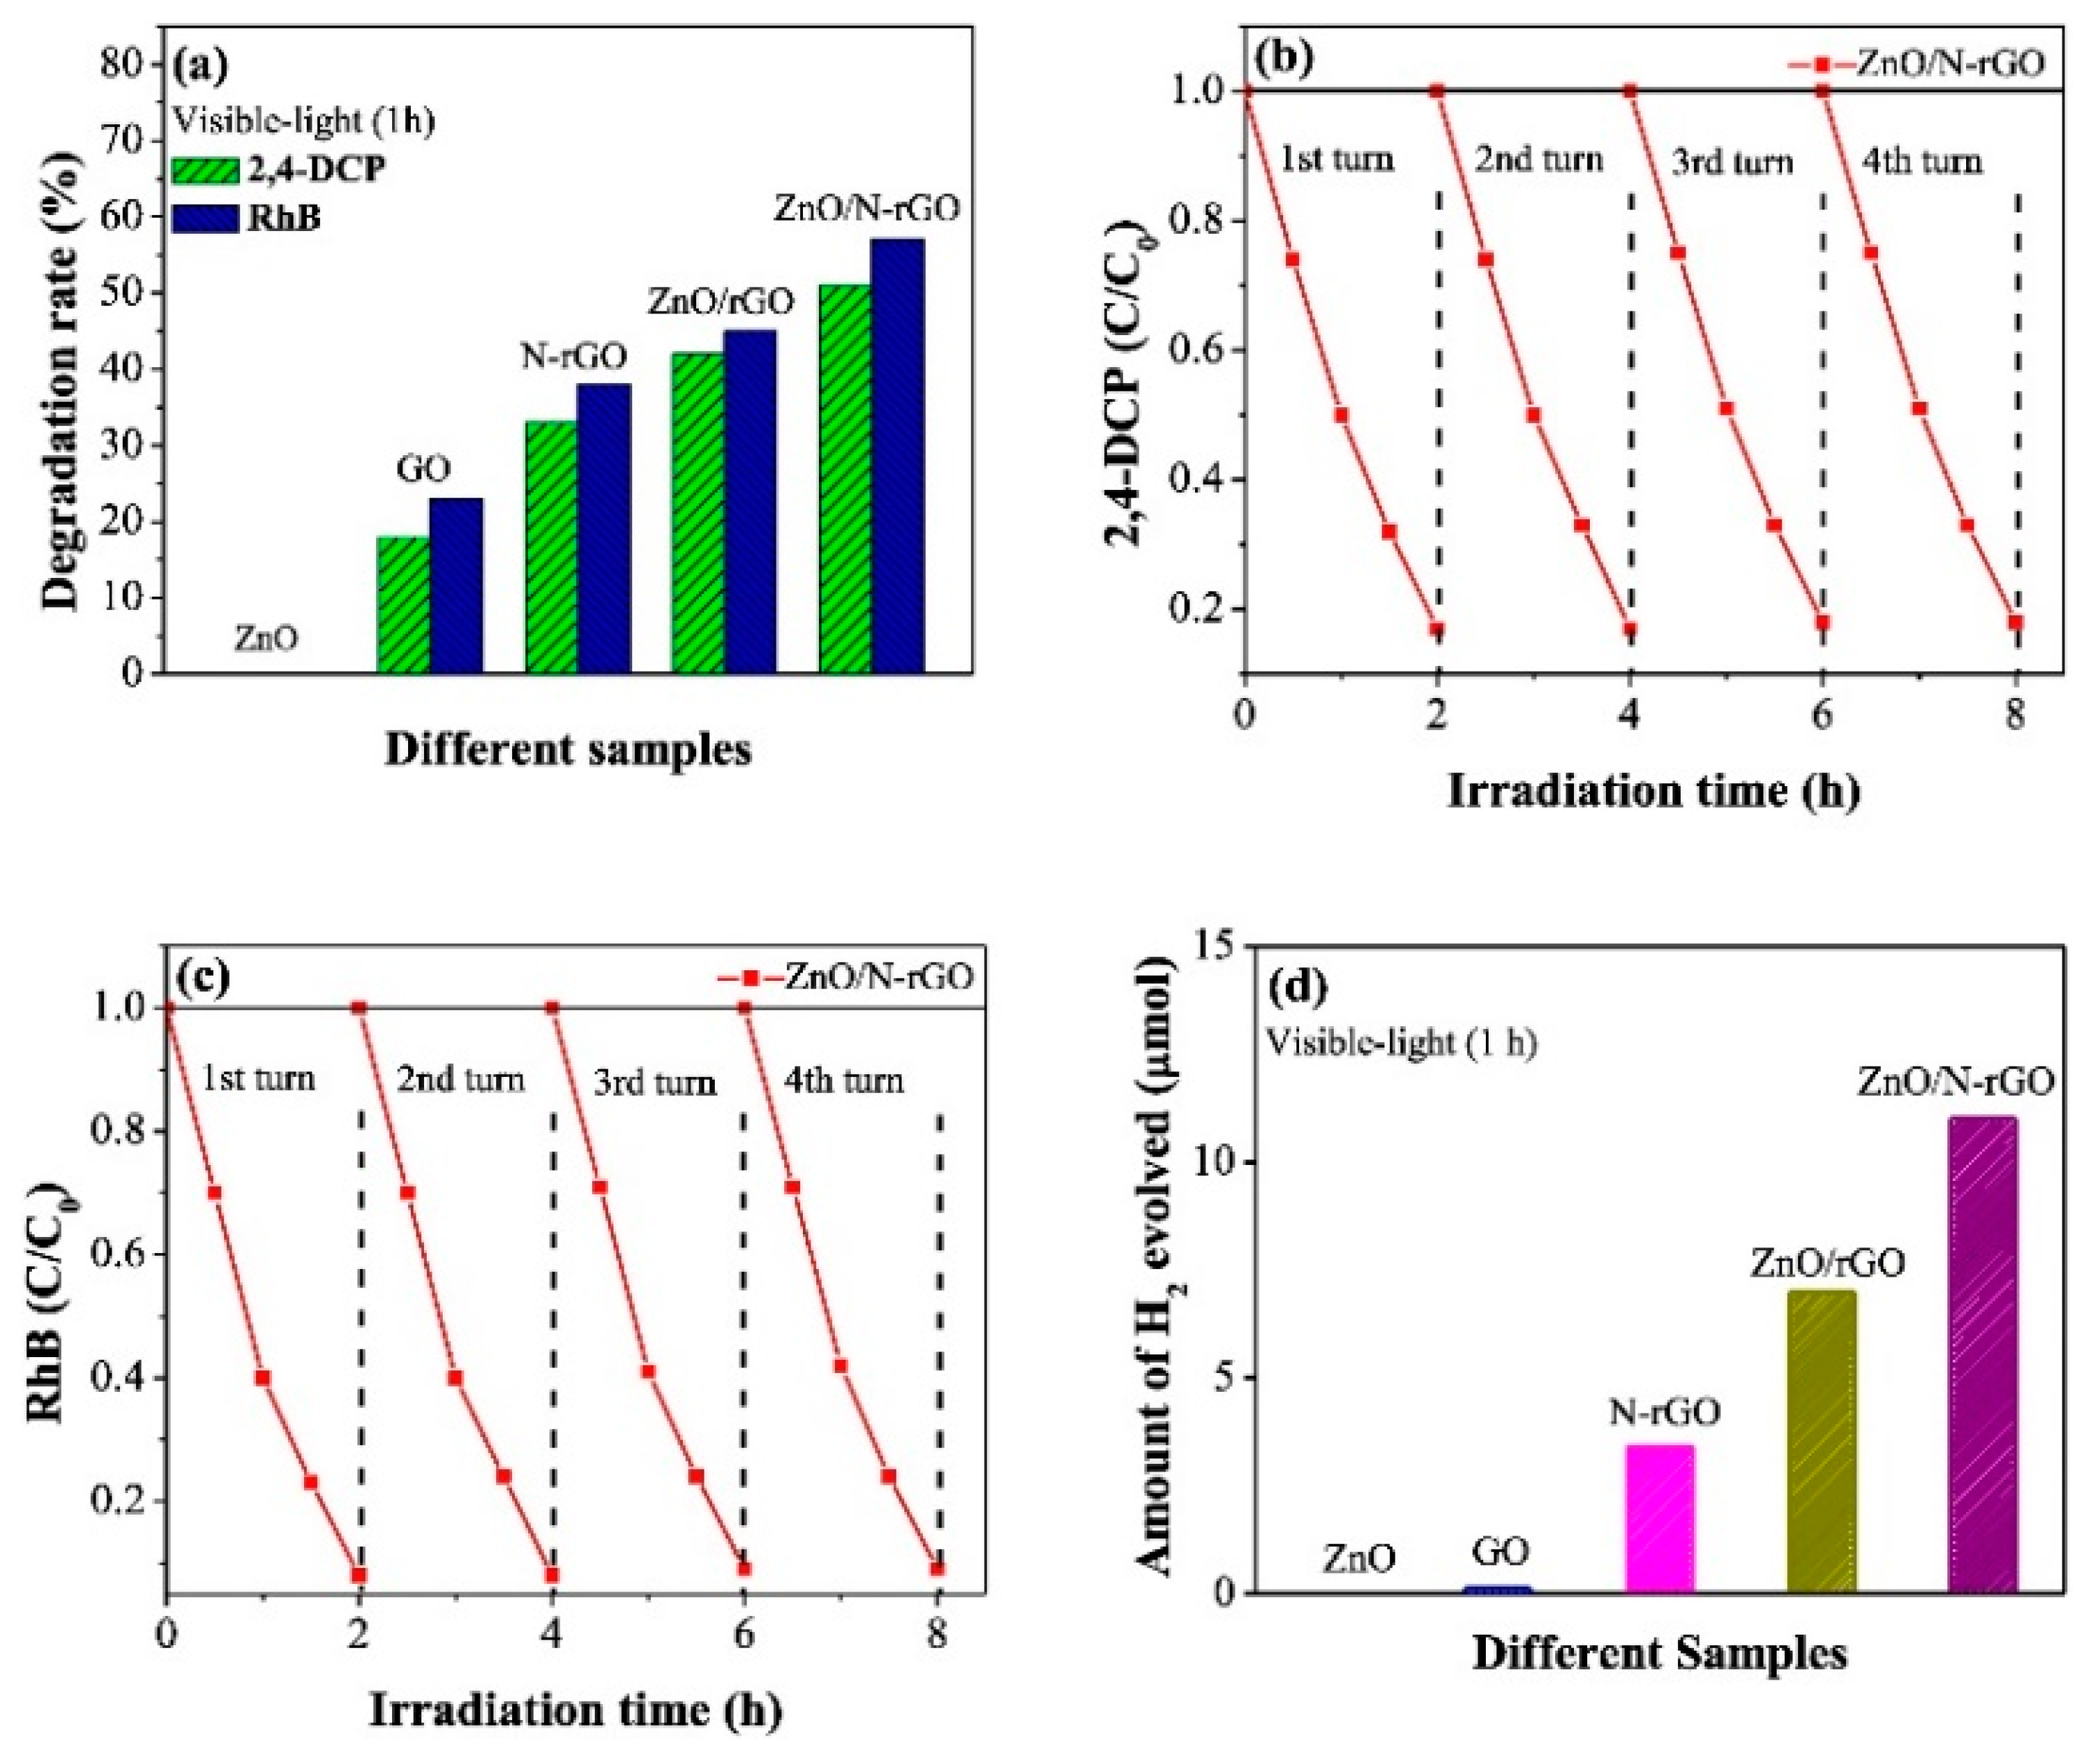
  158. Neena, D.; Kondamareddy, K.K.; Humayun, M.; Mohan, V.B.; Lu, D.; Fu, D.; Gao, W. Fabrication of ZnO/N-RGO Composite as Highly Efficient Visible-Light Photocatalyst for 2,4-DCP Degradation and H2 Evolution. Appl. Surf. Sci. 2019, 488, 611–619. [Google Scholar] [CrossRef]
  159. Nguyen, V.Q.; Baynosa, M.L.; Nguyen, V.H.; Tuma, D.; Lee, Y.R.; Shim, J.-J. Solvent-Driven Morphology-Controlled Synthesis of Highly Efficient Long-Life ZnO/Graphene Nanocomposite Photocatalysts for the Practical Degradation of Organic Wastewater under Solar Light. Appl. Surf. Sci. 2019, 486, 37–51. [Google Scholar] [CrossRef]
  160. Tayebi, M.; Tayyebi, A.; Masoumi, Z.; Lee, B.-K. Photocorrosion Suppression and Photoelectrochemical (PEC) Enhancement of ZnO via Hybridization with Graphene Nanosheets. Appl. Surf. Sci. 2020, 502, 144189. [Google Scholar] [CrossRef]
  161. Flores, K.; Valdes, C.; Ramirez, D.; Eubanks, T.M.; Lopez, J.; Hernandez, C.; Alcoutlabi, M.; Parsons, J.G. The Effect of Hybrid Zinc Oxide/Graphene Oxide (ZnO/GO) Nano-Catalysts on the Photocatalytic Degradation of Simazine. Chemosphere 2020, 259, 127414. [Google Scholar] [CrossRef] [PubMed]
  162. Amna, T. Shape-Controlled Synthesis of Three-Dimensional Zinc Oxide Nanoflowers for Disinfection of Food Pathogens. Z. Nat. C 2018, 73, 297–301. [Google Scholar] [CrossRef] [PubMed]
  163. Wang, X.; Ahmad, M.; Sun, H. Three-Dimensional ZnO Hierarchical Nanostructures: Solution Phase Synthesis and Applications. Materials 2017, 10, 1304. [Google Scholar] [CrossRef] [Green Version]
  164. Xu, L.; Hu, Y.-L.; Pelligra, C.; Chen, C.-H.; Jin, L.; Huang, H.; Sithambaram, S.; Aindow, M.; Joesten, R.; Suib, S.L. ZnO with Different Morphologies Synthesized by Solvothermal Methods for Enhanced Photocatalytic Activity. Chem. Mater. 2009, 21, 2875–2885. [Google Scholar] [CrossRef]
  165. Johar, M.A.; Afzal, R.A.; Alazba, A.A.; Manzoor, U. Photocatalysis and Bandgap Engineering Using ZnO Nanocomposites. Adv. Mater. Sci. Eng. 2015, 2015, 934587. [Google Scholar] [CrossRef] [Green Version]
  166. Opoku, F.; Govender, K.K.; van Sittert, C.G.C.E.; Govender, P.P. Understanding the Mechanism of Enhanced Charge Separation and Visible Light Photocatalytic Activity of Modified Wurtzite ZnO with Nanoclusters of ZnS and Graphene Oxide: From a Hybrid Density Functional Study. New J. Chem. 2017, 41, 8140–8155. [Google Scholar] [CrossRef]
Figure 1. Scheme illustrating the three fundamental stages of the photocatalytic process [2]. Published by The Royal Society of Chemistry.
Jcs 05 00004 g001
Figure 2. Properties of photocatalyst important for photocatalysis. Reproduced with permission from Elsevier [4].
Jcs 05 00004 g002
Figure 3. Graphical illustration of structural dimensionality of nanomaterials. Reproduced with permission from Elsevier [18].
Jcs 05 00004 g003
Figure 4. Structure of graphene, graphene oxide, and reduced graphene oxide. Reprinted with permission from [29].
Jcs 05 00004 g004
Figure 5. The crucial roles of graphene in the graphene-based composite photocatalysts. Reprinted by permission from John Wiley and Sons [29].
Jcs 05 00004 g005
Figure 6. The number of published documents regarding ZnO and graphene materials in photocatalysis. Keywords: ZnO photocatal* (■), and ZnO photocatal* graphene (●). Source: Web of Knowledge, 24 September 2020. The * wildcard was used to include all terms related to photocatalysis.
Jcs 05 00004 g006
Figure 7. Keyword co-occurrence map for (a) ZnO photocatal* search (time span: 2016–2020, frequency count >150); (b) ZnO photocatal* graphene search (time span: 2016–2020, frequency count >7). Source: Web of knowledge, 24 September 2020.
Jcs 05 00004 g007
Figure 8. The number of reviews of ZnO and graphene with applications in photocatalysis (source: Scopus).
Jcs 05 00004 g008
Figure 9. A conceptual scheme for the study of ZnO–graphene composites.
Jcs 05 00004 g009
Figure 10. Method for synthesis of ZnO–graphene nanocomposites materials during 2016–2020.
Jcs 05 00004 g010
Figure 11. Type of carbonaceous support most used for ZnO–graphene nanocomposites.
Jcs 05 00004 g011
Figure 12. Zinc precursors used in the ZnO–graphene composites.
Jcs 05 00004 g012
Figure 13. Incorporation of ZnO on nanocomposites.
Jcs 05 00004 g013
Figure 14. Main surfactants used on ZnO–graphene nanocomposites.
Jcs 05 00004 g014
Figure 15. ZnO shapes on composites.
Jcs 05 00004 g015
Figure 16. ZnO sizes on composites.
Jcs 05 00004 g016
Figure 17. SEM micrographs of (ac) rGO/ZnO flowers and (df) rGO/ZnO rods. Reproduced from [115] with permission from The Royal Society of Chemistry.
Jcs 05 00004 g017
Figure 18. SEM images of ZnO (a) and ZrG-1 (b), TEM image of ZnO (inset of (a)), TEM (c) and HRTEM (d) images of ZrG-1. Reproduced with permission from Elsevier [61].
Jcs 05 00004 g018
Figure 19. SEM images (ad) of ZnO/rGO nanocomposite, TEM images (eg), and corresponding size distribution (h) of ZG2 catalysts. Reproduced from [116] with permission from The Royal Society of Chemistry.
Jcs 05 00004 g019
Figure 20. (ac) Morphological property of micro-dumbbell-shaped rGO/ZnO composites using scanning electron microscopy. Reprinted by permission from Springer: Journal of Inorganic and Organometallic Polymers and Materials [117] Copyright, 2019.
Jcs 05 00004 g020
Figure 21. XRD pattern of as-synthesized graphene oxide and reduced graphene. Reproduced from [121] with permission from The Royal Society of Chemistry.
Jcs 05 00004 g021
Figure 22. XRD patterns of GO, ZnO nanostructures, and GO/ZnO nanohybrid. Reprinted by permission from Springer Nature: Environmental Science and Pollution Research [123] Copyright, 2020.
Jcs 05 00004 g022
Figure 23. (a) Number of publications about some photocatalytic applications of ZnO, graphene, and ZnO–graphene composites; (b) distribution of the publications devoted to several applications of the ZnO–Graphene composites in photocatalysis (2016–2020).
Jcs 05 00004 g023
Figure 24. Schematic illustration of the formation of charge carriers (e and h+) and photocatalytic degradation of pollutants on the ZnO nanostructured surface. Reproduced with permission from Elsevier [154].
Jcs 05 00004 g024
Figure 25. Generation of free radicals with different oxidizing agents in ZnO suspension. Reprinted by permission from Springer Nature: Chemical papers [35] Copyright, 2017.
Jcs 05 00004 g025
Figure 26. Percentage distribution of the reported ZnO morphologies in the publications related to ZnO–graphene composites applied to photocatalysis. (a) Using UV light, (b) using visible light. NP = nanoparticle, NR = nanorod, NS = nanosheet, NSP = nanosphere, MSP = microsphere, SP = sphere, NF = nanoflower, NRi = nanoring.
Jcs 05 00004 g026
Figure 27. Photocatalytic degradation of 3, 6–acridinediamine compound under sunlight irradiation using (a) 1D ZnO NRs, (b) 1D ZnO–few layer graphene-based hybrid nanostructures, (c) initial and residual concentration plot vs. time, and (d) degradation % of pollutant vs. time. Reprinted with permission from [157].
Jcs 05 00004 g027
Figure 28. Photocatalytic degradation of 2,4-D (10 ppm) as the variation of C/C0 with irradiation time in the presence of GO, ZnO, ZGO0, ZGO1, ZGO2, and ZGO3. Reprinted with permission from [82].
Jcs 05 00004 g028
Figure 29. Visible-light activity of ZnO, GO, N-rGO, ZnO/rGO, and ZnO/N-rGO samples for 2,4-dichlorophenol and RhB degradation (a), stability and recyclability tests (b) of 2,4-dichlorophenol degradation and (c) of RhB over ZnO/N-rGO. Amount of H2 evolved over ZnO, GO, N-rGO, ZnO/rGO, and ZnO/N-rGO (d). Schematic for charge transfer and separation and the photocatalytic process over ZnO/N-rGO composite. Reprinted with permission from [158].
Jcs 05 00004 g029
Figure 30. Photocatalytic degradation of a 10 mg L−1 MB solution (a) and a 10 mg L−1 RhB solution (b) under UV irradiation in the absence and presence of reduced graphene oxide (rGO), sZG, dZG, and rZG (0.1 g L−1). Reprinted with permission from [159].
Jcs 05 00004 g030
Figure 31. Photodegradation of methyl orange (MO) (a) under UV light, and (b) under visible light irradiation for ZnO NP, ZnO NR, ZnO NPs–graphene (GNP), and ZnO NRs–graphene (GNR). Reprinted with permission from [160].
Jcs 05 00004 g031
Figure 32. Photo-reduction of Cr(VI) under (a) UV and (b) visible lights. Reproduced with permission from [76].
Jcs 05 00004 g032
Figure 33. Percent removal of simazine from aqueous solution at pH 2 using photolysis and the various synthesized ZnO and ZnO/GO photocatalysts. Reproduced with permission from [161].
Jcs 05 00004 g033
Table 1. Recent reviews of photocatalytic applications of semiconductor/graphene-based composites.
TitlePublished YearReference
Graphene in photocatalysis: a review2016[33]
Review on ZnO hybrid photocatalyst: impact on photocatalytic activities of water pollutant degradation2016[34]
Advancements in the zinc oxide nanomaterials for efficient photocatalysis2017[35]
The effect of ZnO-based carbonaceous materials for degradation of benzoic pollutants: a review2019[31]
Progress in Graphene/Metal Oxide Composite Photocatalysts for Degradation of Organic Pollutants2020[36]
Nanoscale zinc oxide-based heterojunctions as visible light active photocatalysts for hydrogen energy and environmental remediation2020[25]
Advances and Challenges in Developing Efficient Graphene Oxide-Based ZnO Photocatalysts for Dye Photo-Oxidation2020[32]
State of the art on the photocatalytic applications of graphene-based nanostructures: From elimination of hazardous pollutants to disinfection and fuel generation2020[27]
An overview of graphene oxide supported semiconductors based photocatalysts: Properties, synthesis, and photocatalytic applications2020[37]
Publisher’s Note: MDPI stays neutral with regard to jurisdictional claims in published maps and institutional affiliations.

