Article

Improving the Alignment of Dynamic Sheet-Formed Mats by Changing Nozzle Geometry and Their Reinforcement of Polypropylene Matrix Composites

School of Engineering, University of Waikato, Hamilton 3240, New Zealand
*
Author to whom correspondence should be addressed.
J. Compos. Sci. 2021, 5(9), 226; https://doi.org/10.3390/jcs5090226
Submission received: 26 July 2021 / Revised: 18 August 2021 / Accepted: 19 August 2021 / Published: 27 August 2021
(This article belongs to the Special Issue Progress in Polymer Composites)

Abstract

:
The main objective of this study was to improve the orientation of fibres within the mats produced using dynamic sheet forming (DSF). DSF is used to make fibre mats by forcing a fibre suspension through a nozzle onto a rotating drum. In this research, the effect of nozzle geometry on the orientation of hemp fibres within DSF mats was investigated. The orientation of fibres within the mats produced was assessed using ImageJ (OrientationJ) and X-ray diffraction. It was found that, as the contraction ratio of the nozzle increased, the orientation of fibres within the fibre mats increased. It was also found that the composite tensile strength increased with increased fibre orientation.

1. Introduction

Generally, randomly orientated preforms are used as reinforcement in short natural plant fibre composites (SNPFCs), however, mechanical performance can be improved by the alignment (orientation) of fibres in the main loading direction. For the orientation of short fibres, two main approaches are used: dry and wet processes. Of these, a higher degree of orientation has been reported with wet processes [1,2]. Dynamic sheet forming (DSF), a wet process, mainly used in paper production, has proven to be an effective way to produce fibre mats with a reasonable degree of alignment with short fibres [3].
In a dynamic sheet former, the fibre mats are made by forcing the suspension (fibre in water) through a nozzle onto the interior wall surface of a perforated rotating drum through which the water can be removed. Here, the alignment of fibres towards the rotation direction of the drum is known to be influenced by the fibre suspension, nozzle geometry, jet-to-wire speed ratio and dewatering [4,5,6].
This present study focuses on nozzle geometry factors, as they play important roles in anisotropic fibre orientation distribution towards the rotation direction of the drum. The nozzle geometry factors include the contraction ratio (ratio of the cross-sectional area at the inlet to that at the exit) and the end shape of a nozzle. It has been reported that the sudden flow acceleration (change in velocity) at the contraction section of a nozzle could create a highly anisotropic distribution of orientation of fibres [7]. Commonly, the nozzle supplied for dynamic sheet forming using plant fibres has a rounded-rectangular exit shape with a low contraction ratio. However, based on the literature, it was expected that nozzles with higher contraction ratios and a circular exit shape would result in improved alignment of fibres within the mats.

2. Materials and Methods

2.1. Materials

Industrial hemp fibre was obtained from Moffett Orchards Ltd., Napier, New Zealand. Clariant (New Zealand) Limited supplied PP random copolymer SKRX3600 with a melt index of 18 g/10 min and a density of 0.9 g/cm3. The coupling agent, A-C 950P maleic anhydride polypropylene (MAPP), was supplied by Honeywell International Inc., Morristown, NJ, USA.

2.2. Method

Alkali treated hemp fibres were used to produce fibre mats. The alkali treatment and characterisation of fibres have been detailed in a previously published work [8]. The fibres had an average length and an average diameter of 1.88 mm and 0.05 mm, respectively.

2.2.1. Nozzle Design Details and Manufacturing

Nozzle designs and details are provided in Figure 1 and Table 1 with nomenclature used (R and C refer to exit shape, rectangular-round or circular, respectively and the following number refers to the exit area of a nozzle). The length of each nozzle was 30 mm and the entrance of each nozzle was circular in shape with an inlet diameter of 10 mm that continued for a length of 10 mm from where the contraction section (commonly known as throat) of each nozzle begins. Amongst the nozzles, all circular and two rectangular-round (R35 and R24) exit nozzles had a converging boundary profile from the contraction section towards the exit as can be seen in Figure 1a. The other two rectangular nozzles (R56 and R46) had slightly diverging profiles from the contraction section towards the exit. However, it should be noted that, regardless of the converging or diverging profile, all the nozzles had a smaller exit area compared to the inlet area. Figure 1b shows the schematic representation of the manufacturer supplied nozzle (a rectangular-round exit nozzle) used for dynamic sheet forming. Figure 1c shows all the 3D-printed nozzles used for the present study.
The volumetric flow rate (Q) of the DSF, i.e., the amount of water discharged from the manual tank of the dynamic sheet former through the flow hoses onto the rotating drum (without nozzle) in one minute, was measured and found to be an average of 3.9 L/min (6.52 × 10⁻⁵ m3/s). The mean flow velocity (ν) of the suspension in m/s at the exit of each nozzle (A- inlet or exit area of each nozzle) was calculated using the equation below:
v = Q / A

2.2.2. Production of Aligned Hemp Fibre Mats and Control Samples

Aligned hemp fibre mats were produced using a dynamic sheet former, manufactured by CanPa®, Canada (see Figure 2a). All nozzles listed in Table 1 were trialled to produce mats. The suspension required to produce each mat was prepared by mixing 45 g of hemp fibres with approximately 45 litres of water. The mats produced were then cut into sizes of 150 mm × 300 mm (size of compression mould) and oven-dried at 80 °C for 48 h.
For alignment assessment using ImageJ, a highly orientated reference sample (control sample) as can be seen in Figure 2b was prepared by carefully wrapping hemp fibre bundles around a rectangular aluminium piece in the DSF rotation direction. For alignment assessment using ImageJ and X-ray diffraction, a randomly orientated control sample (Figure 2c) was formed by hand by pouring a fibre suspension (10 g fibres in 10 L of water) onto a screen with very fine holes, through which the water could flow leaving the fibre deposited on the screen surface. The mat was then removed from the screen and oven dried at 80 °C for 48 h.

2.2.3. Assessment of Orientation

Assessment of orientation of fibres within the mats produced using DSF was carried out using ImageJ and XRD.
Orientation Assessment of Fibre Mats Using ImageJ
For the ImageJ analysis, all the optical microscopic images were captured using a Wild M3B stereomicroscope (Labx, Midland, ON, Canada) with a Nikon Digital DS-SMc camera attached, and scanning electron microscopic (SEM) images were captured using a Hitachi S-4000 Field Emission scanning electron microscope (Hitachi, Japan) operated at 5 kV. Prior to SEM, mats were mounted onto an aluminium stub using a carbon tape and sputter coated with platinum. For the image analysis using ImageJ (OrientationJ) [9,10], both optical (Figure 2a–c) and scanning electron microscopic (Figure 2d) images of fibre mats produced using DSF were separately assessed. The principles behind the image analysis tool used are detailed in the literature [9,11]. The fibre orientation distribution profiles obtained using the OrientationJ plug-in were interpreted using three approaches: the predominant orientation peaks and the coherency factors, the ratio between maximum and minimum frequencies, and the full width at half maximum (FWHM). Twenty-five images were analysed for each batch.
Orientation Analysis Using X-ray Diffraction
For the assessment of orientation of fibres within the mats using XRD, fibre mats of circular shapes were cut from the DSF mats produced and were placed onto a sample holder (example sample shown in Figure 3). XRD scans were obtained using an EMPYREAN diffractometer system (PANalytical) fitted with a Cu Kα X-ray tube. Two XRD scans were recorded from each fibre mat using a three-minute scan in transmission mode covering a 2θ range from 5° to 45° using a current and voltage of 40 mA and 40 mV. Mats were analysed with their DSF rotation direction aligned both parallel and perpendicular to the X-ray beam. From these scans through 2θ, the most intense diffraction plane (200) was located for all the samples in the 2θ range of 22–23°. The sample was then subjected to a phi (Φ) scan (rotating the sample around 360°) for six minutes with 2θ fixed at the top of the (200) plane to obtain the azimuthal diffraction profile. For the calculation, azimuthal diffraction profile of each mat was normalised with the minimum intensity of diffraction as is common in literature [12,13]. Three analysis approaches (methods) were used to interpret the azimuthal intensity profiles of each mat: ratio of maximum to minimum peak intensity, Herman’s order parameter (f) and degree of ordering (π). Two samples were measured for each batch.
Herman’s order parameter (f) and the degree of ordering (π) were calculated using the equations displayed below [14]. FWHM is the full width at half maximum. A program was written in MATLAB to obtain the FWHM.
f = 3 c o s 2 γ 1 2                    
c o s 2 γ = 1 2 c o s 2 θ              
c o s 2 θ =   I ( Φ ) c o s 2 ( Φ ) s i n ( Φ ) d Φ   I ( Φ ) s i n ( Φ ) d Φ
π = 180 F W H M 180

2.2.4. Production of PP/MAPP Sheets, Composites, and Tensile Testing of Composites

Production of PP/MAPP sheets, composites and tensile testing (quasi-static loading) are detailed in published work [8]. Table 2 shows the stacking arrangements of the fibre mats and the PP/MAPP sheets with relative numbers of each based on the targeted weight percentages of fibre mats.

3. Results and Discussion

3.1. Production of Fibre Mats Using Different Nozzles

An example of a complete mat produced using DSF is shown in Figure 4. The production of mats was successful using all the nozzles (Table 3), except R56 and C6. Instead of a complete mat, the use of the R56 nozzle resulted in fibre flocs or clumps (Figure 5) on the rotating drum, believed to be due to the relatively very large exit area of this nozzle compared to other nozzles. The large exit area of a nozzle can lead to low flow velocity of the fibre suspension through the nozzle, resulting in fibre clumps. It has been previously reported that at low flow velocities, the fibre suspension behaves like a plug flow, where fibre–fibre interactions are dominant, resulting in fibre flocs. As the flow velocity increases and reaches a sufficient range, the fibre–fibre interactions become insignificant due to the flow stresses, and permanent disruption of the plug (fibre-flocs) occurs [5,15,16]. It has also been previously reported that the flow characteristics of a fibre suspension depend on the flow velocity [4]. In contrast to R56 nozzle, the fibres were found to be frequently clogging up inside the C6 nozzle, believed to be due to the relatively very small exit area of this nozzle compared to other nozzles (see Table 1). This suggests that, with the current operating variables for DSF, better separated fibres (mainly separated into single fibres) are required for the successful production of fibre mats when using nozzles with very small exit areas.

3.2. Orientation Assessment of Fibre Mats Using ImageJ

3.2.1. Using Optical Microscopic Images

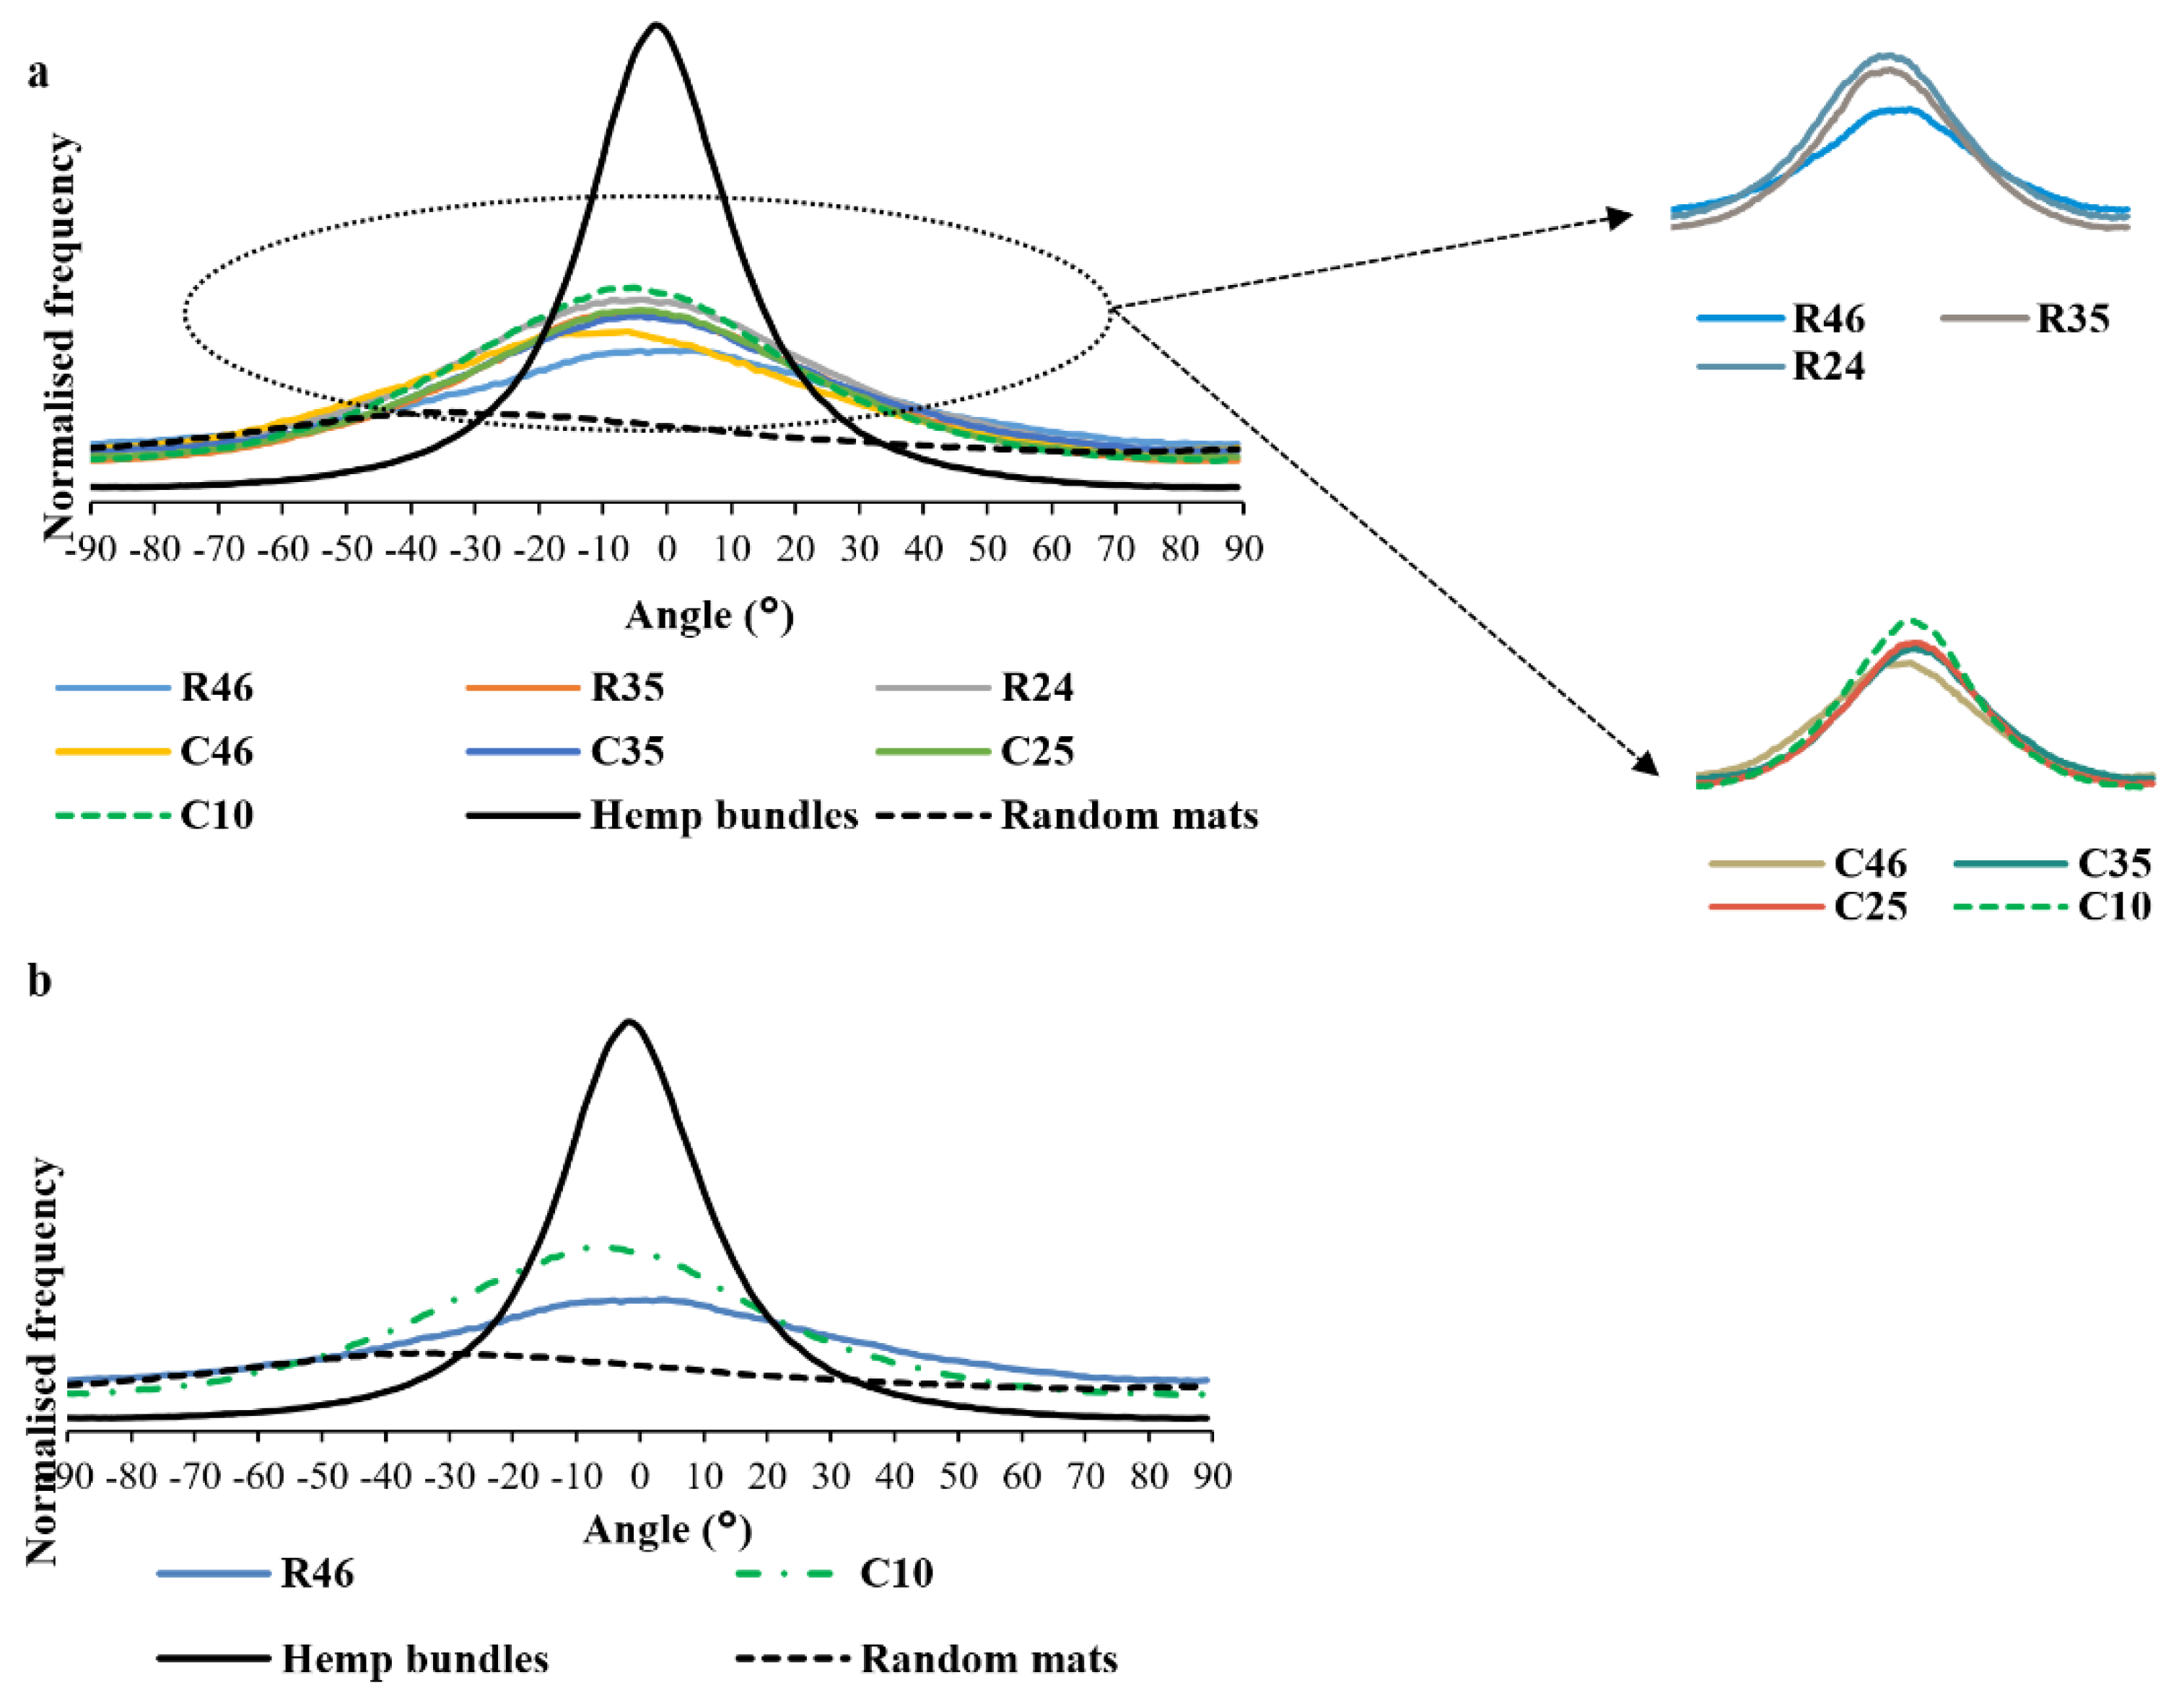
Figure 6 shows the fibre orientation distribution profiles obtained for the mats and fibre bundles (highly aligned sample) using the OrientationJ plug-in available with ImageJ software. Commonly, the orientation is indicated by the predominant peak of an orientation distribution profile [15,16]. As can be seen, the profile obtained for the random mats appeared to have a relatively small broad peak (almost a flat curve). In contrast, the profiles obtained for the fibre bundles and fibre mats appeared to have a relatively sharp predominant peak around 0° (±8°). These predominant peaks around the preferred direction (0°) for the mats produced using DSF compared to the largely flat profile (with a small peak around −40°) of random mats support that alignment is produced using the dynamic sheet former. However, the profiles obtained for the mats produced using DSF were relatively wider than for the highly aligned bundles, indicating a lower degree of orientation [17,18].
In addition to the calculation of predominant or preferred orientation of fibres in an image, the OrientationJ program also calculated a ‘coherency factor’ to that orientation [19]. This factor is calculated based on the amount of pixels that are in line in a particular direction and is bound between 0 and 1, with 0 and 1 indicating isotropic and anisotropic orientations, respectively [20]. The coherency factors generated by the OrientationJ plugin are represented in Table 4. As can be seen, the highest coherency factors were obtained for the fibre bundles followed by the fibre mats produced using DSF and the random mats.
Among the fibre mats produced using DSF with different nozzles, there was a trend of increasing fibre orientation for nozzles with increasing contraction ratio, as indicated by the increasing predominant orientation peak heights (Figure 6) and coherency factors (Table 4). However, this increase in fibre alignment was only significant for extreme cases (lower versus higher contraction ratios) when measured using this approach. Additionally, the exit shape of a nozzle was found to have less influence on fibre orientation as there were no significant differences (confirmed by Student’s t-test) in fibre orientation between the mats made with nozzles of similar contraction ratios (R46, C46 and R35, C35). When compared to the current nozzle (R46), coherency factor was found to increase by about 35% with the C10 nozzle. These results indicate that the exit shape of a nozzle is less significant for fibre orientation in DSF. This agrees with previous studies that have reported that in a simple shear flow, nozzle exit area largely affects the alignment of fibres. If the nozzle exit area is large, although fibres near to the wall are aligned towards the flow direction, at the centre, fibres are aligned perpendicular to the flow direction. In contrast, if the nozzle exit area is small, the core region slowly disappears and increases the tendency of the fibres in the suspension to align towards the flow direction [21]. It has also been reported that fibre suspension experiences extensional flow due to the sudden flow acceleration (change in velocity of suspension) by the contraction section of a nozzle and can result in more alignment of fibres towards the flow direction [22].
Qualitative visual representations of orientation distribution (colour coded maps of local angles) are also available with OrientationJ in Hue Saturation and Brightness mode [9,11]. The colour coded maps obtained for the highly aligned control sample, the random mat and the selected mats (R46, C10) produced using DSF, are shown in Figure 7. The data visualisations are in good agreement with the data acquired for the orientation distribution profiles. As can be seen, apart from the fibre bundles, the fibre mats made with the C10 nozzle (Figure 7d) revealed more orientated fibres towards 0° compared to the fibre mats made with the R46 nozzle (Figure 7c) which were more aligned than the random mat (Figure 7b).
The frequency ratio, i.e., the ratio of maximum to minimum frequency, for the aforementioned fibre orientation distribution profiles are also provided in Table 4. The reported average frequency ratio can be considered as an indication of degree of orientation of fibres within a mat. Among the mats produced using DSF with different nozzles, the mats made with the C10 nozzle exhibited the highest average frequency ratio. The nozzles of a similar contraction ratio but with different exit shapes (i.e., rectangular-round or circular) were also compared based on the average frequency ratio and no significant differences were observed.
The full width at half maximum (FWHM) is commonly used to describe the width of a peak at the mid-height position [23]. Generally, a profile with low FWHM indicates a high degree of orientation. The FWHM obtained using a Gaussians fit for each fibre orientation distribution profile, except for the random mats are also presented in Table 4. The flat profile for the random mats made FWHM difficult. Unsurprisingly, the lowest FWHM was shown for the fibre bundles. A decreasing trend for FWHM among the fibre mats produced using DSF with different nozzles was shown with increases in contraction ratios of nozzles. However, statistical analysis (Student’s t-test) did not support significant differences between these results.

3.2.2. Using Scanning Electron Micrographs

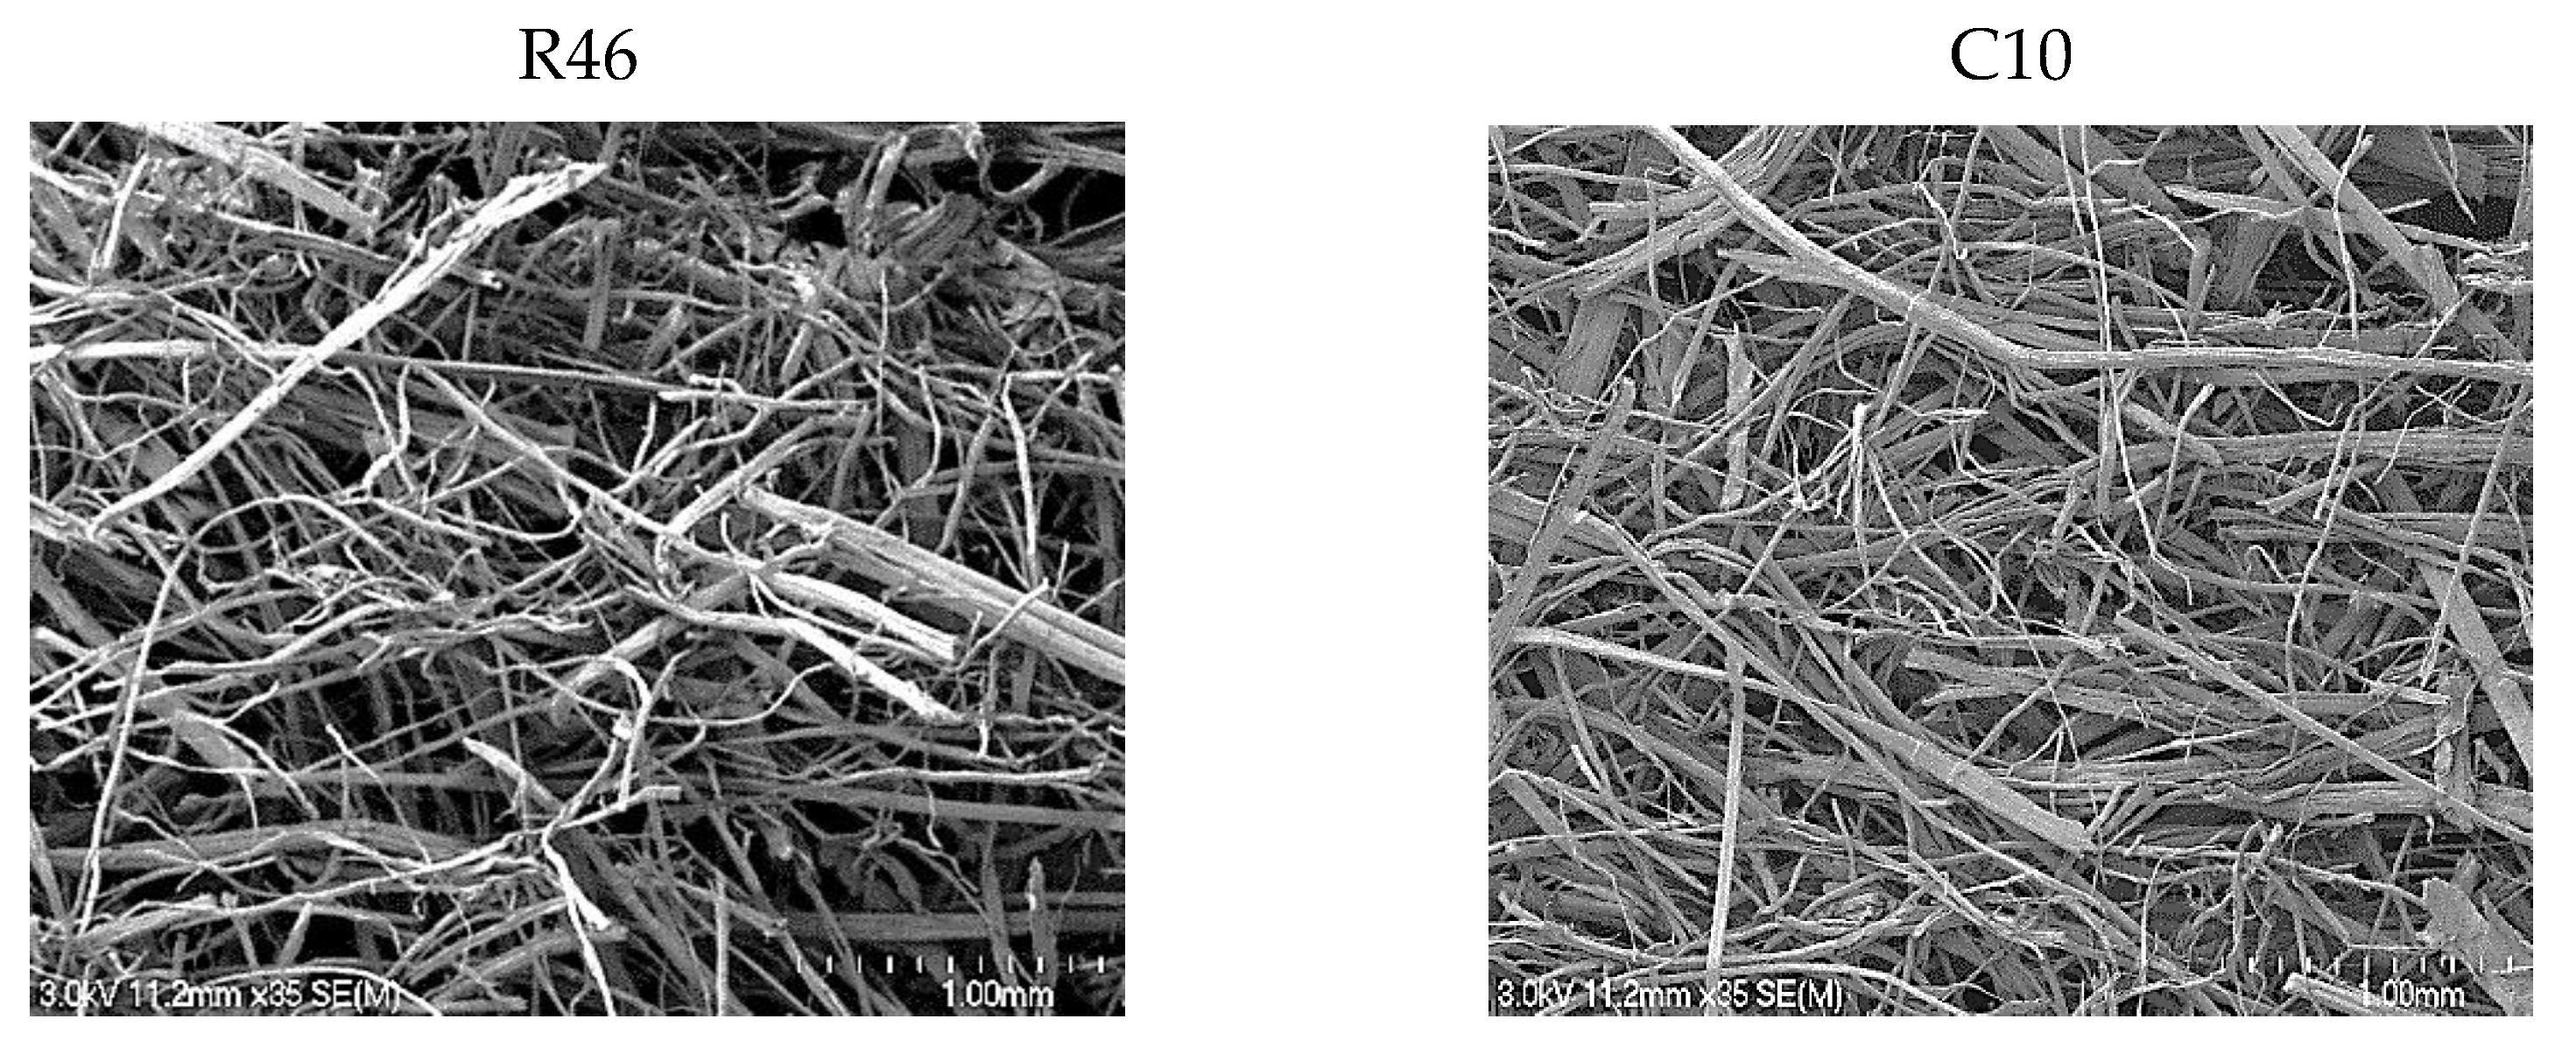
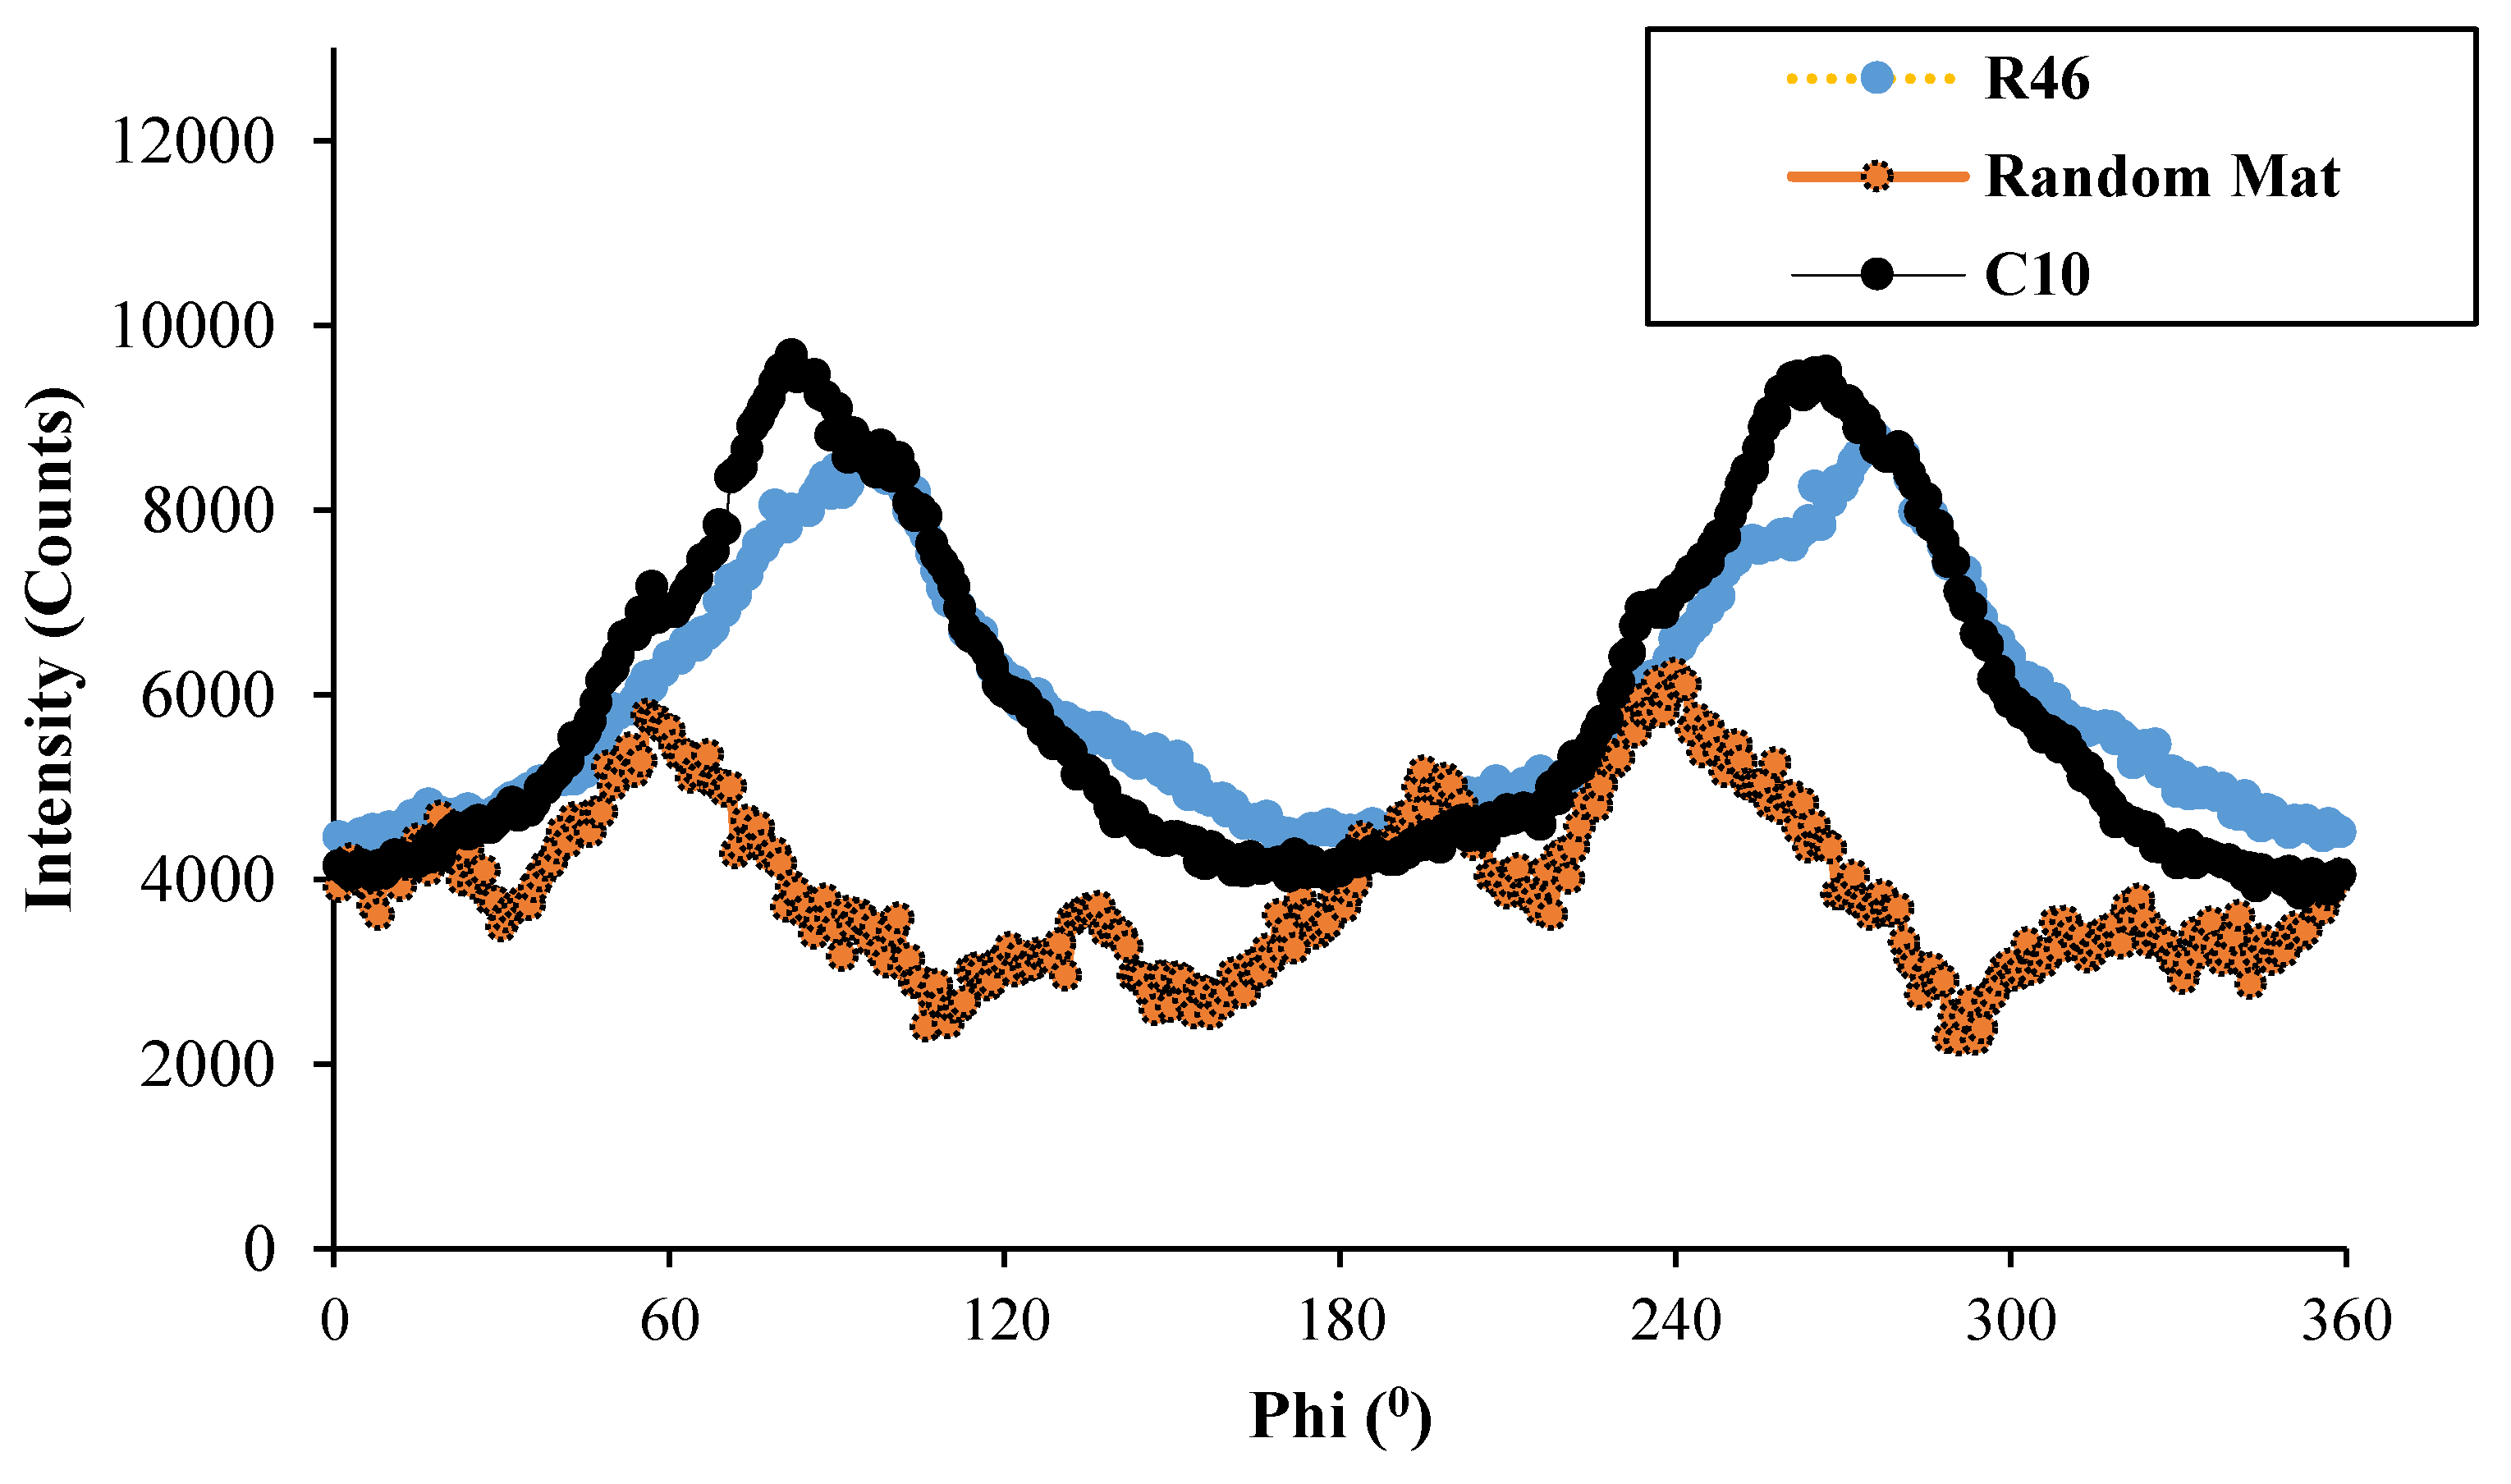
Figure 8 shows the scanning electron micrographs (SEM) of selected fibre mats (R46 and C10) produced using DSF with different nozzles. As can be seen, it is hard to visually distinguish differences between distributions of orientations of fibres within the mats. The micrographs of these selected fibre mats (R46 and C10) were assessed using OrientationJ. The data obtained was analysed using the three aforementioned approaches. The results were relatively consistent with that found for OrientationJ analysis with optical microscopic images.
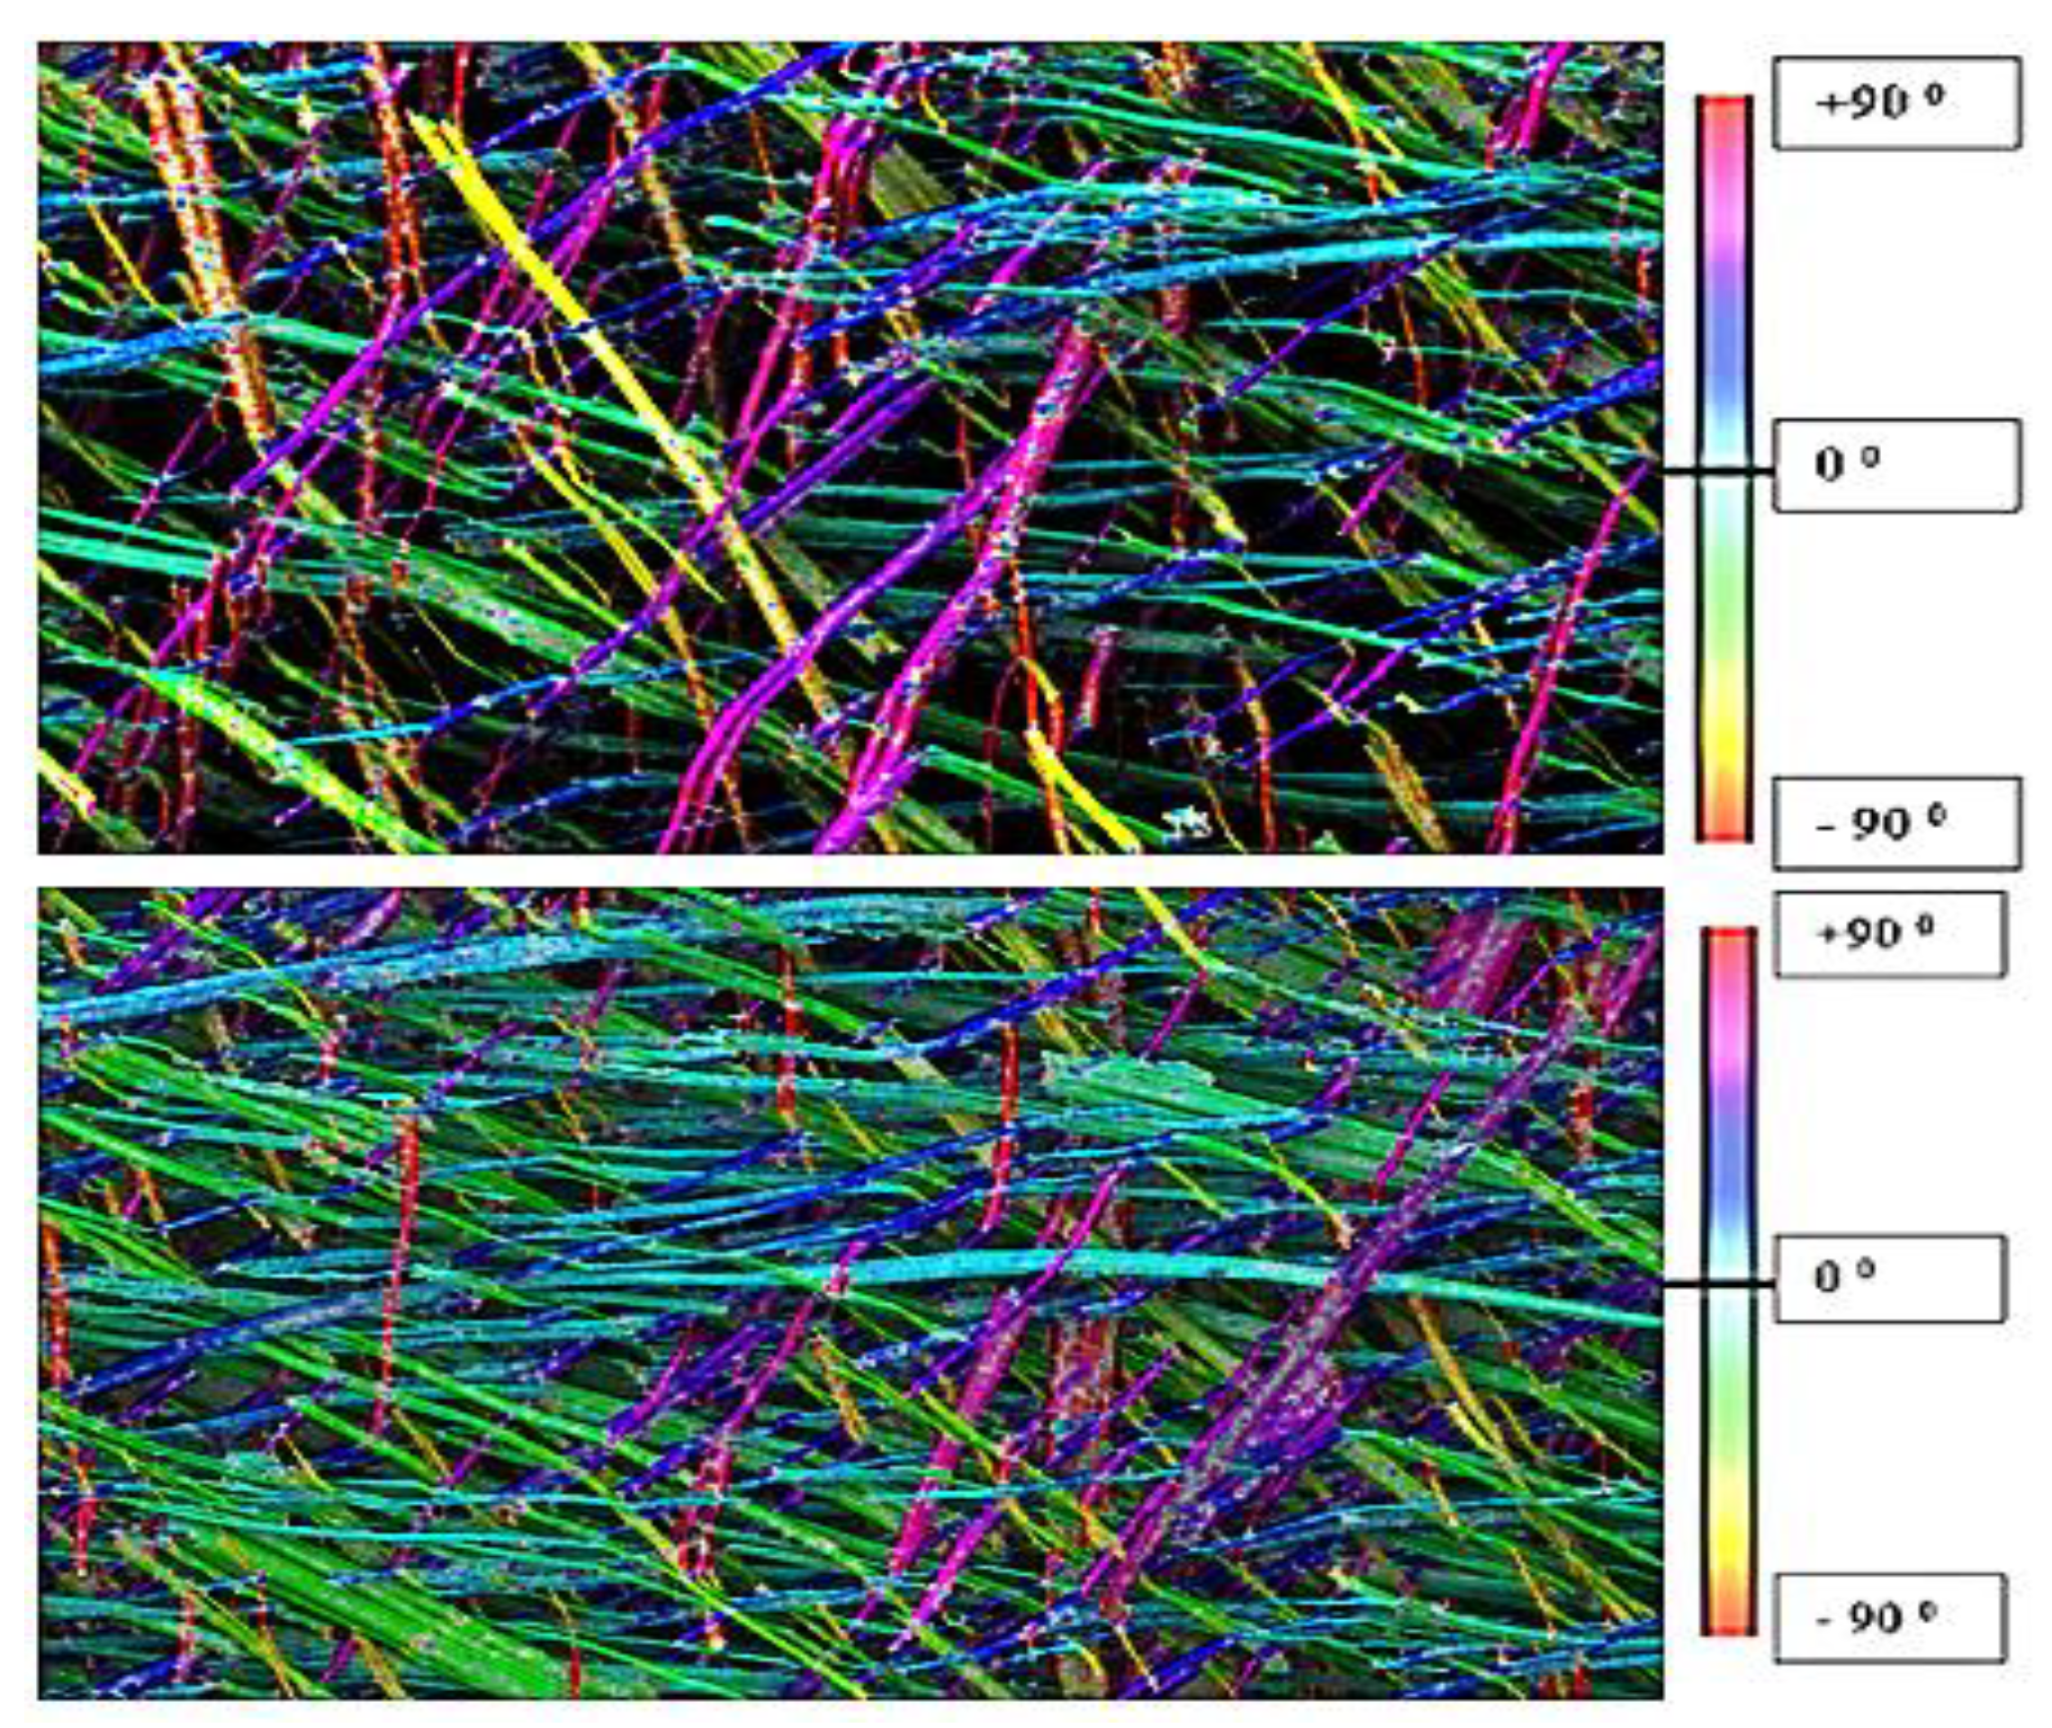
Figure 9 represents the fibre orientation distribution profiles of these mats. The predominant orientation peak height was higher for the fibre mats made with the C10 nozzle compared to the R46 nozzle. Qualitative visual representation of fibre orientation distribution within these mats can be seen in Figure 10. As expected, the scanning electron micrographs provided better visual distinction of orientation of fibres within the selected mats compared to the optical microscopic images.
Table 5 displays the generated coherency factor, calculated frequency ratio and FWHM of the fibre orientation distribution profiles for these mats. The trends were similar to the results obtained for the optical microscopic images of these fibre mats.
Overall, the trend of increasing fibre orientation for nozzles with increasing contraction ratios was more consistent with the fibre orientation distribution profiles and the frequency ratio approaches compared to the FWHM approach.

3.3. Orientation Analysis Using XRD

Generally, the cell walls of natural plant fibres (NPFs) consist of primary and secondary cell walls (S1, S2, and S3 layers). The long and thin microfibrils dominate the secondary cell walls. These microfibrils are made up of cellulose, which is mainly responsible for the tensile strength of the fibres. Typically, native cellulose consists of crystalline and alternating amorphous regions [24]. Figure 11 shows the results of one XRD scan through 2θ profiles with the raw diffraction pattern and resultant diffraction pattern of a hemp fibre mat. The raw diffraction pattern data is a combination of crystalline and amorphous contributions. The amorphous background was estimated from this raw data by fitting a power trend line to the data points from the regions (indicated by orange colour in Figure 11) outside of the main crystalline cellulose peaks. The estimated background was then subtracted from the raw data. For all the samples, the most intense diffraction plane was (200) plane of cellulose I. The selected (200) plane was then monitored during scans where the fibre mats on the sample holder were rotated around the phi (Φ) axis [12], resulting in an azimuthal diffraction profile for each mat.
Figure 12 shows the example azimuthal diffraction profiles of the selected fibre mats produced using DSF and the random mats. As can be seen, the azimuthal diffraction profiles for the mats produced using DSF indicate that the (200) crystal planes had preferred orientation distribution around 90 and 270°. In contrast, there were many peaks distributed over 360° for the random mats, suggesting no clear preferred orientation of the (200) crystal planes. This again supports the potential of the dynamic sheet former to align fibres along the preferred direction. It was found that the fibre mat made with the C10 nozzle exhibited a more preferred orientated azimuthal diffraction profile compared to the fibre mats made with the R46 nozzle.
The average intensity ratio, i.e., ratio of maximum to minimum intensity of azimuthal diffraction profiles, was calculated, and the average values for each mat are provided in Table 6. The average intensity ratio indicated an increasing trend with increasing contraction ratio. However, a significant difference (confirmed by Student’s t-test) was found only between the fibre mats made with the C10 and R46 nozzles; no significant differences were observed between nozzles with a similar contraction ratio but with a different exit shape, i.e., rectangular-round or circular.
It has been reported that Herman’s order parameter (f) can be used to quantify the degree of orientation of the cellulose chain axis relative to some other axes of interest. Generally, f = 1 for completely aligned and f = 0 for randomly orientated [25]. Herman’s order parameters (f) calculated for different processed azimuthal diffraction profiles are summarised in Table 6. In good agreement with the ImageJ results, more pronounced orientation of fibres was observed for the mats made with the C10 nozzle as indicated by the highest Herman’s order parameter. Unsurprisingly, the lowest (f) value was observed for random mats indicating a very low degree of orientation.
The full width at half maximum (FWHM) and degree of ordering (π) calculated for the FWHM of azimuthal diffraction profile indicates a high degree of orientation [26]. The FWHM and degree of ordering results indicated an increasing trend with increasing contraction ratio, however, differences between nozzles were found to be statistically insignificant using the Student’s t-test.

3.4. Evaluation of Composites

Figure 13 shows typical stress–strain curves for composites made with selected fibre mats (selected based on the orientation analysis) along with that for PP/MAPP (the control sample) for comparison purposes. The composites containing fibre content of approximately 15 wt% were tested parallel and perpendicular to the main fibre alignment direction (the preferred direction). The control samples extended in a ductile manner to high strain without fail, whereas the incorporation of fibres caused the samples to fail in a brittle manner without much noticeable yielding.
Figure 14a represents the tensile strength of fibres as a function of fibre content and loading direction for the composites. Composite tensile strength was normalised with weight percentages of fibres (Figure 14b) to account for the variability in tensile strengths of composites based on the slight variations of fibre content. From the results, it can be seen that, for the composites tested parallel to the main alignment direction, the tensile strength increased with an increase in fibre content. The tensile strengths for the composites made with 15 and 30 wt% fibre mats produced using the highest contraction ratio nozzle, C10, significantly increased to 23.08 and 35.64 MPa, respectively; these were approximately 5% and 11% higher than the respective composites made with the fibre mats produced using the current nozzle, R46. Increased tensile strengths obtained here are believed to be due to the improved fibre orientation.
Unsurprisingly, the composites tested perpendicular to the main alignment direction exhibited lower tensile strengths compared to those composites tested parallel. In the main fibre alignment direction, composite properties are known to be strongly dependent on fibre properties and the fibre-matrix interface. However, in the perpendicular direction, properties are more dependent on the fibre-matrix interface and the matrix. Furthermore, in this direction, the diameter of the fibre is very small relative to the critical fibre length to bring about tensile load in the fibre [27]. Moreover, it is most likely that the fibre strength is lower in this direction due to the orientation of microfibrils which has shown to provide high strength when aligned parallel to the fibre direction.
Figure 15a,b represent Young’s modulus and Young’s modulus/weight percentage of fibres as a function of fibre content and loading direction for the composites. As expected, Young’s modulus of PP/MAPP increased with the inclusion of fibres. This is due to the fact that fibre possesses higher Young’s modulus than PP/MAPP. Similar to the tensile strength, the Young’s modulus of composites tested parallel to the main fibre alignment direction were higher compared to those composites tested perpendicular. According to the Student’s t-test, there are no significant increases in Young’s modulus of composites made with fibre mats produced using the C10 nozzle compared to the composites made with fibre mats produced using the R46 nozzle. However, the average test results suggest that the Young’s modulus of the composites made with fibre mats produced using the C10 nozzle are slightly superior.

4. Conclusions

Nozzles with different geometries were used to produce hemp fibre mats using dynamic sheet forming. The orientation of fibres within these mats was investigated using ImageJ and X-ray diffraction analyses. It appears that both techniques were in good agreement, showing that dynamic sheet forming has the potential to produce aligned short fibre mats. Although there was a trend of increasing fibre orientation for nozzles with increasing contraction ratio, it was only statistically significant for extreme cases (lowest versus highest contraction ratios of the nozzles which successfully produced sheets); the exit shape of a nozzle was found to have no significant influence on fibre orientation. Improved fibre orientation obtained for dynamic sheet forming was indicated by higher values of coherency factor (0.31 compared to 0.23) and Herman’s order parameter (0.511 compared to 0.464) for the fibre mats produced using the highest contraction nozzle compared to those mats produced using the lowest contraction ratio nozzle (the current nozzle). The improved fibre orientation was further supported by an 11% increase in tensile strength for the composites made with 30 wt% fibre mats produced using the highest contraction ratio nozzle compared to the respective composites made with the fibre mats produced using the current nozzle, R46. Overall, the orientation of fibres within mats produced using dynamic sheet forming has been improved by nozzle modification. This provided an improvement of +11% in strength by increasing fibre orientation beyond that obtained with the manufacturer’s nozzle. Improvements of +141% in strength and +317% in stiffness overall have been obtained from reinforcement of PP/MAPP with the DSF mats with the most aligned fibre in this study.

Author Contributions

Conceptualization, T.S.; methodology, T.S., J.M.-W.; software, T.S.; validation, T.S., K.L.P. and J.M.-W.; formal analysis, T.S., J.M.-W.; investigation, T.S., J.M.-W.; resources, T.S., K.L.P. and J.M.-W.; data curation, T.S.; writing—T.S.; writing—T.S., K.L.P. and J.M.-W.; visualization, T.S.; supervision, K.L.P.; project administration, T.S., K.L.P.; funding acquisition, K.L.P. All authors have read and agreed to the published version of the manuscript.

Funding

This research received no external funding.

Institutional Review Board Statement

Not applicable.

Informed Consent Statement

Not applicable.

Data Availability Statement

The data presented in this study are provided upon request.

Acknowledgments

The authors would like to thank the University of Waikato’s composite research group for their support.

Conflicts of Interest

The authors declare no conflict of interest.

References

  1. Such, M.; Ward, C.; Potter, K. Aligned Discontinuous Fibre Composites: A Short History. J. Multifunct. Compos. 2014, 2, 155–168. [Google Scholar] [CrossRef]
  2. Sunny, T.; Pickering, K.L.; Lim, S.H. Alignment of Short Fibres: An Overview. In Proceedings of the Processing and Fabrication of Advanced Materials-Xxv, Auckland, New Zealand, 22–25 January 2017; pp. 616–625. [Google Scholar]
  3. Pickering, K.; Efendy, M.A.; Le, T. A Review of Recent Developments in Natural Fibre Composites and Their Mechanical Performance. Compos. Part A 2015, 83, 98–112. [Google Scholar] [CrossRef] [Green Version]
  4. Lundell, F.; Söderberg, L.D.; Alfredsson, P.H. Fluid Mechanics of Papermaking. Annu. Rev. Fluid Mech. 2011, 43, 195–217. [Google Scholar] [CrossRef]
  5. Cui, H.; Grace, J.R. Flow of Pulp Fibre Suspension and Slurries: A Review. Int. J. Multiph. Flow 2007, 33, 921–934. [Google Scholar] [CrossRef]
  6. Bagg, G.E.G.; Dingle, L.E.; Jones, R.H.; Pryde, A.W.H. Process for the Manufacture of a Composite Material Having Aligned Reinforcing Fibers. U.S. Patent 3,617,437, 2 November 1971. [Google Scholar]
  7. Carlsson, A. Near Wall Fibre Orientation in Flowing Suspensions. Ph.D. Thesis, Royal Institute of Technology, Stockholm, Sweden, 2009. [Google Scholar]
  8. Sunny, T.; Pickering, K.L.; Lim, S.H. Alkali Treatment of Hemp Fibres for The Production of Aligned Hemp Fibre Mats for Composite Reinforcement. Cellulose 2020, 27, 2569–2582. [Google Scholar] [CrossRef]
  9. Abràmoff, M.D.; Magalhães, P.J.; Ram, S.J. Image Processing with Imagej. Biophotonics Int. 2004, 11, 36–42. [Google Scholar]
  10. Gesellchen, F.; Bernassau, A.; Dejardin, T.; Cumming, D.; Riehle, M. Cell Patterning with a Heptagon Acoustic Tweezer–Application in Neurite Guidance. Lab Chip 2014, 14, 2266–2275. [Google Scholar] [CrossRef] [PubMed] [Green Version]
  11. Schneider, C.A.; Rasband, W.S.; Eliceiri, K.W. Nih Image To Imagej: 25 Years of Image Analysis. Nat. Methods 2012, 9, 671–675. [Google Scholar] [CrossRef] [PubMed]
  12. Yoshiharu, N.; Shigenori, K.; Masahisa, W.; Takeshi, O. Cellulose Microcrystal Film of High Uniaxial Orientation. Macromolecules 1997, 30, 6395–6397. [Google Scholar] [CrossRef]
  13. Kim, S.H.; Lee, C.M.; Kafle, K. Characterization of Crystalline Cellulose in Biomass: Basic Principles, Applications, and Limitations of Xrd, Nmr, Ir, Raman, and Sfg. Korean J. Chem. Eng. 2013, 30, 2127–2141. [Google Scholar] [CrossRef]
  14. Siqueira, G.; Kokkinis, D.; Libanori, R.; Hausmann, M.K.; Gladman, A.S.; Neels, A.; Tingaut, P.; Zimmermann, T.; Lewis, J.A.; Studart, A.R. Cellulose Nanocrystal Inks for 3d Printing of Textured Cellular Architectures. Adv. Funct. Mater. 2017, 27, 1604619. [Google Scholar] [CrossRef]
  15. Rezakhaniha, R.; Agianniotis, A.; Schrauwen, J.T.C.; Griffa, A.; Sage, D.; Bouten, C.V.; Van De Vosse, F.; Unser, M.; Stergiopulos, N. Experimental Investigation of Collagen Waviness and Orientation in the Arterial Adventitia Using Confocal Laser Scanning Microscopy. Biomech. Model. Mechanobiol. 2012, 11, 461–473. [Google Scholar] [CrossRef] [Green Version]
  16. Shah, D.U.; Vollrath, F.; Stires, J.; Deheyn, D.D. The Biocomposite Tube of a Chaetopterid Marine Worm Constructed with Highly-Controlled Orientation of Nanofilaments. Mater. Sci. Eng. C 2015, 48, 408–415. [Google Scholar] [CrossRef]
  17. Bandhakavi, V.S.S.; Aidun, C.K. Analysis of Turbulent Flow in the Converging Zone of a Headbox. In Proceedings of the 1999 TAPPI Engineering/Process & Product Quality Conference, Anaheim, CA, USA, 12–16 September 1999. [Google Scholar]
  18. Lin, J.; Shi, X.; Yu, Z. The Motion of Fibers in An Evolving Mixing Layer. Int. J. Multiph. Flow 2003, 8, 1355–1372. [Google Scholar] [CrossRef]
  19. Lewis, D.D.J. Interlaminar Reinforcement of Carbon Fiber Composites from Unidirectional Prepreg Utilizing Aligned Carbon Nanotubes. Ph.D. Thesis, Massachusetts Institute of Technology, Cambridge, MA, USA, 2016. [Google Scholar]
  20. Palmieri, V.; Lucchetti, D.; Maiorana, A.; Papi, M.; Maulucci, G.; Calapà, F.; Ciasca, G.; Giordano, R.; Sgambato, A.; De Spirito, M. Mechanical and Structural Comparison between Primary Tumor and Lymph Node Metastasis Cells in Colorectal Cancer. Soft Matter 2015, 11, 5719–5726. [Google Scholar] [CrossRef] [PubMed]
  21. Papathanasiou, T.; Guell, D.C. Flow Induced Alignment in Composite Materials; Woodhead Publishing: Singapore, 1997. [Google Scholar]
  22. Pratima, B. Biotechnology for Pulp and Paper Processing; Springer: Singapore, 2012. [Google Scholar]
  23. Reddy, A.N.K.; Sagar, D.K. Half-Width at Half-Maximum, Full-Width at Half-Maximum Analysis for Resolution of Asymmetrically Apodized Optical Systems with Slit Apertures. Pramana 2015, 84, 117–126. [Google Scholar] [CrossRef]
  24. Tabet, T.A.; Aziz, F.A. Cellulose Microfibril Angle in Wood and Its Dynamic Mechanical Significance. In Cellulose-Fundamental Aspects; Intech: London, UK, 2013. [Google Scholar]
  25. Dri, F.L.; Hector, L.G.; Moon, R.J.; Zavattieri, P.D. Anisotropy of the Elastic Properties of Crystalline Cellulose I Β from First Principles Density Functional Theory with Van Der Waals Interactions. Cellulose 2013, 20, 2703–2718. [Google Scholar] [CrossRef]
  26. Torres-Rendon, J.G.; Schacher, F.H.; Ifuku, S.; Walther, A. Mechanical Performance of Macrofibers of Cellulose and Chitin Nanofibrils Aligned by Wet-Stretching: A Critical Comparison. Biomacromolecules 2014, 15, 2709–2717. [Google Scholar] [CrossRef] [PubMed]
  27. Mohd Ghazali, A.E. Bio-Composites Materials from Engineered Natural Fibres for Structural Applications. Ph.D. Thesis, University of Waikato, Hamilton, New Zealand, 2016. [Google Scholar]
Figure 1. (a) Schematic representation of converging or diverging profiles of nozzles, (b) manufacturer supplied nozzle (R46) used in dynamic sheet forming and (c) 3D printed nozzles used for the present study. Note the following: all the dimensions include the wall thickness of 3 mm.
Jcs 05 00226 g001aJcs 05 00226 g001b
Figure 2. (ac) Optical microscopic images of fibre mats produced using dynamic sheet forming (DSF), highly aligned sample and random mat, respectively, (d) scanning electron microscopic images of fibre mats produced using DSF.
Jcs 05 00226 g002
Figure 3. Photographs of a sample prepared for XRD analysis. Note the following: top view (left) and bottom view (right).
Jcs 05 00226 g003
Figure 4. A complete hemp fibre mat produced using DSF (approx. 1000 mm × 300 mm × 0.80 mm).
Jcs 05 00226 g004
Figure 5. Fibre clumps formed on the wire mesh covering the rotating drum of the dynamic sheet former.
Jcs 05 00226 g005
Figure 6. (a,b) Graphs representing fibre orientation distribution profiles obtained for the hemp fibre mats made using DSF with different nozzles and control samples (enlarged profiles of rectangular round (R) and circular (C) nozzles are also shown separately). Optical microscopic images of the fibre mats were used for the analysis.
Jcs 05 00226 g006
Figure 7. The colour-coded maps obtained with OrientationJ for: (a) fibre bundles (b) random mats and (c,d) fibre mats produced using R46 and C10 nozzles, respectively.
Jcs 05 00226 g007
Figure 8. Scanning electron micrographs of fibre mats produced using DSF with different nozzles.
Jcs 05 00226 g008
Figure 9. Graphs representing fibre orientation distribution profiles obtained for the fibre mats made using DSF with selected nozzles (R46 and C10). Scanning electron micrographs of the fibre mats were used for the analysis.
Jcs 05 00226 g009
Figure 10. Colour coded maps obtained for the scanning electron micrographs of the selected fibre mats using OrientationJ plugin (R46-top and C10-bottom).
Jcs 05 00226 g010
Figure 11. X-ray diffraction pattern of a hemp fibre mat using Cu Kα radiation.
Jcs 05 00226 g011
Figure 12. Azimuthal diffraction profiles for the selected fibre mats and random mats.
Jcs 05 00226 g012
Figure 13. Typical stress–strain curves for PP/MAPP and composites reinforced with approximately 15 and 30 wt% fibre loaded parallel and perpendicular to main fibre alignment direction.
Jcs 05 00226 g013
Figure 14. Graphs representing: (a) tensile strength and (b) tensile strength/weight percentage* of various composites tested. Weight percentage = weight percentage of fibres.
Jcs 05 00226 g014
Figure 15. Graphs representing: (a) Young’s modulus and (b) Young’s modulus/weight percentage* of various composites. Weight percentage = weight percentage of fibres.
Jcs 05 00226 g015
Table 1. Nozzle details.
Nozzle *Inlet Area/mm2Exit Area/mm2Contraction RatioFlow Velocity at the Entry of Each Nozzle/m/sFlow Velocity at the Exit of Each Nozzle/m/s
R56 561.40 1.16
R46 461.70 1.42
R35 352.24 1.86
R24 243.23 2.72
C4679461.700.831.42
C35 352.24 1.86
C25 253.13 2.61
C10 107.50 6.52
C6 614.22 11.81
* R and C refer to exit shape, rectangular-round or circular, respectively, and the number following refers to the exit area of a nozzle.
Table 2. Material lay-up in the mould.
Sample **No. of PP* SheetsNo. of Fibre MatsTargeted Fibre wt% (Approx.)Fibre wt%Arrangement of PP* and Fibre Mat Layers from Bottom to Top Fibre Loading Direction
PP/MAPP40004PP-
R46-15431515.71PP*/1MAT/1PP*/1MAT/1PP*/1MAT/1PP*Parallel or Perpendicular
C10-1514.5
R46-15-P15.5
C10-15-P15.6
R46-30363029.21PP*/3MATS/1PP*/3MATS/1PP*Parallel
C10-3029.3
** R and C refer to exit shape, rectangular-round or circular, respectively, and the number following refers to the exit area of a nozzle and the final number refers to the targeted weight% of fibres, P = fibre mat perpendicular relative to DSF rotation direction, PP* = PP/MAPP.
Table 3. Production of fibre mats using different nozzles.
NozzlesComplete Mat
R56No
R46Yes
R35Yes
R24Yes
C46Yes
C35Yes
C25Yes
C10Yes
C6No
Table 4. Coherency factors generated by the OrientationJ plugin, the calculated frequency ratio, and full width at half maximum (FWHM) of the fibre orientation distribution profiles.
Samples *Contraction RatioAverage Coherency FactorSD #Average max/min Frequency RatioSD #FWHMSD #
Random mats-0.110.041.800.21--
Fibre bundles-0.360.1225.98.8325.000.98
R461.700.230.032.420.5373.887.09
R352.240.240.043.100.8969.406.27
R243.230.260.043.120.8567.606.71
C461.700.210.062.760.8270.968.22
C352.240.230.042.790.7270.607.16
C253.130.260.053.120.9367.686.53
C107.500.310.023.431.0567.887.08
* R and C refer to exit shape, rectangular-round or circular, respectively and the number following refers to the exit area of a nozzle, # SD = standard deviation.
Table 5. Coherency factors generated by OrientationJ plugin, the calculated frequency ratio and full width at half maximum (FWHM) of the fibre orientation distribution profiles.
SamplesContraction RatioAverage Coherency FactorSD #Average Frequency RatioSD #Average FWHMSD #
R461.70.240.024.380.7868.676.02
C107.50.290.015.760.5420.333.79
# SD = standard deviation.
Table 6. XRD assessment of orientation of fibre mats: average intensity ratio, Herman’s order parameter, FWHM and degree of ordering.
Samples *Contraction RatioAverage Intensity RatioSDHerman’s Order ParameterSDFWHMSDDegree of Ordering (π), %
Random mats-1.3460.1350.1390.094---
R461.701.9040.0640.4640.03358.22.167.67
R352.241.9880.0790.4460.04757.91.367.83
R243.231.9940.0520.4020.01657.21.568.22
C461.701.9520.1420.5040.04258.11.967.72
C352.242.0700.2640.4550.01857.71.167.94
C253.132.1220.0980.4180.03957.11.668.28
C107.502.2780.1560.5110.00553.10.770.50
* R and C refer to exit shape, rectangular-round or circular, respectively and the number following refers to the exit area of a nozzle.
Publisher’s Note: MDPI stays neutral with regard to jurisdictional claims in published maps and institutional affiliations.

