

Moisture and Glass Transition Temperature Kinetics of Ambient-Cured Carbon/Epoxy Composites


1
Department of Civil Engineering, University of Texas Arlington, Arlington, TX 76019, USA
2
Department of Mechanical and Aerospace Engineering, University of Texas Arlington, Arlington, TX 76019, USA
*
Author to whom correspondence should be addressed.
J. Compos. Sci. 2023, 7(11), 447; https://doi.org/10.3390/jcs7110447
Submission received: 23 July 2023
/
Revised: 18 October 2023
/
Accepted: 25 October 2023
/
Published: 27 October 2023
(This article belongs to the Special Issue Feature Papers in Journal of Composites Science in 2023)
Abstract
:Carbon fiber reinforced polymer composites are widely used in the rehabilitation, repair, and strengthening of civil, marine, and naval infrastructure and structural systems. In these applications, they are exposed to a range of exposure conditions, including humidity and immersion, which are known to affect the durability of the resin and the fiber–matrix interface over long periods of time. This paper presents results of long-term hygrothermal aging of wet layup carbon/epoxy composites including through acceleration by temperature focusing on the development of a comprehensive understanding of moisture uptake kinetics and its effects on glass transition temperature and interface and inter-/intra-laminar dominated performance characteristics. A two-phase model for uptake that incorporates both diffusion- and relaxation-/deterioration-dominated regimes, as well as a transition regime, is shown to describe uptake well. The inclusion of damage terms to the diffusion and relaxation coefficients is seen to capture changes well, with the effective diffusion and relaxation coefficients increasing with fiber volume fraction and temperature. Effects of uptake, including at elevated temperatures, reflective of accelerated aging, on glass transition temperature and flexural strength are correlated, emphasizing a three-stage progression of overall response in line with the moisture uptake changes. The drop in glass transition temperature per percent increase in moisture uptake was seen to range from a low of 4.38% per % increase in moisture content, for the highest volume fraction at the highest temperature, to a high of 6.95% per % increase in moisture content, for the intermediate volume fraction at the lowest temperature. The composites with heavier fabric showed the greatest drop in both glass transition temperature and flexural strength, indicating a level of correlation between these characteristics as well. It is shown that both glass transition temperature and flexural strength show steep initial decreases, followed by a regime with slower decrease and, then, an asymptotic or near-asymptotic response with time of immersion, suggesting a close correlation with moisture uptake, which forms the basis for future modeling.
1. Introduction
The rehabilitation of deteriorating and under-strength civil infrastructure elements is increasingly implemented through the external bonding of prefabricated or wet layup composites under field conditions. While these materials have been used successfully in the field in applications ranging from pipelines and tunnels to buildings and bridges the lack of long-term in-service data and concerns related to long-term durability under harsh and changing environmental conditions including due to the hygrothermal exposure has resulted in the development of design guidelines and codes incorporating extremely conservative reduction and partial safety factors [1,2]. While carbon fibers per se are not affected by the environmental regimes likely to be faced in routine use, the resin and the interface are susceptible to degradation and change by a range of exposure conditions among which moisture, in the form of high humidity and/or immersion, is of significant concern. The use of non-autoclave manual processes such as wet layup which also incorporate ambient temperature cure increase susceptibility to moisture and temperature induced changes over their life cycle [3,4]. The exposure of epoxies and related carbon/epoxy composites to moisture in the form of humidity and/or solution immersion is known to result in plasticization [5,6,7], which causes a decrease in their glass transition temperature through the interruption of interchain hydrogen bonds by water molecules [8,9], swelling [8,9,10], degradation of molecular and network structure [11,12], saponification, and degradation of the fiber–matrix bond and interphase [3,13,14,15]. While moisture uptake can result in reversible and irreversible deterioration of resin characteristics, it can also cause an initial acceleration in cure progression, thereby setting up competition between the mechanisms of performance enhancement and increased glass transition temperature and those of deterioration due to uptake [6].
Moisture uptake in an epoxy is related to the presence of molecular-sized holes and polymer–water affinity, in addition to debond-based paths at the fiber–matrix interface, in a composite. These holes depend on the structure, morphology, and degree of polymerization, whereas the affinity is related to the presence of hydrogen bonding sites along the polymer chain. Apicella et al. [16,17] suggested the following three modes for sorption: (a) bulk dissolution, (b) moisture sorption onto surface holes in free volume, and (c) hydrogen bonding between hydrophilic polymer groups and water. The existence of two forms of water, free and bound, was proposed by Moy and Karasz [18] and Pethrick et al. [19], among others, bringing about the recognition of multiple phenomena and mechanisms affecting diffusion and leading to the development of two-staged and multiphase models for uptake, in contrast to the traditional Fickian mode wherein uptake is characterized by two parameters, diffusivity and uptake level of saturation [20], with diffusion being characterized in polymers and composites with a constant diffusion coefficient [21,22], a concentration-dependent diffusion coefficient [23], or a stress-dependent diffusion coefficient [24]. Dual-stage sorption models have been proposed for several cases of moisture uptake by Behrens and Hoptenberg [25], Bagley and Long [26], Peppas and Sahlin [27], Carter and Kibler [28], and Bao et al. [29], among others.
These models focus on addressing aspects of anomalous (non-Fickian) diffusion, that comprises additional physical and physicochemical processes particularly related to phenomena such as molecular relaxation, segmental mobility retardation, interaction of the penetrant with macromolecules, wicking, microcracking, and other deterioration mechanisms that modify the diffusion process. These also attempt to address the slow increase in uptake levels after a transition point which results in a saturation level not being attained within shorter-term time frames, as well as the effect of cure progression on changes in network structure which in turn results in changes in diffusion. Since moisture uptake has a significant influence on performance characteristics and glass transition temperature, a deeper understanding of moisture uptake characteristics and kinetics is essential for the prediction of long-term durability, and to ensure accurate design, safety, and economic viability [30,31]. Despite significant efforts in this area, the complexity of the mechanisms inherent in a composite which depend on the constituent materials and the bond between them, both of which are affected by moisture uptake, has resulted in a lack of comprehensive knowledge of durability, especially under long-term service conditions. This severely limits the use of these materials in areas where catastrophic failure could lead to severe damage, not just to the structure itself but also to the environment [32], and emphasizes the need for more accurate modeling of moisture uptake and understanding the mechanisms associated with diffusion [33].
The short timeframes of exposure traditionally used for study of moisture and solution related aging and degradation have been shown to be insufficient for attaining saturation, especially for systems such as ambient and moderate-temperature cured composites [31,33], emphasizing the need for longer-term studies for the comprehensive understanding of the mechanisms and prediction of the durability of these systems [34]. This paper is part of a comprehensive study on the long-term durability of ambient-cured systems over a range of materials and exposure conditions. In this study, an ambient-cured epoxy and wet layup carbon/epoxy composites, at different thickness levels, used extensively in the rehabilitation of civil infrastructure, are subjected to immersion in deionized water over a range of temperatures for periods up to 5 years to investigate moisture uptake characteristics and key effects, including on glass transition temperature, and to distinguish between mechanisms of Fickian diffusion and longer-term relaxation-/deterioration-based uptake. The longer-term goal is to not only provide the basis for accurate characterization and prediction of durability at a fundamental level so that it can be modeled based on constituent material and processing combinations based on exposure conditions, but to also ensure the development of appropriate design/safety factors for use in the field. Specifically, the investigation focuses on the development of a model to describe moisture kinetics in composites that is based on resin kinetic characteristics and is able to identify levels of difference in these based on composite constituents, configuration, and moisture-induced damage/changes across both stages of uptake, while also taking into account the effect of temperature of immersion. In addition, the goals were to further assess the effects on trends in glass transition temperature and flexural strength, emphasizing resin- and interface-dominating effects.
2. Materials and Test Methods
To ensure that wet layup and an ambient cure process similar to those used in the field were used, the resin system was designed with a viscosity of 700–900 cps and a gel time of approximately 60 min using a 4,4′-isopropylidenephenol-epichlorohydrin (similar to a DGEBA Epon 828 type system) with an aliphatic amine hardener in a 2:1 ratio. Unidirectional fabric of 12k untwisted T700 carbon fibers having a nominal tensile strength, tensile modulus, and density of 4900 MPa, 230 GPa, and 1.80 g/cm3 were used as the reinforcement. To assess the effects of fabric and overall thickness on uptake mechanisms, two areal weights of fabric at 300 and 600 g per square meter (gsm) were used to fabricate composites of 1- and 2-layer thicknesses, with the latter being from both fabrics, with nominal thicknesses of 0.72 mm (1 layer of the 300 gsm fabric, designated in the paper as 300/1), 1.34 mm (2 layers of 300 gsm fabric, designated in the paper as 300/2), and 1.8 mm (2 layers of 600 gsm fabric, designated in the paper as 600/2). The use of 2 areal weights of the same fabric type enables both a change in the fiber volume fraction and assessment of greater intralaminar intermingling/compaction between layers without changes in overall constituent and process characteristics. The panels were fabricated using the wet layup process with only manual-roller-based pressure and without vacuum bags or pressure plates, to mimic field conditions as closely as possible. Fiber mass fractions were determined through acid digestion to be 35%, 39%, and 44% for the 300/1, 300/2, and 600/2 composites, respectively, resulting in effective fiber volume fractions of 26%, 29%, and 34%, respectively, with void fractions ranging from 2–3%. Flat panels of resin of 5 mm thickness were also cast under ambient temperature conditions, resulting in a density of 1.22 g/cm3. Details are also provided in Table 1 for ease of reference.
All specimens were conditioned for 30 days at 20–23 °C prior to exposure and testing to ensure a reasonable level of cure progression based on prior investigation of the same resin system [35,36], for which the glass transition temperature prior to exposure was noted to be 92 °C [35].
Moisture uptake was determined from specimens of 25.4 mm × 25.4 mm size cut from resin plaques and composite plates at the actual thickness of each specimen, thereby keeping surface conditions consistent. Five specimens were used for each measurement, with specimens immersed in temperature-controlled baths at 23 ± 1 °C, 37.8 ± 1 °C, and 60 ± 1 °C, with continuous monitoring of both water levels and temperature. Specimens were placed ensuring no contact between adjacent specimens so as to preclude any difference in exposure conditions. A set of specimens was also stored under controlled conditions of 23 °C and 30% RH as reference controls and to assess the progression of cure over time. Specimens were removed periodically, over a period exceeding 5 years, using padded tweezers to ensure minimal pressure and no transfer of oils or substances from human hands that could inadvertently contaminate the specimens and/or the solutions, patted dry with tissue paper, and then weighed to measure uptake, after which they were reinserted into the baths. The time period for the operation was standardized for consistency and to avoid effects of varying levels of evaporation through the specimens.
Dynamic mechanical thermal analysis (DMTA)-based characterization was conducted in three-point bending mode on specimens of 9 mm width with a span:thickness ratio of 16:1 at a frequency of 1 Hz with a strain of 0.0025% and a heating rate of 5 °C/minute. Specimens were placed in the three temperature baths with the moisture uptake specimens, and similar care was taken to ensure that the time period between the removal of specimens from the temperature-controlled baths and the initiation of DMTA testing was standardized. A minimum of three specimens were tested for each set at periodic intervals up to 60 months.
To correlate changes in moisture uptake and glass transition temperature with mechanical performance, flexure tests following ASTM D790 were conducted at periodic levels, on specimens placed in the 3 temperature-controlled baths using the same precautions as used with DMTA specimens. A minimum of 5 specimens were tested in three-point-flexure mode at each time period (up to 60 months) and immersion condition. A span-to-depth ratio of 16:1 was used with a nominal width of 12.5 mm. The test was specifically chosen to assess performance of the number of layers and fabric weight which result in difference in fiber and bundle interactions and compaction, causing tortuosity in flow and increased interlaminar and interlaminar interaction components. The 3-point flexure test incorporates both shear and bending components and, hence, enables a focus on resin- and interface-dominated effects. Photographs of test equipment for the DMTA and flexure tests are shown in Figure 1a,b, respectively.
3. Results and Discussion
3.1. Moisture Uptake and Kinetics
While moisture uptake in polymers and composites is often described by the process of Fickian diffusion, it has been shown that many of these materials do not attain saturation over extended periods of time, with uptake continuing to increase due to aspects such as moisture-induced changes at the resin and fiber interface levels, including within the polymer network and from relaxation and deterioration processes, which are slower than the initial diffusion processes [29,37]. Following Bao et al. [29], moisture uptake, Mt, at time, t, can be expressed as
where Mtrans and D are the equilibrium moisture uptake level and diffusion coefficient associated with uptake in the first stage, as shown in the schematic in Figure 1, k is a time-dependent coefficient characteristic of the rate of polymer relaxation and second-stage damage due to the moisture absorbed, and h is the thickness of the specimen.
The second stage in Figure 2 is associated with slower relaxation processes, as polymer chains slowly rearrange in the presence of penetrants, with the uptake in this stage being due to coupling of diffusion and macromolecular relaxation. Moisture parameters, including the level of Mtrans, which indicates the level of transition uptake between Stage Ι and Stage ΙΙ, for the resin are listed in Table 2 with a comparison of experimental data with results based on the use of Equation (1) shown in Figure 3. As seen from Table 2 and Figure 3, there is very small variation in the level of Mmax at the end of the time period, with similar levels being obtained at all three temperatures of immersion, suggesting a common threshold that is attained faster by elevating the temperature of immersion. As is noted later in the paper, the three composites do not show this similarity in attainment due to differences in mechanisms at the fiber–matrix interphase and at the intra- and interlaminar levels.
As is expected, the diffusion coefficient, Dr, increases with temperature of immersion, indicating early mass increase at high rates associated with classical Fickian processes in stage Ι, with more complex interactions due to hydrolysis and relaxation-based processes, including an increase in network hydrophilicity and reduction in crosslink density in stage ΙΙ, resulting in the variation in values of k. The levels of Mtrans and Mmax are affected by the temperature of immersion, further emphasizing the non-Fickian nature of uptake, in line with [6], since strict Fickian diffusion should result in the same saturation level, Mmax, irrespective of immersion temperature.
In an attempt to compare moisture uptake in a resin to that in a composite formed of that resin, consideration has to be provided to the change in volume of resin through which diffusion occurs, as well as the paths for uptake along fiber–matrix interfaces, network areas of change locally due to fiber interactions, and effects of tortuosity because of modified flow paths around fibers. In the current case, since carbon fibers are effectively inert to influence of moisture, effects due to absorption into the fiber and changes in the fiber do not have to be considered. These effects in a two-stage model can then be differentiated based on differences between the “ideal” and “actual” diffusion and relaxation/deterioration coefficients. In the case of unidirectional composites, wherein diffusion is direction-dependent, Shen and Springer [21] drew an analogy from heat conduction to express diffusivity in a unidirectional composite in a direction normal to the fibers, DN, as
where
And the diffusivity in the composite parallel to the direction of the fibers, D1, is given by the rule of mixtures as
where Dr and Df are the diffusivities in the resin and fiber, respectively, and Vf is the fiber volume fraction. Following Starink et al. [38], for the specific case where Df = 0, the effective diffusivity in the composite can be expressed as
where b and c are the planar dimensions of the moisture uptake specimen, a is the thickness (h in Equation (1)), and λ = 0.54. Treating the relaxation coefficient in the same way and neglecting second\-order edge effects, moisture uptake in the composite can be determined through a combination of Equations (1) and (3) as
Keeping in mind that the models used are approximations and do not account for interactions between fiber and matrix, changes in network structure and morphology due to moisture uptake, changes in reaction thermodynamics due to absorption (endothermic absorption resulting in an increase in uptake with temperature and exothermic with a decrease in uptake with temperature), and effects of tortuosity due to fiber entanglement and compaction, modification factors L1 and L2 are applied to the relaxation and diffusion coefficients of the resin, respectively, such that
The modification factors represent the specific changes in relaxation and diffusion characteristics over those that would be expected if a direct transition from resin to composite response, as represented by the inclusion of fiber volume fraction, were viable. This provides an assessment of interface and resin changes effected by temperature as differentiated from the bulk resin and fiber volume fraction modified bulk resin modified characteristics, and provides a more thorough understanding of local response especially as affected by the fabric type, number of layers and compaction, and temperature of solution. Equation (5) effectively describes the response over the two regions and the transition zone between stage Ι and stage ΙΙ uptake, and can be rewritten as
Mt= (Uptake due to diffusion dominated regime) + (Uptake due to relaxation and longer-term deterioration) + (Uptake in the transitional regimes)
i.e.,
where:
and
The first term in Equation (7a) represents Fickian diffusion, whereas the second is that of longer-term relaxation/deterioration which, as expected, is linear in structure. When the relaxation term, keff, is zero, the structure is basically that of Fickian diffusion. Thus, a comparison coefficient can be used to further understand differences, not just in moisture uptake and rates, but also in the extent of phenomena changing response from that based on bulk resin and/or the idealized composite.
Figure 4a–c show measured data from moisture uptake experiments for the three composites (300/1, 300/2, and 600/2) over 3 temperatures of immersion each, along with the results from the use of Equation (5), showing close correspondence between them. The increase in uptake level with temperature confirms the trends reported earlier [29,31,34,39] in contrast to the temperature independence of equilibrium moisture content reported through shorter-term exposure [40] and on bulk resins rather than composites [41]. Values for the kinetic parameters for diffusion and relaxation/deterioration coefficients determined directly from resin data following Equations (7b) and (7c), respectively, as well as the final coefficients, determined through the use of Equation (4), are listed in Table 3.
As can be seen from Figure 4a–c and Table 2 and Table 3, the maximum moisture uptake, Mmax, increases with temperature of immersion for all specimens. The uptake in the composites is less than that of the neat resin at the two lower temperatures, but at the highest temperature of immersion, the levels in the composite are higher, which can be correlated to the additional deterioration, which causes wicking along the fiber–matrix interface, resulting also in a substantially increased diffusivity coefficient, D. It is of interest to note that the level of uptake increases with increase in fiber volume fraction, indicative of additional uptake paths along the debonded fiber–matrix interface regions. The moisture content associated with the transition between stage Ι and stage ΙΙ uptake, Mtrans, is lower for the composites than for the resin at all temperatures. Although mechanisms of desorption and extent were not assessed in the current investigation, it is important to note that the transition also signifies the change in dominant mode from free to bound water, since the second-stage effects, which occur after transition, are largely due to the latter. As can be seen in Figure 5a, the transition point is attained substantially earlier in the composites than in the resin, with time to attain Mtrans increasing with volume fraction and decreasing with temperature of immersion. The level of increase with fiber volume fraction is the highest at 23 °C, with the levels at the two higher temperatures being substantially lower, indicating the complex interaction between the effects of cure progression and diffusion in the first stage. Earlier attainment indicates a shorter dominance of stage Ι type mechanisms.
Given the importance of the extent of each regime, it is also of interest to assess the ratio Mtrans/Mmax, since it provides insight into the relative influence and lengths of the initial diffusion-dominated regime and the subsequent relaxation-/deterioration-based regime that has slower rates of uptake but represents a complex set of competing phenomena, including longer-term hydrolysis of the resin, irreversible network changes, and deterioration through increase in size and extent of microcavities and fiber–matrix debonding. As seen in Figure 5b, the ratio is independent of temperature in the case of resin, as should be expected, since the levels of maximum uptake are similar, with the uptake at the highest temperature of immersion being only 4.8% greater than that at the lowest, and the mechanisms related to moisture-based reactions with the polymer network being expected to be similar. In the composites, however, the ratio is lower, decreasing with temperature of immersion and for a majority of the specimens (except for the two-layered specimens immersed in water at 23 °C) being between 0.41–0.45, suggesting a similarity in overall behavior and extent of the diffusion-dominated regime. In the case of the two -layered specimens, the higher level for the lower volume fraction at the lowest temperature of immersion can be related to greater paths for uptake along fiber–matrix interface regions and local areas of resin inhomogeneity in cure, which are obviated at the higher temperatures of immersion, as has been noted previously to lead to further progression of cure [31,42,43].
As seen in Figure 2, uptake is characterized by the two parameters of Mtrans and Mmax, and it is instructive to relate these to fundamental thermodynamic principles associated with heat of absorption, ΔH, when water uptake occurs in a polymer. Following van’t Hoff’s equation [44,45], the effect of temperature, T, on solubility (i.e., mass gain in this case) can be described by the change in enthalpy due to dissolution as
where cs is the concentration at a point of equilibrium/threshold, R is the universal gas constant (=8.3143 J/mol K), and the heat of absorption is assumed to be constant over the temperature range used for moisture uptake experiments. Integrating Equation (8a), we obtain
which can be rewritten as
which is in the form of
where M is the uptake at equilibrium or the threshold level, and A is a temperature-independent constant. Equation (8d) indicates that for an endothermic reaction, uptake due to absorption increases with temperature, while it decreases with temperature in exothermic absorption. ΔH can be determined from the slope of the linear relation between ln(M) and 1/T. Values for the resin and three composites at the thresholds of Mtrans and Mmax are given in Table 4. As can be seen, the heat of absorption is endothermic, which is in line with results of increasing levels of uptake with temperature, and with results determined for experiments conducted earlier by Apicella et al. [46] for Bisphenol A and B polyester samples and their E-glass composites over a range of water immersion between 20 and 90 °C, where the heats of absorption were 3.2 kJ/mol K and 5.98 kJ/mol K for the Bis A resin and its composite and 5.9 kJ/mol K and 10.9 kJ/mol K for the Bis B resin and its composite, respectively. Values at the level of Mtrans, the equilibrium threshold for stage Ι absorption, are lower than those for the maximum uptake for all three composites.
The diffusion coefficient essentially represents the rate of uptake during the initial stage and thus serves as a useful indicator of overall response in Stage I. In all cases, the diffusion coefficients of the composite specimens are higher than those of the unreinforced resin, with the coefficients increasing with both temperature of immersion and fiber volume fraction, indicating a rate-dependent response. The higher diffusion coefficients for the composite are in line with results reported earlier [40,47] and are largely due to fiber–matrix debonding, which creates additional, and faster, paths for moisture uptake and interaction with the bulk resin. It should be emphasized that water absorbed into the composite results not just in plasticization of the resin but also microcavitation-type damage, including deterioration of fiber–matrix bonds and local bonds in the resin network. Both of these are irreversible and result in the formation of cavities that provide further volume for water uptake, i.e., a potential increase in free water content, which can lead to an increase in reactions with the polymer, causing enhanced molecular mobility of the epoxy molecules and disassociation of hydrogen bonds between the molecules of absorbed water and active sites in the epoxy network.
Given the complex interactions at play, especially as moisture uptake levels come close to the transition threshold, Mtrans, it is of interest to assess the hypothetical values of the Fickian diffusion coefficient if Mtrans were actually the level of equilibrium, as seen in short-term response, rather than a transition to the longer-term slower phenomena. In this case, the diffusion coefficient can be determined from the initial slope of the uptake verses √t curve as
where Mf ∞ is the short-term equilibrium level (= Mtrans) and M2 and M1 are uptake levels at times t2 and t1, respectively. Results for Df are shown in Figure 6 in comparison to the values of D using the two-stage model as well as those derived directly on the basis of fiber volume fraction-based modifications of resin characteristics, as in Equation (7b).
As can be seen, all three characteristic measures of diffusion indicate an increase with temperature of immersion. Deff, which is based directly on the resin characteristics, represents the theoretically derived values accounting for the physical presence of fibers and use of edge correction, but does not intrinsically account for moisture uptake effects such as wicking, debonding, and network site–water reactions due to differential cure regimes, as expected, indicating an increase in diffusivity with increase in fiber volume fraction. Fickian diffusion, which assumes a single set of uptake phenomena and a saturation point in the short term, shows some variation with fiber volume fraction due to flow path tortuosity and compaction differences between layers but not the larger interaction with longer-term and relaxation/irreversible deterioration that is captured by the two-stage model, emphasizing the inadequacy of the Fickian diffusion model for carbon-fiber-reinforced polymer matrix composites, as mentioned earlier by Bone et al. [30], and indicating the need to more closely assess the complex and interacting phenomena, even in Stage I of the uptake. A measure of this can be approximated by estimation of permeability, which indicates the ease with which a fluid will flow through the material and can be determined as the product of D and M, following the general method reported in [7,48], using the two thresholds of transition and end of the time period.
Table 5 lists the permeabilities for the composites at the different temperatures of immersion at the two moisture uptake thresholds, from which it can be seen that while the permeability for each composite increases with temperature, the relation across temperatures as a function of fiber volume fraction is more complex and is dependent on phenomena that take place at different stages of uptake. At the transition level, the permeability at a given temperature is lower in the two-layered composites than in the single-layered composite, as would be expected with an increase in fiber volume fraction. However, the permeability for the lower-weight fabric is lower than that with the higher-weight fabric at the two lower temperatures, due to greater integrity of the interlaminar region between plies in this set. At the highest temperature, however, the fiber volume fraction effect, gained through intralaminar intermingling, dominates. This is repeated at the Mmax threshold, indicating that the effects are from Stage I phenomena rather than Stage II and are due to damage at the fiber–matrix interphase level and due to free, rather than bound, water.
Since diffusion is a thermally activated process, a measure of the differences in phenomena can also be assessed through the use of an Arrhenius-type relationship for the determination of activation energy, Ea, that must be overcome for moisture uptake [49]:
where D0 is a temperature-independent constant, R is the universal gas constant. and T is the temperature of immersion on the Kelvin scale. Plotting ln(D) v/s (1/T) values of activation energies can be determined to be 71.02, 63.73, 76.78, and 69.06 kJ/mol K for the neat resin, single-layered, and two-layered composites, respectively, indicating fairly close levels for the materials, with the lowest being for the single-layer composite. In general, the composites show a lower level of required activation energy due to the propensity for damage at the fiber–matrix interface level, which results in wicking and capillary action. The higher level for the 300-2 composite is related to the increased compression between fabric layers leading to increased tortuosity, as well as due to cure progression and local inhomogeneity, as is discussed in the next section.
While the values of relaxation/deterioration coefficient determined following Equation (7c), keff, directly from the resin characteristics, decreases with temperature and increases with fiber volume fraction, the experimentally determined second-stage coefficient, k, for the composite, for the most part, increases with temperature, following trends reported earlier [29,31], indicating increased molecular relaxation and damage with temperature of immersion. Given that the second stage is initiated at the threshold of the transition point, Mtrans (see Figure 2), it is of interest to assess the rate of change as a function of the extent of region ΙΙ for the materials under consideration as
where the term represents the extent of the overall uptake, which can be considered as being dominated by Stage ΙΙ mechanisms. The slopes (rate of increase in k, as a function of extent of stage ΙΙ uptake) determined as m = 2.79, 5.05, 4.0, and 3.44 for the resin, 300/1, 300/2, and 600/2 composites, respectively, show a decrease with increasing fiber volume fraction, with all being greater than that of the neat resin samples, indicating the important role played by the presence of fibers in overall deterioration and relaxation in Stage ΙΙ. The results further emphasize that water content has a similar effect to temperature on physical aging but with vastly different kinetics, which is in line with results postulated earlier for unreinforced epoxies [50]. Arnold et al. [33] used a technique of removing long-term mass uptake and initial slow uptake to determine the hypothetical Fickian behavior of carbon/epoxy composites exposed to conditions of immersion and humidity. Using a similar technique, the response in Stage II uptake can be isolated to determine an effective coefficient of uptake in this stage. For the purposes of this assessment, we differentiate this characteristic from a diffusion coefficient since it is in the relaxation/deterioration regime. In this case, the coefficient is determined between the uptake level of Mtrans and Mmax (i.e., Mf∞ is Mmax-Mtrans in order to only consider Stage II response), and has to be considered in that vein as being a characteristic enabling assessment of relative behavior/rate of response, with details shown in Figure 7.
As can be seen, the apparent Stage II coefficient decreases with increasing temperature, which can be related to increased cure progression and fiber–matrix deterioration, resulting in less potential relaxation/creep type mechanisms at the higher temperatures. It is also of interest that the coefficient increases with fiber volume fraction, which is in line with results reported by Papanicolaou et al. [51] using a hybrid viscoelastic interphase model to explain the change in interphase thickness with time and fiber loading. As the bulk resin between fibers and the fiber–matrix interphase region is affected by moisture uptake, the relaxation increases, as determined directly through slope of the uptake curve, as discussed above.
3.2. Characterization of Glass Transition Temperature (Tg)
Moisture uptake is known to result in plasticization and reduction in the glass transition temperature through an increase in macromolecular mobility and weakening of hydrogen bonds in the network. The accurate determination, and prediction, of glass transition temperature is critical since it serves as a threshold for materials use in design, and in setting operational limits. It should be noted that in the case of epoxies and their composites cured under ambient and moderate temperature conditions, as is seen often in civil infrastructure rehabilitation and in naval/offshore repair, the degree of cure attained is less than 100%, resulting in phases of partially reacted material within a more highly crosslinked network. These areas not only continue to cure over time but can also be affected by exposure to moisture, with cure progression being initially accelerated by moisture [42,43] in conjunction with deteriorative phenomena, such as moisture-induced plasticization, hydrolysis, saponification, fiber–matrix debonding, and matrix microcavitation/microcracking, making it difficult to isolate effects. For the purposes of the current investigation, the Tg was determined from the peak of the loss tangent curve, since this measure is independent of specimen dimensions and hence represents a material characteristic not affected by test setup [52]. The Tg for the 300/1, 300/2, and 600/2 composites was determined as 103.8, 97.1, and 96.5 °C, respectively. Figure 8a–c show the percentage change in Tg as a function of moisture content for the three composite specimens at 23, 37.8, and 60 °C, from which it can be seen that response largely follows a two-stage process of an initial rapid decrease in Tg followed by a very slow and almost asymptotic regime at higher uptake levels, corresponding to longer periods of immersion. The presence of an asymptotic regime was noted earlier [8,9] through studies on epoxies, wherein the Tg initially decreased with time of hygrothermal aging and then approached an asymptotic value with minor oscillations, with the response being attributed to the effects of secondary crosslinking due to interactions of type ΙΙ bound water with hydrophilic groups such as hydroxyls and amines. It should be noted that Tg depends on hygrothermal history and water–network interactions rather than solely on the presence of moisture. As pointed out earlier by Zhou and Lucas [6], type Ι bound water disrupts interchain van der Waals forces and hydrogen bonds, resulting in increased chain mobility and decreasing the glass transition temperature, whereas type ΙΙ water increases the Tg through the formation of a secondary crosslink network. This interaction and competition in effects results in crosslink density approaching an asymptotic value over time and is hypothesized herein to result in the Tg approaching asymptotic values over extended periods of hygrothermal aging. Since DMTA testing was conducted only periodically with increasing intervals, it is not possible to accurately predict the threshold for the initiation of the slow change, or asymptotic nature, in the current study. However, the trends can clearly be seen in Figure 8, and further details are provided in Table 6. As can be seen from Figure 8, the decrease can be described as a three-stage regime, with an initial rapid drop transitioning to a slower decrease, leading to an asymptotic level with some oscillation. The trend of an initial decrease followed by an increase and then a decrease to an asymptote shown by specimens immersed in water at 23 °C relates to the progression of posture, as described through an earlier investigation on a similar system [31]. It can also be noted that at the higher temperatures of immersion, the final state of the two-layered specimens is similar and distinct from that of the single-layered specimens, which is due to the greater resin-rich surfaces in the single-layered specimens as compared to the interlaminar region in the two-layered specimens.
It is of interest to compare the levels of decrease in Tg of the neat resin with those of the composites to assess the effects of the presence of fibers and inter- and intralaminar regions between layers and the consequent fiber- and interphase-related phenomena. Xian and Karbhari [35] reported drops of 23.9%, 15.2%, and 18.5% for the resin after immersion in water at the three temperatures of 23, 37.8, and 60 °C, respectively, for two years. At similar periods of time, the drop in the 300/1, 300/2, and 600/2 composites was 18.2%, 21.1%, and 24.6% after immersion in water at 23 °C, 15.9%, 16.8%, and 18.7% after immersion in water at 37.8 °C, and 18.1%, 22.3%, and 23.9% after immersion in water at 60 °C. The trend of the lowest drop being at the intermediate temperature of 37.8 °C is shown by the resin and all three composites, and is thought to be linked to greater postcure that occurs at this temperature. This is also shown to a lesser extent at the highest temperature of immersion, in which the decrease is less than that due to immersion at 23 °C.
It is noted that theoretical models for the prediction of Tg based on moisture content, such as the Gordon–Taylor model [53], the Kelley–Bueche model [54], and the DiBenedetto equation [55], all show a decreasing trend for Tg with increasing moisture content but fail to predict the asymptotic regime. This is due to the complicated and competing macro- and microphenomena at play, including those related to changes in the polymer network, viscoelastic response, and the interplay between free and bound water.
As can be seen in Table 6, the highest drop across all composites is at the highest temperature of immersion, with the reduction increasing with fiber volume fraction at each temperature of immersion, in line with effects expected due to fiber clusters, which can limit the extent of interphase percolation. As measured at the end of the 60-month period, the drop in glass transition temperature per percent of moisture uptake decreases with increasing temperature of immersion, with the maximum being 6.95 °C/wt % of water for the 300/2 composite at the lowest temperature of immersion and 4.65 °C/wt % of water at the highest temperature of immersion. However, given that the decrease approaches asymptotic levels over extended periods of immersion time, it is perhaps more instructive to determine the relation with moisture content at the threshold itself. For purposes of comparison, Figure 9 shows results for the drop per percent moisture uptake for the initial period, the 44-month period, which represents the beginning of the asymptote, and the 60-month level, which represents the end of the period of immersion.
It should be noted that in some cases, especially for the two-layered composites, an asymptotic regime is attained even prior to the 44-month level. The levels at both these periods are significantly lower than the decreases of 15 °C and 20 °C per percent of moisture uptake reported elsewhere [12,56,57]. It should be noted that Tg indicates a level of structural change between the glassy and rubbery regimes. Diffusion is affected by a combination of unoccupied molecular volume of the resin, free volume, and the polymer water affinity due to hydrophilic centers of the network. Increase in crosslink density results in decreased rates, and levels of moisture uptake and regions of high density can hinder further diffusion due, at least in part, to the inaccessibility of hydrogen bonding sites [18,58]; thus, it is expected that the attainment of a threshold in ambient-cured materials in which cure progression is initially accelerated by immersion and temperature will coincide with changes in the extent and rate of crosslink progression and transition in the two stages of uptake, as described in the diffusion model used in this investigation.
3.3. Characterization of Flexural Strength
Given that the study includes both single-layered and two-layered composites, it is important to be able to test for residual characteristics in a manner that would encompass the interfacial reactions between the resin-rich surfaces on either side of the single reinforcement layer in the 300/1 specimens as well as the interlaminar and intralaminar phenomenon in the two-layered (300/2 and 600/2) specimens. It must be kept in mind that the use of the heavier fabric in the 600/2 case would result in greater fiber and bundle intermingling, resulting in an increased intralaminar component. While the assessment of mechanisms between these is not the focus of this investigation, the use of a single test to assess performance across those three types was critical; hence, the three-point flexure test incorporating both shear and bending components was selected. It should be noted that tensile tests, while widely reported in the literature, are not ideal to assess resin- and interface-dominated effects such as would be expected through immersion for periods of time at different temperatures in water, since strength and modulus are fiber-dominated characteristics for unidirectional composites. The strength of the composite in three-point flexure is determined as follows:
where P is the applied force, L is the support span, and b and h are the width and thickness of the specimen. Results for flexure testing for the three composite materials as a function of time and temperature of immersion are shown in Figure 10a–c. Flexural strength retention can be described in terms of three stages: the first stage, which has a rapid decrease in strength, followed by a more gradual decrease over a longer second stage, and a final stage, where the drop over time is extremely slow and the performance appears to attain a near-asymptotic regime. As can be seen from Figure 10 and Table 7, overall reduction over the 60-month period of immersion ranges from a low of 19.87% for the single-layered composite, 300/1, after immersion at 23 °C, to a maximum of 49.54% for the two-layered composite with the heavier fabric, 600/2, after immersion at 60 °C. It should be noted that the greater intralaminar phenomena in the heavier fabric leads to greater decreases when fiber–matrix interphases are deteriorated. Overall reduction increases with temperature of immersion and fiber volume fraction, with the latter effect being due to the increased surfaces for debonding, the initial drop, which is over a period of 2 months for the 300/1 and 300/2 composites and 4 months for the 600/2 composites, is related to effects of plasticization, noted earlier in terms of effect on glass transition temperature, and reported earlier [59,60]. The drop in glass transition temperature is less than that in flexural strength over the total period of study, suggesting that the water absorbed into the composite and found within the fiber–matrix interphasial region and accumulated in cracks and voids including within the debonded areas does not have as great an effect on glass transition as it does on the weakening of bonds, and thereby on flexural strength, as noted earlier by Bone et al. [30].
The two-layered composites also show a greater level of reduction than the single-layered composite, highlighting the effect of moisture uptake on the interlaminar region formed between adjacent layers of fabric, which, as noted earlier, results in a greater decrease in the glass transition temperature as well.
It is also of interest to note that the composites with the heavier fabric showed the greatest drop in both glass transition temperature and flexural strength, indicating a level of correlation between the two characteristics, which can be further compared in Figure 11.
As can be seen for both characteristics, the overall response can be considered to fall into three regions. In the first, which is dominated by rapid moisture uptake by diffusion, there is a rapid drop in both characteristics, initiated by plasticization. The second region, which is the transition between the diffusion-dominated and longer-term relaxation-dominated regimes, is characterized by water bound at the interface and free water accumulating in cracks at the interlaminar level, resulting in a slow but steady reduction in both Tg and flexural strength. Changes in this region are dominated by interphasial phenomena, as reported earlier by Guloglu et al. [61]. The third stage is one where the glass transition temperature reaches an asymptotic level and further reduction in flexural strength is extremely slow, with the regime being one where diffusivity has a much-reduced effect as water transport is not rate-limiting as suggested earlier by Bone et al. [30]. The identification of three zones that are common to both the changes in glass transition temperature and flexural strength suggests that a more comprehensive model for performance prediction as a function of long-term moisture exposure (and uptake) could be developed through separate consideration of the three regions and consideration of the different effects of free and bound water and level of interphasial (including interlaminar) damage.
4. Summary and Conclusions
The moisture uptake response of wet layup ambient cure processed carbon epoxy composites used in the rehabilitation of civil infrastructure and in naval/offshore structures is shown to be described by a two-stage model incorporating a diffusion-dominated regime, a longer-term regime wherein the primary considerations are those of material relaxation/deterioration and water transport is not rate-limiting, and a transition regime between them. Moisture uptake in the composites measured over extended periods of time exceeding five years after immersion in water at 23 and 37.8 °C is lower than that in the unreinforced resin but is greater at the highest temperature of immersion of 60 °C, suggesting that mechanisms change with temperature and that this needs to be further considered in the design of accelerated aging tests.
Glass transition temperature (Tg) is noted to initially decrease with increasing moisture content, with an initial stage exhibiting a rapid decrease in Tg, followed by a slower regime with some oscillation including increase as a result of postcure, and then an asymptotic regime at higher uptake levels. The greatest decrease in Tg occurs at the highest immersion temperature, and the decline becomes more apparent with an increase in the fiber volume fraction at each immersion temperature, which can be attributed to the effects of secondary crosslinking due to interactions of bound water with hydrophilic groups. In a similar fashion, but at significantly higher levels of overall deterioration, changes in flexural strength behavior of the composites is also described by three distinct stages: a rapid decline in strength due to diffusion-driven moisture uptake and plasticization, a transition to a relaxation-dominated regime leading to gradual decreases in both glass transition temperature and flexural strength, and, finally, Tg approaching an asymptotic level with extremely gradual reduction in flexural strength. Additionally, composites with a higher fabric weight exhibited the most significant decline in both Tg and flexural strength, indicating a noteworthy correlation between these two characteristics due to increased deterioration at the interphasial and intralaminar regions. The correlation of regimes and levels of deterioration provides a basis for continued research into correlating increases in moisture content with degradation at the interface levels and through interaction between absorbed water molecules and the polymer network, since both flexural performance and glass transition temperature are affected in similar fashion. The development of an integrated model based on mechanistic principles at the micro- and macromechanical levels provides a potential means of not just more accurate predictions of long-term performance but also of better design parameters for ensuring efficient and durable design of composite systems. Further, the deviation in response between the two lower temperatures of immersion and the highest, albeit still below the wet glass transition, temperature provides caution for the use of higher-temperature exposure as a means of shortening periods of evaluation through accelerated testing. In order to develop a comprehensive model for prediction of long-term durability based on constituent materials and exposure conditions, further research into changes at the level of fiber–matrix bond degradation that results in wicking as well as changes in resin network and morphology is needed in addition to a more complete assessment of moisture-related plasticization and postcure phenomena which affect both uptake and glass transition temperature. The incorporation of these changes into a single model is the focus of ongoing research.
Author Contributions
B.H.: Methodology, formal analysis, writing, data curation, and checking. V.M.K.: Conceptualization, methodology, initial analysis, and final writing. All authors have read and agreed to the published version of the manuscript.
Funding
This research received no external funding.
Data Availability Statement
The data that support the findings of this study are available on request from the corresponding author.
Acknowledgments
The authors gratefully acknowledge the use of data generated through previous projects supported by the Civil Engineering Research Foundation and the California Department of Transportation, for which the second author was the principal investigator.
Conflicts of Interest
The authors declare that they have no known competing financial interest or personal relationships that might influence the work reported in the paper.
References
- Spelter, A.; Bergmann, S.; Bielak, J.; Hegger, J. Long-term durability of carbon reinforced concrete. An overview and experimental investigation. Appl. Sci. 2019, 9, 1651–1665. [Google Scholar] [CrossRef]
- Karbhari, V.M.; Abanilla, M.A. Design factors, reliability, and durability prediction of wet layup carbon/epoxy used in external strengthening. Compos. B 2007, 38, 10–23. [Google Scholar] [CrossRef]
- Abanilla, M.A.; Karbhari, V.M.; Li, Y. Interlaminar and intralaminar durability characterization of wet layup carbon/epoxy used in external strengthening. Compos. B 2006, 37, 650–661. [Google Scholar] [CrossRef]
- Abanilla, M.A.; Li, Y.; Karbhari, V.M. Durability characterization of wet layup graphite/epoxy composites used in external strengthening. Compos. B 2005, 37, 200–212. [Google Scholar] [CrossRef]
- Adamson, M.J. Thermal expansion and swelling of cured epoxy resin used in graphite/epoxy composite materials. J. Mater. Sci. 1980, 15, 1736–1745. [Google Scholar] [CrossRef]
- Zhou, J.; Lucas, J.P. Hygrothermal effects of epoxy resin. Part I: The nature of water in epoxy. Polymer 1999, 40, 5505–5512. [Google Scholar] [CrossRef]
- Nogueira, P.; Ramirez, C.; Torres, A.; Abad, M.J.; Cano, J.; Lopez, J.; Lopez-Bueno, I.; Barral, L. Effect of water sorption on the structure and mechanical properties of an epoxy system. J. Appl. Polym. Sci. 2001, 80, 71–80. [Google Scholar] [CrossRef]
- Xiao, G.Z.; Shanahan, M.E.R. Swelling of DGEBA/DDA epoxy resin during hygrothermal aging. Polymer 1998, 39, 3253–3260. [Google Scholar] [CrossRef]
- De’Nève, B.; Shanahan, M.E.R. Water absorption by an epoxy resin and its effect on the mechanical properties and infra-red spectra. Polymer 1993, 34, 5099–5105. [Google Scholar] [CrossRef]
- Hahn, H.T. Residual stresses in polymer matrix composite laminates. J. Compos. Mater. 1976, 10, 266–278. [Google Scholar] [CrossRef]
- Xiao, G.Z.; Delmar, M.; Shanahan, M.E.R. Irreversible interactions between water and DGEBA/DDA epoxy resin during hygrothermal aging. J. Appl. Polym. Sci. 1977, 65, 449–458. [Google Scholar] [CrossRef]
- Chateauminois, A.; Chabert, B.; Soulier, J.P.; Vincent, L. Dynamic-mechanical analysis of epoxy composites plasticized by water—Artifact and reality. Polym. Compos. 1995, 16, 288–296. [Google Scholar] [CrossRef]
- Atadero, R.; Lee, L.; Karbhari, V.M. Consideration of material variability in reliability analysis of FRP strengthened bridge decks. Comp Strs. 2005, 70, 430–443. [Google Scholar] [CrossRef]
- Mazor, A.; Broutman, L.J.; Eckstein, B.H. Effect of long-term water exposure on the properties of carbon and graphite fiber reinforced epoxies. Polym. Eng. Sci. 1978, 18, 341–349. [Google Scholar] [CrossRef]
- Costa, M.L.; de Almeida, S.F.M.; Rezende, M.C. Hygrothermal effects on dynamic mechanical analysis and fracture behavior of polymeric composites. Mater. Res. 2005, 8, 335–340. [Google Scholar] [CrossRef]
- Apicella, A.; Nicolais, L.; de Cataldis, C. Characterization of the morphological fine structure of commercial thermosetting resins through hygrothermal exposure. Adv. Polym. Sci. 1985, 66, 189–207. [Google Scholar]
- Apicella, A.; Tessieri, R.; de Cataldis, C. Sorption modes of water in glassy epoxies. J. Membr. Sci. 1984, 18, 211–225. [Google Scholar] [CrossRef]
- Moy, P.; Karasz, F.E. Epoxy-water interactions. Polym. Eng. Sci. 1980, 20, 315–319. [Google Scholar] [CrossRef]
- Pethrick, R.A.; Hollins, E.A.; McEwan, L.; Pollock, A.; Hayward, D.; Johncock, P. Effect of cure temperature on the structure and water absorption of epoxy/amine thermosets. Polym. Int. 1996, 39, 275–288. [Google Scholar] [CrossRef]
- Crank, J. The Mathematics of Diffusion; Cambridge University Press: New York, NY, USA, 1975. [Google Scholar]
- Shen, C.-H.; Springer, G.S. Moisture absorption and desorption of composite materials. J. Compos. Mater. 1976, 10, 2–20. [Google Scholar] [CrossRef]
- Boll, D.J.; Bascom, W.D.; Motiee, B. Moisture absorption by structural epoxy-matrix carbon-fiber composites. Compos. Sci. Technol. 1985, 24, 253–273. [Google Scholar] [CrossRef]
- Shirrell, C.D. Diffusion of water vapor in graphite/epoxy composites. In ASTM STP 658, Advanced Composite Materials—Environmental Effects; American Society for Testing and Materials: Philadelphia, PA, USA, 1977; pp. 21–42. [Google Scholar]
- Neumann, S.; Marom, G. Stress dependence of the coefficient of moisture diffusion in composite materials. Polym. Compos. 1985, 6, 9–12. [Google Scholar] [CrossRef]
- Berens, A.R.; Hopfenberg, H.B. Diffusion and relaxation in glassy polymer powders: 2 Separation of diffusion and relaxation parameters. Polymer 1978, 19, 489–496. [Google Scholar] [CrossRef]
- Bagley, E.; Long, F.A. Two-stage sorption and desorption of organic vapors in cellulose acetate. J. Am. Chem. Soc. 1955, 77, 2172–2182. [Google Scholar] [CrossRef]
- Peppas, N.A.; Sahlin, J.J. A simple equation for the description of solute release. III. Coupling of diffusion and relaxation. Int. J. Pharm. 1989, 57, 169–172. [Google Scholar] [CrossRef]
- Carter, H.G.; Kibler, K.G. Langmuir-type model for anomalous moisture diffusion in composite resins. J. Compos. Mater. 1978, 12, 118–131. [Google Scholar] [CrossRef]
- Bao, L.-R.; Yee, A.F.; Lee, C.Y.-C. Moisture absorption and hygrothermal aging in a bismaleimide resin. Polymer 2001, 42, 7327–7333. [Google Scholar] [CrossRef]
- Bone, J.E.; Sims, G.D.; Maxwell, A.S.; Frenz, S.; Ogin, S.L.; Foreman, C.; Dorey, R.A. On the relationship between moisture uptake and mechanical property changes in a carbon fibre/epoxy composite. J. Compos. Mater. 2022, 56, 2189–2199. [Google Scholar] [CrossRef]
- Karbhari, V.M. Long-term hydrothermal aging of carbon-epoxy materials for rehabilitation of civil infrastructure. Compos. A 2022, 153, 106705. [Google Scholar] [CrossRef]
- Capiel, G.; Uicich, J.; Fasce, D.; Montemartini, P.E. Diffusion and hydrolysis effects during water aging on an epoxy-anhydride system. Polym. Degrad. Stab. 2018, 153, 165–171. [Google Scholar] [CrossRef]
- Arnold, J.C.; Alston, S.M.; Korkees, F. An assessment of methods to determine the directional moisture diffusion coefficients of composite materials. Compos. A 2013, 55, 120–128. [Google Scholar] [CrossRef]
- Scott, P.; Lees, J.M. Water, saltwater and alkaline solution uptake in epoxy thin films. J. Appl. Polym. Sci. 2013, 130, 1898–1908. [Google Scholar] [CrossRef]
- Xian, G.; Karbhari, V.M. Segmental relaxation of water-aged ambient cured epoxy. Polym. Degrad. Stab. 2007, 92, 1650–1659. [Google Scholar]
- Xian, G.; Karbhari, V.M. DMTA based investigation of hygrothermal aging of an epoxy system used in rehabilitation. J. Appl. Polym. Sci. 2007, 104, 1084–1094. [Google Scholar] [CrossRef]
- Karbhari, V.M.; Hong, S.K. Effect of sequential thermal aging and water immersion on moisture kinetics and SBS strength of wet layup carbon epoxy composites. J. Compos. Sci. 2022, 6, 306. [Google Scholar] [CrossRef]
- Starink, M.J.; Starink, L.M.P.; Chambers, A.R. Moisture uptake in monolithic and composite materials: Edge correction for rectanguloid samples. J. Mater. Sci. 2002, 37, 287–294. [Google Scholar] [CrossRef]
- Chaplin, A.; Hamerton, I.; Herman, H.; Meudhar, A.K.; Shaw, S.J. Studying water uptake effects in resins based on cyanate ester/bismaleimide blends. Polymer 2000, 41, 3945–3956. [Google Scholar] [CrossRef]
- Chateauminois, A.; Vincent, L.; Chabert, B.; Soulier, J.P. Study of the interfacial degradation of a glass-epoxy composite during hygrothermal ageing using water diffusion measurements and dynamic mechanical thermal analysis. Polymer 1994, 35, 4766–4774. [Google Scholar]
- McKague, E.L., Jr.; Reynolds, J.D.; Halkias, J.E. Swelling and glass transition relations for epoxy material in humid environments. J. Appl. Polym. Sci. 1978, 22, 1643–1654. [Google Scholar] [CrossRef]
- Ghorbel, I.; Valentin, D. Hydrothermal effects on the physico-chemical properties of pure and glass fiber reinforced polyester and vinylester resins. Polym. Compos. 1993, 14, 324–334. [Google Scholar] [CrossRef]
- Marshall, J.M.; Marshall, G.P.; Pinzelli, R.F. The diffusion of liquids into resins and composites. Polym. Compos. 1982, 3, 131–137. [Google Scholar] [CrossRef]
- Bao, L.-R.; Yee, A.F. Effect of temperature on moisture absorption in a bismaleimide resin and its carbon fiber composite. Polymer 2002, 43, 3987–3997. [Google Scholar]
- Sandler, S.I. Chemical and Engineering Thermodynamics; Wiley: New York, NY, USA, 1999. [Google Scholar]
- Apicella, A.; Migliaresi, C.; Nicolais, L.; Iaccarino, L.; Roccotelli, S. The water ageing of unsaturated polyester-based composites: Influence of resin chemical structure. Composites 1983, 14, 387–392. [Google Scholar] [CrossRef]
- Mijovic, J.; Lin, K.-F. T he effect of hygrothermal fatigue on physical/mechanical properties and morphology of neat epoxy resin and graphite/epoxy composite. J. Appl. Polym. Sci. 1985, 30, 2527–2549. [Google Scholar]
- Mouzakis, D.E.; Kager-Kocsis, J. Effects of gasoline absorption on the tensile impact response of HDPE/SelarTM laminar microlayer composites. J. Appl. Polym. Sci. 1998, 68, 561–569. [Google Scholar]
- Crank, J.; Park, G.S. Diffusion in Polymers; Academic Press: London, UK, 1968. [Google Scholar]
- Zheng, Y.; Priestley, R.D.; McKenna, G.B. Physical aging of an epoxy subsequent to relative humidity jumps through the glass concentration. J. Polym. Sci. B. Polym. Phys. 2004, 42, 2107–2121. [Google Scholar]
- Papanicolaou, G.C.; Portan, D.V.; Kontaxis, L.C. Interrelation between fiber-matrix interphasial phenomena and flexural stress relaxation behavior of a glass fiber-polymer composite. Polymers 2021, 13, 978. [Google Scholar]
- Hagen, R.; Salmén, L.; Lavebratt, H.; Stenberg, B. Comparison of dynamic mechanical measurements and Tg determinations with two different instruments. Polym. Test. 1994, 13, 113–128. [Google Scholar]
- Gordon, M.; Taylor, M.S. Ideal copolymers and the second-order transitions of the synthetic rubbers. I. Non-crystalline copolymers. J. Appl. Chem. 1952, 2, 493–500. [Google Scholar]
- Kelley, F.N.; Bueche, F. Viscosity and glass temperature relations for polymer-diluent systems. J. Polym. Sci. 1961, 50, 549–556. [Google Scholar]
- Pascault, J.P.; Williams, J.J. Glass transition temperature versus conversion relationships for thermosetting polymers. J. Polym. Sci. B Polym. Phys. 1990, 28, 85–95. [Google Scholar] [CrossRef]
- Wright, W.W. The effect of diffusion of water into epoxy resins and their carbon-fibre reinforced composites. Composites 1981, 12, 201–205. [Google Scholar] [CrossRef]
- Barton, J.M.; Greenfield, D.C.L. The Use of dynamic mechanical methods to study the effect of absorbed Water on temperature-dependent properties of an epoxy resin-carbon fibre composite. Br. Polym. J. 1986, 18, 51–56. [Google Scholar]
- Vanlandingham, M.R.; Eduljee, R.F.; Gillespie, J.W., Jr. Moisture diffusion in epoxy systems. J. Appl. Polym. Sci. 1999, 71, 787–798. [Google Scholar] [CrossRef]
- Karbhari, V.M. Dynamic mechanical analysis of the effect of water on E-glass-vinylester composites. J. Reinf. Plast. Compos. 2006, 25, 631–644. [Google Scholar] [CrossRef]
- Tual, N.; Carrer, N.; Davies, P.; Bonnemains, T.; Lolive, E. Characterization of seawater aging effects on mechanical properties of carbon/epoxy composites for tidal turbine blades. Compos. A 2015, 78, 380–389. [Google Scholar] [CrossRef]
- Guloglu, G.E.; Hamidi, Y.K.; Altan, M.C. Moisture absorption of composites with interfacial storage. Compos. A 2020, 134, 105908. [Google Scholar] [CrossRef]
Figure 1.
Test equipment: (a) DMTA, (b) flexure.
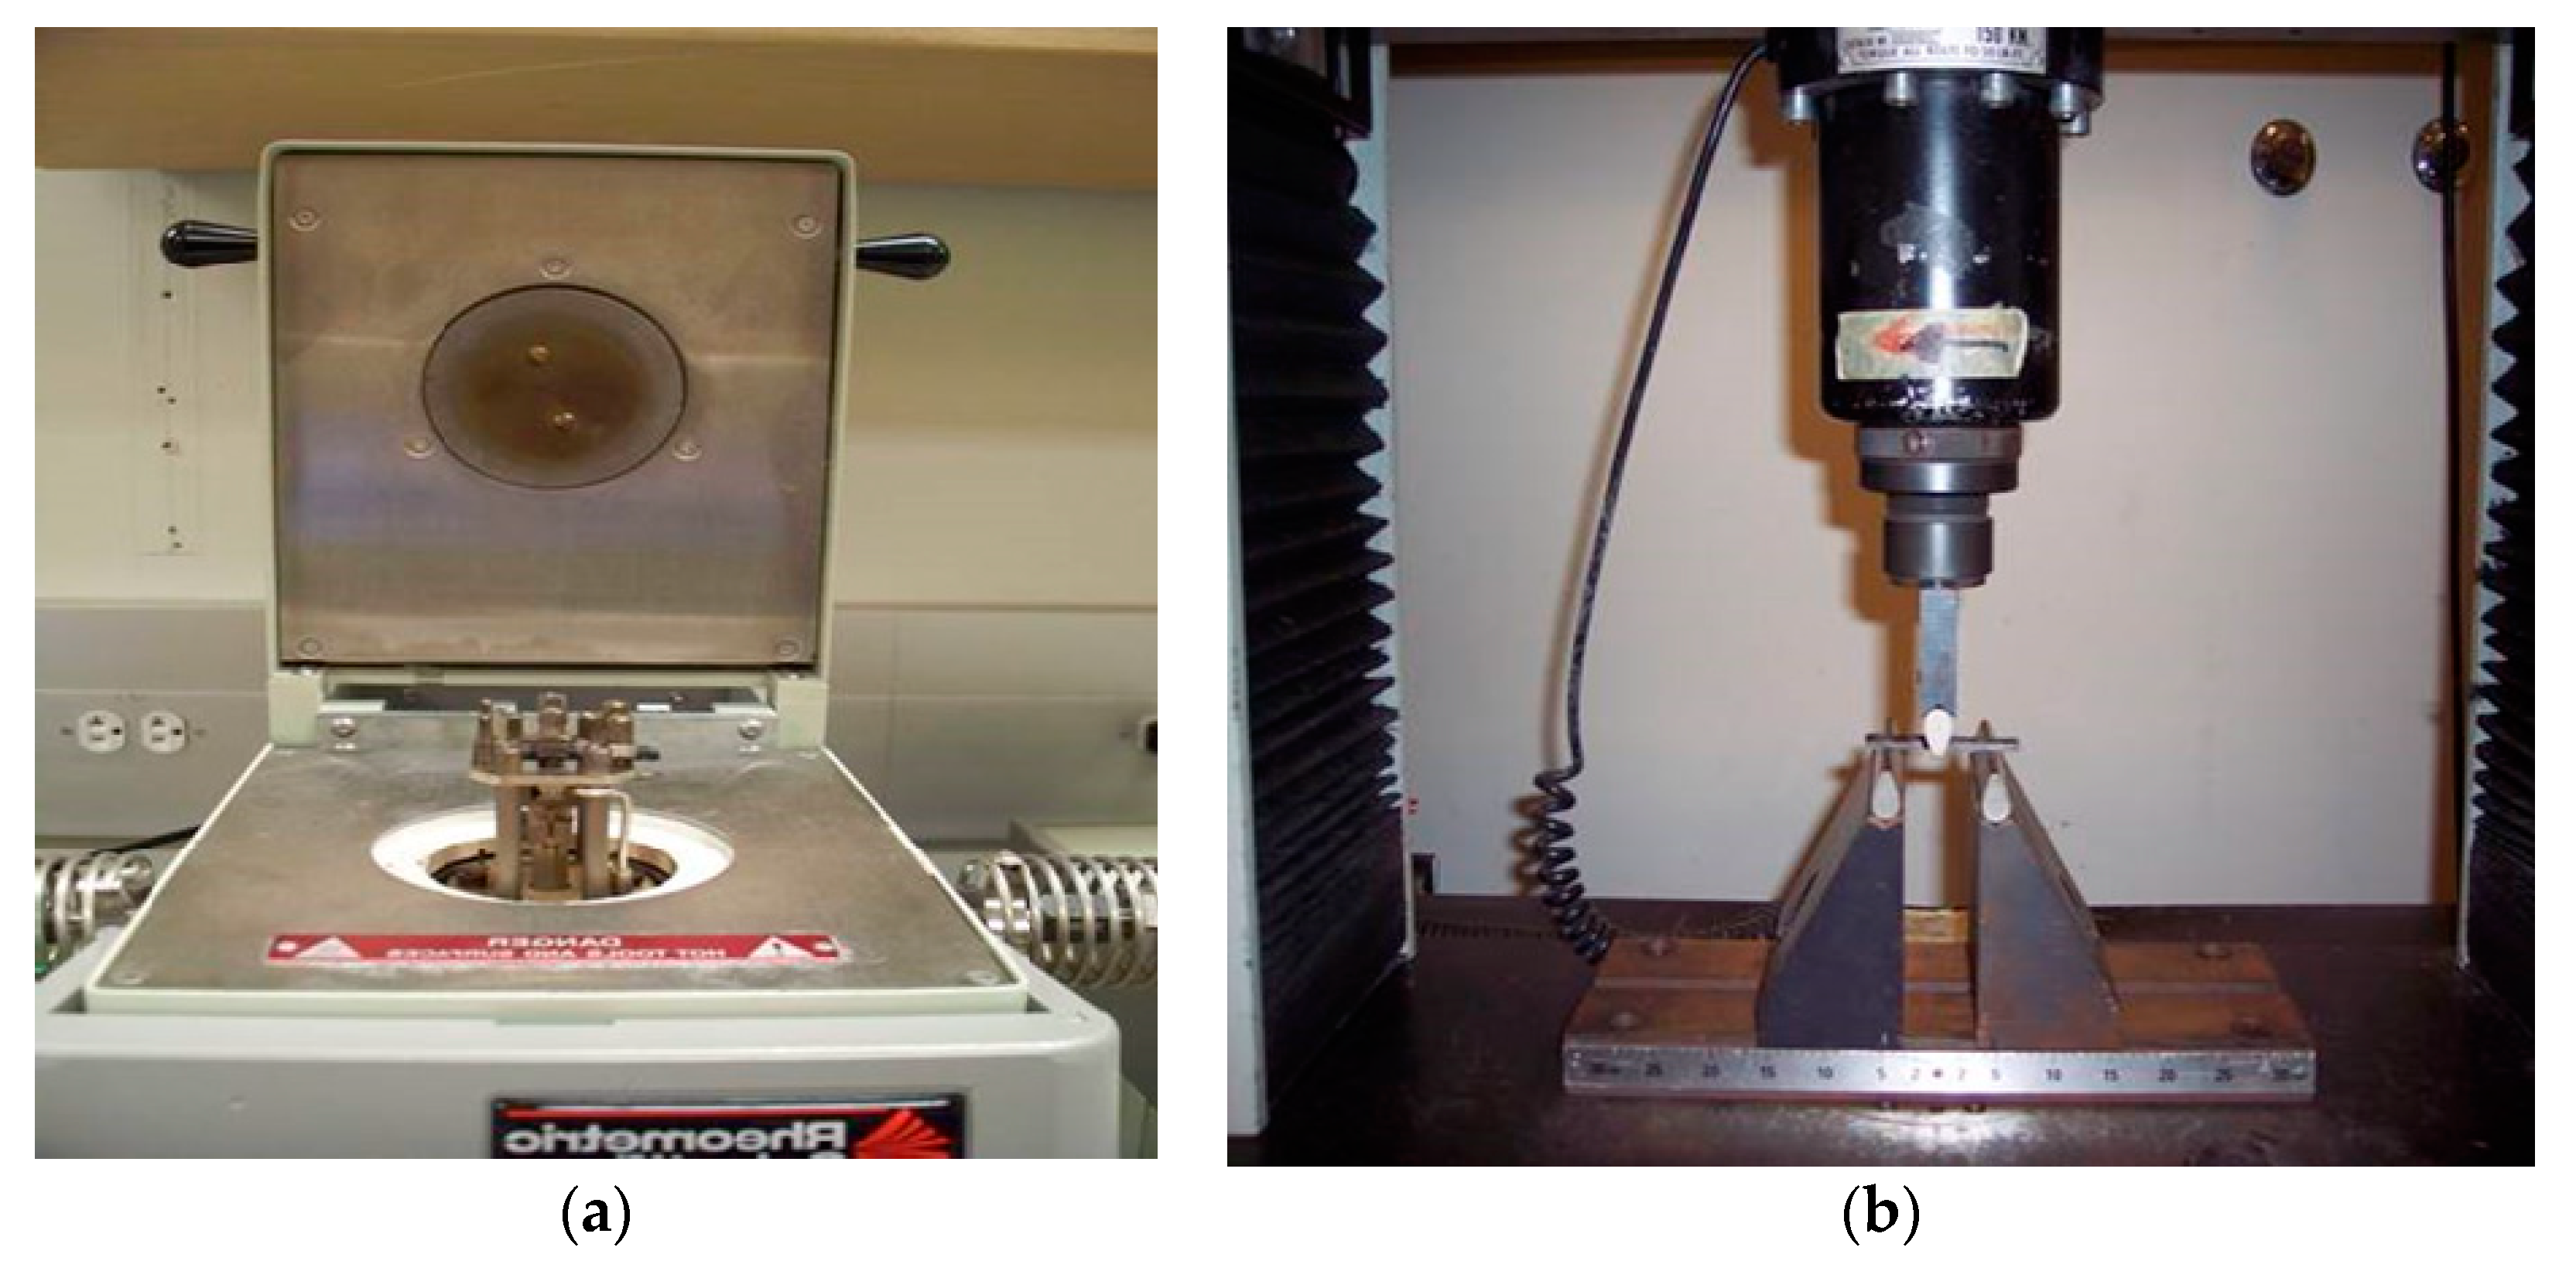
Figure 2.
Schematic of moisture uptake curves and stages following different models.

Figure 3.
Moisture uptake curves for resin specimens. Dashed lines indicate model predictions.
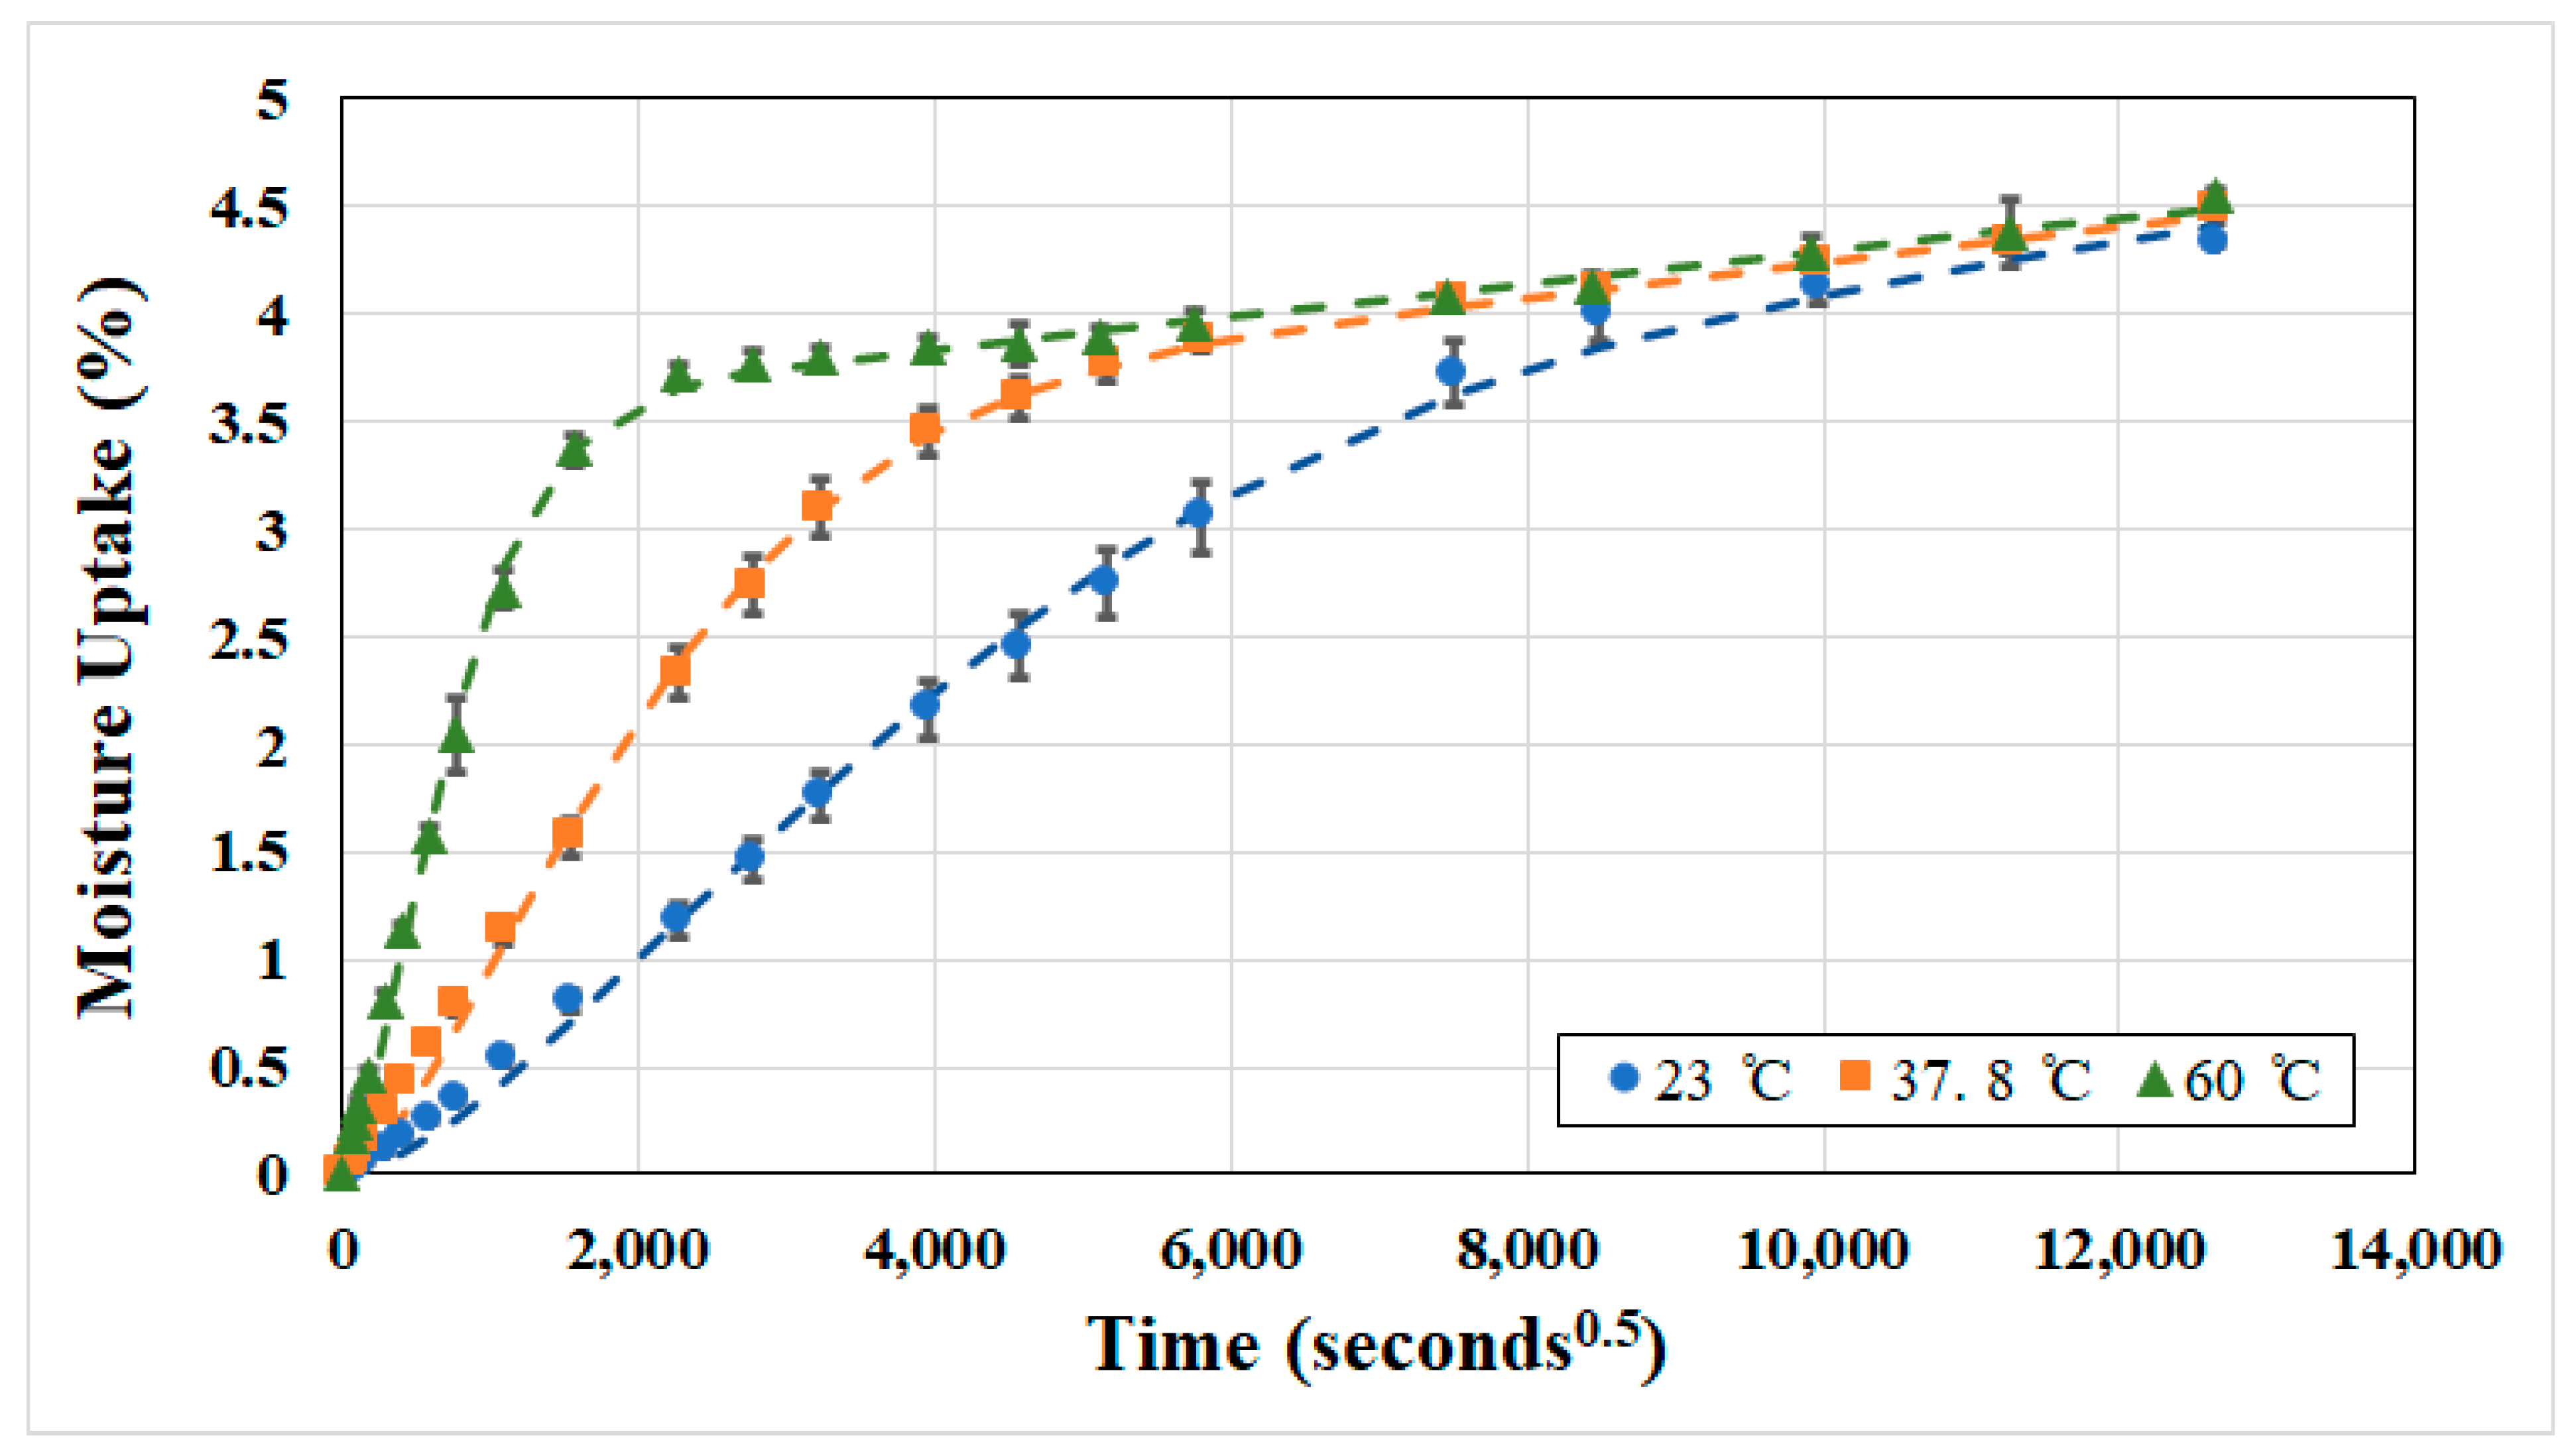
Figure 4.
Comparison of experimental data and model predictions for moisture uptake in composites: (a) 300/1 composite, (b) 300/2 composite, (c) 600/2 composite. Dashed lines indicate model predictions.
Figure 4.
Comparison of experimental data and model predictions for moisture uptake in composites: (a) 300/1 composite, (b) 300/2 composite, (c) 600/2 composite. Dashed lines indicate model predictions.
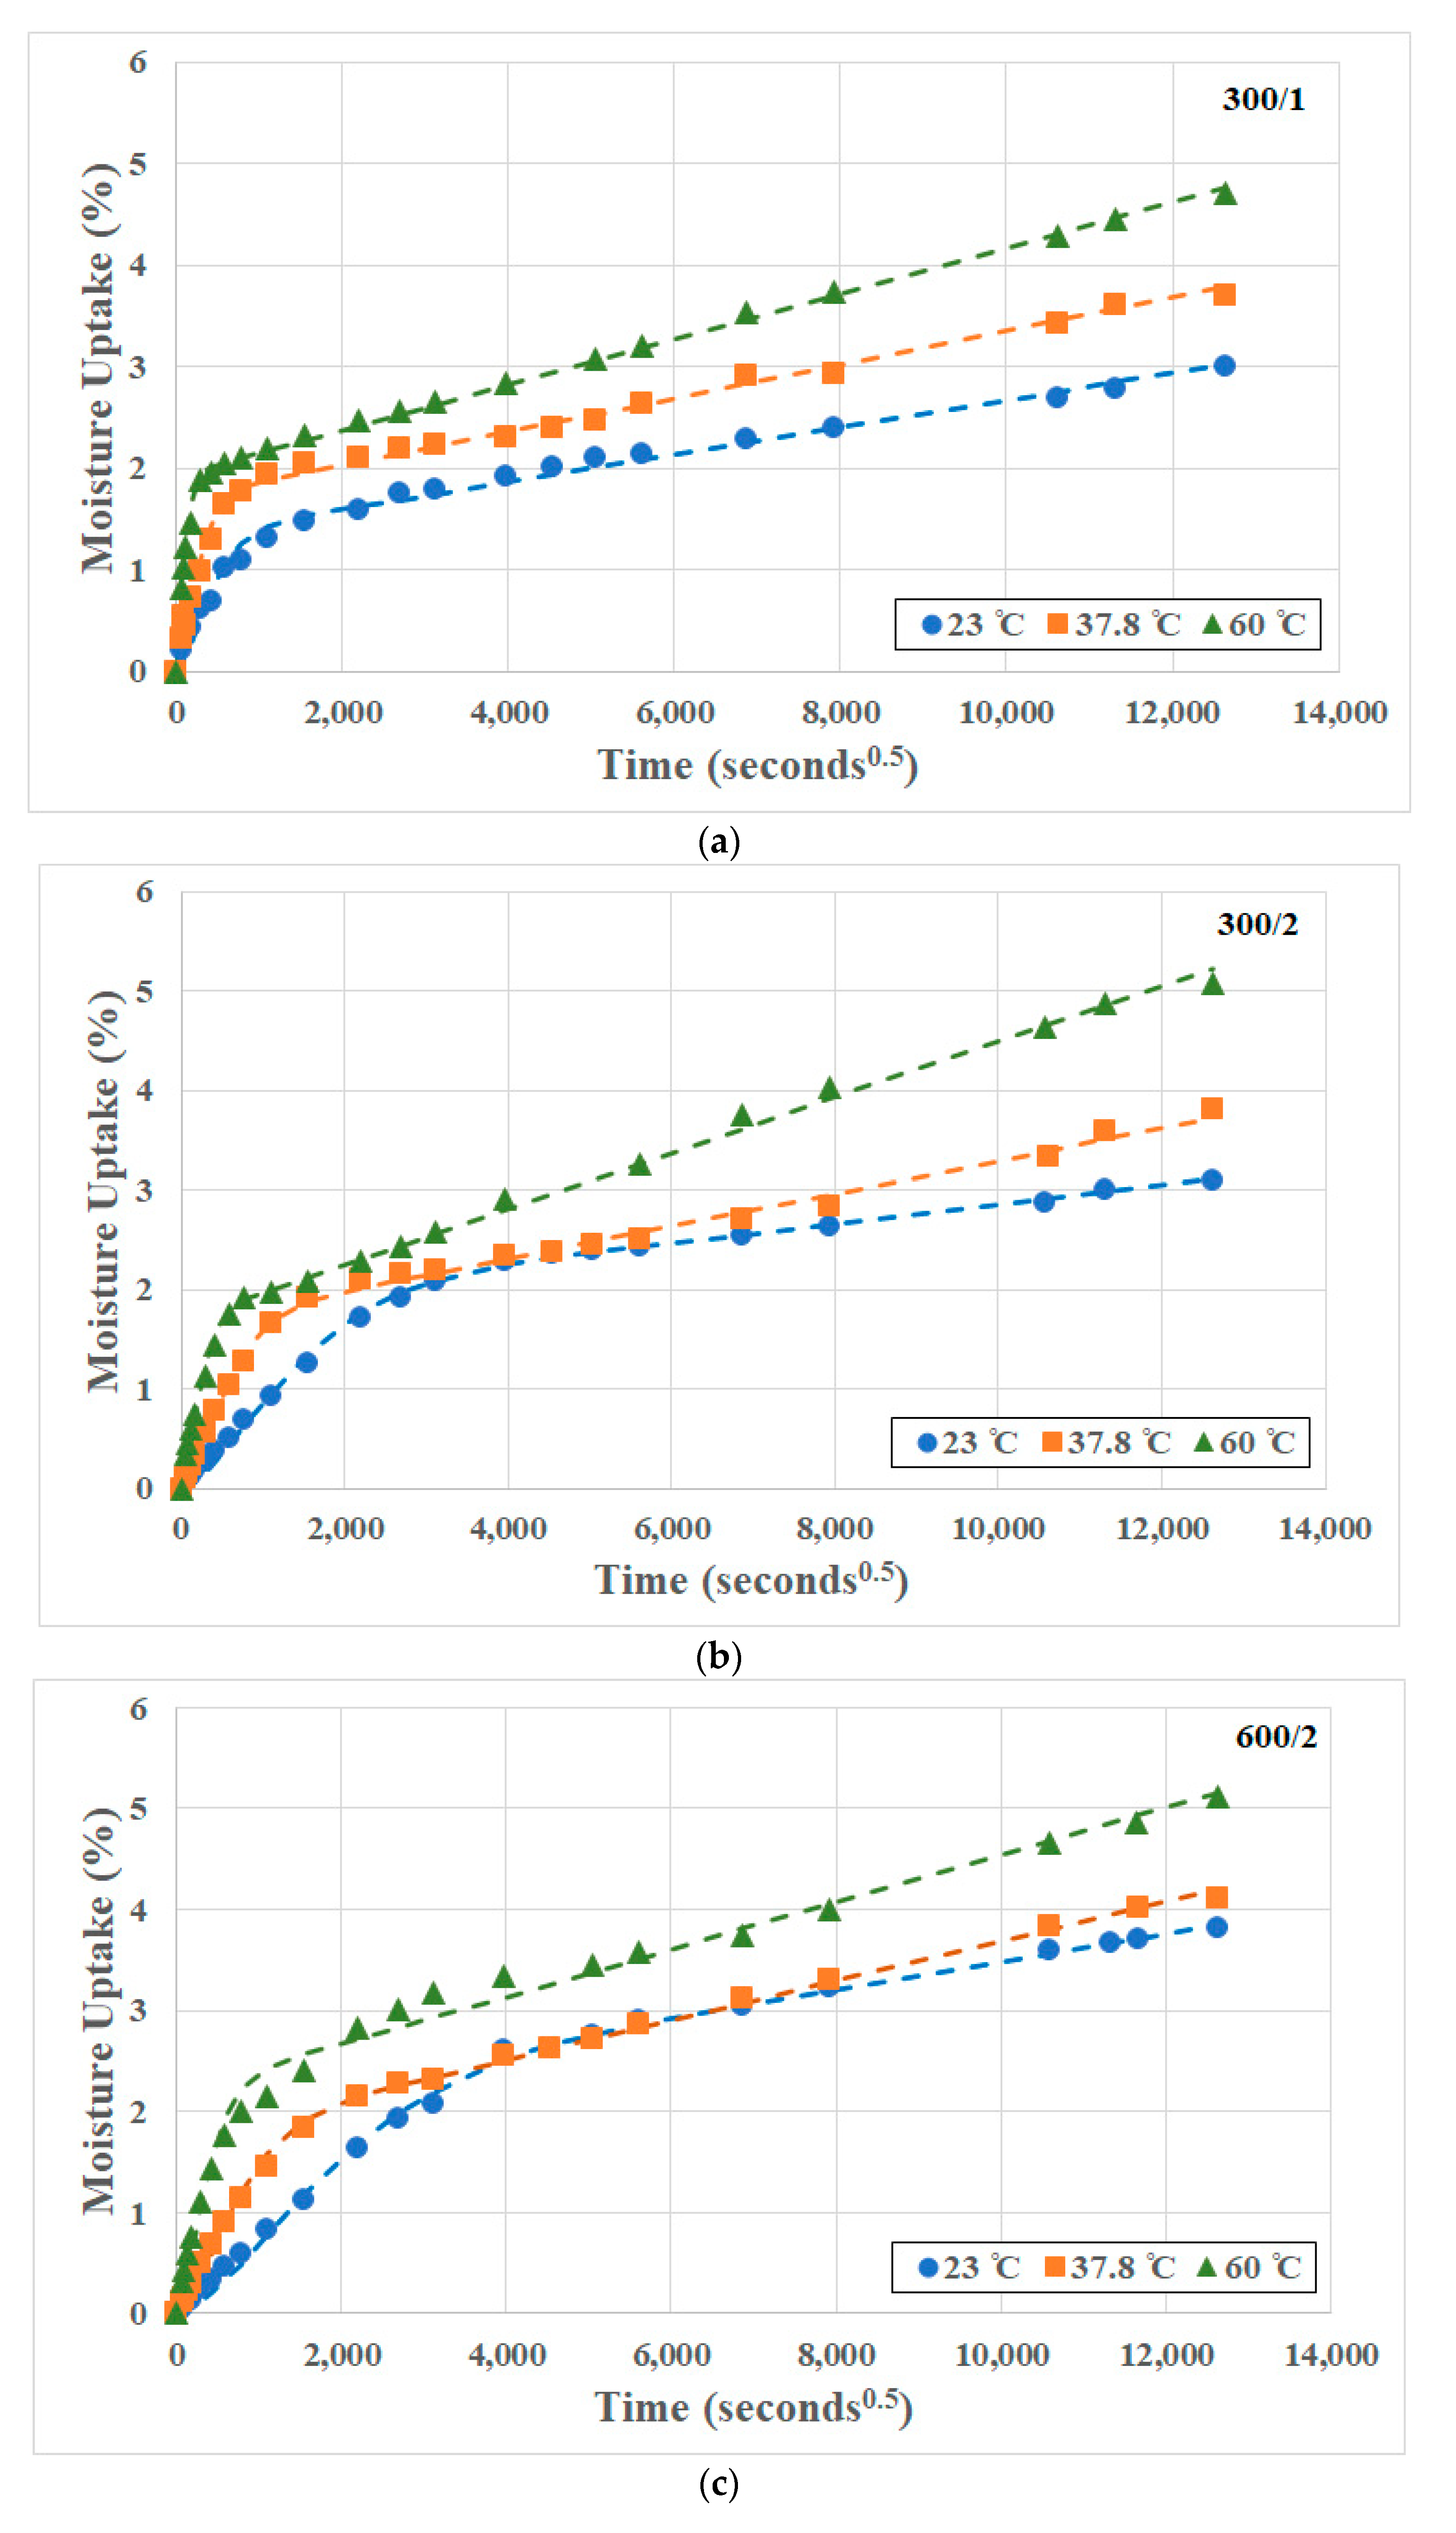
Figure 5.
(a) Time to transition as a function of material type and temperature of immersion. (b) Moisture transition ratio as a function of material type and temperature of immersion.
Figure 5.
(a) Time to transition as a function of material type and temperature of immersion. (b) Moisture transition ratio as a function of material type and temperature of immersion.
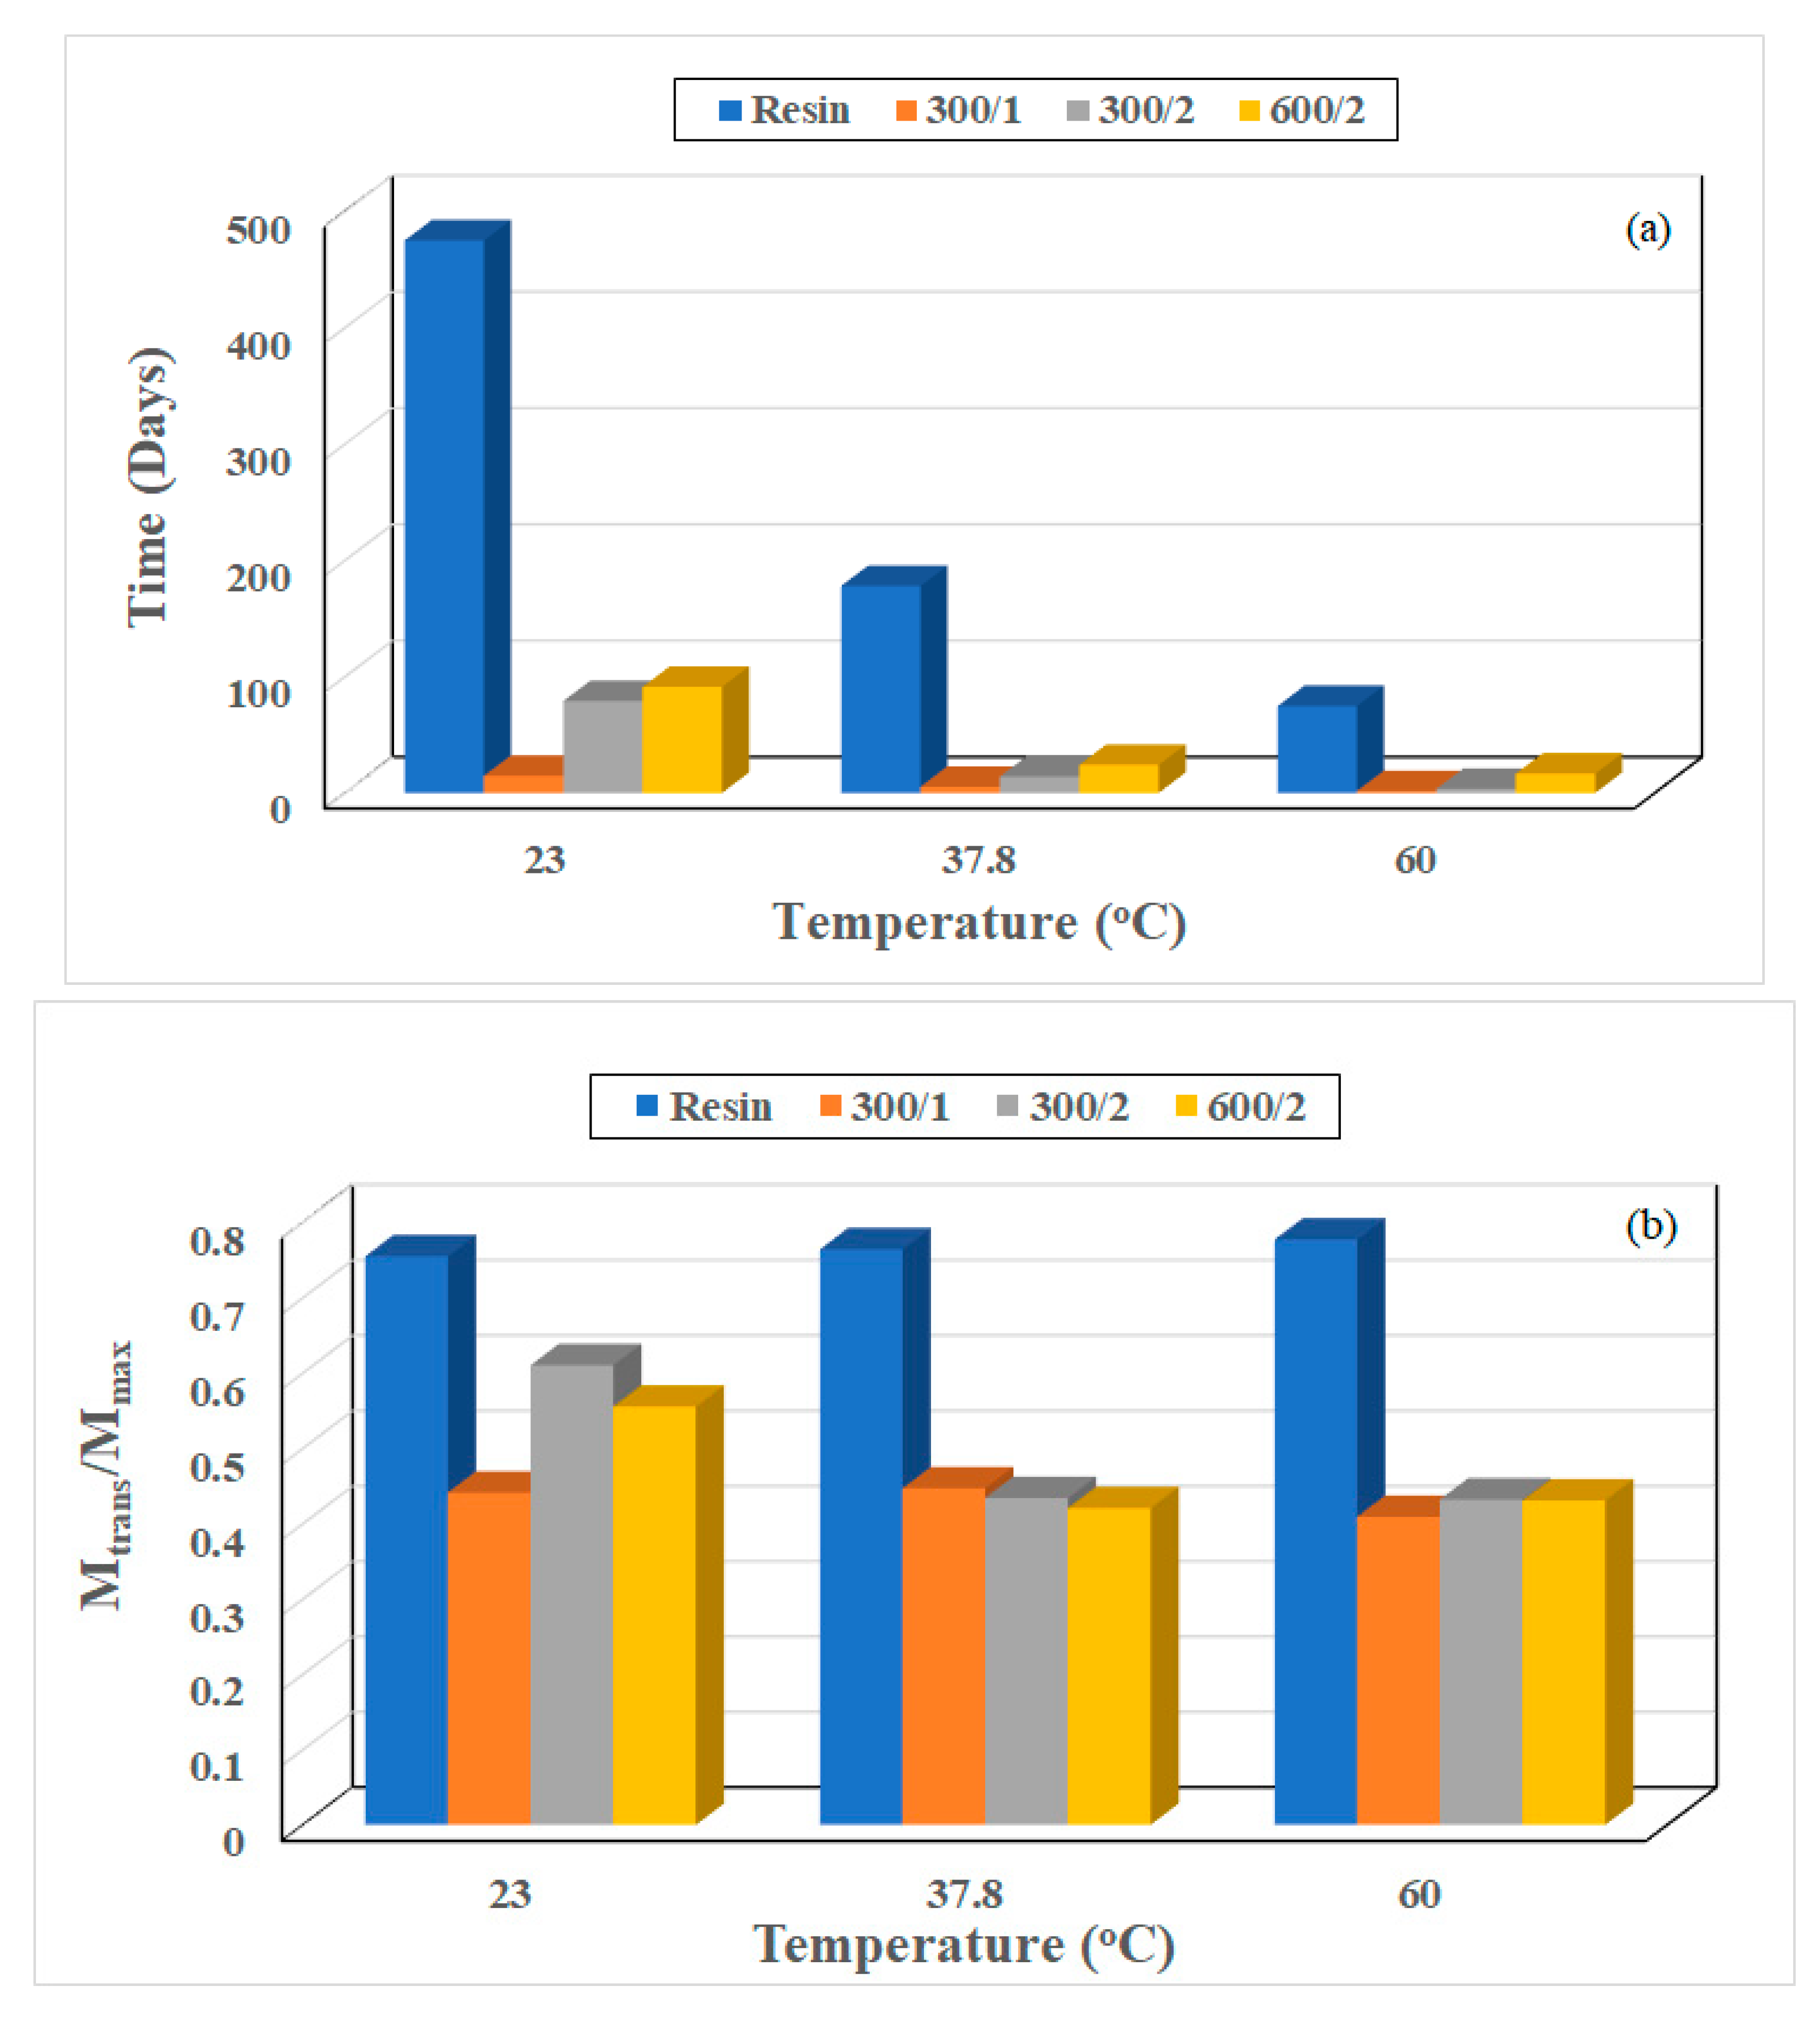
Figure 6.
Comparison of diffusion characteristics.

Figure 7.
Apparent Stage II coefficients as a function of composite type and temperature of immersion.
Figure 7.
Apparent Stage II coefficients as a function of composite type and temperature of immersion.

Figure 8.
Drop in Tg with increase in moisture uptake: (a) Specimens immersed in water at 23 °C, (b) specimens immersed in water at 37.8 °C, (c) specimens immersed in water at 60 °C.
Figure 8.
Drop in Tg with increase in moisture uptake: (a) Specimens immersed in water at 23 °C, (b) specimens immersed in water at 37.8 °C, (c) specimens immersed in water at 60 °C.

Figure 9.
Difference in change in Tg based on stage of moisture uptake.

Figure 10.
Effect of time and temperature of immersion on flexural strength: (a) 300/1 composite, (b) 300/2 composite, (c) 600/2 composite.
Figure 10.
Effect of time and temperature of immersion on flexural strength: (a) 300/1 composite, (b) 300/2 composite, (c) 600/2 composite.

Figure 11.
Correlation of retention in Tg and flexural strength as a function of time of immersion: (a) Immersed in water at 23 °C, (b) immersed in water at 37.8 °C, (c) immersed in water at 60 °C.
Figure 11.
Correlation of retention in Tg and flexural strength as a function of time of immersion: (a) Immersed in water at 23 °C, (b) immersed in water at 37.8 °C, (c) immersed in water at 60 °C.


Table 1.
Summary of characteristics for the composite specimens.
| Composite | Fabric Areal Weight (gsm) | Number of Layers | Thickness (mm) | Fiber Mass Fraction (%) |
|---|---|---|---|---|
| 300/1 | 300 | 1 | 0.72 | 35 |
| 300/2 | 300 | 2 | 1.34 | 39 |
| 600/2 | 600 | 2 | 1.80 | 44 |
Table 2.
Moisture uptake parameters for resin.
| Temperature of Immersion (°C) | Dr (×10−7 mm2/s) | kr (×10−4 mm2/s) | Mtrans (%) | Mmax (%) |
|---|---|---|---|---|
| 23 | 1.04 | 0.280 | 3.274 | 4.338 |
| 37.8 | 3.77 | 0.236 | 3.435 | 4.496 |
| 60 | 25.4 | 0.216 | 3.532 | 4.546 |
Table 3.
Moisture kinetics parameters for the modified two-stage uptake process.
| Material | Temperature of Immersion (°C) | Deff (×10−7 mm2/s) | keff (×10−4 mm2/s) | D (=Deff × L2) (×10−7 mm2/s) | k (=keff × L1) (×10−4 mm2/s) | Mtrans (%) | Mmax (%) |
|---|---|---|---|---|---|---|---|
| 300/1 | 23 | 1.089 | 0.293 | 1.648 | 1.015 | 1.326 | 3.008 |
| 37.8 | 3.947 | 0.247 | 4.174 | 0.969 | 1.702 | 3.809 | |
| 60 | 26.59 | 0.226 | 28.41 | 1.172 | 1.922 | 4.702 | |
| 300/2 | 23 | 1.130 | 0.304 | 0.585 | 0.507 | 1.893 | 3.102 |
| 37.8 | 4.096 | 0.256 | 3.502 | 0.992 | 1.655 | 3.804 | |
| 60 | 27.60 | 0.234 | 19.18 | 1.667 | 1.686 | 5.083 | |
| 600/2 | 23 | 1.158 | 0.311 | 0.593 | 0.647 | 2.116 | 3.812 |
| 37.8 | 4.197 | 0.262 | 3.796 | 1.133 | 1.729 | 4.115 | |
| 60 | 28.28 | 0.240 | 14.01 | 1.163 | 2.202 | 5.115 |
Table 4.
Heat of absorption at moisture uptake thresholds.
| Material | Heat of Absorption (kJ/mol K) | |
|---|---|---|
| At Mtrans | At Mmax | |
| Resin | 1.65 | 1.0 |
| 300/1 | 8.04 | 9.81 |
| 300/2 | 2.39 | 10.95 |
| 600/2 | 1.34 | 6.62 |
Table 5.
Permeability in composites at moisture uptake thresholds.
| Composite | Temperature of Immersion (°C) | Permeability (×10−9 mm2/s) | |
|---|---|---|---|
| At Mtrans | At Mmax | ||
| 300/1 | 23 | 2.19 | 4.96 |
| 37.8 | 7.09 | 15.89 | |
| 60 | 54.60 | 133.59 | |
| 300/2 | 23 | 1.11 | 1.81 |
| 37.8 | 5.79 | 13.35 | |
| 60 | 32.34 | 97.49 | |
| 600/2 | 23 | 1.25 | 2.26 |
| 37.8 | 6.56 | 15.62 | |
| 60 | 30.85 | 71.66 | |
Table 6.
Characteristics associated with Tg changes due to hygrothermal aging.
| Temperature of Immersion (°C) | Composite | % Drop in Tg at 60 Months | Drop in Tg per % Moisture Uptake |
|---|---|---|---|
| 23 | 300/1 | −19.6 | 6.82 |
| 300/2 | −22.1 | 6.95 | |
| 600/2 | −25.0 | 6.37 | |
| 37.8 | 300/1 | −17.0 | 4.68 |
| 300/2 | −18.5 | 4.74 | |
| 600/2 | −19.4 | 4.56 | |
| 60 | 300/1 | −20.5 | 4.55 |
| 300/2 | −24.3 | 4.65 | |
| 600/2 | −25.1 | 4.38 |
Table 7.
Percentage (%) decrease in flexural strength.
| Composite | Temperature of Immersion (°C) | Time Period under Consideration | ||
|---|---|---|---|---|
| 2 Months | 4 Months | 60 Months | ||
| 300/1 | 23 | 7.27 | 6.69 | 19.87 |
| 37.8 | 8.84 | 9.54 | 25.22 | |
| 60 | 13.60 | 13.78 | 30.15 | |
| 300/2 | 23 | 5.02 | 11.57 | 22.98 |
| 37.8 | 12.72 | 16.07 | 28.57 | |
| 60 | 16.85 | 17.75 | 32.25 | |
| 600/2 | 23 | 11.55 | 28.19 | 44.98 |
| 37.8 | 15.99 | 32.98 | 48.95 | |
| 60 | 21.39 | 35.93 | 49.54 | |
Disclaimer/Publisher’s Note: The statements, opinions and data contained in all publications are solely those of the individual author(s) and contributor(s) and not of MDPI and/or the editor(s). MDPI and/or the editor(s) disclaim responsibility for any injury to people or property resulting from any ideas, methods, instructions or products referred to in the content. |
© 2023 by the authors. Licensee MDPI, Basel, Switzerland. This article is an open access article distributed under the terms and conditions of the Creative Commons Attribution (CC BY) license (https://creativecommons.org/licenses/by/4.0/).
Share and Cite
MDPI and ACS Style
Hassanpour, B.; Karbhari, V.M. Moisture and Glass Transition Temperature Kinetics of Ambient-Cured Carbon/Epoxy Composites. J. Compos. Sci. 2023, 7, 447. https://doi.org/10.3390/jcs7110447
AMA Style
Hassanpour B, Karbhari VM. Moisture and Glass Transition Temperature Kinetics of Ambient-Cured Carbon/Epoxy Composites. Journal of Composites Science. 2023; 7(11):447. https://doi.org/10.3390/jcs7110447
Chicago/Turabian StyleHassanpour, Behnaz, and Vistasp M. Karbhari. 2023. "Moisture and Glass Transition Temperature Kinetics of Ambient-Cured Carbon/Epoxy Composites" Journal of Composites Science 7, no. 11: 447. https://doi.org/10.3390/jcs7110447