Article

Strength and Stiffness Evaluation of a Fiber-Reinforced Cement-Stabilized Fly Ash Stone Dust Aggregate Mixture

by
Sanjeeb Kumar Mohanty
1,
Dipti Ranjan Biswal
1,
Benu Gopal Mohapatra
1,
Brundaban Beriha
1,
Ramachandra Pradhan
1 and
Harekrushna Sutar
2,*
1
School of Civil Engineering, KIIT Deemed to be University, Bhubaneswar 751024, Odisha, India
2
Department of Chemical Engineering, Indira Gandhi Institute of Technology, Sarang 759146, Odisha, India
*
Author to whom correspondence should be addressed.
J. Compos. Sci. 2023, 7(11), 459; https://doi.org/10.3390/jcs7110459
Submission received: 20 September 2023 / Revised: 24 October 2023 / Accepted: 2 November 2023 / Published: 3 November 2023
(This article belongs to the Section Fiber Composites)

Abstract

:
The utilization of waste fly ash in road construction is primarily confined to its use in embankment filling or as a stabilizer when combined with lime and cement. Its application in structural pavement layers, such as the base and subbase, faces a challenge due to the high volume of fine particles, which renders it brittle when stabilized. In this study, fly ash was blended with stone dust and aggregated to enhance its gradation. Subsequently, it was stabilized with cement to bolster its strength, rendering it suitable for pavement use. Additionally, polypropylene (PP) fibers were introduced to mitigate the brittleness of the mixture. An extensive experimental investigation was conducted to assess the strength and stiffness properties, including compressive strength, indirect tensile strength, flexural strength, cyclic indirect tensile modulus, and flexural modulus of fiber-reinforced cement-stabilized mixtures of fly ash, stone dust, and aggregate. The experimental results reveal that the addition of PP fibers up to 0.25 wt.% enhances compressive strength, but any further increase in fiber content leads to a reduction in strength. However, indirect tensile strength and flexural strength show improvement, with an increase in fiber percentage up to 0.5 wt.%. It was observed that cement content plays a dominant role in stabilizing these materials. Appropriate relationships have been established between strength and modulus parameters for stabilized mixtures. Based on the strength and stiffness study, a combination of 70% fly ash and 30% stone dust aggregate with 6% cement can be considered for the base layer. Regarding the behavior of indirect tensile strength and flexural strength, an optimum fiber percentage of 0.35% is recommended.

1. Introduction

The demand for electricity is growing day by day with the rapid growth in infrastructure in India. Thermal power plants are primarily fulfilling this demand but producing huge quantities of fly ash as byproducts during the burning of coal. As per the Central Electricity Authority [1] report published in August 2022, Indian thermal plants have generated 270.82 million tons of fly ash in the year 2021–2022, and around 95.95% have been used [1]. Still, a huge quantity of fly ash needs to be utilized to reduce pollution. The road sector is an area where this could be used in bulk quantity. Road construction also needs sustainable materials, as good quality natural aggregate is depleting rapidly.
In its essence, there are two primary categories of fly ash: Class C and Class F. In India, Class F fly ash is predominantly encountered. Class C fly ash, produced through the combustion of lignite coal, possesses inherent self-hardening properties due to its calcium oxide content exceeding 20%. On the other hand, Class F fly ash is derived from the incineration of anthracite coal, containing less than 10% calcium oxide, making it non-self-cementing. Therefore, it necessitates the addition of an activator such as cement, lime, gypsum, or other alkali activators (e.g., NaOH, KOH) to attain initial strength development. The pozzolanic characteristic of fly ash renders it a superb substance for applications like filling and embankment, especially in areas where subsidence is a concern, as well as for soil stabilization [2,3,4,5,6]. Due to the low strength and large concentration of fine particles, untreated fly ash is not suitable for use in the subbase/base layer of pavements. Few studies also highlight the inadequacy of stabilized fly ash as a subbase/base material due to its poor gradation and low strength [7,8]. This shortcoming can be eliminated by adding materials with coarser particles, such as stone dust generated from a stone quarry, and stabilizing the mix with lime or cement [9]. The addition of coarser particles would improve the gradation, whereas a stabilizer would improve the strength. Bakare et al. [10] and Pai et al. [11] have evaluated the performance of stabilized fly ash and a slag mixture and found them to be suitable for the subbase/base layer.
Usmen et al. [12] assessed Class C fly ash stabilized with lime and cement, observing that higher lime content increased the optimum moisture content (OMC) and decreased maximum dry density (MDD) during compaction. Cement-stabilized samples did not exhibit significant OMC-MDD changes. Ghosh and Subbarao [13] also observed a notable enhancement of the shear strength properties of a low lime Class F fly ash that had been modified with 4–10% lime with 0.5–1% gypsum. In short curing periods, cement content notably boosted strength, while elevated lime content reduced strength due to a slow pozzolanic reaction. Freeze–thaw cycles caused strength loss in both lime- and cement-stabilized samples, with cement-stabilized samples showing increased residual strength due to C-S-H gel formation. Generally, cement-stabilized samples outperformed lime-stabilized ones in terms of strength and durability.
However, a high-volume content of fine particles makes the stabilized fly ash a brittle material. Dimter et al. [14] also observed a drastic reduction in elastic modulus cement-stabilized fly ash mixtures. Hence, recently, research has been undertaken to include fibers to enhance the ductility of the mixture [15]. In the experiments, two distinct sizes of polyester fibers (6 mm and 20 mm) were employed alongside a consistent fiber content of 1% (based on dry weight). The study included compaction tests, triaxial shear tests, and various geotechnical characterization examinations conducted on both untreated and fiber-reinforced fly ashes. The findings revealed that the addition of fibers did not influence the optimum moisture content (OMC) and maximum dry density (MDD) of fly ash. Moreover, the addition of fibers results in the enhancement of the indirect tensile strength and flexural strength. A similar observation has also been reported by other researchers [15,16,17,18,19]. However, Kumar and Singh [16] reported that compressive strength increases up to a certain dosage of fiber, and any further addition of fiber results in a decrease in compressive strength. The enhancement in unconfined compressive strength was attributed to the frictional interaction between the fibers and the fly ash. The relationship between unconfined compressive strength and fiber content exhibited a linear pattern, while the influence of the aspect ratio followed a nonlinear trend, conforming to a second-degree polynomial curve.
Though compressive strength is considered one of the vital mechanical parameters, a study of indirect tensile strength and flexural strength of stabilized subbase and base is also of paramount importance, as the failure of a stabilized layer is largely governed by tensile stress, i.e., indirect tensile stress or flexural tensile stress [20,21,22,23,24]. Static indirect tensile stress and four-point flexural stress tests are conducted to determine the indirect tensile strength and flexural tensile strength.
Further, in recent decades, a mechanistic empirical design has been employed for the design of pavement. An elastic modulus and Poison’s ratio are the basic elastic parameters used in pavement design. As the pavement is subjected to cyclic loads, the stress–strain behavior and the elastic modulus under cyclic loads simulate the free conditions. Previous research has indicated that the strain gradient in a stabilized layer of pavement closely mirrors the strain gradient observed in flexure tests and indirect tensile tests [23]. However, there is a notable scarcity of studies on the modulus of fiber-reinforced cement-stabilized fly ash. Hence, in this study, an extensive laboratory investigation has been performed to evaluate the strength and stiffness of the fiber-reinforced cement-stabilized fly ash stone dust aggregate mixture as a sustainable material for base layer application in flexible pavement.

2. Materials and Methods

2.1. Materials

2.1.1. Fly Ash

Fly ash (see Figure 1) used in this study was collected from the Captive Thermal power Plant (CPP) of NALCO, located at Angul, Odisha, India. The chemical composition of the fly ash is presented in Table 1. It can be classified as Class F, as per ASTM C618 [25].

2.1.2. Cement

The cement (see Figure 1) used in this study conformed to Ordinary Portland Cement (OPC) grade 43, as per IS 8112 [26].

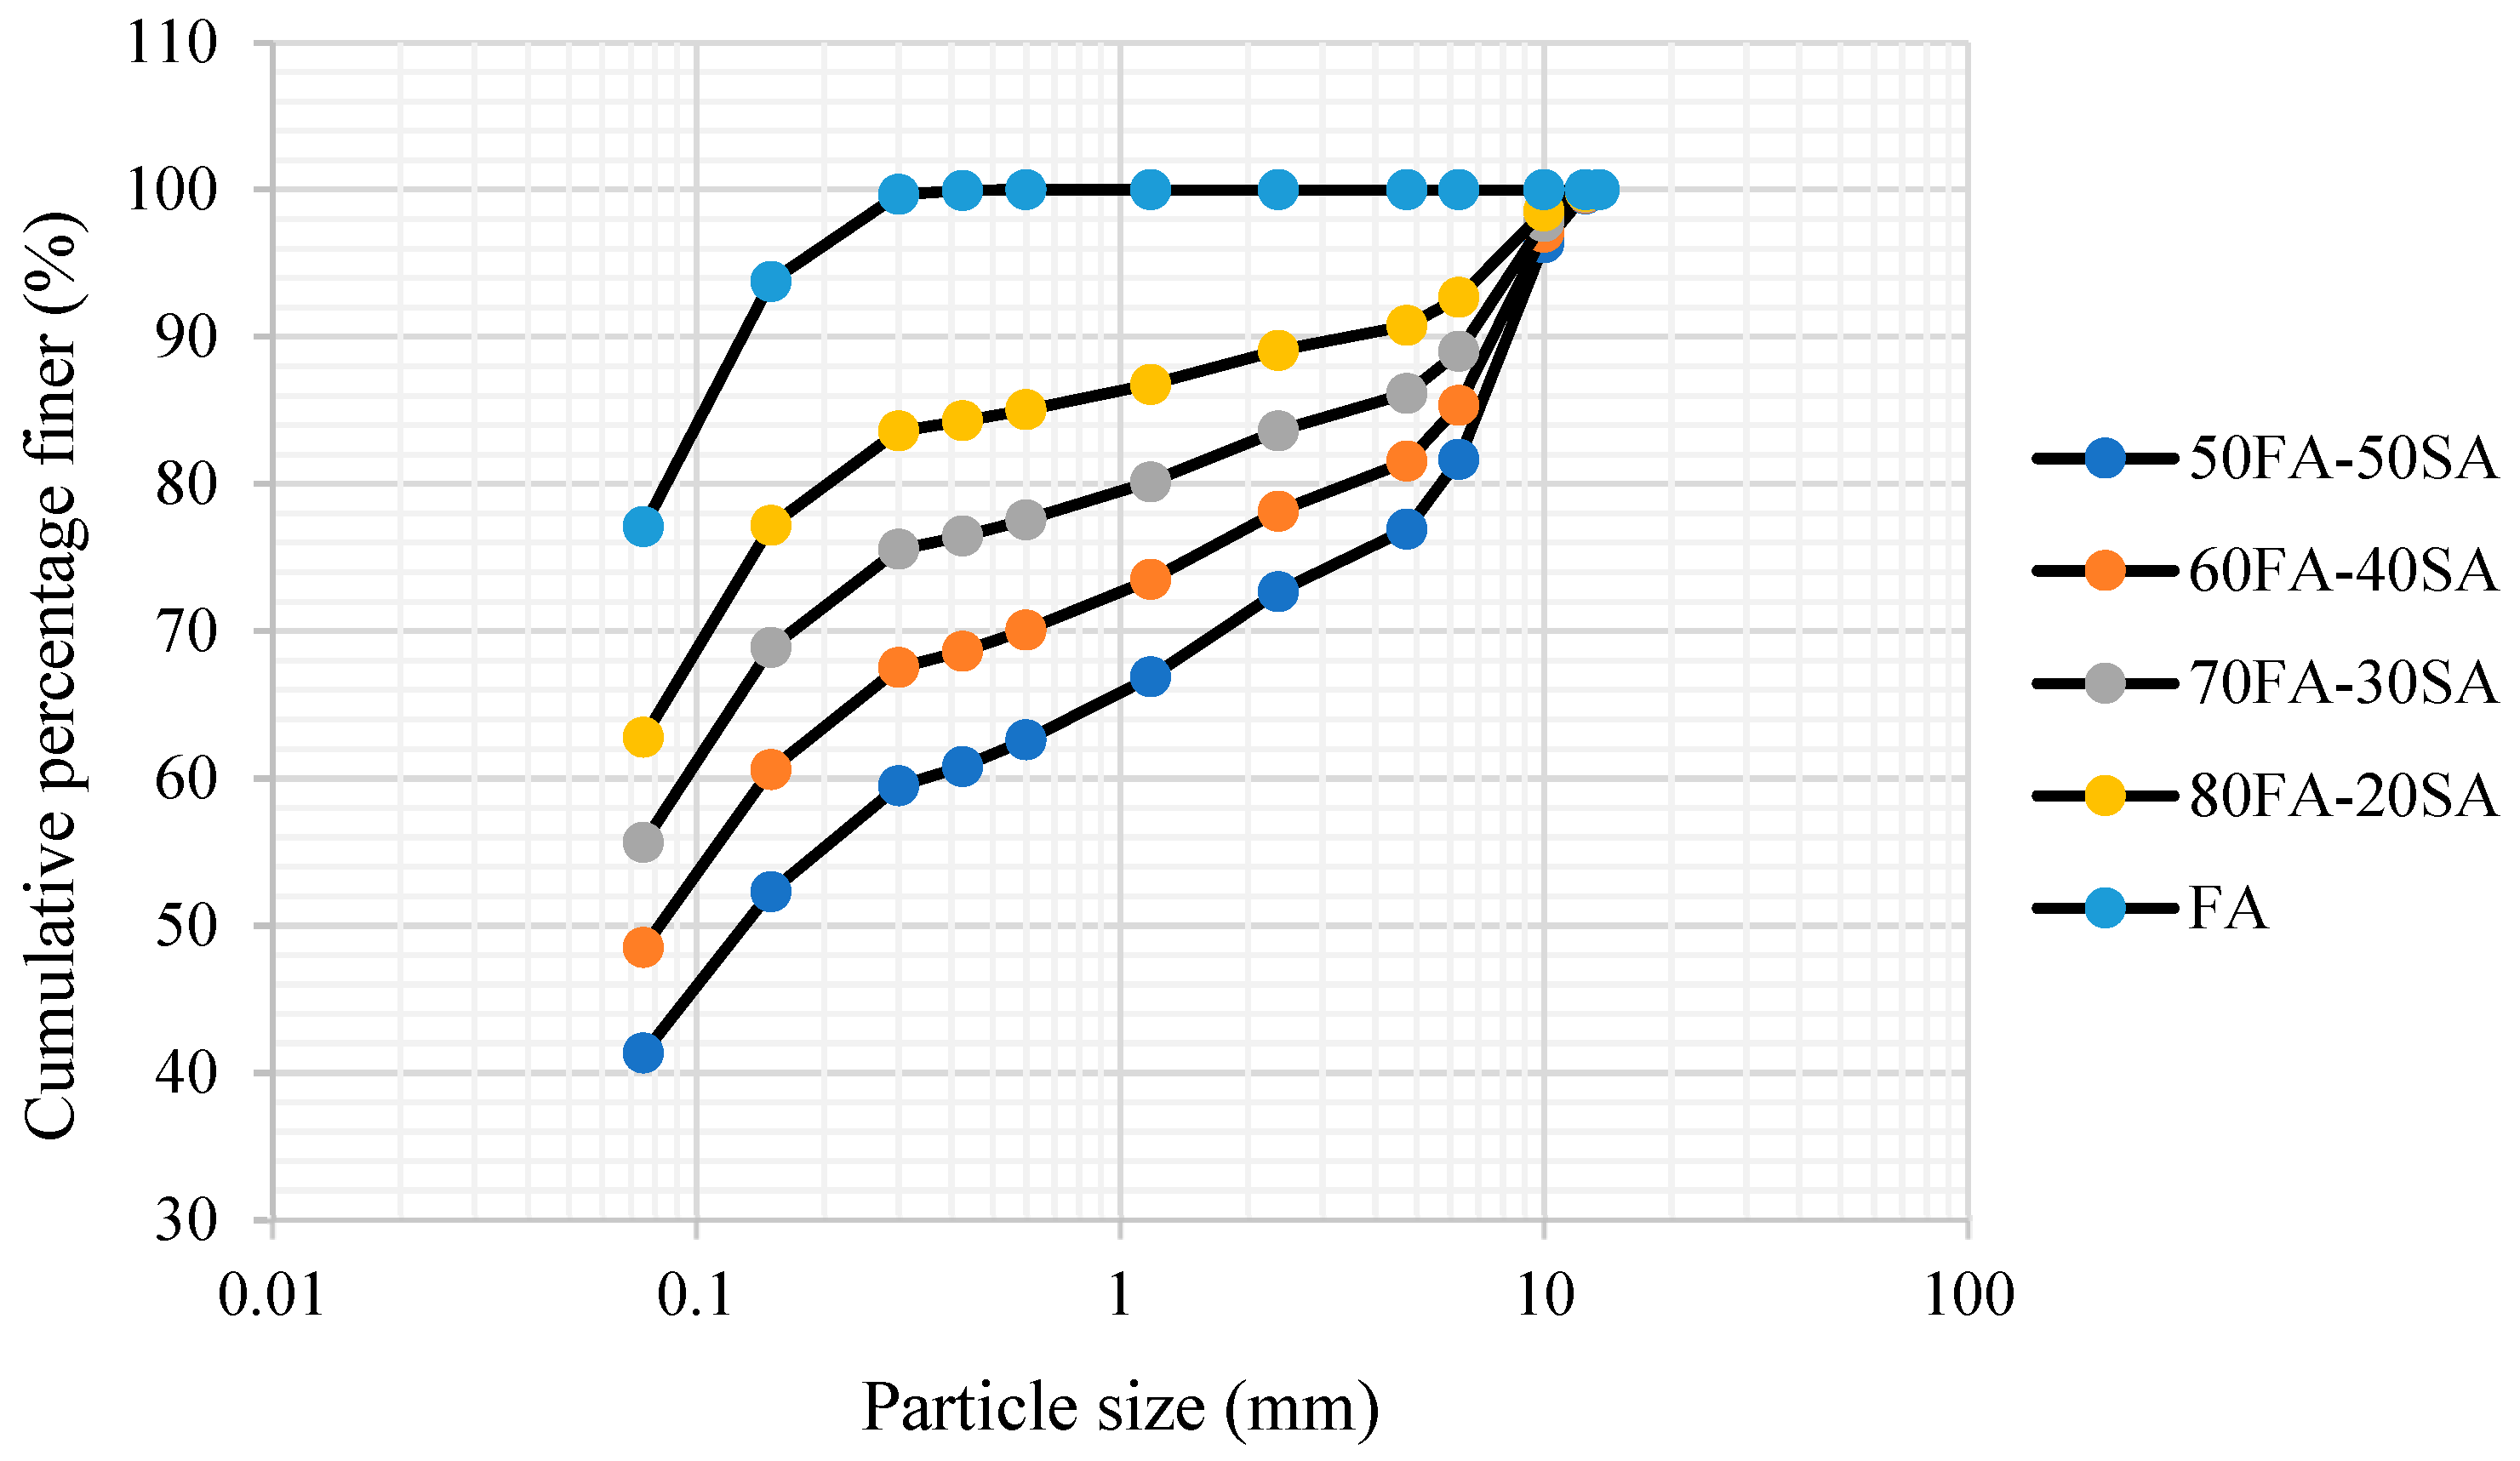
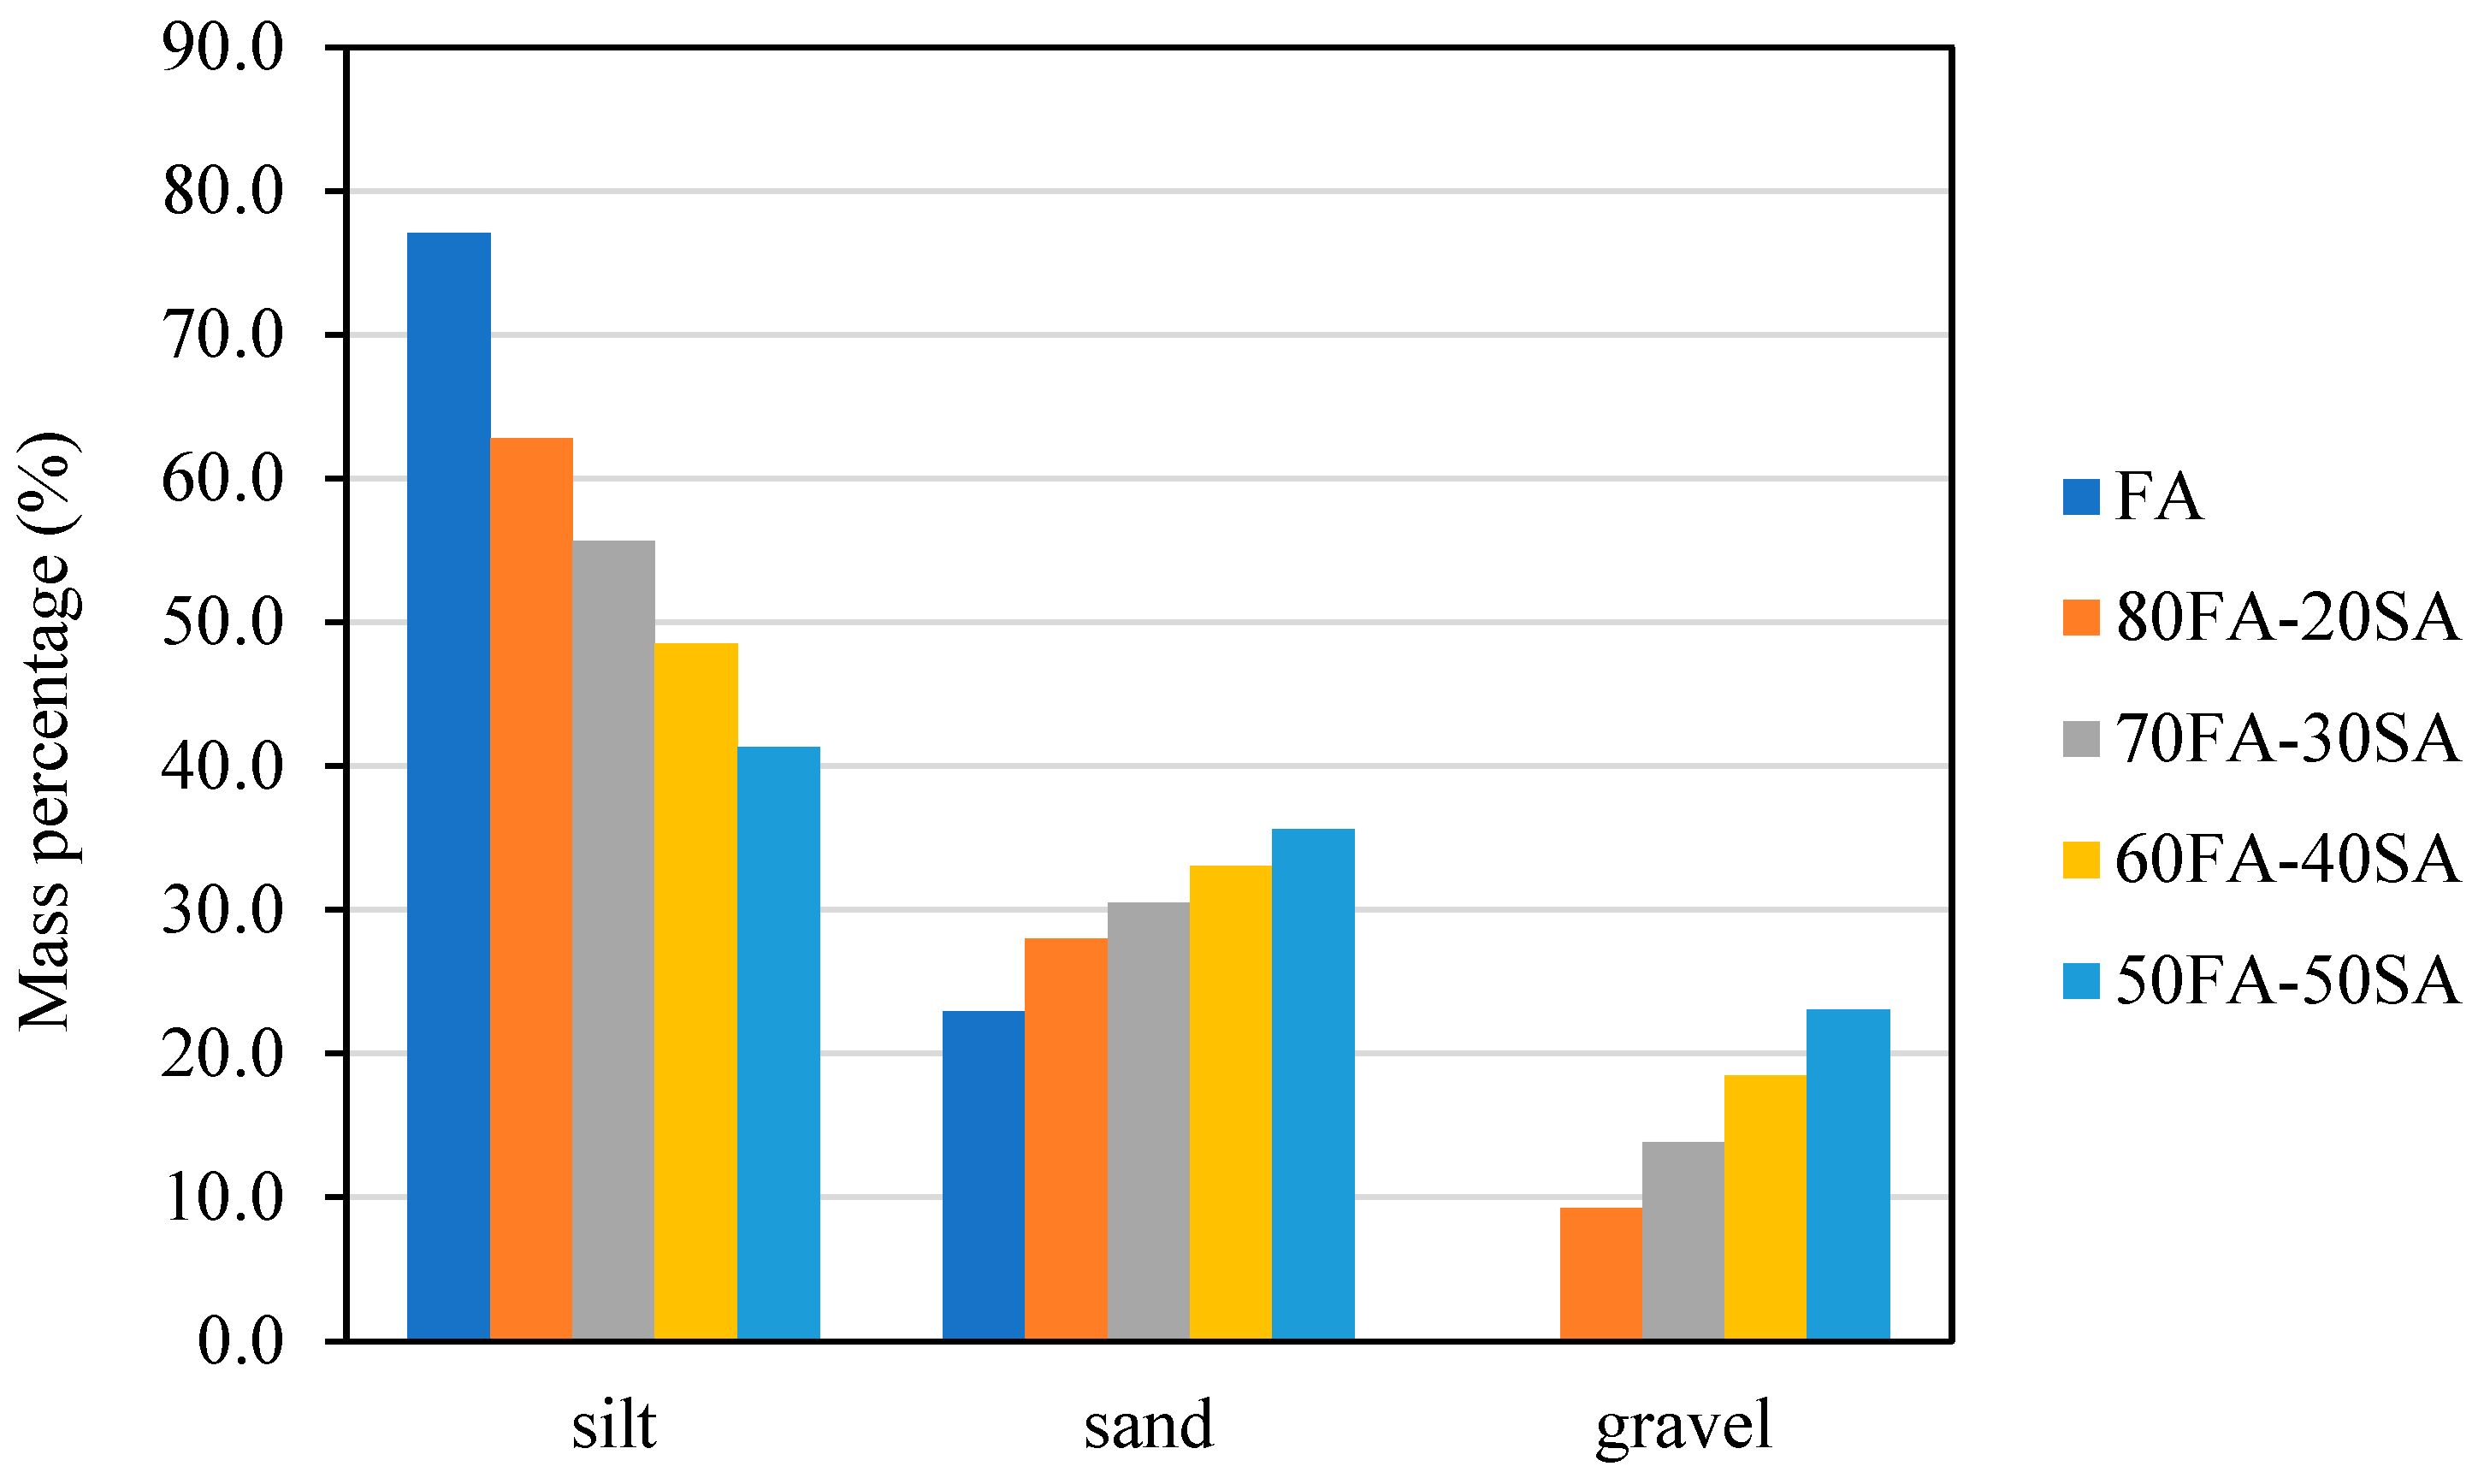
2.1.3. Stone Dust and Crushed Stone Aggregates

Stone dust is a fine dust particle generated during the crushing of an aggregate in a crusher plant. Both the stone dust and crushed stone aggregate (see Figure 1) were collected from a local stone-crushing plant located in Bhubaneswar, India.

2.1.4. Polypropylene Fiber (Randomly Oriented)

The polypropylene fiber (see Figure 1) was procured from XETEX Industries Pvt. Ltd., Mumbai of Cetex Brand, Mumbai, India. The detailed properties of the fiber are presented in Table 2.

2.1.5. Mix Proportioning

Fly ash was mixed with stone dust and aggregates to improve the gradation. The maximum particle size of fly ash, stone dust, and aggregates used in these studies are 1.18 mm, 4.75 mm, and 12.5 mm, respectively. Stone dust and aggregates are mixed in a 50–50 ratio, and this has been donated as SA. Various combinations of fly ash and SA, i.e., 80FA-20SA, 70FA-30SA, 60FA-40SA, and 50FA-50SA were tried to improve the gradation. The minimum percentage of fly ash used in the mixture was 80% in order to maximize the use of fly ash. The improvement of the gradation can be observed in the particle size distribution curve of mixtures shown in Figure 2. It can be seen in Figure 3 that the gravel and sand percentages increased with an increase in SA percentages, whereas the silt percentage decreased with an increase in SA percentages.

2.2. Experimental Programme

2.2.1. Sample Preparation

FA and SA were oven-dried and mixed in the above-mentioned percentages to obtain the desired mix. To each mix (mixture), cement was added in three percentages by mass, i.e., 4%, 6%, and 8%, and PP fiber was added in three percentages by mass, i.e., 0.25%, 0.35%, and 0.5%. The mixing was performed manually using a trowel, ensuring the production of a consistent mix. Particular attention was given to achieving uniform fiber distribution within the mix and preventing the formation of any lumps. Subsequently, the Modified Proctor test, as per ASTM D 1557 [27], was conducted on each mix type to determine the maximum dry density (MDD) and optimum moisture content (OMC).
Three different types of test specimens were prepared for each mix, i.e., cylindrical (100 mm in diameter and 115 mm height), cylindrical (100 mm in diameter and 63 mm height), and prismatic beam specimen (75 mm × 75 mm × 285 mm). The test specimens were kept inside the respective molds for 2 h before demolding to avoid breaking. The specimens after demolding were wrapped in polythene and cured for 7 days and 28 days.

2.2.2. Unconfined Compressive Strength Test (UCS)

A UCS test was conducted on the cylindrical specimen 100 mm in diameter and 115 mm in height, as per ASTM D1633 [28]. A minimum of three samples were tested for each mix type.

2.2.3. Indirect Tensile Test (IDT)

A monotonic IDT was conducted to determine indirect tensile strength (ITS), and a cyclic IDT was conducted to determine the cyclic IDT modulus/resilient modulus (IDTM). The tests were conducted as per the method suggested by Yeo [29]. The ITS and IDTS values were determined using Equations (1) and (2), respectively. Figure 4 shows the cyclic IDT test setup.
I T S = 2 × P π × D × t
where
P = the ultimate load applied to the specimen to cause failure in monotonic loading;
D = the diameter of the specimen;
t = the thickness of the specimen.
I D T M = P υ + 0.27 H h
where
P = peak load during cyclic loading;
ν = Poisson’s ratio (assumed to be 0.2);
H = horizontal displacement of the specimen after application of the load;
h = the height of the specimen.
Figure 4. (a) Servo hydraulic cyclic test equipment: (b) cyclic indirect tensile test arrangement.
Jcs 07 00459 g004

2.2.4. Flexure Test

In this study, flexure tests were conducted at a constant stress of 690 kPa/min, following the procedure laid down in ASTM D1635 [30]. Similar to the IDT test, the flexure test was conducted in two phases, i.e., phase 1: monotonic flexure test for determining flexural strength (FS) or the modulus of rupture (MOR) and phase 2: cyclic flexure test for determining the flexural modulus (FM) at varying stress ratios of 0.3, 0.5, 0.7, and 0.9. The FS and FM were calculated using Equations (3) and (4), respectively. Figure 5 shows the cyclic flexure test setup.
F S = F l b d 2
where
F = the ultimate load applied to the specimen to cause failure in monotonic flexure loading;
l = the distance between two supports during the flexure test;
b = the width of the beam specimen;
d = the depth of the beam specimen.
F M = 23 F l 3 108 b d 3 Δ
where
F = the peak load applied during the cyclic flexure test;
∆ = the maximum mid-span deflection during the cyclic flexure test.
Figure 5. Cyclic flexure test: (a) test arrangement; (b) failure of the beam sample.
Jcs 07 00459 g005

3. Results

The strength and stiffness of the fiber-reinforced cement-stabilized fly ash aggregate mixture have been presented in this section. The effect of fiber on various strength and stiffness properties has also been described in each subsection.

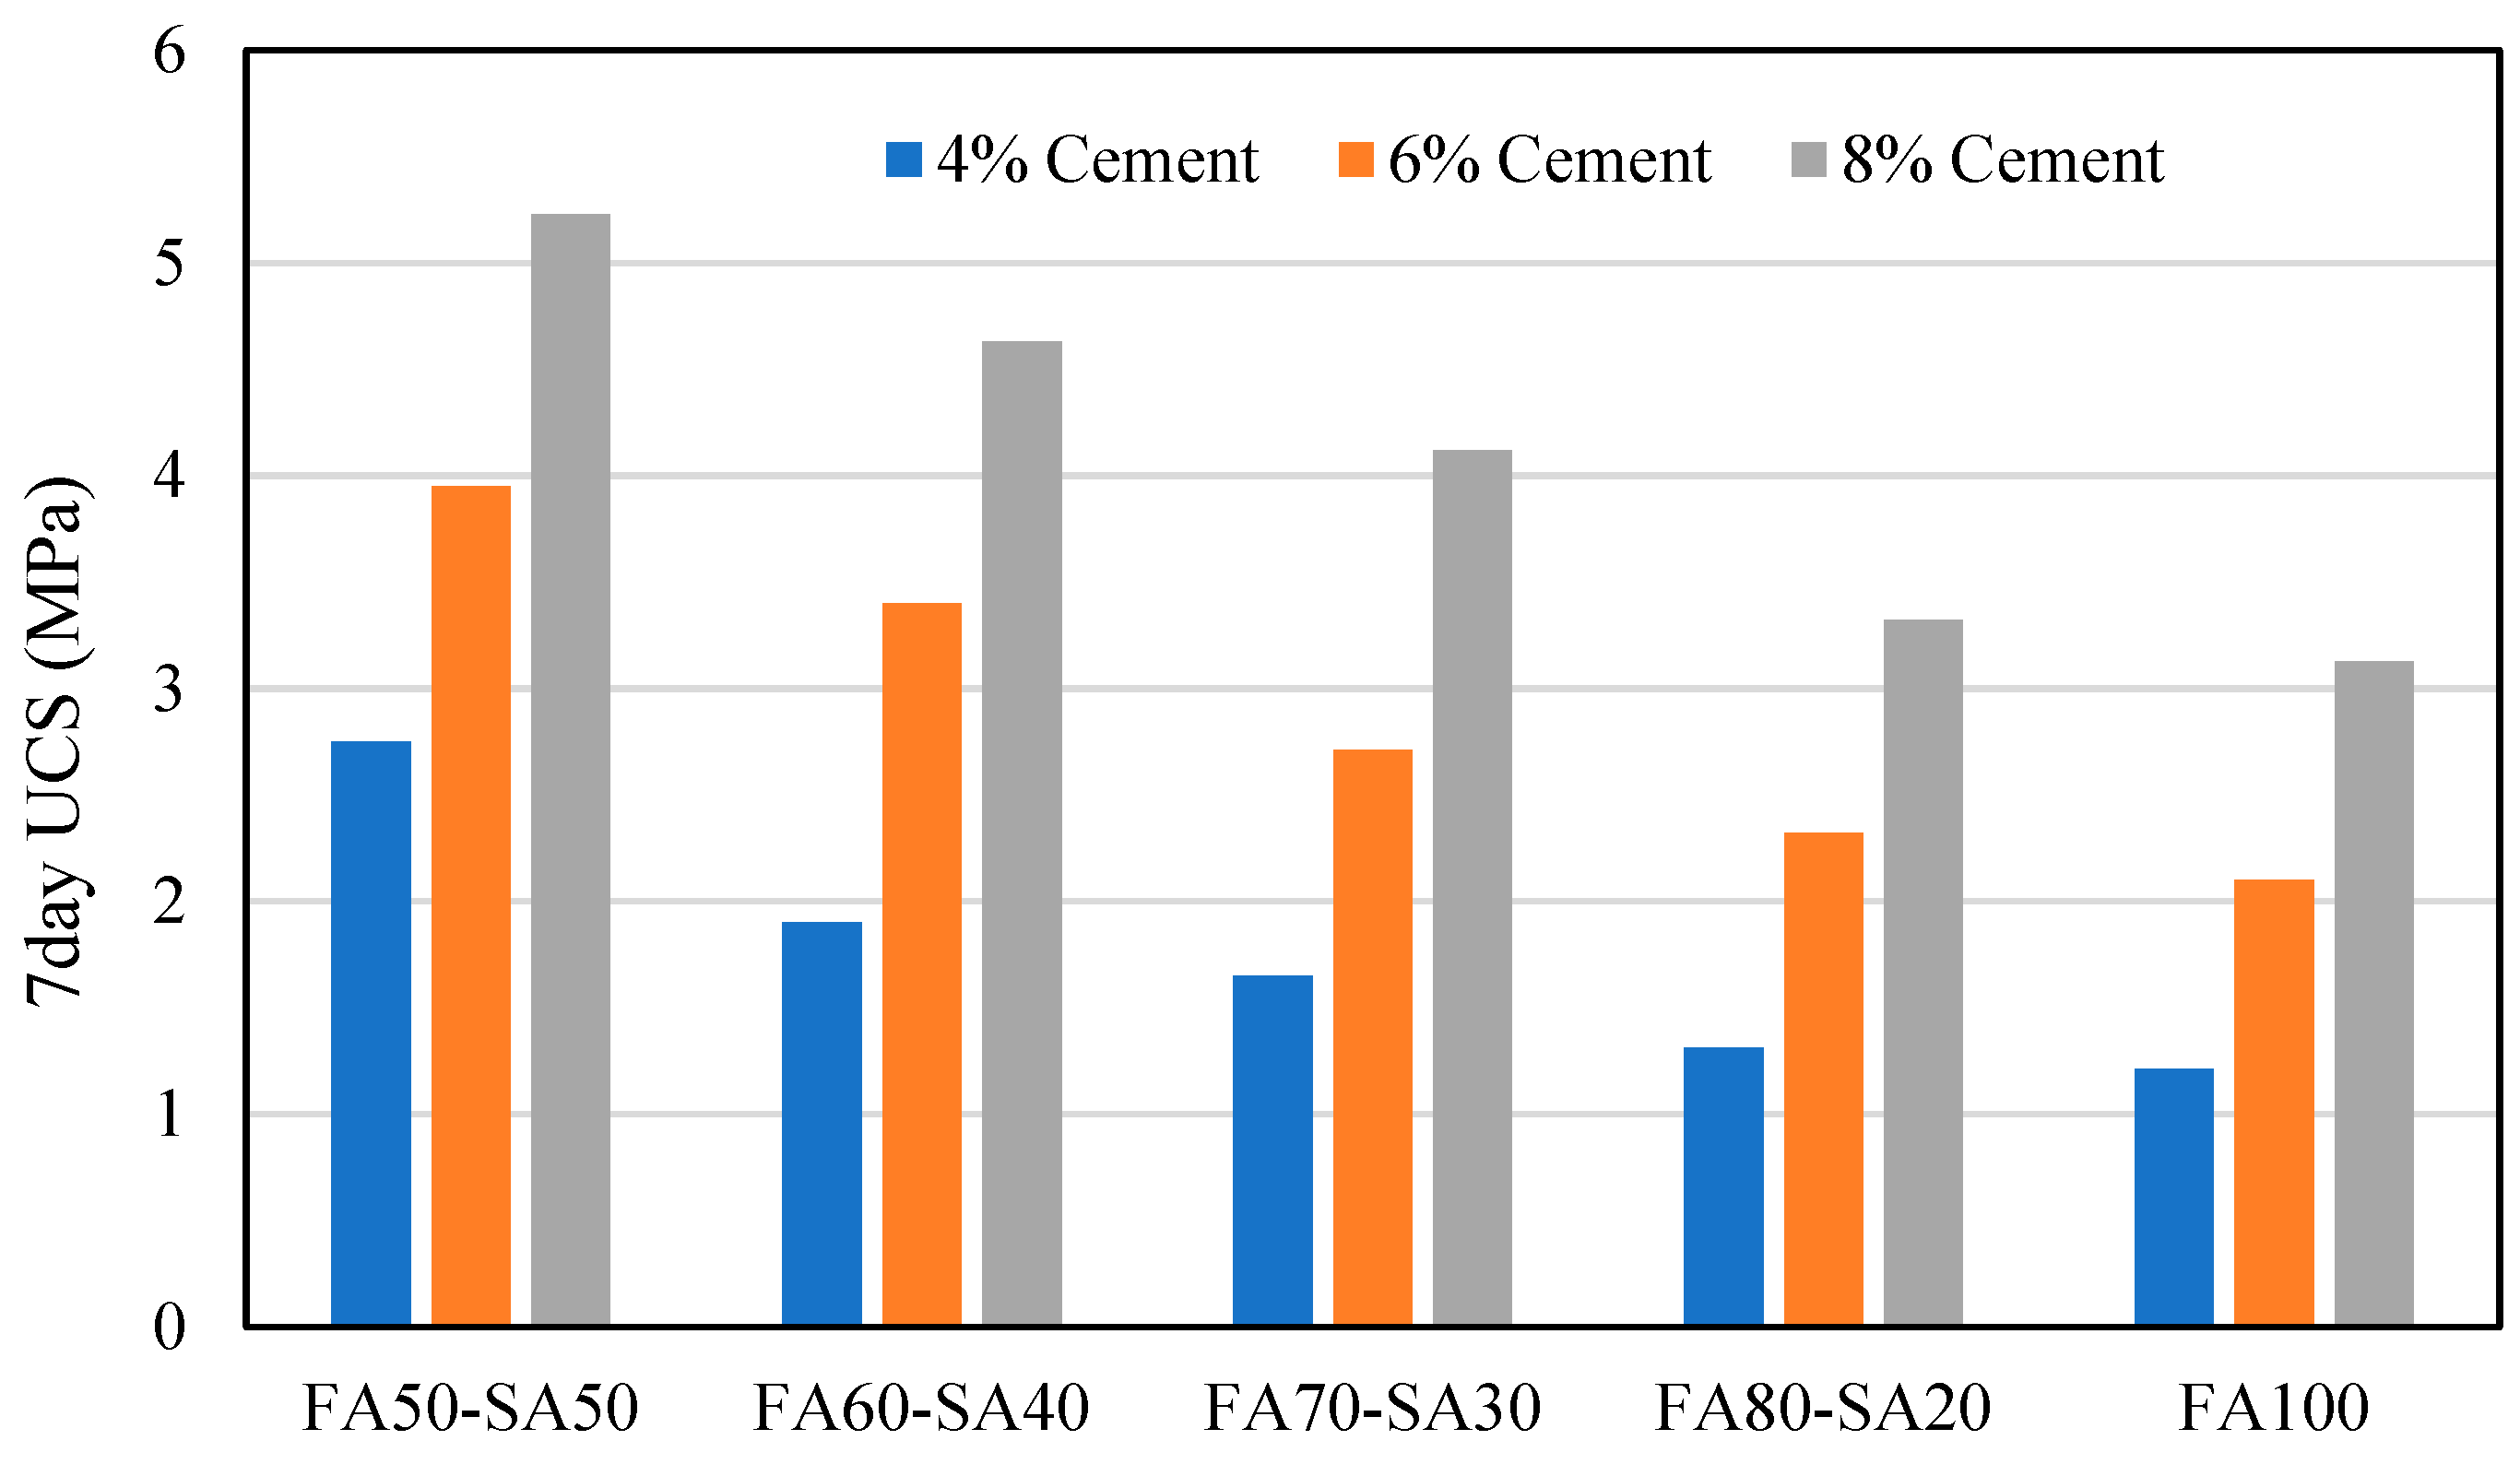
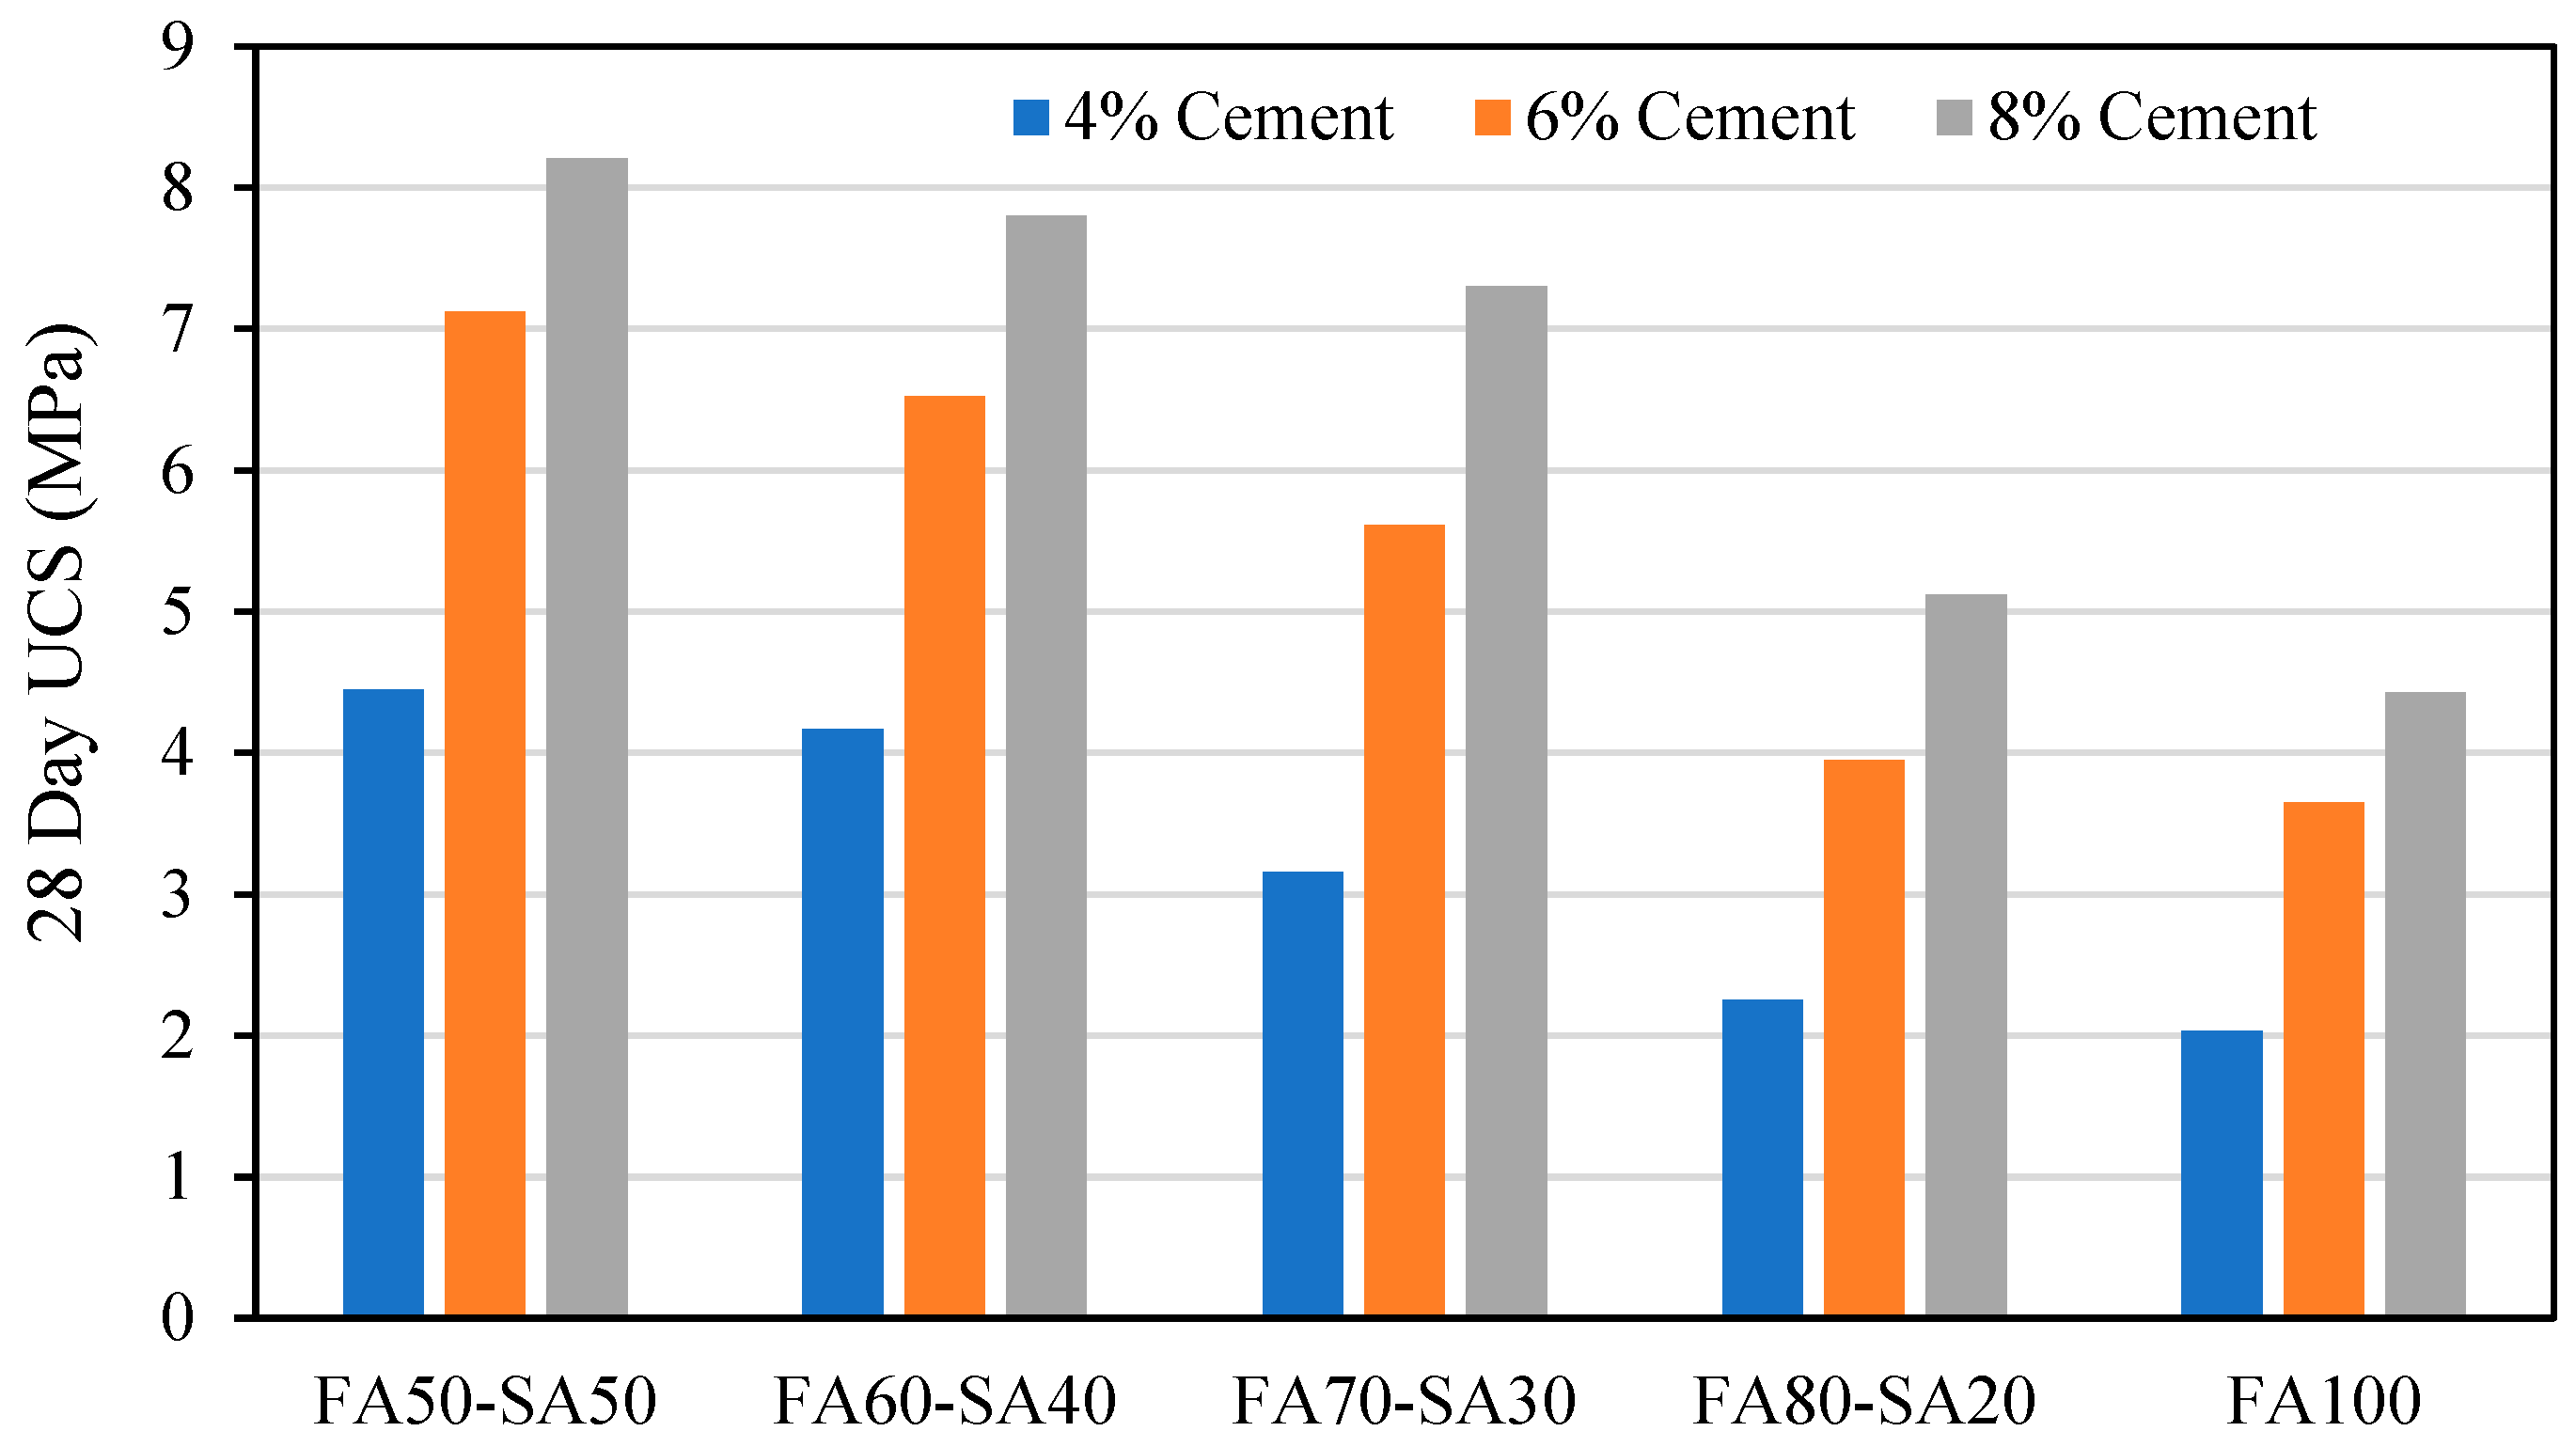
3.1. Compressive Strength

It can be observed in Figure 6 and Figure 7 that both 7-day and 28-day UCS values increased with an increase in SA percentage, which may be attributed to the improvement in gradation due to the addition of SA to FA. It can also be seen in Figure 6 that the UCS values increased with an increase in cement percentages and curing days for all mixture types. As per IRC SP 89 [31], cement-stabilized materials with minimum 7-day UCS values of 4.5 MPa are suitable for base layer application. Hence, 50FA-50SA and 60FA-40SA mixtures with 8% cement stabilization fulfill the criteria. Whereas IRC SP 89 [31] also suggests that for lime fly ash- or lime cement fly ash-bound materials, if a minimum UCS of 4.5 MPa is achieved in 28 days, it can be considered suitable for base later application. In this context, mixtures such as 50FA-50SA, 60FA-40SA, and 70FA-30SA with 6% cement can also be used in the base layer.

3.1.1. Effect of Fiber on the UCS Value

To study the effect of fiber, two mixtures, i.e., 60FA-40SA and 70FA-30SA, were chosen and mixed with three dosages of fiber (0.25%, 0.35%, and 0.5% by mass of mixture). The UCS values of the fiber-reinforced 70FA-30SA and 60FA-40SA mixtures are presented in Figure 8. The UCS data in Figure 8 show that the inclusion of fiber increases the UCS up to 0.25%, and beyond that it decreases. With this optimum fiber content (i.e., 0.25%), fiber-reinforced fly ash attained a UCS of 4.25 MPa, 7.1 MPa, and 8.76 MPa for 4, 6, and 8% cement, which is 1.01-, 1.08-, and 1.13-fold higher than the stabilized fly ash with 4% cement without fiber. The enhancement of the strength of the FA-SA mixtures may be attributed to the mobilization of the tensile strength of randomly distributed fibers due to interparticle friction between fibers and surrounding FA-SA mixtures. The decrease in the UCS value beyond 0.25% fiber dosage may be attributed to the development of numerous slip surfaces in the mixture matrix. Kumar and Singh [16] also observed an optimum fiber dosage of 0.3% with respect to the UCS of fiber-reinforced fly ash.
A linear correlation is established between 7-day and 28-day UCS of the FA-SA mixture with or without fiber and presented in Figure 9. The coefficient of linear relation (R2) of samples without fiber is 0.96, whereas the R2 is 0.86 in the case of fiber addition. The scattered data in the case of the UCS plot with fiber are due to the alteration of strength behavior with the addition of fiber.

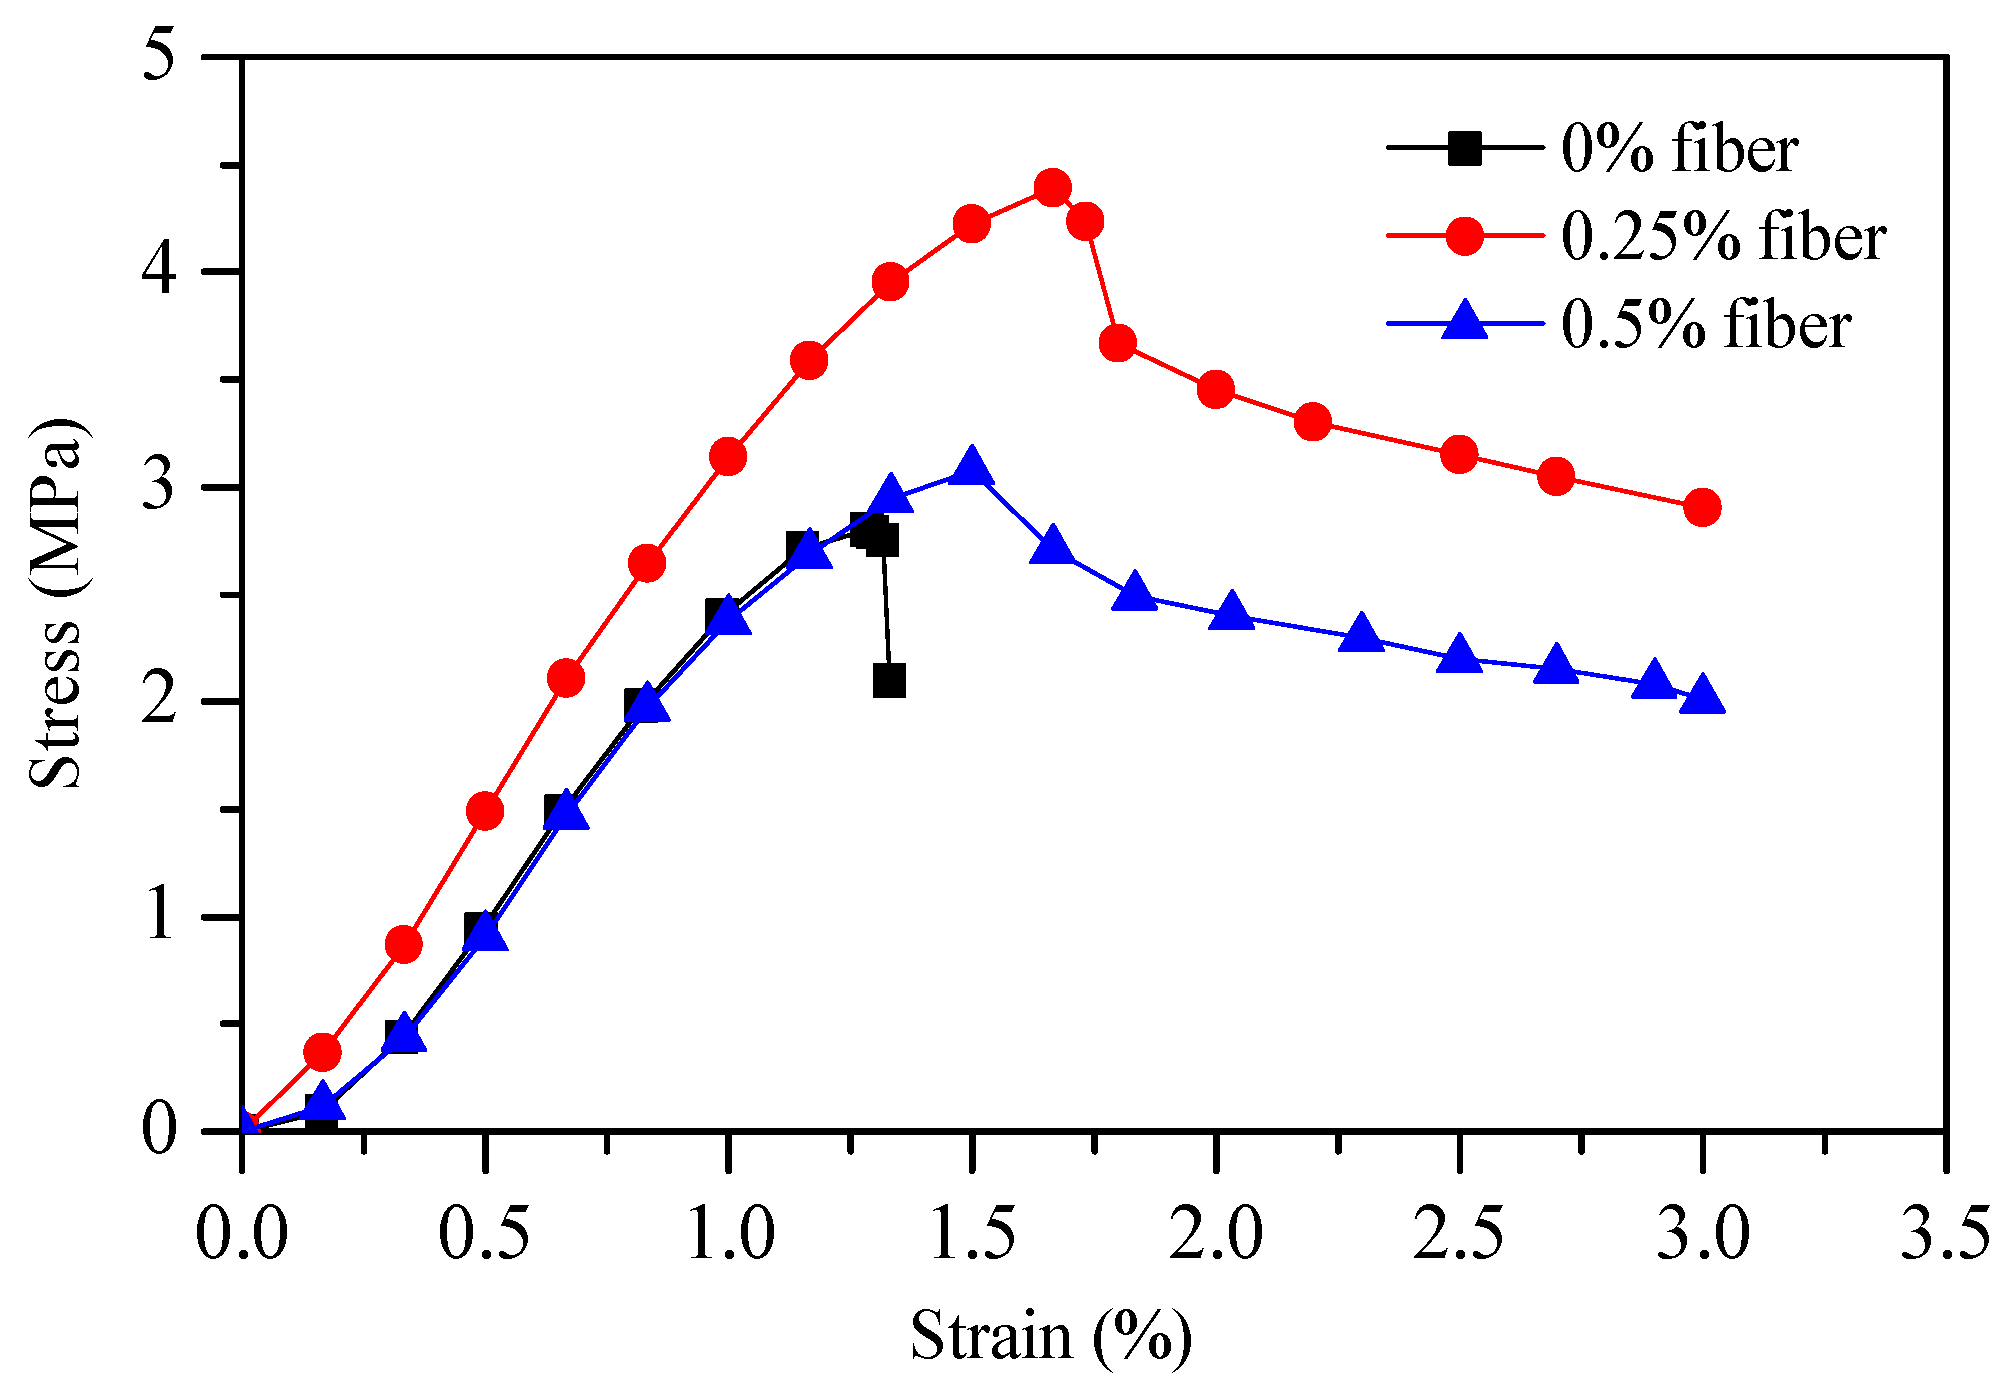
3.1.2. Effect of Fiber on the Stress–Strain Relationship

The stress–strain curve of the cement (6%)-stabilized 70FA-30SA mixture with and without fiber is presented in Figure 10, which shows that in the absence of fiber (0%), the mixtures failed suddenly, demonstrating brittle behavior. However, the inclusion of fiber imparted ductility to the samples, and they did not fail suddenly. The observed stress–strain behavior of stabilized fly ash is in good agreement with the stabilized soil/sand/fine-grained materials [32,33,34]. But the inclusion of fiber may increase or decrease the failure stress. The brittle failure of the stabilized samples without fiber was due to the development of a shear surface. Fiber-reinforced samples failed due to a combination of shear and bulging. This failure was attributed to the internal confinement of the mixture of materials caused by the randomly oriented fibers.

3.1.3. Indirect Tensile Strength (ITS)

The ITS values of the two mixtures, i.e., 60FA-40SA and 70FA-30SA, at various cement and fiber percentages are presented in Figure 11. It can be observed in Figure 11 that the addition of fiber has a notable effect on the tensile strength of blended fly ash at different cement content. The ITS increases with an increase in fiber content, which is also consistent with the studies by Tang et al. [35] and Festugato [36]. The increase in the ITS is about 65% when the percentage of stone aggregate increases from 30 to 40 at 4% cement. However, the increase is only 14% for 6% cement. The beneficial effect of fiber reinforcement on tensile strength can be attributed to the interfacial mechanical interactions between fibers and the fly ash matrix. The increase in tensile strength with increases in fiber content can, therefore, be explained by the increased number of fibers per unit volume and the corresponding total contact area between the fibers and the fly ash matrix.
The bonding strength and friction between fibers and fly ash particles were the dominant factors controlling the reinforcement benefit. The strength factor, which is expressed as the ratio between strength at x% fiber and strength at 0% fiber, increases with an increase in fiber content for the ITS. The strength factor for both the mixtures, i.e., 60FA-40SA and 70FA-30SA, for the UCS and ITS are presented in Figure 12, which shows that the strength factor increases up to 0.25% fiber content and then decreases with further addition in the case of the UCS. This indicates that the addition of fiber increases the tensile strength of stabilized fly ash blended with stone aggregates. When the particles are subjected to tensile strain, tensile stress is mobilized in the fiber due to the bonding and inter-particle friction between the cemented matrix and the fibers. As fiber has a remarkable tensile strength, it results in a positive effect on the ITS due to the addition of fiber.

3.1.4. Correlation between the ITS and UCS

A linear relationship is observed between the ITS and UCS of the stabilized fly ash mixtures (60FA-40SA and 70FA-30SA) and is presented in Figure 13. The R2 value of the correlation was found to be 0.81The correlation indicates that the ITS increases with increasing the UCS in the treated fly ash stone dust mixture.

3.2. Flexural Strength (FS)

The FS values of the two mixtures, i.e., 60FA-40SA and 70FA-30SA, at various cement and fiber percentages, are presented in Figure 14. It can be observed in Figure 14 that the flexural strength increases with an increase in cement content from 0% to 0.5% of fiber content. The flexural strength increased by 78–100% by increasing cement content from 4% to 6% with or without fibers.

3.2.1. Effect of Fiber on Flexural Strength

Unlike the behavior of the mixture under compression, the flexural strength of the mixtures, i.e., FA60-SA40 and 70FA-30SA, increased with an increase in fiber quantity (see Figure 15). The flexural strength of FA60-SA40-C4 increases by 50% when the fiber content is raised from 0% to 0.25%. The increase in FS may be due to the development of a friction mechanism between the fly ash and the fibers, depending on the cement content, preventing microcracking. When the particles experience tensile strain during flexure, tensile stress is generated in the fibers due to the bonding and interparticle friction between the cemented matrix and the fibers. Since the fibers possess notable tensile strength, their inclusion yields a positive impact on flexural strength.

3.2.2. Relationship between FS, UCS, and ITS (7 Days or 28 Days)

FS was correlated with the ITS (28 days) and UCS (28 days) values for 60FA-40SA and 70FA-30SA and presented in Figure 16. A linear correlation was found with R2 0.88 between FS and ITS. Similarly, a linear correlation with R2 = 0.57 was established between FS and UCS.

3.3. Cyclic Indirect Tensile Modulus/Resilient Modulus (IDTM)

Figure 17 presents the indirect tensile modulus (IDTM) FA-SA mixture at various cement, fiber, and stress ratios. The cyclic IDT modulus increases with the stress ratio. This is inconsistent with Wen et al. [24] and Biswal et al. [23]. The modulus increases with an increase in cement content· The presence of a stone aggregate also has an effect in increasing the IDT modulus. The IDT modulus value is found to be higher than the beam modulus, which is consistent with Yeo [29].

Effect of Fiber on IDTM

To study the effect of fiber on the IDTM value, a graph was plotted between the IDTM modulus and fiber dosage in percentages, as shown in Figure 18. The IDTM value used in the graph was obtained at an SR value of 0.3 and based on [29]. In Figure 18, a remarkable enhancement of the modulus can be observed up to 0.35% fiber content, and any further addition of fibers has less effect on the modulus. This may be attributed to the development of a greater number of slip surfaces in the mixture matrix. Considering 0.35% as the optimum dosage, a cyclic IDT modulus of 1300 MPa can be used for the mechanistic design of pavement.

3.4. Flexural Modulus

Figure 19 presents the flexural modulus of 60FA-40SA and 70FA-30SA mixtures at 4% and 6% cement dosage. It can be observed in Figure 19 that flexural modulus increases with an increase in the stress ratio, which is also consistent with the studies by Wen et al. [23], Biswal et al. [24], Yeo et al. [29], and Mandal et al. [37]. The flexural modulus of mixtures varies between 538 MPa and 965 MPa. The flexural modulus of 60FA-40SA mixtures is found to be more than 70FA-30SA at a particular cement dosage.

3.4.1. Effect of Fiber on Flexural Modulus

To study the effect of fiber on the FM value, a graph was plotted between the FM modulus and fiber dosage in percentages, as shown in Figure 20. It was observed that FM increased with the addition of fiber up to 0.35%, and further addition of fiber has a minimal effect on FM. However, the FM value increased with an increase in cement content, and an FM value of FA60-SA40 was found to be more than FA70-SA30 for the same cement dosage.

3.4.2. Relationship between Flexural Modulus and Flexural Strength

A power relationship with R2 = 0.78 has been established (shown in Figure 21) between the FM and FS of the 60FA-40SA and 70FA-30SA mix. The data used are where the correlation includes all fiber dosages and cement content.

4. Summary and Conclusions

This study investigated the feasibility of using cement-stabilized fly ash for base layer applications. To enhance the gradation and strength of fly ash (FA), it was combined with stone dust and aggregate (SA). The FA-SA mixture was stabilized using varying cement dosages, and PP fiber was added in different quantities to mitigate brittleness. The primary focus of this study was on assessing the strength and stiffness properties of fiber-reinforced cement-stabilized FA-SA mixtures.
The key findings of the study are as follows. First, the addition of stone dust and aggregate not only improved the gradation of the FA-SA mixture but also increased its unconfined compressive strength (UCS). Moreover, the UCS exhibited a linear increase with higher cement content. The UCS showed an initial increase from 0% fibers to 0.25% fibers but decreased with further fiber additions. The introduction of fiber-enhanced ductility prevented brittle failure, with an optimal fiber dosage of 0.25%. Additionally, we found that the 28-day UCS was significantly higher than the 7-day UCS, indicating a slow strength gain nature. Therefore, we recommend considering the 28-day UCS for assessing the suitability of stabilized bases or subbases.
Continuing with the findings, the 28-day UCS of mixtures comprising 70% FA and 30% SA and 60% FA and 40% SA, both with 6% cement, exceeded 4.50 MPa. This meets the compressive strength criteria for base layers set out by IRC SP: 89 (2010). In contrast to compressive strength, indirect tensile strength consistently increased with higher fiber content, attributed to beneficial interfacial mechanical interactions between fibers and the fly ash matrix. A strong linear relationship was established between indirect tensile strength and unconfined compressive strength. The cyclic IDT modulus exhibited an increase with the stress ratio, surpassing the beam modulus. Furthermore, a remarkable enhancement of the modulus was observed up to 0.35% fiber content, beyond which additional fibers had a diminishing effect. This optimal dosage of 0.35% can be used for the mechanistic design of pavement. Lastly, a robust power relationship was established between flexural strength and fiber matrix interaction.
Based on a comprehensive experimental program conducted to characterize the fiber-reinforced cement-stabilized FA-SA mixture, it can be concluded that the material can be used in the base/subbase layer of the pavement. The usage of this material will not only promote sustainable construction practices but also reduce the cost of the project, as it uses fly ash in large quantities, which is chiefly available.

5. Limitation

As per IRC SP: 89 (2010), stabilized material needs to satisfy both the minimum UCS strength criteria and wet–dry durability criteria. In this paper, the data related to the durability study of the mixture were not presented, as they are out of the paper’s scope. All the durability-related findings will be published in another paper.

6. Future Scope of Study

The stabilized layer of a pavement predominantly fails due to fatigue, which occurs due to repeated loading and the development of cracks and other structural damage in the pavement material over time. Thus, the fatigue failure of the fiber-reinforced cement-stabilized aggregate and stone dust mixture can be analyzed by cyclic flexure or a cyclic indirect tensile test.
Further to this, the abrasion properties of the stabilized fly ash mixture can be studied in the future, as a pavement with high abrasion resistance is less prone to surface damage and rutting.

Author Contributions

Conceptualization, D.R.B. and S.K.M.; methodology, D.R.B.; software, B.B.; validation, B.G.M., H.S. and R.P.; formal analysis, D.R.B.; investigation, D.R.B.; resources, S.K.M.; data curation, H.S.; writing—original draft preparation, D.R.B.; writing—review and editing, D.R.B.; visualization, H.S.; supervision, D.R.B.; project administration, H.S.; funding acquisition, H.S. All authors have read and agreed to the published version of the manuscript.

Funding

This research received no external funding.

Data Availability Statement

All data included in the manuscript. No separate data are available for this manuscript.

Conflicts of Interest

The authors declare no conflict of interest.

References

  1. CEA. Report on Fly Ash Generation at Coal/Lignite Based Thermal Power Stations and Its Utilization in the Country for the Year 2021–22. Available online: http://www.cea.nic.in (accessed on 24 April 2023).
  2. Zabielska-Adamska, K. Laboratory Compaction of Fly Ash and Fly Ash with Cement Additions. J. Hazard. Mater. 2008, 151, 481–489. [Google Scholar] [CrossRef] [PubMed]
  3. Šešlija, M.; Rosić, A.; Radović, N.; Vasić, M.; Đogo, M.; Jotić, M. Laboratory testing of fly ash. Tech. Gaz. 2016, 23, 1839–1848. [Google Scholar] [CrossRef]
  4. Lav, A.H.; Lav, M.A.; Göktepe, A.B. Analysis and Design of a Stabilized Fly Ash as Pavement Base Material. Fuel 2006, 85, 2359–2370. [Google Scholar] [CrossRef]
  5. Kumar, M.A.; Prasad, D.S.V.; Raju, G.P. Performance Evaluation of stabilized fly ash subbases. J. Eng. Appl. Sci. 2010, 5, 50–57. [Google Scholar]
  6. Patil, N.R.; Kulkarni, D.; Talegaonkar, S.D. Economical Pavement Design by Stabilizing Effect of Fly Ash and Lime. Indian J. Res. 2012, 2, 121–124. [Google Scholar] [CrossRef]
  7. Amhadi, T.; Assaf, G.J. Improvement of Pavement Subgrade by Adding Cement and Fly Ash to Natural Desert Sand. Infrastructures 2021, 6, 151. [Google Scholar] [CrossRef]
  8. Kelechi, S.E.; Adamu, M.; Uche, O.A.U.; Okokpujie, I.P.; Ibrahim, Y.E.; Obianyo, I.I. A Comprehensive Review on Coal Fly Ash and Its Application in the Construction Industry. Cogent Eng. 2022, 9, 2114201. [Google Scholar] [CrossRef]
  9. Shahu, J.T.; Patel, S.J.; Senapati, A.K. Engineering Properties of Copper Slag–Fly Ash–Dolime Mix and Its Utilization in the Base Course of Flexible Pavements. J. Mater. Civ. Eng. 2013, 25, 1871–1879. [Google Scholar] [CrossRef]
  10. Bakare, M.D.; Pai, R.R.; Patel, S.; Shahu, J.T. Environmental Sustainability by Bulk Utilization of Fly Ash and GBFS as Road Subbase Materials. J. Hazard. Toxic Radioact. Waste 2019, 23, 04019011. [Google Scholar] [CrossRef]
  11. Pai, R.R.; Bakare, M.D.; Patel, S.J.; Shahu, J.T. Structural Evaluation of Flexible Pavement Constructed with Steel Slag–Fly Ash–Lime Mix in the Base Layer. J. Mater. Civ. Eng. 2021, 33, 04021097. [Google Scholar] [CrossRef]
  12. Usmen, M.; Bowders, J.J. Stabilization Characteristics of Class F Fly Ash. Transp. Res. Rec. 1990, 1288, 59–69. [Google Scholar]
  13. Ghosh, A.; Subbarao, C. Strength Characteristics of Class F Fly Ash Modified with Lime and Gypsum. J. Geotech. Geoenviron. Eng. 2007, 133, 757–766. [Google Scholar] [CrossRef]
  14. Dimter, S.; Rukavina, T.; Barišić, I. Application of the Ultrasonic Method in Evaluation of Properties of Stabilized Mixes. Baltic J. Road Bridge Eng. 2011, 6, 177–184. [Google Scholar] [CrossRef]
  15. Kaniraj, S.R.; Havanagi, V.G. Behavior of Cement-Stabilized Fiber-Reinforced Fly Ash-Soil Mixtures. J. Geotech. Geoenviron. Eng. 2001, 127, 574–584. [Google Scholar] [CrossRef]
  16. Kumar, P.; Singh, S.P. Fiber-Reinforced Fly ash Subbases in rural Roads. J. Transp. Eng. 2008, 134, 171–180. [Google Scholar] [CrossRef]
  17. Vaidya, M.K.; Chore, H.S.; Kousitha, P.; Ukrande, S.K. Geotechnical characterization cement-fly ash-fiber mix. J. Mech. Civ. Eng. 2015, 1, 60–66. [Google Scholar]
  18. Li, L.; Zhang, J.; Xiao, H.; Zhi, H.; Wang, Z. Experimental Investigation of Mechanical Behaviors of Fiber-Reinforced Fly Ash-Soil Mixture. Adv. Mater. Sci. Eng. 2019, 2019, 1050536. [Google Scholar] [CrossRef]
  19. Pasupuleti, V.K.R.; Kolluru, S.K.; Blessingstone, T. Effect of Fiber on Fly-Ash Stabilized Sub Grade Layer Thickness. Int. J. Eng. Technol. 2012, 4, 140–147. [Google Scholar]
  20. Chakrabarti, S.; Kodikara, J. Basaltic crushed rock stabilized with cementitious additives: Compressive strength and stiffness, drying shrinkage, and capillary flow characteristics. Transp. Res. Rec. J. Transp. Res. Board 2003, 1819, 18–26. [Google Scholar] [CrossRef]
  21. Paige-Green, P. Recent developments in soil stabilization. In Proceedings of the 19thARRB Transport Research Ltd Conference Sydney, New South Wales, Australia, 7–11 December 1998. [Google Scholar]
  22. Yeo, R.; Jitsangiam, P.; Nikraz, H. Mix Design of Cementitious Basecourse. In Proceedings of the International Conference on Advances in Geotechnical Engineering (ICAGE 2011), Perth, Australia, 7–9 November 2011. [Google Scholar]
  23. Biswal, D.R.; Sahoo, U.C.; Dash, S.R. Mechanical characteristics of cement stabilised granular lateritic soils for use as structural layer of pavement. Road Mater. Pavement Des. 2020, 21, 1201–1223. [Google Scholar] [CrossRef]
  24. Wen, H.; Muhunthan, B.; Wang, J.; Li, X.; Edil, T.; Tinjum, J.M. Characterization of Cementitiously Stabilized Layers for Use in Pavement Design and Analysis; NCHRP Report No. 789, Transportation Research Board: Washington, DC, USA, 2014. [Google Scholar]
  25. ASTM C618; Standard Specification for Coal Fly Ash and Raw or Calcined Natural Pozzolan for Use in Concrete. ASTM International: West Conshohocken, PA, USA, 2022.
  26. IS 8112; Ordinary Portland Cement, 43 Grade—Specification (Second Revision). BIS: New Delhi, India, 2003.
  27. ASTM D1557-12; Standard Test Methods for Laboratory Compaction Characteristics of Soil Using Modified Effort (56,000 ft-lbf/ft3 (2,700 kN-m/m3)). ASTM International: West Conshohocken, PA, USA, 2021.
  28. ASTM D1633; Standard Test Methods for Compressive Strength of Molded Soil-Cement Cylinders. ASTM International: West Conshohocken, PA, USA, 2017.
  29. Yeo, R. The Development and Evaluation of Protocols for the Laboratory characterisation of Cemented Materials; Austroads Publication No. AP–T101/08, ARRB-Australia: Melbourne, Australia, 2008. [Google Scholar]
  30. ASTM D1635; Standard Test Method for Flexural Strength of Soil-Cement Using Simple Beam with Third-Point Loading. ASTM International: West Conshohocken, PA, USA, 2006.
  31. IRC SP:89; Guidelines for the Design of Stabilized Pavement (Part I). IRC: New Delhi, India, 2010.
  32. Arabani, M.; Haghsheno, H. The effect of polymeric fibers on the mechanical properties of cement-stabilized clay soils in Northern Iran. Int. J. Geotech. Eng. 2020, 14, 557–568. [Google Scholar] [CrossRef]
  33. Wang, H.S.; Tang, C.S.; Gu, K.; Shi, B.; Inyang, H.I. Mechanical behavior of fiber-reinforced, chemically stabilized dredged sludge. Bull. Eng. Geol. Environ. 2020, 79, 629–643. [Google Scholar] [CrossRef]
  34. Haghighatjoo, S.M.; Zolfegharifar, S.Y. Effects of fiber type and content on unconfined compressive strength of fiber-reinforced lime or cement-stabilised soils. Geomech. Geoengin. 2022, 17, 1962–1972. [Google Scholar] [CrossRef]
  35. Tang, C.S.; Wang, D.Y.; Cui, Y.J.; Shi, B.; Li, J. Tensile strength of fiber-reinforced soil. J. Mater. Civ. Eng. 2016, 28, 04016031. [Google Scholar] [CrossRef]
  36. Festugato, L.; da Silva, A.P.; Diambra, A.; Consoli, N.C.; Ibraim, E. Modelling tensile/compressive strength ratio of fiber reinforced cemented soils. Geotext. Geomembr. 2018, 46, 155–165. [Google Scholar] [CrossRef]
  37. Mandal, T.; Edil, T.B.; Tinjum, J.M. Study on flexural strength, modulus, and fatigue cracking of cementitiously stabilised materials. Road Mater. Pavement Des. 2008, 19, 1546–1562. [Google Scholar] [CrossRef]
Figure 1. Materials used in the present study.
Jcs 07 00459 g001
Figure 2. Particle size distribution of fly ash and the SA mixture in different proportions.
Jcs 07 00459 g002
Figure 3. Percentages of silt, sand, and gravel in fly ash and the SA mixture in different proportions.
Jcs 07 00459 g003
Figure 6. Seven-day UCS values of various mixtures without fiber.
Jcs 07 00459 g006
Figure 7. Twenty-eight-day UCS values of various mixtures without fiber.
Jcs 07 00459 g007
Figure 8. The UCS of 60FA-40SA mixtures at different fiber %: (a) 70FA-30SA—7 days; (b) 70FA-30SA—28 days; (c) 60FA-40SA—7 days; (d) 60FA-40SA—28 days.
Jcs 07 00459 g008aJcs 07 00459 g008b
Figure 9. Correlation between 7-day and 28-day UCS mixtures: (a) without fiber; (b) with fiber.
Jcs 07 00459 g009
Figure 10. Stress–strain behavior the 7-day cured unreinforced and fiber-reinforced 70FA-30SA mixtures stabilized with 6% cement.
Jcs 07 00459 g010
Figure 11. The ITS of 60FA-40SA and 70FA-30SA at various cement and fiber percentages.
Jcs 07 00459 g011
Figure 12. Strength factor of the 60FA-40SA and 70FA-30SA mixtures.
Jcs 07 00459 g012
Figure 13. Correlation between the UCS and ITS of the 60FA-40SA and 70FA-30SA mixtures.
Jcs 07 00459 g013
Figure 14. FS value of 60FA-40SA and 70FA-30SA at various cement and fiber percentages.
Jcs 07 00459 g014
Figure 15. Effect of fiber content on the FS of 60FA-40SA and 70FA-30SA at different dosage cement percentages.
Jcs 07 00459 g015
Figure 16. Relationship between strength parameters: (a) FS vs. ITS; (b) FS vs. UCS.
Jcs 07 00459 g016
Figure 17. IDTM value of 70FA-30SA: (a) 60FA-40SA with 4% cement; (b) 60FA-40SA with 6% cement; (c) 70FA-30SA with 4% cement; (d) 70FA-30SA with 6% cement.
Jcs 07 00459 g017aJcs 07 00459 g017b
Figure 18. Effect of fiber on the IDTM of 60FA-40SA and 70FA-30SA mix at different dosage cement percentages.
Jcs 07 00459 g018
Figure 19. FM value of 70FA-30SA: (a) 60FA-40SA with 4% cement, (b) 60FA-40SA with 6% cement, (c) 70FA-30SA with 4% cement, (d) 70FA-30SA with 6% cement.
Jcs 07 00459 g019
Figure 20. Effect of fiber on the FM of the 60FA-40SA and 70FA-30SA mix at different dosage cement percentages.
Jcs 07 00459 g020
Figure 21. FM vs. FS for the 60FA-40SA and 70FA-30SA mix.
Jcs 07 00459 g021
Table 1. The chemical composition of fly ash used in this study.
Sl No.Chemical ComponentsPercentage by Weight (%)
1SiO261.34
2Al2O329.54
3Fe2O34.89
4CaO1.05
5MgO0.56
6Na2O0.1
7K2O0.25
8TiO20.67
9P2O50.1
10LOI (Loss on Ignition)1.1
Table 2. Properties of polypropylene fiber (randomly oriented).
PropertiesValue
Material100% Virgin Polypropylene (PP)
Length12.0 +/− 0.25 Mm
Diameter24 Micron (Approx.)
Aspect Ratio500 (Approx.)
Melting Point162 °C
Specific Gravity0.91
Thermal/Electrical ConductivityLow
Alkali Resistance100% Alkali Proof
Disclaimer/Publisher’s Note: The statements, opinions and data contained in all publications are solely those of the individual author(s) and contributor(s) and not of MDPI and/or the editor(s). MDPI and/or the editor(s) disclaim responsibility for any injury to people or property resulting from any ideas, methods, instructions or products referred to in the content.

