Article

Utilization of Spent Coffee Grounds as a Sustainable Resource for the Synthesis of Bioplastic Composites with Polylactic Acid, Starch, and Sucrose

by
Sri Yustikasari Masssijaya
1,
Muhammad Adly Rahandi Lubis
2,
Rossy Choerun Nissa
2,
Yeyen Nurhamiyah
2,
Pramono Nugroho
2,
Petar Antov
3,
Seng-Hua Lee
4,
Antonios N. Papadopoulos
5,*,
Sukma Surya Kusumah
2,* and
Lina Karlinasari
1,*
1
Department of Forest Products, Faculty of Forestry and Environment, IPB University, Dramaga, Bogor 16680, Indonesia
2
Research Center for Biomass and Bioproducts, National Research and Innovation Agency (BRIN), Jalan Raya Bogor Km. 46, Bogor 16911, Indonesia
3
Faculty of Forest Industry, University of Forestry, 1797 Sofia, Bulgaria
4
Department of Wood Industry, Faculty of Applied Sciences, Universiti Teknologi MARA (UiTM), Cawangan Pahang Kampus Jengka, Shah Alam 26400, Malaysia
5
Laboratory of Wood Chemistry and Technology, Department of Forestry and Natural Environment, International Hellenic University, 661 00 Drama, Greece
*
Authors to whom correspondence should be addressed.
J. Compos. Sci. 2023, 7(12), 512; https://doi.org/10.3390/jcs7120512
Submission received: 25 September 2023 / Revised: 22 November 2023 / Accepted: 28 November 2023 / Published: 7 December 2023
(This article belongs to the Section Biocomposites)

Abstract

:
Polylactic Acid (PLA) is a biodegradable polymer, but the cost of PLA is not competitive compared to polyolefins. The development of bioplastic composites by blending PLA with spent coffee grounds (SCG) and thermoplastic starch (TPS) is an effective way to reduce the cost of PLA. This study aimed to investigate and evaluate the feasibility of using SCG to develop bioplastic composite materials with a blend of PLA and TPS. Bioplastics were fabricated with various SCG contents (5, 10, 15 wt%). The physical and mechanical characteristics of the bioplastic composite decreased as the SCG content increased owing to the higher aggregation caused by SCG dust. However, the bioplastics manufactured with the addition of SCG exhibited enhanced crystallinity, resulting in enhanced thermal properties compared to the composites without SCG. The best characteristics of bioplastics, obtained with a 5% SCG addition, were as follows: water vapor transmission rate of 1276 g d/m2, water vapor permeability (WVP) of 1.86256 × 10⁻⁷ g/ms Pa, Young’s modulus of 420 MPa, elongation of 2.59%, and tensile strength of 5 MPa. Based on the results obtained, it can be concluded that the addition of SCG is not recommended for improving the physical and mechanical properties of bioplastics. However, owing to its large content of organic compounds, SCG represents a promising and low-cost functional material that can be exploited in the development of various value-added products.

1. Introduction

The increased industrial interest in the development of advanced biodegradable polymeric materials with engineered properties is driven by the growing demand for novel biobased materials for a variety of value-added applications [1]. Biodegradable polymeric materials are commonly used as medical products and food packaging [2]. Examples of biodegradable polymers include polylactic acid (PLA), polyhydroxyalkanoates (PHAs), poly hydroxybutyrate-valerate (PHBV), and poly (butylene succinate) (PBS) [3,4,5]. PLA is one of the most promising biodegradable polymers because of its excellent processability, biocompatibility, strength, clarity, firmness, biodegradability, water solubility, transparency, and oil resistance [6,7,8]. PLA is an aliphatic semicrystalline biopolymer produced from renewable agricultural feedstocks rich in carbohydrates such as corn, sugar beets, and potato starch [9]. PLA is usually used in biomedical applications, such as implant devices, wound dressings, and tissue scaffolds, as well as in food packaging and 3D printing [10,11]. PLA, on the other hand, is deemed to be more expensive than polyolefin or other synthetic industrial materials [7,12,13]. Park et al. [7] and Wang et al. [12] stated that blending PLA with other biodegradable polymers is an effective way to overcome the weakness of PLA.
The production and processing of coffee, considered the second most traded product after petroleum, is associated with the accumulation of significant amounts of by-products, i.e., coffee husks, pulp, silver skin, and spent coffee grounds (SCG). Spent coffee grounds (SCG) are promising candidates for the development of PLA-based biodegradable polymer blends because of their widespread availability and low cost [9,14]. The cost of the final products can be reduced by blending PLA with SCG. According to the Indonesian Statistics Center (2019), the annual production of coffee in Indonesia is estimated at approximately 731.6 tons. SCG is a solid residual by-product obtained from coffee brewing [15]. According to Karmee et al. [14], one ton of green coffee beans can produce approximately 650 kg of SCG. It has become a significant environmental problem because coffee grounds are dumped in landfills, but SCG can also be found in streets, pavements, and riverbeds [16,17]. The huge amounts of SCG generated each year from coffee production require efficient waste management in line with stricter environmental legislative regulations. Thus, there is an increased need to implement proper recycling techniques for this type of organic waste, which would also contribute to the ongoing industrial transition towards a more circular, closed-loop bioeconomy.
Many studies have attempted to recycle SCG as an adsorbent, fertilizer, soil amendment, biofuel, and in fermentation processes [14,18,19,20]. SCG contains proteins, lipids, phenolic compounds, polysaccharides, caffeine, tannins, and polyphenols [20]. A large volume of oxygen is required to decompose the organic structure of SCG [21]. In addition, SCG can be potentially developed as a bioplastic [20]. Bioplastics are a good alternative for controlling the use of conventional plastics, particularly single-use items [22]. SCG has better elongation at break than coffee skin and coffee chaff, according to a few studies that have investigated the usability of SCG for the development of bioplastics [23,24]. Zarrinbakhsh et al. [24] found that the thermal stability of SCG is better than coffee chaff. Yu et al. [11] stated that SCG can be used as a nucleation agent in PLA. The addition of SCG to the PLA-based composite increased the crystallinity. Yu et al. [11] found that the mechanical strength and thermal properties will increase if the material has good crystallinity.
Another drawback of PLA is its brittleness and poor breaking strain [12]. Moustafa et al. [13] stated that PLA requires plasticizing agents to enhance ductility. In the research by Yu et al. [11], voids were discovered in the PLA-SCG composite, which can be avoided by adding thermoplastic starch. Thermoplastic starch (TPS) is a homogeneous material from native starch, blended with plasticizers such as glycerol, sucrose, water, etc. [9,25]. TPS is usually used for short-life plastic applications, such as food packaging [26]. The plasticizer used in this study was glycerol with sucrose addition. Several studies have shown that glycerol has a positive impact on starch [5,26,27]. Glycerol is the most commonly used plasticizer for TPS because of its high boiling point, availability, and low cost [10]. The study found that PLA/TPS blends have no voids because plasticizers soften the amorphous phase, thereby improving the interfacial interaction between the two polymers [9,26]. TPS can also act as a filler and decrease brittleness [28]. The aim of this research work was to blend PLA/TPS with SCG to produce bioplastics with reduced costs. The objective of this research was to improve the thermal properties and ductility of PLA-based polymers in order to develop bioplastic composite materials containing a blend of SCG and TPS.

2. Materials and Methods

2.1. Materials

The materials used in this study were spent coffee grounds (SCG), polylactic acid (PLA), tapioca starch, glycerol, and sucrose. The SCG used was composed of Arabica and Robusta blends with a ratio of 60:40, which were collected from a local coffee shop named the D’Jati coffee (Bogor, Indonesia). Before use, the SCG were oven dried at 60 °C for 24 h. PLA was purchased from Prusa Polymers, the density was 1.24 g/cm3. Tapioca starch was obtained from PT. Umas Jaya Agrotama (Lampung, Indonesia). Extra purity-grade sucrose was purchased from MERCK (Jakarta, Indonesia), and glycerol was purchased from P&G Chemicals (Cincinnati, OH, USA).

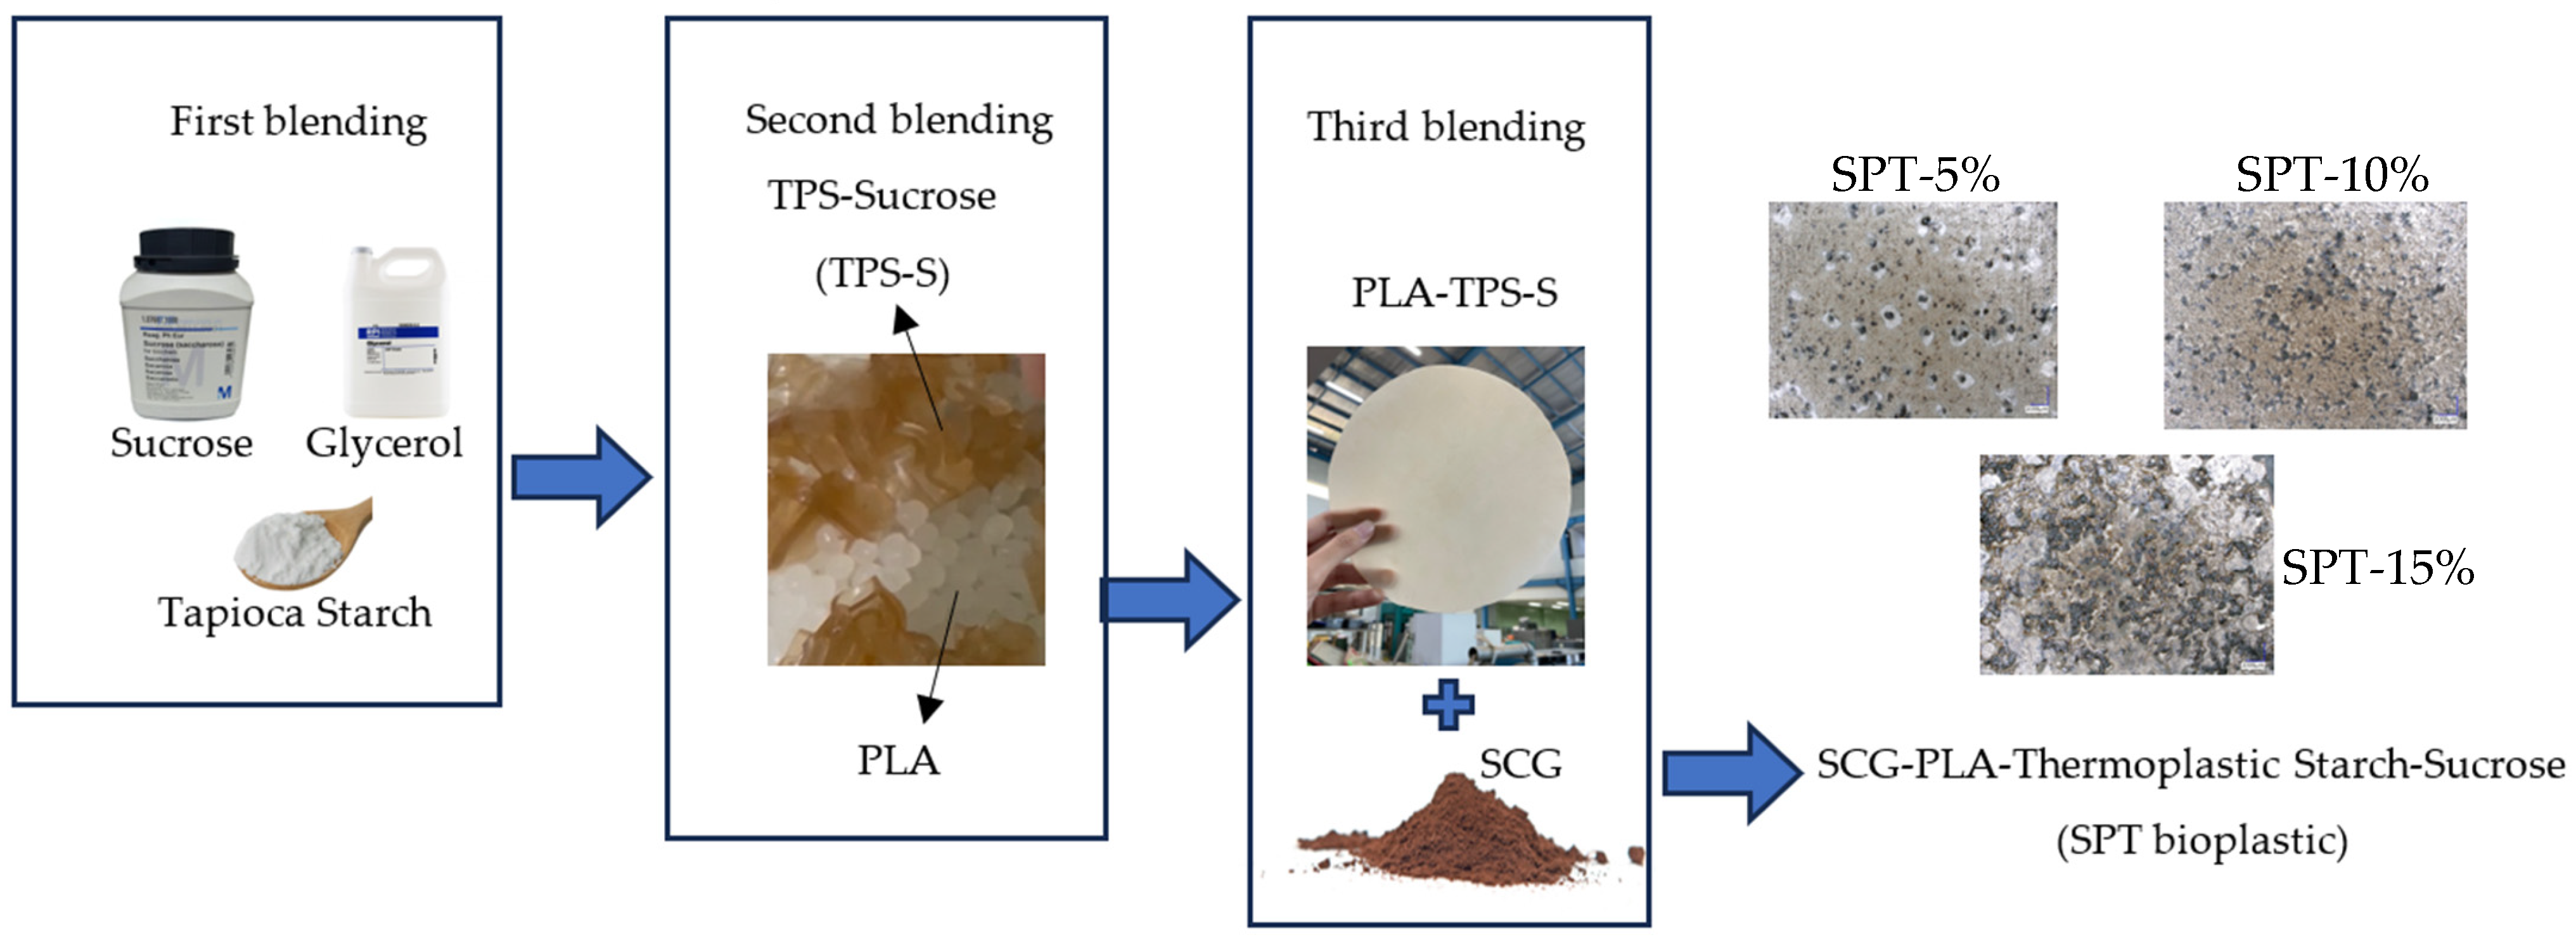
2.2. Development of Bioplastic Composites

Three blending steps were employed in this research work in order to obtain a homogenous material from SCG, PLA, starch, and plasticizers (glycerol and sucrose) (Table 1, Figure 1). In the first step, thermoplastic starch (TPS) was prepared with a starch: glycerol: sucrose ratio of 63/34/3. One batch (50 g) was blended with Haake Rheomix at 135 °C for 10 min. The rotor speed was set at 80 rpm. After the blending process was completed, 10 g of the material was hot-pressed at 135 °C for 5 min, and the material became a TPS bioplastic sheet. The sheet was cut into small pieces and mixed into the next blend.
The second blend was composed of granular PLA and TPS at the ratio of 60:40. The rheomixer temperature was set at 160 °C for 10 min, the rotor speed was set at 80 rpm, and the material was hot-pressed at 160 °C for 5 min. Subsequently, the PLA-TPS bioplastic composite was cut into small pieces.
The third blend was PLA-TPS bioplastic and SCG. There were three variations in the SCG content: 5, 10, and 15 (wt%). The sample (50 g) was blended with rheomixer at 160 °C at a rotor speed of 80 rpm for 10 min. Subsequently, the material was hot pressed at the same temperature and time. The SCG-PLA-TPS (SPT) bioplastic composite was characterized.

2.3. FTIR Analysis

Fourier transform infrared (FTIR) spectroscopy was performed using an FTIR 4000 spectrometer (PerkinElmer Inc., Waltham, MA, USA). The spectra used were in the frequency range 4000–280 cm−1. The samples were prepared by cutting the composite bioplastic into 1 cm × 1 cm pieces. FTIR analysis was performed according to ASTM E2412-10 [29].

2.4. Thermal Properties Analysis

The thermal properties of the SPT bioplastic composites were observed using Differential Scanning Calorimetry (DSC) and thermogravimetric analysis (TGA). TGA was performed using a TGA 8000 (Perkin Elmer Inc., Waltham, MA, USA) from room temperature to 500 °C, at a heating rate of 10 °C/min. DSC analysis was performed using a DSC 4000 (Perkin Elmer Inc., Waltham, MA, USA) from −20 °C to 500 °C at a heating rate of 10 °C/min. Samples were prepared at a concentration of 10 mg. Thermal property analysis was performed according to ASTM E1131-20 [30].

2.5. Water Vapor Transmission Rate (WVTR) and Water Vapor Permeable (WVP) Analysis

The WVTR measurements were performed by observing the weight of the sample eight times. The WVTR sample size was 3 × 3 cm. The sample was placed in the climatic chamber POL-EKO Apatura-type KK500 TOP+ INOX/G (POL-EKO sp.k., Wodzisław Śląski, Poland). Relative humidity (RH) was set to 90% at 25 °C. WVTR was measured using ASTM-E96 [31]. The WVTR and WVP values were determined using the following formulas:
W V T R     g   m 2 d a y = s l o p e   ( g / s ) A   ( m 2 )
where slope is the slope of the linear portion of the plot of weight gain versus time, and A is the sample permeation area.
W V P   g m . s . P a = W V T R × L P
where L is the mean film thickness (m), and P is the partial water vapor pressure difference between the two sides of the film (Pa).

2.6. Mechanical Strength Analysis

The mechanical strength of the SPT bioplastic developed under laboratory conditions was tested using a UCT-5 Universal Testing Machine (Orientec Co., Ltd., Tokyo, Japan). The tests were based on the ASTM D882-12, 2012 standard [32]. The sample was shaped like a dog bone, using Dumbbell Die Cutter. Before testing, the samples were measured using a micrometer screw.

2.7. X-ray Diffraction

X-ray diffraction (XRD) patterns were analyzed at diffraction angles (2θ) ranging from 5 to 65°. Crystallinity was examined using the following equation:
C r y s t a l l i n i t y   i n d e x = t o t a l   a r e a   o f   c r y s t a l l i n e   p e a k s t o t a l   a r e a   o f   t h e   c r y s t a l l i n e   a n d   a m o r p h o u s   p e a k s

2.8. FESEM Analysis

The morphology of the samples was captured using a cellphone, Keyence, and Field Emission Scanning Electron Microscope (FESEM) with a Thermo Scientific Quattro. The sample was cut transversely approximately 0.05 cm then coated with a thin layer of gold using the sputtering method. The samples were analyzed at 1000× magnifications with an acceleration voltage of 10.00 kV and a high-vacuum detector.

2.9. Biodegradability Analysis

The biodegradability analysis was by ASTM G21 [33] using salt agar as the media and Aspergillus niger as the decomposing agent, as referenced in Nissa et al. [19]. The SPT bioplastic was cut into size 1.5 cm × 1.5 cm; every variation was repeated 3 times. The test took 14 days to complete. The equipment was sterilized before testing using an autoclave for 15 min. Stock cultures were obtained from 10 mL sterile aquades mixed with A. niger using a wire loop. Then, 1 mL of stock culture was added to 9 mL of sterile aquades to make a 10−1 culture. Next, 1 mL of the 10−1 culture was added to 9 mL of sterile aquades to get 10−2 culture. One hundred µL of 10−2 culture was placed in a sterile Petri dish. Salt agar was added to each petri dish to a volume of 20 mL. After the salt agar became solid, each SPT bioplastic sample was placed on the surface of the salt agar. Next, 100 µL of 10−2 culture was spread equally on the surface of the SPT sample.

3. Results and Discussion

3.1. FTIR Spectra

FTIR is used to identify the structure of molecules using a spectrum which specifically describes chemical bonds [34]. Figure 2a shows the FTIR results for the SPT bioplastic. In zone 1 (4000–2500 cm−1), peaks were found at 3311 cm−1 indicating an aromatic ring (C-H), and a peak at 2926 cm−1 indicating methylene C-H asymmetry from aliphatic coffee oil [35]. In addition, there was some vibration stretching from O-H groups which correlated with the hydroxyl groups of polysaccharides (e.g., cellulose) and water [20,34,35]. The formation of these peaks was due to the presence of lipids in the SCG [20,35]. There was an expansion of the peak between 3000–3600 cm−1 due to the presence of plasticizers such as glycerol and sucrose. This reduced the bond strength of the polymer chain [27].
In zone 3 (1500–2500 cm−1), a stretch of carbonyl groups (C=O) was found, with a peak at 1748 cm−1 which signifies the presence of hemicellulose and carboxyl group derivatives from xanthine like chlorogenate acid and caffein; it also indicates the interaction with PLA molecules [36,37]. In zone 4 (less than 1500 cm−1), a peak was found at 922 cm−1 which signifies the vibrational stretch from C−O in C−O−H bonds from glycerol (Figure 2a,b). As shown in Figure 2b, SPT bioplastics contain many hydroxyl groups. There are two hydroxyl groups: a fixed-hydroxyl and a free-hydroxyl group. The free hydroxyl group has a weak bond, which can lead to poor physical and mechanical properties [38].
Based on Figure 2a, the PLA-TPS composite had peaks at 1181 and 1080 cm−1. SPT-5%, -10%, and -15% had the same peaks, but they were not as intense as the PLA-TPS composite. The peaks at 1181 and 1080 cm−1 are referred to as the primary and secondary amino groups, respectively. Amino acids can form a peptide bond which can bond to the hydroxyl bond, resulting in better physical and mechanical performance [34].

3.2. Thermal Analysis

TGA is an analytical technique that is used to describe the thermal degradation mechanism [39]. The TGA and derivative weight results for the samples are shown in Figure 3. As the temperature increased, the weight of the sample decreased (Figure 3a), indicating decomposition owing to the application of heat. The weight loss of PLA-TPS occurred significantly at 170 °C, as shown in Figure 3a, indicating a highly degraded composite. The degradation of the SPT composite was gradual (Figure 3a). This indicates that the SPT composite exhibited better thermal degradation than the PLA-TPS. The DTG of the SPT composite was lower than that of the PLA-TPS composite, as shown in Figure 3b. SPT-15% had the lowest DTG at 342 °C, while PLA-TPS had a decomposition temperature of 366 °C (Figure 3b).
Based on the research by Marcilla and Berenguer [40], the thermal results showed that there were four degradation phases. At temperatures of 0–100 °C (first phase/I), water decomposed into the material. The second phase (II) started at 120–240 °C, and glycerol decomposed. A slight appearance of this peak is shown in Figure 3b. For SPT-5%, glycerol decomposition occurred at 96 °C, SPT-10% at 100 °C, and SPT 15% at 106 °C (Figure 3b). The next phase (III) was the decomposition of hemicellulose; there was a significant weight loss in all samples (Figure 3a). As shown in Figure 3b, the curve decreased as the temperature was raised above 300 °C, indicating the complete decomposition of hemicelluloses. SPT-15% had the highest hemicellulose decomposition temperature (342 °C), SPT-10% hemicellulose decomposition temperature of 338 °C, and SPT-5% was 333 °C. In this third phase, the polymer chains were broken, such as α-D-(1→4) from amylose and α-D-(1→6) from amylopectin glycosidic bonds. Temperatures above 300 °C can change amylose and amylopectin molecules into smaller molecules [41]. The final phase (IV) was the fourth phase, during which the sample became charcoal. This occurred when the temperature exceeded 450 °C, and carbon decomposition in the SPT occurred. Pantani and Turng [42] stated that crystallinity plays a crucial role for thermal properties. Table 2 shows that SPT-15% had the highest crystallinity which affected the thermal properties. However, lower residue was observed as the portion of SCG increased (as in SPT-15%). SCG is a material with high hemicellulose content. As the most thermally labile constituent, hemicellulose is easily degraded at high temperatures. Therefore, more weight loss was expected as the portion of SCG increased.
The DSC profiles of the SPT bioplastics are shown in Figure 3c. Yang et al. [43] found that the second heat produced the same bioplastic double peak, it shows the melting point of the sample. The following are some of the elements that contribute to the double peak: (1) the melting, re-crystallization, and remelting processes that occur in response to heat; (2) isomorphism or polymorphism, which typically occur in many crystal forms; (3) differences in lamellar thickness, organization, and shape; and (4) variable molecular weights across various species. The glass transition temperature (Tg) is the temperature at which the amorphous portion of the polymer structure becomes more mobile, causing side groups to slide and rotate [42]. The Tg values of PLA-TPS and SPT-5%, 10%, and 15% were between 58–60 °C. However, neat PLA has a Tg of 59.9 °C [44]. The Tg showed no significant effect as the SCG content increased. Figure 3c shows two peaks that represent the melting point. The melt temperature (Tm) is the temperature at which the material undergoes a viscous liquid transition from its crystal structure [42]. The Tm of SPT-5%, 10%, and 15% were 156 °C, which occurred in the second peaks (Figure 3c). The Tm of the PLA-TPS was 152 °C. Morales et al. [44] found that the melting point of neat PLA is 150 °C. This indicates that SCG can slightly delay the melting of bioplastics.

3.3. WVTR and WVP

A comparison between the WVP and WVTR values of the developed SPT-5%, 10%, and 15% bioplastic composites are shown in Figure 4. A higher SCG content resulted in higher WVP and WVTR values. WVTR describes the amount of water transmitted through the sample per unit area of material and time [45], and WVP is an essential attribute for evaluating the moisture barrier performance of bioplastics. A bioplastic with a low WVP is desirable because it indicates that the bioplastic can limit moisture loss to the atmosphere [46]. The results show that the 5% SPT bioplastic produced the lowest average WVTR (1276 g m−2/d) and WVP (1.86256 × 10⁻⁷ g/ms Pa) among the SPT composites, indicating that the morphology of the material was less porous than that of the 10% and 15% SPT bioplastics. However, the best WVTR and WVP values were obtained using the PLA–TPS composite. Jarvis et al. [47] stated that polymers for packaging application should have a WVTR value 0.1–100 g m−2/d, and for organic electronics, the requirement is under 10 g m−2/d. The WVTR of SPT bioplastics is considered high for packaging and organic electronic applications.
In a previous study, PLA, TPS, and 5% sucrose had a lower WVTR of approximately 628 g m−2/d, PLA-TPS was 352 g m−2/d, and neat PLA was 158 g m−2/d, than the bioplastic with the addition of SCG [48]. Song et al. [45] stated that water transmits more easily in the porous material. SCG dust aggregation causes the material to become porous, resulting in poor WVTR results [11,45]. Another study reported that the WVP of PLA was 0.000252938 × 10⁻⁷ g/ms Pa [48]. The PLA-TPS composite was 0.106059 × 10⁻⁷ g/ms Pa (Figure 4b). Bertuzzi et al. [49] explained that reducing the intermolecular force by adding plasticizers can improve the molecular force. As the SCG content increased, the plasticizer content decreased, causing an increase in the intermolecular force and WVP. Duncan’s test showed that the SPT-5% and 15% were significantly different from the WVTR value, while the SPT-10% did not significantly differ from 5 or 15%. Meanwhile, Duncan’s test of WVP showed significant differences for SPT-5%, 10%, and 15%.

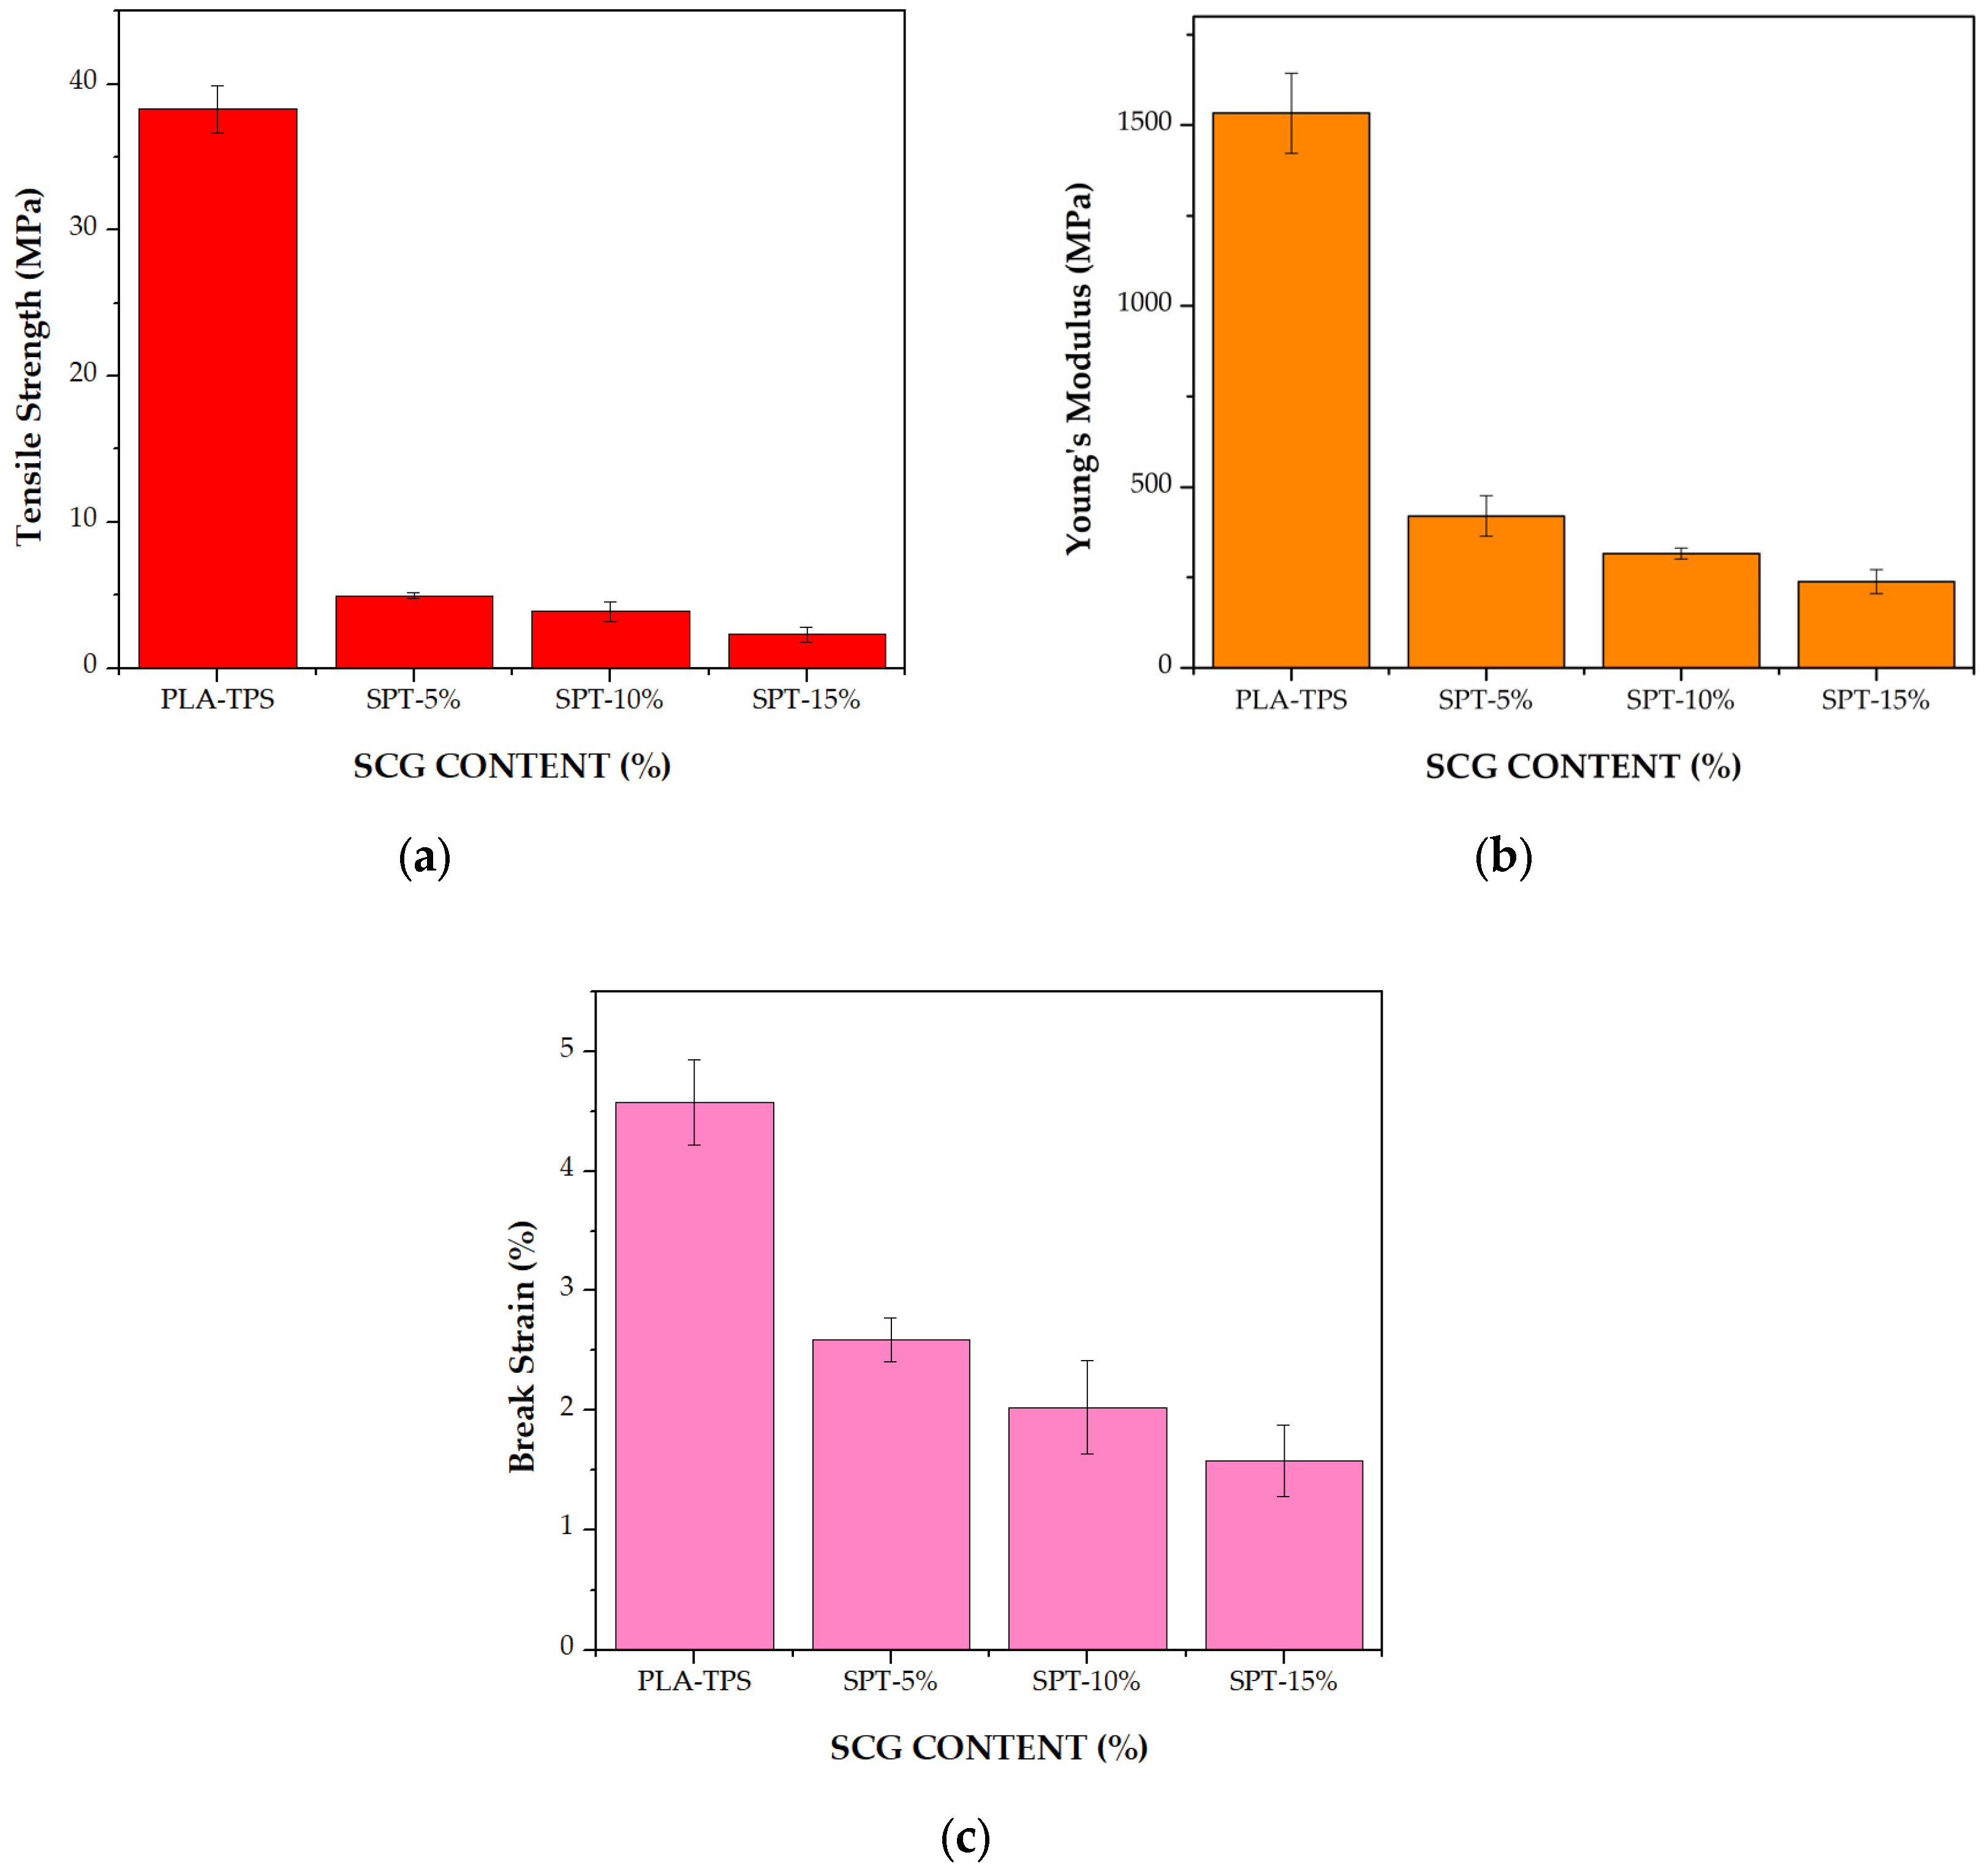
3.4. Mechanical Properties

The mechanical properties of bioplastic SPT-5%,10%, and 15% are shown in Figure 5. The Young’s modulus, break strain, and tensile strength values revealed that the higher the SCG content, the poorer the mechanical properties (Figure 5). Bioplastic SPT with the highest SCG had the lowest Young’s modulus, break strain, and tensile strength. The results of this study were in accordance with those reported by Yu et al. [11]. They found that the addition of more than 5% SCG to PLA decreased Young’s modulus. The high SCG content of the composite made dispersion difficult, causing aggregation and poor homogeneity [50]. Based on the FESEM images shown in Figure 6 SPT-15% had gaps and cracks on its surface. Kowser et al. [51] stated that the properties of bioplastics, especially mechanical properties of bioplastics, are heavily influenced by surface morphology. In our study, PLA-TPS had a higher Young’s modulus (1470 MPa) than that of the SPT bioplastic. The statistical results showed that the addition of SCG at all concentrations significantly affected the Young’s modulus.
The tensile strength is the maximum strength of the material until it breaks [52]. The highest tensile strength of the SPT bioplastics was achieved using SPT-5% (4.9 MPa). Neat PLA has a high tensile strength of 93 MPa, while neat poly l-lactic acid (PLLA) has a tensile strength value of 3.6 MPa [44]. PLA-TPS composites have a tensile strength value of 38.3 MPa (Figure 5b). This significant decrease in the tensile strength was due to the addition of starch. A study [11] found that the tensile strength of PLA-SCG was 34 MPa. This indicated that the addition of TPS decreased the tensile strength. As mentioned previously, starch has many hydroxyl bonds, which decreases the tensile strength of the material. The aggregation of SCG also weakens their tensile strength [11]. The results showed that combining PLA with other materials had a significant impact on the tensile strength. According to the statistical results, the variation in the SCG content differed significantly from the tensile strength value.
The break strain, usually known as elongation strength, is the maximum transposition from a material before it breaks [52]. The elongation results (Figure 5c) of the SPT bioplastic composite showed that the 5% SPT bioplastic yielded the best result (2.6%). This indicates that the 5% SPT bioplastic composite contained more plasticizers than the 10 and 15% SPT bioplastic composites. Plasticizers can improve the viscoelasticity and mobility of molecules in polymer chains [52]. Meanwhile, neat PLA had an elongation strength of 2.8% [48], and PLA-TPS had an elongation strength of 4.45% (Figure 5c). As starch contains many dispersible hydroxyl groups, the intermolecular forces between adjacent polymer chains weaken as the flexibility increases [52,53,54]. Figure 5c shows that the break strain value decreased as the SCG content increased. This indicates that there must be SCG content that causes the adhesion of polymers to become poor. Ma et al. [55] explained that adhesion of polymers could be enhances if the matrix was higher so that the interaction between the polymers would improve. SCG is a dust particle which can lead to a larger total surface area by adding more matrix, allowing the SCG to have a better bond with another polymer [44]. Based on the statistical data, the addition of 5 and 15% SCG was significantly different, while 10% SCG was not significantly different from 5 and 15% SCG.

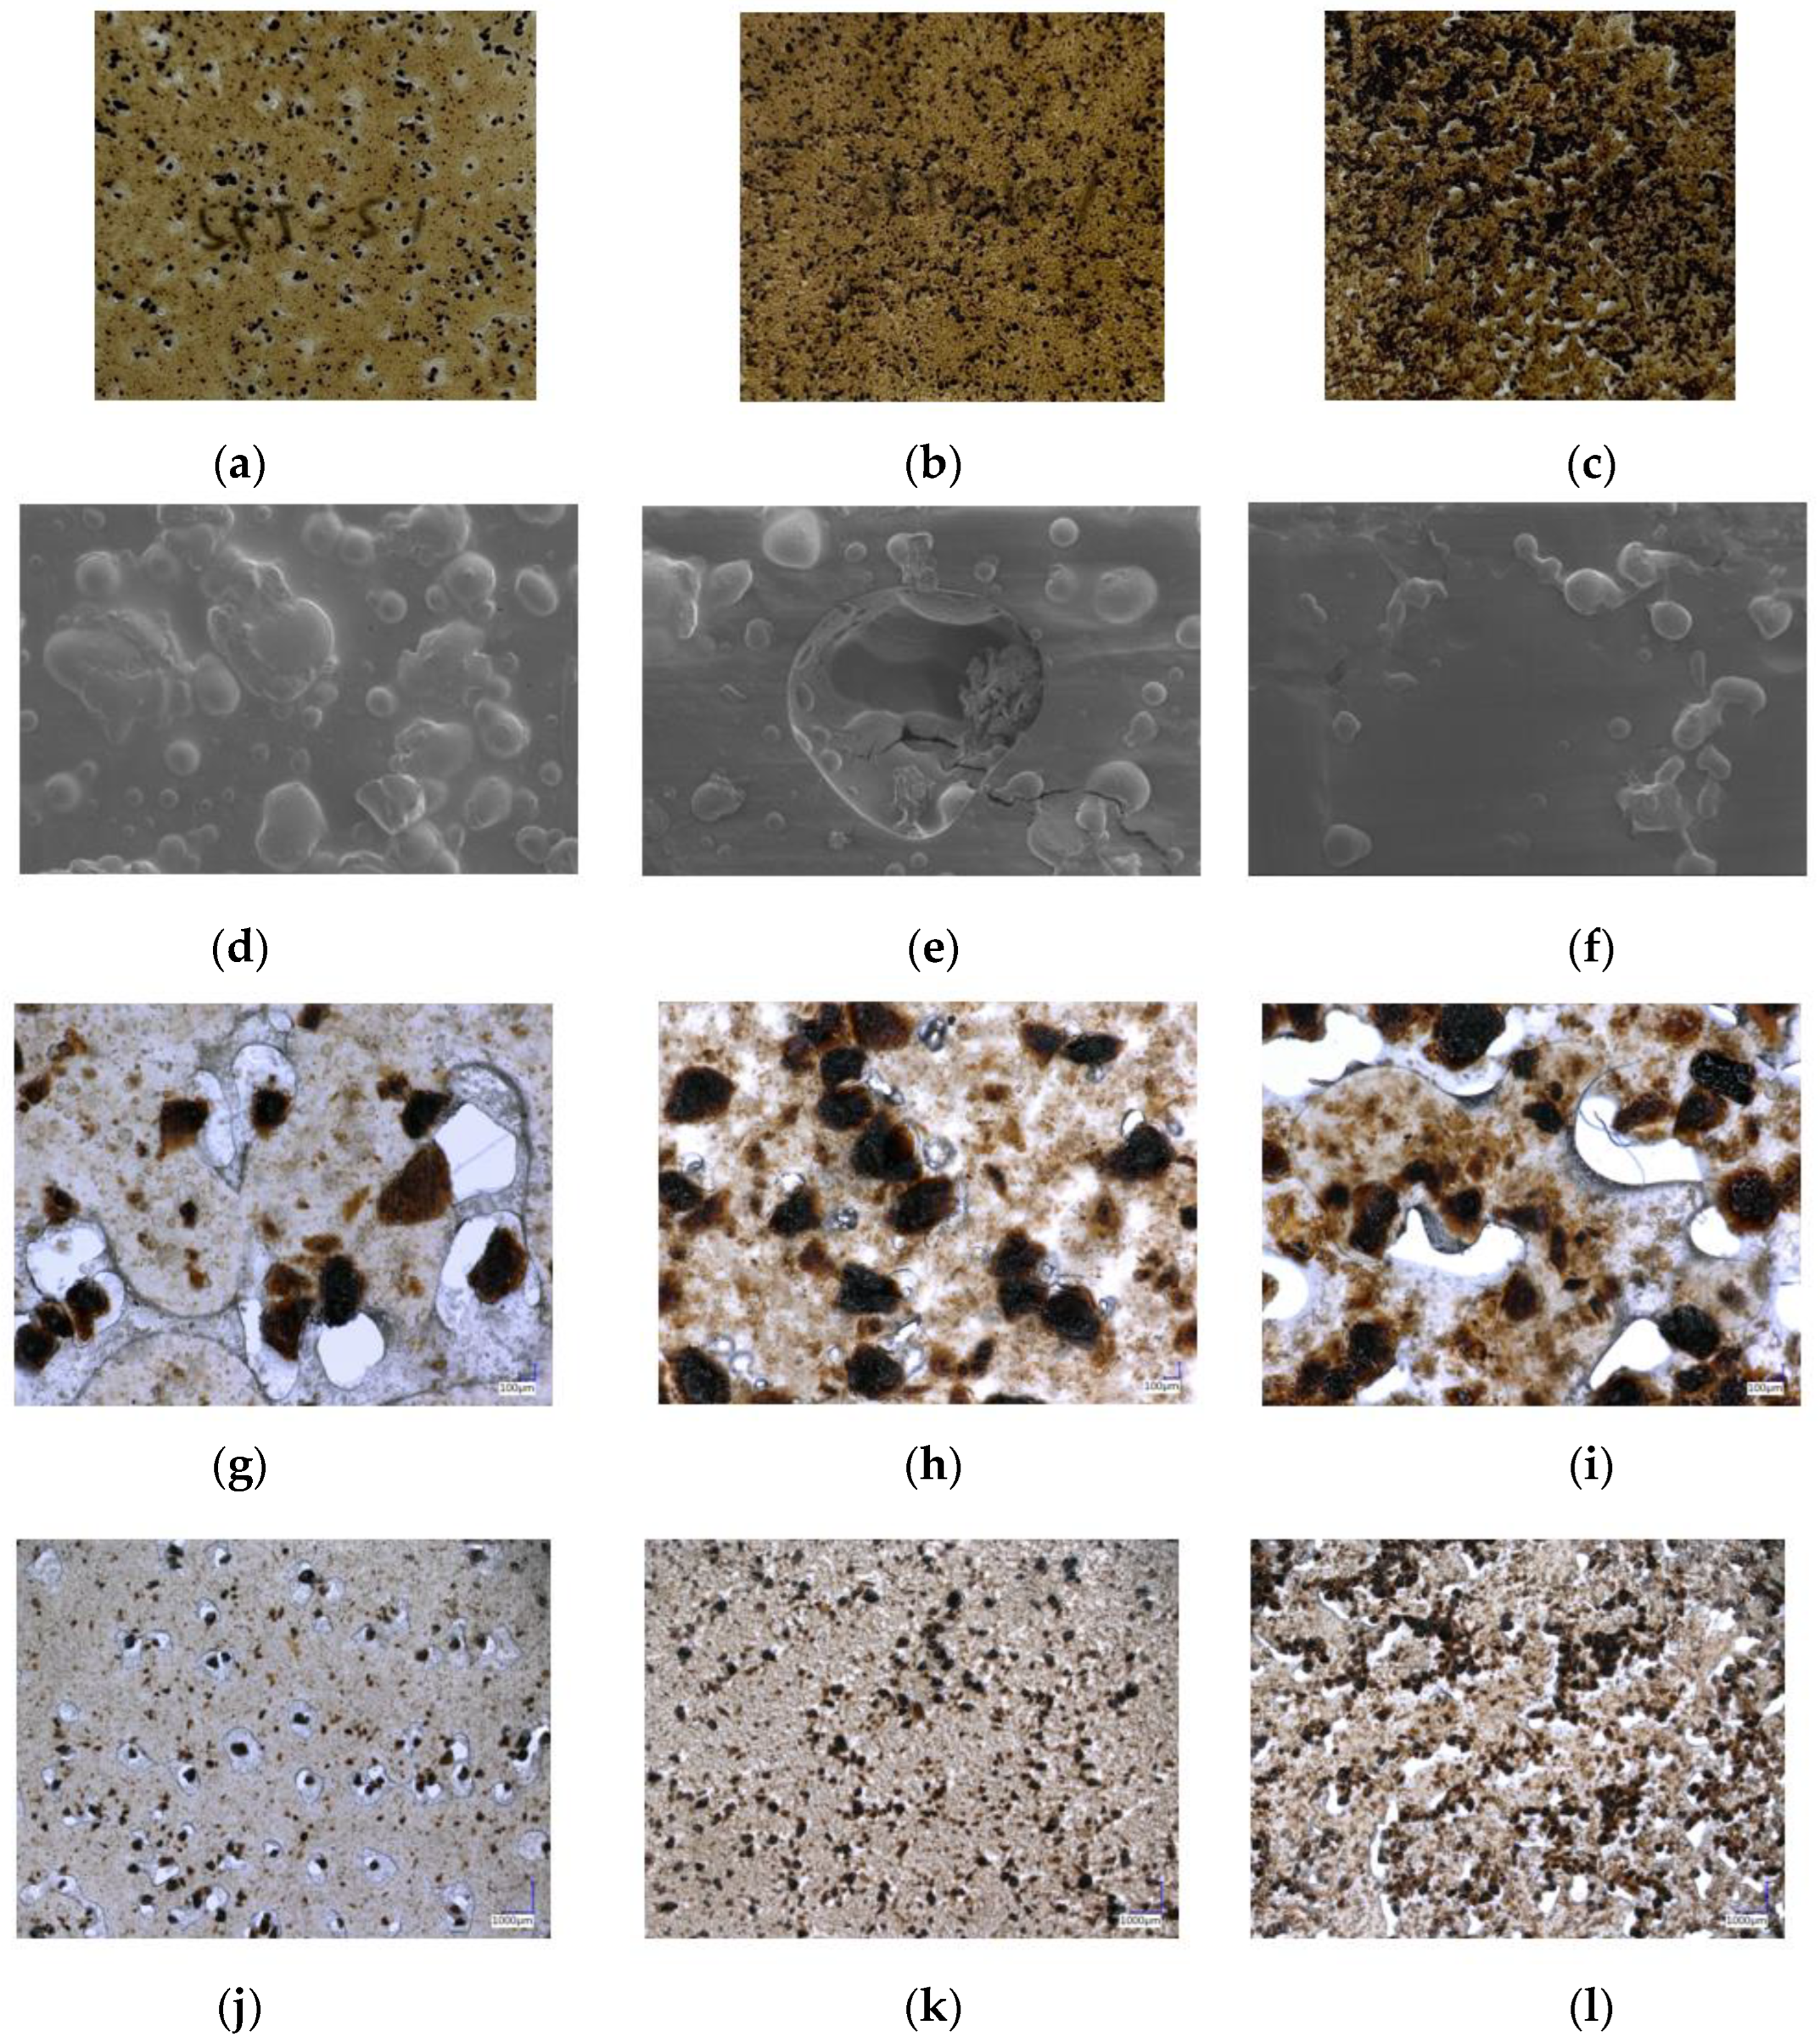
3.5. Morphology of SPT Bioplastic

The morphology of the SPT bioplastic composites was captured using a phone and FESEM at 1000× magnification (Figure 6). Ballesteros et al. [56] found that the SCG morphology is similar to that of a sheet with sawdust. A similar observation was made for the SPT samples in this study. Figure 6a–c show that some of the SCG dust was not degraded by heat. The color of the bioplastics became darker with the addition of SCG. The SCG particle size ranged between 75 and 125 μm. The thickness of the film varied from 2.1 to 2.7 cm. Table 3 displays the densities of the bioplastic composites. Due to high aggregation, the higher the SCG content, the lower the density of the bioplastic composite. The SPT-5% bioplastic specimens exhibited no gaps or cracks. The 10% SPT bioplastic had a gap and the 15% SPT bioplastic had cracks because the adhesion between the polymers was poor; subsequently, the physical and mechanical properties of the developed SPT bioplastic composites were also unsatisfactory [57]. In other studies, [11,45,58,59] it was also found that the interaction force between the particle filler and matrix caused aggregation. Aggregation can also occur because of the strong surface interactions between hydrogen bonds and matrix polysaccharide chains. As shown in Figure 6d–f, the higher the SCG content, the more aggregation occurred in the bioplastics. Yu et al. [11] stated that mechanical and physical properties will improve if SCG is well dispersed in bioplastic. The morphology of bioplastics, such as thickness or drying temperature, is affected by the bioplastic-making process [60].

3.6. X-ray Diffraction (XRD)

XRD was used to observe the crystalline structure of the bioplastic composites. The XRD patterns of all samples are shown in Figure 7, indicating that they are wide and broad. As shown in Figure 6, all samples had an amorphous structure [11]. The crystallinity indices are listed in Table 2. SPT-15% had the highest degree of crystallinity among all the samples tested. This demonstrated that the crystallinity of the material increased slightly after the addition of SCG. PLA has four crystal modifications: α-, α’, β-, and γ-forms [61]. The PLA peak at 2θ = 16.2° indicates an α’-crystalline phase with a lower packing density owing to incomplete crystallization [11,61]. Figure 6 shows that the peak of all the SPT bioplastic samples moved from 2θ = 16.2° to 2θ = 17.2°, due the aggregation of SCG particles.

3.7. Biodegradability

The growth of A. niger is an indicator of the biodegradability of the material. A. niger can easily grow on organic materials such as litter media and decomposing plants [62]. The results of A. niger growth are shown in Table 4. The results revealed that increased SCG content resulted in decreased biodegradability. This is because the higher the SCG content, the lower the starch content. Starch is an organic material that is easily degraded by A. niger [63]. PLA is primarily destroyed by water molecules and hydrolytic breakdown. Water molecules cause the molecular weight to decrease because the ester bond of the PLA chain breaks. As a result, PLA takes longer to be degraded by A. niger. Table 3 shows that the PLA-TPS bioplastic composite was decomposed by A. niger at approximately 68.85% in 14 days. In this study, after 14-day of exposure to A. niger, SPT-5%, -10%, and -15% decomposed at approximately 57.56%, 69.53%, and 72.3%, respectively, indicating comparable or even better biodegradability than the PLA-TPS bioplastic composite.

4. Conclusions

The addition of SCG as an organic and sustainable raw material in the development of PLA-TPS-based bioplastic composites affected their physical and mechanical properties, that is, WVTR, WVP, thermal properties, Young’s modulus, break strain, tensile strength, XRD, morphology, and biodegradability. Higher SCG concentrations resulted in inferior performance of bioplastics. In addition to the thermal properties, the addition of SCGs increased the decomposition temperature. This is important for the applications of bioplastics. The poorer performance of the bioplastics fabricated with the addition of SCG was due to poor crystallinity owing to high aggregation. Based on the results obtained, it can be concluded that the addition of SCG is not recommended for improving the physical and mechanical properties of bioplastics. However, it can be used to improve the decomposition temperature and crystallinity. Owing to its large content of organic compounds (polyphenols, polysaccharides, minerals, fatty acids, and amino acids), SCG represents a promising and low-cost functional material that can be exploited in the development of various value-added products. Future studies in the field should focus on the compatibility between PLA and SCG to improve the homogeneity of bioplastics.

Author Contributions

Conceptualization, S.S.K., L.K. and M.A.R.L.; methodology, S.Y.M., M.A.R.L. and S.S.K.; software, R.C.N. and Y.N.; validation, Y.N. and P.N.; formal analysis, M.A.R.L. and P.A.; investigation, S.Y.M., R.C.N., Y.N. and L.K.; resources, M.A.R.L., S.S.K. and L.K.; data curation, S.S.K. and L.K.; writing—original draft preparation, S.Y.M., M.A.R.L., P.A., S.-H.L., A.N.P. and S.S.K.; writing—review and editing, M.A.R.L., P.A., S.-H.L., A.N.P. and S.S.K.; visualization, S.Y.M., M.A.R.L. and L.K.; supervision, M.A.R.L.; project administration, M.A.R.L.; funding acquisition, S.Y.M., M.A.R.L., S.S.K. and L.K. All authors have read and agreed to the published version of the manuscript.

Funding

This research received funding from the research collaboration project between the Management Talent Research Centre for Biomass and Bioproduct-BRIN with PT. Evogaia Karya Indonesia (Evoware).

Data Availability Statement

The data presented in this study are available on request from the corresponding authors.

Acknowledgments

The authors would like to thank the integrated laboratory of bioproducts (iLaB), Research Centre for Biomass and Bioproduct-BRIN, and PT. Evogaia Karya Indonesia (Evoware).

Conflicts of Interest

The authors declare that this study received funding from PT. Evogaia Karya Indonesia (Evoware). The funder was not involved in the study design, collection, analysis, interpretation of data, the writing of this article or the decision to submit it for publication.

References

  1. Shaik, S.A.; Schuster, J.; Shaik, Y.P.; Kazmi, M. Manufacturing of Biocomposites for Domestic Applications Using Bio-Based Filler Materials. J. Compos. Sci. 2022, 6, 78. [Google Scholar] [CrossRef]
  2. Mastalygina, E.E.; Olkhov, A.A.; Vorontsov, N.V.; Kiselev, N.V.; Khaidarov, T.B.; Khaydarov, B.B.; Kolesnikov, E.A.; Burmistrov, I.N. Influence of Copper-Based Fillers on Structural and Mechanical Properties of Polylactic Acid Composites. J. Compos. Sci. 2022, 6, 386. [Google Scholar] [CrossRef]
  3. Zubir, N.H.M.; Sam, S.T.; Zulkepli, N.N.; Omar, M.F. The Effect of Rice Straw Particulate Loading and Polyethylene Glycol as Plasticizer on the Properties of Polylactic Acid/Polyhydroxybutyrate-Valerate Blends. Polym. Bull. 2018, 75, 61–76. [Google Scholar] [CrossRef]
  4. DeStefano, V.; Khan, S.; Tabada, A. Applications of PLA in Modern Medicine. Eng. Regen. 2020, 1, 76–87. [Google Scholar] [CrossRef]
  5. Wang, N.; Yu, J.; Chang, P.R.; Ma, X. Influence of Citric Acid on the Properties of Glycerol-Plasticized Dry Starch (DTPS) and DTPS/Poly(Lactic Acid) Blends. Starch-Stärke 2007, 59, 409–417. [Google Scholar] [CrossRef]
  6. Kusumaningrum, W.B.; Syamani, F.A.; Suryanegara, L. Heat Properties of Polylactic Acid Biocomposites after Addition of Plasticizers and Oil Palm Frond Microfiber. J. Kim. Sains Dan Apl. 2020, 23, 295–304. [Google Scholar] [CrossRef]
  7. Wuk Park, J.U.N.; Soon, S.I.; Kim, H.; Kim, Y.H. Biodegradable Polymer Blends of Poly(L-Lactic Acid) and Gelatinized Starch. Polym. Eng. Sci. 2000, 40, 2539–2550. [Google Scholar] [CrossRef]
  8. Shahavi, M.H.; Selakjani, P.P.; Abatari, M.N.; Antov, P.; Savov, V. Novel Biodegradable Poly (Lactic Acid)/Wood Leachate Composites: Investigation of Antibacterial, Mechanical, Morphological, and Thermal Properties. Polymers 2022, 14, 1227. [Google Scholar] [CrossRef]
  9. Martinez Villadiego, K.; Arias Tapia, M.J.; Useche, J.; Escobar Macías, D. Thermoplastic Starch (TPS)/Polylactic Acid (PLA) Blending Methodologies: A Review. J. Polym. Environ. 2022, 30, 75–91. [Google Scholar] [CrossRef]
  10. Kaseem, M.; Hamad, K.; Deri, F. Thermoplastic Starch Blends: A Review of Recent Works. Polym. Sci. Ser. A 2012, 54, 165–176. [Google Scholar] [CrossRef]
  11. Yu, W.; Yuan, T.; Yao, Y.; Deng, Y.; Wang, X. PLA/Coffee Grounds Composite for 3D Printing and Its Properties. Forests 2023, 14, 367. [Google Scholar] [CrossRef]
  12. Wang, N.; Yu, J.; Chang, P.R.; Ma, X. Influence of Formamide and Water on the Properties of Thermoplastic Starch/Poly(Lactic Acid) Blends. Carbohydr. Polym. 2008, 71, 109–118. [Google Scholar] [CrossRef]
  13. Moustafa, H.; Guizani, C.; Dufresne, A. Sustainable Biodegradable Coffee Grounds Filler and Its Effect on the Hydrophobicity, Mechanical and Thermal Properties of Biodegradable PBAT Composites. J. Appl. Polym. Sci. 2017, 134, 1–11. [Google Scholar] [CrossRef]
  14. Karmee, S.K. A Spent Coffee Grounds Based Biorefinery for the Production of Biofuels, Biopolymers, Antioxidants and Biocomposites. Waste Manag. 2018, 72, 240–254. [Google Scholar] [CrossRef] [PubMed]
  15. Atabani, A.E.; Al-Muhtaseb, A.H.; Kumar, G.; Saratale, G.D.; Aslam, M.; Khan, H.A.; Said, Z.; Mahmoud, E. Valorization of Spent Coffee Grounds into Biofuels and Value-Added Products: Pathway towards Integrated Bio-Refinery. Fuel 2019, 254, 115640. [Google Scholar] [CrossRef]
  16. Mak, S.L.; Wu, M.Y.T.; Chak, W.Y.; Kwong, W.K.; Tang, W.F.; Li, C.H.; Lee, C.C.; Li, C.Y. A Feasibility Study on Making Polylactic Acid (PLA) Polymers by Using Spent Coffee Ground. Sustainability 2023, 15, 13498. [Google Scholar] [CrossRef]
  17. Talalaj, I.A.; Biedka, P. Use of the Landfill Water Pollution Index (LWPI) for Groundwater Quality Assessment near the Landfill Sites. Environ. Sci. Pollut. Res. 2016, 23, 24601–24613. [Google Scholar] [CrossRef]
  18. Thoppil, Y.; Zein, S.H. Techno-Economic Analysis and Feasibility of Industrial-Scale Biodiesel Production from Spent Coffee Grounds. J. Clean. Prod. 2021, 307, 127113. [Google Scholar] [CrossRef]
  19. Zdanowicz, M.; Rokosa, M.; Pieczykolan, M.; Antosik, A.K.; Chudecka, J.; Mikiciuk, M. Study on Physicochemical Properties of Biocomposite Films with Spent Coffee Grounds as a Filler and Their Influence on Physiological State of Growing Plants. Int. J. Mol. Sci. 2023, 24, 7864. [Google Scholar] [CrossRef]
  20. Coelho, G.O.; Batista, M.J.A.; Ávila, A.F.; Franca, A.S.; Oliveira, L.S. Development and Characterization of Biopolymeric Films of Galactomannans Recovered from Spent Coffee Grounds. J. Food Eng. 2020, 289, 110083. [Google Scholar] [CrossRef]
  21. Saberian, M.; Li, J.; Donnoli, A.; Bonderenko, E.; Oliva, P.; Gill, B.; Lockrey, S.; Siddique, R. Recycling of Spent Coffee Grounds in Construction Materials: A Review. J. Clean. Prod. 2021, 289, 125837. [Google Scholar] [CrossRef]
  22. Kuété, M.A.; Velthem, P.V.; Ballout, W.; Klavzer, N.; Nysten, B.; Ndikontar, M.K.; Pardoen, T.; Bailly, C. Eco-Friendly Blends of Recycled PET Copolymers with PLLA and Their Composites with Chopped Flax Fibres. Polymers 2023, 15, 3004. [Google Scholar] [CrossRef] [PubMed]
  23. Gigante, V.; Seggiani, M.; Cinelli, P.; Signori, F.; Vania, A.; Navarini, L.; Amato, G.; Lazzeri, A. Utilization of Coffee Silverskin in the Production of Poly(3-Hydroxybutyrate-Co-3-Hydroxyvalerate) Biopolymer-Based Thermoplastic Biocomposites for Food Contact Applications. Compos. Part A Appl. Sci. Manuf. 2021, 140, 106172. [Google Scholar] [CrossRef]
  24. Zarrinbakhsh, N.; Wang, T.; Rodriguez-Uribe, A.; Misra, M.; Mohanty, A.K. Characterization of wastes and coproducts from the coffee industry for composite material production. Bioresources 2016, 11, 7637–7653. [Google Scholar] [CrossRef]
  25. Ghozali, M.; Meliana, Y.; Fatriasari, W.; Antov, P.; Chalid, M. Preparation and Characterization of Thermoplastic Starch from Sugar Palm (Arenga pinnata) by Extrusion Method. J. Renew. Mater. 2023, 11, 1963–1976. [Google Scholar] [CrossRef]
  26. Rosa, D.S.; Bardi, M.A.G.; Machado, L.D.B.; Dias, D.B.; Silva, L.G.A.; Kodama, Y. Starch Plasticized with Glycerol from Biodiesel and Polypropylene Blends. J. Therm. Anal. Calorim. 2010, 102, 181–186. [Google Scholar] [CrossRef]
  27. Cao, L.; Liu, W.; Wang, L. Developing a Green and Edible Film from Cassia Gum: The Effects of Glycerol and Sorbitol. J. Clean. Prod. 2018, 175, 276–282. [Google Scholar] [CrossRef]
  28. Huneault, M.A.; Li, H. Morphology and Properties of Compatibilized Polylactide/Thermoplastic Starch Blends. Polymer 2007, 48, 270–280. [Google Scholar] [CrossRef]
  29. ASTM E2412-10; Standard Practice for Condition Monitoring of In-Service Lubricants by Trend Analysis Using Fourier Transform Infrared (FT-IR) Spectrometry. American Society for Testing Material: West Conshohocken, PA, USA, 2018.
  30. ASTM E1131-20; Standard Test Method for Compositional Analysis by Thermogravimetry. American Standard and Testing Material: West Conshohocken, PA, USA, 2020.
  31. ASTM E96; Standard Test Methods for Water Vapor Transmission of Materials. American Society for Testing and Material: West Conshohocken, PA, USA, 2017.
  32. ASTM D882-12; 2012 Standard Test Method for Tensile Properties of Thin Plastic Sheeting. American Standard and Testing Material: West Conshohocken, PA, USA, 2012.
  33. ASTM G21-15; Standard Practice for Determining Resistance of Synthetic Polymeric Materials to Fungi. American Standard and Testing Material: West Conshohocken, PA, USA, 2021.
  34. Nandiyanto, A.B.D.; Ragadhita, R.; Fiandini, M. Interpretation of Fourier Transform Infrared Spectra (FTIR): A Practical Approach in the Polymer/Plastic Thermal Decomposition. Indones. J. Sci. Technol. 2023, 8, 113–126. [Google Scholar] [CrossRef]
  35. Zdanowicz, M. Influence of Urea Content in Deep Eutectic Solvents on Thermoplastic Starch Films’ Properties. Appl. Sci. 2023, 13, 1383. [Google Scholar] [CrossRef]
  36. Xu, F.; Yu, J.; Tesso, T.; Dowell, F.; Wang, D. Qualitative and Quantitative Analysis of Lignocellulosic Biomass Using Infrared Techniques: A Mini-Review. Appl. Energy 2013, 104, 801–809. [Google Scholar] [CrossRef]
  37. Chieng, B.W.; Ibrahim, N.A.; Yunus, W.M.Z.W.; Hussein, M.Z. Poly(Lactic Acid)/Poly(Ethylene Glycol) Polymer Nanocomposites: Effects of Graphene Nanoplatelets. Polymers 2014, 6, 93–104. [Google Scholar] [CrossRef]
  38. Hadjiivanov, K. Identification and Characterization of Surface Hydroxyl Groups by Infrared Spectroscopy. In Advances in Catalysis; Academic Press Inc.: Cambridge, MA, USA, 2014; Volume 57, pp. 99–318. [Google Scholar]
  39. Carrier, M.; Loppinet-Serani, A.; Denux, D.; Lasnier, J.M.; Ham-Pichavant, F.; Cansell, F.; Aymonier, C. Thermogravimetric Analysis as a New Method to Determine the Lignocellulosic Composition of Biomass. Biomass Bioenergy 2011, 35, 298–307. [Google Scholar] [CrossRef]
  40. Marcilla, A.; Berenguer, D. TGA/FTIR Study of the Decomposition of Heet Tobacco in Presence of Zeolites and Silicate Compounds. Mater. Sci. Eng. B 2023, 295, 116593. [Google Scholar] [CrossRef]
  41. Oluwasina, O.O.; Olaleye, F.K.; Olusegun, S.J.; Oluwasina, O.O.; Mohallem, N.D.S. Influence of Oxidized Starch on Physicomechanical, Thermal Properties, and Atomic Force Micrographs of Cassava Starch Bioplastic Film. Int. J. Biol. Macromol. 2019, 135, 282–293. [Google Scholar] [CrossRef]
  42. Pantani, R.; Turng, L.S. Manufacturing of Advanced Biodegradable Polymeric Components. J. Appl. Polym. Sci. 2015, 132. [Google Scholar] [CrossRef]
  43. Yang, Z.; Li, X.; Si, J.; Cui, Z.; Peng, K. Morphological, Mechanical and Thermal Properties of Poly(Lactic Acid) (PLA)/Cellulose Nanofibrils (CNF) Composites Nanofiber for Tissue Engineering. J. Wuhan Univ. Technol. Mater. Sci. Ed. 2019, 34, 207–215. [Google Scholar] [CrossRef]
  44. Morales, J.; Michell, R.M.; Sommer-Márquez, A.; Rodrigue, D. Effect of Biobased SiO2 on the Morphological, Thermal, Mechanical, Rheological, and Permeability Properties of PLLA/PEG/SiO2 Biocomposites. J. Compos. Sci. 2023, 7, 150. [Google Scholar] [CrossRef]
  45. Song, Z.; Xiao, H.; Zhao, Y. Hydrophobic-Modified Nano-Cellulose Fiber/PLA Biodegradable Composites for Lowering Water Vapor Transmission Rate (WVTR) of Paper. Carbohydr. Polym. 2014, 111, 442–448. [Google Scholar] [CrossRef] [PubMed]
  46. Long, J.; Zhang, W.; Zhao, M.; Ruan, C.-Q. The Reduce of Water Vapor Permeability of Polysaccharide-Based Films in Food Packaging: A Comprehensive Review. Carbohydr. Polym. 2023, 321, 121267. [Google Scholar] [CrossRef] [PubMed]
  47. Jarvis, K.L.; Evans, P.J.; Cooling, N.A.; Vaughan, B.; Habsuda, J.; Belcher, W.J.; Bilen, C.; Griffiths, G.; Dastoor, P.C.; Triani, G. Comparing Three Techniques to Determine the Water Vapour Transmission Rates of Polymers and Barrier Films. Surf. Interfaces 2017, 9, 182–188. [Google Scholar] [CrossRef]
  48. Massijaya, S.Y.; B Laksana, R.P.; Nissa, R.C.; Nurhamiyah, Y.; Irmayanti, M.; Ningrum, R.S.; Kusumah, S.S.; Karlinasari, L. Characterization of PLA-Based Biopolymer Composite Physical Properties with Addition of Sucrose. In Proceedings of the International Conference on Biomass and Bioenergy 2023, Bogor, Indonesia, 7–8 August 2023. [Google Scholar]
  49. Bertuzzi, M.A.; Castro Vidaurre, E.F.; Armada, M.; Gottifredi, J.C. Water Vapor Permeability of Edible Starch Based Films. J. Food Eng. 2007, 80, 972–978. [Google Scholar] [CrossRef]
  50. Ozyhar, T.; Baradel, F.; Zoppe, J. Effect of Functional Mineral Additive on Processability and Material Properties of Wood-Fiber Reinforced Poly(Lactic Acid) (PLA) Composites. Compos. Part A Appl. Sci. Manuf. 2020, 132, 105827. [Google Scholar] [CrossRef]
  51. Kowser, M.A.; Hossain, S.M.K.; Amin, M.R.; Chowdhury, M.A.; Hossain, N.; Madkhali, O.; Rahman, M.R.; Chani, M.T.S.; Asiri, A.M.; Uddin, J.; et al. Development and Characterization of Bioplastic Synthesized from Ginger and Green Tea for Packaging Applications. J. Compos. Sci. 2023, 7, 107. [Google Scholar] [CrossRef]
  52. Sofiah, Y.; Aznury, M. Melianti Mechanical Properties of Bioplastics Product from Musa Paradisica Formatypica Concentrate with Plasticizer Variables. J. Phys. Conf. Ser. 2019, 1167, 012048. [Google Scholar] [CrossRef]
  53. Ginting, M.H.S.; Lubis, M.; Sidabutar, T.; Sirait, T.P. The Effect of Increasing Chitosan on the Characteristics of Bioplastic from Starch Talas (Colocasia Esculenta) Using Plasticizer Sorbitol. In IOP Conference Series: Earth and Environmental Science; Institute of Physics Publishing: Bristol, UK, 2018; Volume 126. [Google Scholar]
  54. Zhao, X.; Liu, J.; Li, J.; Liang, X.; Zhou, W.; Peng, S. Strategies and Techniques for Improving Heat Resistance and Mechanical Performances of Poly(Lactic Acid) (PLA) Biodegradable Materials. Int. J. Biol. Macromol. 2022, 218, 115–134. [Google Scholar] [CrossRef]
  55. Ma, X.; Chang, P.R.; Yang, J.; Yu, J. Preparation and Properties of Glycerol Plasticized-Pea Starch/Zinc Oxide-Starch Bionanocomposites. Carbohydr. Polym. 2009, 75, 472–478. [Google Scholar] [CrossRef]
  56. Ballesteros, L.F.; Teixeira, J.A.; Mussatto, S.I. Chemical, Functional, and Structural Properties of Spent Coffee Grounds and Coffee Silverskin. Food Bioprocess Technol. 2014, 7, 3493–3503. [Google Scholar] [CrossRef]
  57. Singh, T.; Pattnaik, P.; Kumar, S.R.; Fekete, G.; Dogossy, G.; Lendvai, L. Optimization on Physicomechanical and Wear Properties of Wood Waste Filled Poly(Lactic Acid) Biocomposites Using Integrated Entropy-Simple Additive Weighting Approach. S. Afr. J. Chem. Eng. 2022, 41, 193–202. [Google Scholar] [CrossRef]
  58. Guerrero, P.; Garrido, T.; Leceta, I.; de la Caba, K. Films Based on Proteins and Polysaccharides: Preparation and Physical–Chemical Characterization. Eur. Polym. J. 2013, 49, 3713–3721. [Google Scholar] [CrossRef]
  59. Cataldo, V.A.; Cavallaro, G.; Lazzara, G.; Milioto, S.; Parisi, F. Coffee Grounds as Filler for Pectin: Green Composites with Competitive Performances Dependent on the UV Irradiation. Carbohydr. Polym. 2017, 170, 198–205. [Google Scholar] [CrossRef] [PubMed]
  60. Abelti, A.L.; Teka, T.A. Development and Characterization of Biodegradable Polymers for Fish Packaging Applications. J. Packag. Technol. Res. 2022, 6, 149–166. [Google Scholar] [CrossRef]
  61. Huang, S.; Li, H.; Jiang, S.; Chen, X.; An, L. Crystal Structure and Morphology Influenced by Shear Effect of Poly(l-Lactide) and Its Melting Behavior Revealed by WAXD, DSC and In-Situ POM. Polymer 2011, 52, 3478–3487. [Google Scholar] [CrossRef]
  62. Rilda, Y.; Valeri, A.; Syukri, S.; Agustien, A.; Pardi, H.; Sofyan, N. Biosynthesis, Characterization, and Antibacterial Activity of Ti-Doped ZnO (Ti/ZnO) Using Mediated Aspergillus Niger. S. Afr. J. Chem. Eng. 2023, 45, 10–19. [Google Scholar] [CrossRef]
  63. Nissa, R.C.; Fikriyyah, A.K.; Abdullah, A.H.D.; Pudjiraharti, S. Preliminary Study of Biodegradability of Starch-Based Bioplastics Using ASTM G21-70, Dip-Hanging, and Soil Burial Test Methods. In IOP Conference Series: Earth and Environmental Science; Institute of Physics Publishing: Bristol, UK, 2019; Volume 277. [Google Scholar]
Figure 1. SPT bioplastic making process.
Jcs 07 00512 g001
Figure 2. FTIR Spectra of SPT material (a) and SPT-5%, 10%, and 15% (b).
Jcs 07 00512 g002
Figure 3. TGA curve (a), DTG curve (b), and DSC curve (c) of SPT-5%, 10% and 15%. The I, II, III, and IV in TGA curve is presenting the degradation phases.
Jcs 07 00512 g003
Figure 4. WVTR (a) and WVP (b) results of PLA-TPS and SPT-5%, 10%, and 15%.
Jcs 07 00512 g004
Figure 5. Mechanical properties of bioplastic SPT-5%, 10%, and 15%: Young’s modulus (a), break strain (b), and tensile strength (c).
Jcs 07 00512 g005
Figure 6. Morphology of SPT bioplastic 5% (a), 10% (b), and 15% (c) captured by cellphone, morphology of SPT-5% (d), 10% (e), and 15% (f) with FESEM, 1000× magnification, morphology of SPT-5% (g), 10% (h), and 15% (i) captured by Keyence with 20× magnification, and morphology of SPT-5% (j), 10% (k) and 15% (l) at 100× magnification.
Jcs 07 00512 g006
Figure 7. XRD results of PLA-TPS and SPT-5%, 10%, and 15%.
Jcs 07 00512 g007
Table 1. Composition of the bioplastics fabricated in this study.
Blending StageSample NameMaterial
FirstTPSStarch/glycerol/sucrose (63%/34%/3%)
SecondPLA-TPSPLA/TPS (60%/40%)
ThirdSPT-5%SCG/PLA-TPS (5%/95%)
SPT-10%SCG/PLA-TPS (10%/90%)
SPT-15%SCG/PLA-TPS (15%/85%)
Table 2. Degree of crystallinity calculated from XRD.
SampleDegree of Crystallinity (%)
PLA-TPS6.44
SPT-5%6.20
SPT-10%6.87
SPT-15%6.94
Table 3. Density of PLA-TPS, SPT-5%, -10%, and-15%.
SampleDensity
PLA-TPS0.11569523
SPT-5%0.111961668
SPT-10%0.09486027
SPT-15%0.077971829
Table 4. Day 0 and day 14 of biodegradability tests on SPT-5%, 10%, and 15% by A. Niger.
Sample0 Day14 Day
PLAJcs 07 00512 i001Jcs 07 00512 i002
0%0%
PLA-TPSJcs 07 00512 i003Jcs 07 00512 i004
0%68.85%
SPT-5%Jcs 07 00512 i005Jcs 07 00512 i006
0%57.56%
SPT-10%Jcs 07 00512 i007Jcs 07 00512 i008
0%69.53%
SPT-15%Jcs 07 00512 i009Jcs 07 00512 i010
0%72.3%
Disclaimer/Publisher’s Note: The statements, opinions and data contained in all publications are solely those of the individual author(s) and contributor(s) and not of MDPI and/or the editor(s). MDPI and/or the editor(s) disclaim responsibility for any injury to people or property resulting from any ideas, methods, instructions or products referred to in the content.

