
Taguchi Method Optimization of Water Absorption Behavior by Wheat Straw-Basalt Hybrid Brake Pad Composite


1
Department of Mechanical Engineering, Program of Manufacturing Engineering, Adama Science and Technology University, Adama City P.O. Box 1888, Ethiopia
2
Department of Materials Science and Engineering, Adama Science and Technology University, Adama City P.O. Box 1888, Ethiopia
3
School of Engineering, RMIT University, Melbourne, VIC 3001, Australia
*
Authors to whom correspondence should be addressed.
J. Compos. Sci. 2023, 7(2), 62; https://doi.org/10.3390/jcs7020062
Submission received: 6 January 2023
/
Revised: 29 January 2023
/
Accepted: 2 February 2023
/
Published: 6 February 2023
(This article belongs to the Section Biocomposites)
Abstract
:The application of biomass-derived composite material is in high demand worldwide in various commercial sectors, including automotive, due to its durable, cost-effective, and environment-friendly characteristics. However, one of the limiting factors of biomass-based composites is its higher water absorption capacity compared to commercial synthetic composites. Therefore, this study aimed to optimize the water absorption capacity of biomass-based, wheat straw fiber-basalt hybrid composite brake pad using the Taguchi method by considering the particle size and volume % of the composite compositions. The composite synthesized in this study carried two variations of particle sizes of basalt, wheat straw, steel, river sand, and graphite, as well as two-volume percentages of epoxy resin for optimization. All composites were molded using a compression molding process at compressive pressure of 6 MPa for 2 h curing in a forced convection oven at 100 °C. Water absorption capacity has been determined according to ASTM D570. The wheat straw fiber has been chemically treated with 5 wt.% of sodium hydroxide (NaOH) to remove the impurities, lignin, and hemicellulose and increase the surface area of the fiber, resulting in a larger area of contact between the fiber and the matrix. Elemental analysis, crystallinity, morphology, and mechanical strength of wheat straw fiber-based composites have been determined by XRD, SEM, and compression tests, respectively. The statistical method, analysis of variance (ANOVA), was implemented for Taguchi optimization of the composite compositions. The maximum compressive strength and minimum and maximum water absorption capacity of composites were obtained as 77 MPa, 3.55%, and 26.86%, respectively. From the optimum setting of the confirmation experiment, the optimal water absorption value of 5.718% has been obtained. The optimum particle size of the composite compositions was 1 mm basalt particle, 0.5 mm wheat straw fiber, 1 mm steel particle, 1 mm river sand, 0.5 mm graphite dust particle, and 30 vol% epoxy resin by Taguchi method. The parameter impact of Taguchi ranking on water absorption capacity presented the maximum improvement of water absorption, 10.47%, with river sand particle size.
1. Introduction
The annual output of straw worldwide has exceeded 2.9 billion tons [1]. Of the 2.9 billion tons, 66% is returned directly to the field or incinerated as living energy, 19% for building materials or vegetable production covering materials, 12% as forage for herbivorous livestock, and 3% as raw materials for handicraft making [2]. Ethiopia has three major types of crop straw: barley, wheat, and Teff [3]. Wheat production reaches more than 10 million tons annually. In 2020–2021, the annual production was estimated to be more than 4.6 million metric tons. About 30% of the crop straw is lost every year because of inefficient use of this resource. These unused straws sometimes are burnt or decomposed in the barren land. Straw utilization in livestock is a valuable use of natural resources but causes waste of straw fiber and imposes substantial economic loss to harvesters. This drawback of the lack of knowledge and practical valorization of this resource may tremendously affect Ethiopian agro-national productivity [4]. Therefore, it became important to valorize these agricultural residues effectively and efficiently boost the country’s circular economy [5].
Using natural fibers for the automotive sector, especially brake pad formulation, is a promising area of research and development for agricultural waste valorization. However, the fundamental drawback of cellulosic straw-based composites is their high-water absorption capacity compared to commercial synthetic composites [6]. Hence, the main objective of this study was to make an effort to optimize the water absorption of wheat straw (Triticum aestivum) fiber-based composite for brake pad application. The composite compositions: basalt dust particles, river sand particles, graphite dust particles, and steel particles, were used to study the water absorption property of the produced composite. The optimization technique will be processed by ANOVA analysis of the Taguchi method. This technique is one of the most established and implemented optimization techniques for composite development. The rudimental method of achieving the objectives of this optimization technique is to optimize the particle size of filler materials. Therefore, the filler materials varied in particle sizes, and epoxy resin also varied in volume to achieve optimal water absorption efficiency of the composite. The novelty of this study lies in the application of 5 wt.% NaOH-treated wheat straw fiber-based composite development for the automotive sector, especially brake-pad (transport safety tool) formulation and optimizing the water absorbance capacity using the particle size of composition and volume of epoxy resin by Taguchi method. The Taguchi method is a widely applied technique for analyzing experimental designs. The statistical identification of factors using this method plays a role in any desired response. The factor settings that will give the best possible response through this technique are optimal or best. The basis of the Taguchi model is the cause-effect model [2], which describes the response due to the sum of main effects, the mean value of the response, and the error finally, and that results in the desired response. Various process optimizations have been conducted using this method to resolve process and manufacturing problems combined with ANOVA for predicting the effect of various factors [3,4].
Going back to the primary concern raised in this experimental study, i.e., the water absorption of composite has closely related to the ingredients’ particle size [7]. Therefore, this work has made an effort to optimize the water absorption based on the constituent’s particle size. On the other hand, the screening of friction materials and their mixing ratio have been carefully considered by referring to different works done in the field of brake pad manufacturing. There are different test procedures for water absorption. One of these standard procedures is based on SEA 20/50 and ASTM D570-98 [8]. For example, Bhaskaranand et al. [9] demonstrated that 125 ± 25 µm length and 5.5 µm diameter Rockwool formulated brake pads have 4.30–17.66% water absorption. Aranganathan and Jayashree [10] demonstrated that the water absorption had been increased to a maximum of 17.66% as the rock fiber percentage increased from 0 to 15 wt.% due to porosity, but this composition has not incorporated biomass fibers. Prabhu et al. [3] formulated a Teff straw fiber epoxy composite, and the result showed that water absorption increased by 10% as the Teff straw increased to 20 wt.%. In other studies, investigating water absorption of water/alkali-modified wheat straw fiber, the result was 143.3% and 240.6% higher than that of unmodified fiber. Perhaps this result was not feasible evidence for the conclusion of biomass performance in a composite [1]. Therefore, to improve the water absorption behavior of eco-friendly brake pads, manufacturers have to obtain more knowledge on particle size effect on the optimum water absorption performance of the produced eco-friendly brake pad.
Friction materials have made from a complex matrix of ingredients. Some reports suggest up to 25 constituents may be used in a formulation [11]. Some ingredients are crucial to controlling performance properties, such as physical, absorption, mechanical, and microstructural variation of the friction material. For example, Bhaskaran et al. [11] incorporated 13 ingredients in their formulation. Some of the main constituents in their formulation were Promaxon-D particles, particle sizes 35–85 µm, and inert filler Barite particle sizes 10–100 µm. As a result, the water absorption was found to be 4.63–20.79%. The water absorption increased as wt% of Promaxon-D particles increased, and absorption decreased as wt.% of Barite increased. Ademoh and Adeyemi [12] also investigated friction material from maize husk 21–30 wt.%, epoxy 50–60 wt.%, graphite 5 wt.%, and other materials showed that water absorption of 0.725–1.370% was found, and the increase in water absorption resulted from increasing the wt.% of maize husk from 21.0–30.0%. Other researchers also investigated an organic friction composite of coconut fiber, phenolic resin, graphite, aluminum, titanium oxide, zirconia oxide, hexamethyl tetramine, and silicon carbide. The weight percentage of each ingredient was (10, 40, 5, 15, 11, 2, 6, 11), respectively. From their investigation, the porosity in water was 0.55%, and, compared to the semi-metallic pad, it had 0.65% porosity [13]. Elakhame et al. [14] formulated a brake pad from kenaf fiber 40–50%, phenolic resin, vermiculite, steel wool, and carbon black. As a result, 5.2–10.51% water absorption of the composite was obtained. The result from Elakhame shows high water absorption of kenaf fiber composite needs improvement in future work. Another study also formulated constant 8 wt.% cashew friction dust and other ingredients. They also changed the weight of mullite from 3–5%. The result of their investigation was 7.98% porosity for the hybrid pad and 5.1% porosity for sintered bronze pad has been found [15]. Devnani and Sinha [16] formulated 15% Teff straw fiber mixed with epoxy composite to investigate the effect of the treatment stage of the fiber on the water absorption of the produced sample. Based on this study, the water absorption decreased after modification. Hence, maximum absorption of 6% was reached. Ikpambese et al. [17] formulated friction materials from palm kernel fiber, epoxy resin, graphite, aluminum oxide, and calcium carbonate, and the composition was 10, 40, 29, 6, and 15 wt.%, respectively. The average porosity in the palm kernel-based brake pad was 22% compared with the commercial pad, which had 18% porosity. Irawan et al. [18] also formulated brake pads from Hazelnut Shell, graphite, Mica, silica, rock wool, and 15 other ingredients. The average grain size of the materials in µm was 10–400, respectively. Irawan and his team reported that the Hazelnut shell brake pad absorption was 0.19–0.44%. Another team of researchers also investigated palm kernel shell (PKS), phenolic resin, graphite, steel, and SiC were used to produce brake pads with compositions 35–55%, 20%, 10%, 15%, and 0–20 wt.%, respectively. Composite samples with 100 µm of palm shell had better properties than other samples of particle sizes of 1000µm, 710 µm, and 355 µm of palm shell [19]. Moreover, the larger the particle size palm kernel shell greater water absorption has been observed. Naresh et al. [20] investigated friction material formulation made up of mulberry fiber, phenolic resin, graphite, alumina, and six other ingredients used in different ratios. The result was compared with Kevlar fiber. The water absorption increased from 1.77 to 2.20%, as the mulberry fiber increased from 3 to 12 wt.%. The control brake pad made up of Kevlar fiber had 1.7–1.8% water absorption. This resulted from the increase in wt. percentage of kevlar fiber from 3 to 6%. Afolabi et al. [21] reported that their formulated brake pad made from palm kernel shell and cow bone were reduced percentage water absorption capabilities compared to the standard value of commercial pad 1.14% absorption. These values have been compared with the absorption values of palm kernel shell-based pad 5.05% and cow bone-based pad 5.53% water absorption values [19]. Furthermore, the above commercial pad water absorption was compared to palm kernel shell and Silica hybrid pad 4.26% absorption, palm kernel shell-based pad 5.03% absorption, banana-peel-based pad 3.21% absorption, bagasse-based pad 3.48% absorption [22]. Wang et al. [23] demonstrated formulation from corn straw fiber 0–9 wt.%, Purple 13 wt.%, Phenolic resin 9 wt.%, and seven other ingredients added in their formulation, the density of the produced pad decreased from 2.19 g/cm3 to 1.96 g/cm3 as the weight of corn straw fiber increased from 0 to 9%. Generally, there are two methods of water intake to the composite surface: diffusion and percolation. In diffusion, the random motion has transported water molecules from higher to low concentration areas. The particle sizes of ingredients play a significant role in water absorption [24]. In percolation, water passes through the pores of the composite. Hence, water absorption of the composite depends on the filler material’s particle size. A literature review showed that less attention was given to the water absorption of biomass-based brake pads [25]. Therefore, this research has attempted to demonstrate the effect of particle size on the water absorption of the produced composite and how particle size determines the flow of water into the composite structure.
Research Significance
The significance of this study is to emphasize identifying the particle size that has an impact on the water absorption property of wheat straw fiber-based hybrid composite materials. Lignocellulosic materials have been known to have high water absorption properties compared to crystalline materials such as basalt and river sand. However, the findings of this study have shown that the particle size of the river sand in wheat straw fiber hybrid composite highly influences the water absorption of the composite. This observation leads to the improved water absorption capacity of this river sand-wheat straw fiber hybrid composite material. The absorption improvement has been significantly influenced by the optimum particle size selection of different materials depending on the material aspect regardless of the lignocellulosic material’s high water absorption property. Therefore, optimizing the particle size of each constituent, such as river sand, basalt, steel particle, and graphite, has equally played a role in the water absorption capacity. This phenomenon shows optimizing the size of constituents has a significant advantage in influencing the water absorption property of the hybrid composites for the required application in brake pads. Therefore, the critical property of water absorption can be reduced by selecting the optimal particle size of filler materials, such as river sand and basalt. Furthermore, incorporating these filler materials with plant residues (lignocellulosic) materials has been a promising potential source of alternative materials for hybrid brake pad production and cost reduction of the composite.
2. Materials and Methods
2.1. Materials
The materials in this research on brake pad formulation have been classified into five groups. These groups are fibers, fillers, abrasives, friction modifiers, and binders. Each material has been selected based on brake pad formulation. Wheat straw fiber as fiber, steel particles as filler material, river sand as abrasive material, graphite dust particles as friction modifiers, epoxy resin as binding material, and hardener, methyl-ethyl -ketone peroxide for hardening was used to formulate the composite. NaOH pellets (99% purity) have been received from the BEKAS soap factory and used for wheat straw fiber treatment. The research flow chart has given in Figure 1.
2.2. Chemical (Alkaline) Treatment of Wheat Straw Fiber
Materials were collected and cleaned before they were processed. The materials dried to the required level at about 100 °C before being ground to the required size for analysis. The operating condition of the grinding machine was 300 rpm. The surface treatment process of straw fibers was performed with a 5% sodium hydroxide (NaOH) solution. The treatment parameters were at 1 g fiber loading, half an hour of treatment duration, and a 5% concentrated NaOH solution was used [6]. After the treatment of the biomass, it was washed with distilled water three times to neutralize the pH. Generally, all materials, including straw fiber, were dried in an oven at 100 °C in a forced convection drying oven to remove the moisture content after the grinding process. All materials were sieved to mesh sizes of 0.5 mm and 1 mm for optimization. Generally, after the drying process, the materials were stored based on their particle sizes.
2.3. Characterizations of NaOH-Treated Wheat Straw
2.3.1. The Average Particle Size of Wheat Straw
Average particle size has found in the following steps: (i) grinding, (ii) sieving under five mesh sizes of 250 (60 mesh), 355 (42 mesh), 500 (35 mesh), 710 (24 mesh), and 1000 (≈ 16 mesh) on vibration sieves, (iii) collecting the particles left under each mesh and (iv) obtaining average particle size. The average particle size has been calculated using Equation (1).
where = average particles size, = the ith mesh particle size and n = total no of meshes.
2.3.2. Determination of Bulk Density
For the determination of bulk density, the ASTMD7481-18 standard was used. The bulk density of the grounded materials was found in the following steps: (i) filling particles in the volume cylinder, (ii) registering the volume of the container, (iii) measuring the weight of the container and the particles filled in the container, and (iv) bulk density calculation based on Equation (2).
where = bulk density of the ground material, = the weight of the container and particle material confined in the container and, the weight of the container = the volume of the container
2.3.3. Determination of Moisture Content
Wheat straw kept below 2 mm sized fiber and weighed 5 g was used to determine the water absorption. The straw has dried in an oven at 100 °C until it became a consistent mass, and the mass changes were determined. The moisture content has been determined by using ASTM 2010 standard. The moisture content of wheat straw fiber was calculated using Equation (3).
where w = moisture content of the fiber, = weight of fiber before drying to constant mass = weight of completely dried fiber.
2.3.4. Determination of Water Absorption Capacity of Wheat Straw Fiber
The water absorption of wheat straw fiber was determined based on ASTM D570 standard and in the following steps: (i) measuring the initial dry mass of the sample, (ii) soaking of sample in a water bath for 24 h, (iii) measuring the mass after 24 h, and (iv) calculating water absorption using Equation (4).
where = water absorption of fiber (%), = weight of dry fiber, = weight of the fiber after soaking in water for 24 h.
2.3.5. Crystallinity Analysis by XRD
X-ray diffractometer instrument model XRD-700X-ray diffractometer has been used to analyze the spectrum of the wheat straw fiber. The instrument condition was Cu X-ray tube target, acceleration voltage of 40.0 kV, accelerating current of 30.0 mA, scanning drive axis of 2θ, and a scan range of 10–80° has been used to analyze the crystallinity of wheat straw fiber. The basis of analyzing the diffraction patterns of those materials was to identify the crystal phase minerals and the crystallinity index of the materials. MATCH software has been used for data collection, analysis, and processing of crystallographic information or phase searching.
2.4. Elemental Analysis of Steel Particles
The spectroscopic sample was taken from the steel particles and analyzed on spectrometry for element identification by Energy-dispersive X-ray spectroscopy (JCM-6000 plus, JCM Corporation, OSAKA, Japan). Elemental analysis was performed only for steel particles due to the variation of different metallic elements, which play significant roles in a composite formation.
2.5. Experiment Design
After the characterization of composite compositions, the design of experiment (DoE) technique was applied to attain an optimum particle size of fillers and the volume of epoxy to maintain the variance at low water absorption. In the study, two variations of particle sizes of basalt, wheat straw fiber, steel, and graphite were used. Still, the variation of quantity in vol% of all particle materials has been constantly added in all formulations. On the other hand, the volume of epoxy resin has varied into two values of 20% and 30% to observe the effect of epoxy resin. The experimental results have been analyzed statistically using MINITAB software. The signal-to-noise ratio was determined by statistically analyzing the variables, and analysis of variance (ANOVA) was used to predict factor effects.
Confirmation of Experiments
A confirmation of experiments with triplicates was validated by Taguchi analysis at the end of experiments. The grand average was determined by Equation (5).
where Gab and N represent the grand total absorption capacity (%) and the number of total runs.
The optimum predicted response at the optimum condition, was determined by Equation (6).
The confidence interval for the confirmation experiment has been calculated by Equations (7) and (8).
where, is F value at 95% confidence interval, represents the correlation between N and the total degree of freedom assumed for prediction, r is the number of replications for confirmation experiments and MSe represents error mean square.
2.6. Constituent Material Percentage Compositions
The constituent materials percentage composition has given in Table 1.
2.7. Composite Synthesis by Compression Molding
A molding process has been used to manufacture the composite. Laboratory scale hydraulic press machine model MH-30V 30-ton Capacity (Masada Seisakusho Co., Ltd., Akiruno, Japan) has been used to mold the composite. The molding parameters were 6 MPa molding pressure, 10 min holding time, and 2 h curing at 100 °C inside a forced convection oven. The molded composite was cooled at room temperature in an ambient environment.
2.7.1. Morphological Analysis of Composites
Morphological analyses of composites were performed in two ways: scanning electron microscopy (SEM) and optical microscopy (OM). For SEM analysis, the experiment was performed at acceleration volt 10.00, magnification of ×200 at the field of view 596 µm × 441 µm by JCM-6000 plus (Japan) has been used to investigate sample morphology and distribution of materials on the surface of the composite. The SEM micrograph has been utilized to reveal the consistency and distribution of materials in the composite
For OM, the magnification range was at ×50 to ×1000, scanning area 104 mm × 102 mm, and a halogen lamp by Huvitz HR-300 series (Huvitz Co., Ltd., Anyang, Republic of Korea )was used to analyze the morphology and particle distribution of the composite that has impacted the water absorption behavior of the samples. The sample was analyzed after the polishing stage has performed.
2.7.2. Compressive Strength Analysis of Composites
Compressive strength has been tested according to ISO 611 test procedure. The compression test samples have been cut from the composite friction materials and prepared to the standard procedure.
2.8. Composite Preparation for Water Absorption Experiment
The molded composites were prepared with the specified dimension based on the ASTM D570-98 standard. The size, width × height × thickness of the sample was 20 mm × 30 mm × 5 mm dimension. The prepared composites are presented in Figure 2, where Figure 2a presents composites for the water absorption test and Figure 2b presents the experiment setup of water absorption
Water Absorption of Composite
The water absorption of the composite was determined by the immersion method using the ASTM D570 standard. The specimens were prepared with dimensions of 20 mm × 30 mm × 5 mm size. Composite samples have placed in water at room temperature and atmospheric pressure for 24 h. The samples were removed from the water and weighed on 0.001 g precision analytical digital balance. Then, the soaked samples were weighed again. The water absorption of the samples was calculated using Equation (9).
where: = percentage water absorption, = weight of the composite after soaked in water and = dry weight of the composite.
3. Results and Discussion
The wheat straw fiber size uniformity of wheat straw fiber was uneven because of the significant variation when grounding fiber. The particle size of basalt, steel, river sand, and graphite was chosen to be 0.5 and 1 mm sized particles used for optimization purposes. After determining the average size of the fiber of wheat straw, then it was also 0.5 and 1 mm size fibers used for optimization. The average fiber size of wheat straw fiber was calculated as 0.5 mm. The size range of wheat straw fiber after the bulk grinding process has been found in the range between 0.250 mm and 1 mm in size was collected. The following Table 2 presents the ground wheat straw fiber size variation and the fiber particle’s corresponding mass and bulk density after grounding. This helped to analyze the fiber bulk density variation with the variation of the size of the fiber.
According to the standard test procedure of bulk density measurement described in the methodology section, the bulk density of all samples was measured in the metric unit. 1 mm-sized untreated wheat straw fiber had a water absorption of 378.30%, and the absorption decreased after the treatment to 298.00%. Therefore, the fiber surface has been modified with the chemical treatment process using the sodium hydroxide solution. This change in the absorption property of the fiber is due to the surface changes that occur after treatment. The bulk density of the materials has shown in Table 3.
The average moisture content of wheat straw fiber was 45.178%, and the minimum moisture content was 18.571%, which has closely related to the literature findings. The moisture content property of the wheat straw fiber was not uniform for all treatments. Thus, the treatment time, fiber loading per unit volume of sodium hydroxide solution, and concentration of sodium hydroxide affected the fiber’s physical properties.
The XRD analysis helped to identify the crystal-ordered structure of the wheat straw fiber [5]. The cellulose content and the crystallinity index improved after the fiber treatment. The high-intensity peak was around 22.08°, and additional peaks were visible. The peak height and intensity also increased after the fiber treatment stage, as shown in Figure 3a. The degree of crystallinity calculated using MATCH crystal impact for the modified fiber was 41.96%. The degree of crystallinity before the treatment stage was 35.33%. XRD spectrum in Figure 3 shows the structural deference in the phase analysis of both treated fiber Figure 3a and untreated wheat straw fiber Figure 3b. Generally, from the figure, it was observed that (i) the treated fiber in Figure 3a had high-intensity peaks which were the result of ordered material, and (ii) the phase shift was visible around 30 degrees of angle, which also indicates the structural difference was quite visible after the fiber was modified. Generally, the structural changes of the wheat straw fiber have been desired for improving the fiber matrix adhesion.
Elemental analysis was only performed for steel particles as steel can have a higher Cu range. In contrast, other particles do not contain high metallic compositions which can affect composite formation and performance. Elemental analysis of steel particles aims to identify the amount the percentage of copper (Cu), iron (Fe), and other heavy metals present in the sample. This investigation was carried out to identify the heavy metal content of the produced brake pad sample within the limiting values. The elemental analysis result of steel particles is presented in Table 4. The presence of Cu is within the limiting value.
Taguchi L8 orthogonal experiment has been used for the experiment design of those considered parameters, as shown in Table 5. 0.5 mm and 1 mm was chosen for particle size of all composite composition, and the vol% of epoxy resin was 20% and 30%.
The morphology of SEM shows all constituents with a clear image showing their distribution pattern on the surface of the sample. Figure 4a,b show non-optimal particle distribution. Large pores were visible in both images, contributing to more water absorption. This phenomenon indicates high compaction pressure when the sample is fabricated. In both images, the wheat straw fiber was not ideally reinforced by the composite. This phenomenon also affected the compressive strength of the composite. The particle distribution appeared uniform in samples produced at optimal particle sizes. This phenomenon shows the optimization of particle size also is impacted how particles are uniformly distributed throughout the composite. At the non-optimal condition of particle sizes shown in Figure 5a, the materials hinder each other during the mixing process. The mixture has not been uniformly scattered throughout the composite, leaving large particles concentrated in one region only. Small particles tend to be attached to larger particles, resulting in a non-uniform structure that affects water absorption. The micro-cracks resulting from the lack of integrity caused by the non-optimal distribution of particles have also shown in Figure 5b.
The compressive strength of the composite reached up to 77 MPa, as shown in Figure 6a. The constituents with optimal particle size resulted in good compressive strength. The compressive strength of the composite depends on the particles’ integrity for interlocking each other and the interfacial bonding of constituent materials with the epoxy resin. Generally, the optimum particle size of ingredients performs better than the non-optimal particle size of ingredient materials, as shown in Figure 6b. This incident shows improved compressive strength of the composite achieved with the optimization of the particle size of materials.
Based on the experiment performed on water absorption of composites, the result obtained was closely related to [19], which discussed that, as the particle size of the palm kernel shell increased, the water absorption of the composite also increased. Composite samples with 100 µm of palm shell had lower water absorption of 5.05% than other samples of particle sizes of 1 mm, 710 µm, and 355 µm of palm shell. Similarly, in this study, as the particle size of wheat straw fiber increased from 0.5 mm to 1 mm, the water absorption also increased by 1.024%. The result from the experiment achieved was maximum water absorption of 26.86% and a minimum of 3.55% water absorbency. The optimal value of water absorption in this investigation of confirmation experiment was 5.718%. This value was achieved at a particle size of wheat straw fiber 0.5 mm or 500 µm compared to other studies. For instance, 100 µm of palm shell had a 5.05% water absorption result [19]. The optimum parameter setting based on Taguchi experimental analysis was also determined, and it has successfully been used to optimize the desired minimization of water absorption of the composite. Table 6 shows the result of the water absorption of the samples. Figure 7 also shows the variation of % contribution of size particle materials on water absorption of the composite. A closer look at this % contribution indicates a variation between the particle sizes of each material on water absorption. The Taguchi response table shows the significant variation in water absorption results from the variation of the river sand particles. This result shows that the large particle size of river sand gives less water absorption and has much determining parameters for lower absorption value. It is important to note that wheat straw fiber had a minimum effect on the water absorption property of the composite. This result shows that the variation in size from 0.5 mm to 1 mm wheat straw fiber in the composite had a negligible effect on the absorbency compared to river sand particle size change from 0.5 mm to 1 mm. Ademoh and Adeyemi [12] reported that the water absorption increased by 0.725–1.370% as the wt.% of maize husk increased from 21.0 to 30.0%. According to Naresh et al. [20], an increase in water absorption of less than 1% has been found by wt.% of biomass fiber content increment of 10%. In this study, each constituent particle size change also had a greater than 1% change in the water absorption of the composite. This study found that the particle size of constituents has a significant parameter for water absorption of wheat straw–basalt hybrid composite. In a different approach than the weight percentage change of constituents studied by Naresh et al., another approach by optimization of the particle size of constituent materials in this study significantly minimizes the composite’s water absorption. Figure 8 presents the correlation of average water absorption with particle size and volume changes. The treatment stage followed for modification of the fiber may significantly affect the adhesion of the fiber and matrix. Taguchi rank table of parameters impact on water absorption is shown in Table 7.
There are three optimization options in Taguchi: smaller is better, larger is better, and normal is better. In this study, the smaller, the better case was selected for a lower value of water absorption of the composite. At a 5% significance level, a more significant effect was river sand particle size, as shown in Figure 8.
Using the pooling rule, we can pool SS wheat straw fiber, Adj SS steel particle, and Adj SS graphite dust particle into the error term leaving three effects in the final ANOVA equal to one-half of the number of degrees of freedom of the experiment. Generally, at a 5% level of significance, with pooled error variance, the particle size of river sand shows significance, as shown in Table 8. The optimal levels based on the result from the main effect plot were at particle sizes of materials viz, basalt 1 mm, wheat straw fiber 0.5 mm, steel particle 1 mm, river sand particles 1 mm, graphite dust particle 0.5 mm, and epoxy resin at 30% volume.
The confirmation experiment has been conducted with the resulting optimal levels from Taguchi analysis, and three replications have been made, as shown in Table 9.
For this experiment, 8 runs of composites were repeated three times for each; therefore, the total runs (N) were 24. According to water absorption capacity %, Gab was 280.03. and were calculated as 11.668 and 11.615, respectively. For the confidence interval, was at , the total degree of freedom for prediction was 1, therefore, was (24/(1 + 1)) = 12, r was 3, was 25.79, and the calculated CI was 6.940. The mean obtained from the confirmation experiment (µ) = 5.718 from Table 8. The upper confidence interval limit = 18.555, and the confidence interval lower limit = 4.728. Therefore, 4.728 ≤ µ ≤ 18.555. The obtained value from the confirmation experiment was within the confidence interval, and the validated experiment has been performed.
4. Conclusions and Recommendations
Optimization of water absorbency of composite based on particle size effect of materials on water absorption has been performed. The formulated materials were basalt dust particles, wheat straw fiber, steel particles, river sand particles, graphite dust particles, and epoxy resin, each with two different particle sizes of 0.5 mm and 1 mm used for optimization. The optimization has been performed using the Taguchi technique to analyze the factorial effect on the performance of water absorbency. On the other hand, different tests such as morphological, physical, and mechanical tests have been performed to characterize the property of the produced composite. Based on this study, the following conclusions were drawn.
- The result of the confirmation experiment was based on the optimal parameter found in the Taguchi analysis. The water absorption of wheat straw–basalt hybrid composite has been successfully optimized by considering the particle size of the ingredients for minimization of water absorption.
- SEM and optical microscopy suggested that the distribution of particles and the size of particle materials in the composite highly impacted water absorption. The optimization has significantly reduced the composite high water absorption by improving the sample’s morphology.
- The optimal particle size of material for optimal water absorption of the composite was at sieve sizes of materials viz, basalt 1 mm, wheat straw fiber 0.5 mm, steel particle 1 mm, river sand particles 1 mm, graphite dust particle 0.5 mm, and epoxy resin at 30% volume.
- A river sand particle size contributed 33% of the total variation of water absorption, and it was a highly significant parameter.
- The contribution of other materials for the total variation of water absorption was epoxy resin at 22%, graphite dust particles at 16%, steel particles at 15%, basalt dust particle11%, and wheat straw fiber at 3% was obtained.
- The recommendations for further studies are:
- Further research is recommended to improve the compressive strength of wheat straw fiber-basalt hybrid brake pad composite.
- Further research can be done on different approaches to determine the difference in the output of the different methodologies. For instance, another method of fabricating the composite, other treatments of wheat straw fiber such as acid treatment, thermal treatment, electro-chemical, mechanical or physical treatment, consideration of the effect of treatment and processing of basalt and sand particles, consideration of the impact of the shape of particles of grounded materials on water absorption, compressive strength, and morphology of the composite has to be the future research topic need to be addressed.
- The techno-economic feasibility and life cycle assessment are highly recommended for further study to scale up the composite for practical applications.
Author Contributions
W.M.Y.: Formal analysis, Investigation, Writing—Original Draft; B.S.: Conceptualization, Methodology, Supervision, Writing—review & editing; G.A.: Supervision, Writing—review & editing; N.H.: Writing—review & editing, Funding acquisition. All authors have read and agreed to the published version of the manuscript.
Funding
This research received no external funding.
Data Availability Statement
All the required data is available within the article.
Acknowledgments
The researchers would like to express their gratitude to Alemayehu Wakjira Huluka, Dean of the School of Mechanical, Chemical, and Materials Engineering, and Barisso Bino, HOD, Department of Mechanical Manufacturing Engineering, for providing relevant inspiration, encouragement, and research facilities.
Conflicts of Interest
The authors declare no conflict of interest.
References
- Jiang, D.; An, P.; Cui, S.; Sun, S.; Zhang, J.; Tuo, T. Effect of Modification Methods of Wheat Straw Fibers on Water Absorbency and Mechanical Properties of Wheat Straw Fiber Cement-Based Composites. Adv. Mater. Sci. Eng. 2020, 2020, 5031025. [Google Scholar] [CrossRef]
- Geremew, A.; De Winne, P.; Demissie, T.A.; De Backer, H. Characterization of Wheat Straw Fiber Grown Around Jimma Zone, ETHIOPIA. J. Nat. Fibers 2022, 12, 1–10. [Google Scholar] [CrossRef]
- Prabhu, S.V.; Wilson, V.H.; Anand, K.T.; Jose, S.; Sivamani, S.; Gomadurai, C.; Kifetew, M. Water Absorption Behavior of Teff (Eragrostis tef) Straw Fiber-Reinforced Epoxy Composite: RSM-Based Statistical Modeling and Kinetic Analysis. Adv. Polym. Technol. 2022, 2022, 8188894. [Google Scholar] [CrossRef]
- Akıncıoglu, G.; Akıncıoglu, S.; Oktem, H.; Uygur, İ.U. Brake Pad Performance Characteristic Assessment Methods. Int. J. Automot. Sci. Technol. 2021, 5, 67–78. [Google Scholar] [CrossRef]
- Qasim, U.; Ali, Z.; Nazir, M.S.; Hassan, S.U.; Rafiq, S.; Jamil, F.; Al-Muhtaseb, A.H.; Ali, M.; Niazi, M.B.K.; Ahmad, N.M.; et al. Isolation of Cellulose from Wheat Straw Using Alkaline Hydrogen Peroxide and Acidified Sodium Chlorite Treatments: Comparison of Yield and Properties. Adv. Polym. Technol. 2020, 2020, 9765950. [Google Scholar] [CrossRef]
- Mtibe, A.; John, M.; Andrew, J.; Mokhena, T. Sequential extraction of carbohydrates and lignin from agricultural waste and their structural characterization. Biomater. Polym. Horiz. 2022, 1, 1–15. [Google Scholar] [CrossRef]
- Kumar, M.; Bijwe, J. NAO friction materials with various metal powders: Tribological evaluation on full-scale inertia dynamometer. Wear 2010, 269, 826–837. [Google Scholar] [CrossRef]
- Oladokun, T.O.; Stephen, J.T.; Adebayo, A.; Adeyemi, G.J. Effect of Moulding Pressure on Brake Lining Produced from Industrial Waste Material: Sawdust. Eur. J. Eng. Technol. Res. 2019, 4, 62–68. [Google Scholar] [CrossRef]
- Bhatt, B.; Kalel, N.; Darpe, A.; Bijwe, J. Promaxon-D reinforced brake-pads to ameliorate the noise-vibration performance. Wear 2021, 477, 203808. [Google Scholar] [CrossRef]
- Aranganathan, N.; Bijwe, J. Development of copper-free eco-friendly brake-friction material using novel ingredients. Wear 2016, 352–353, 79–91. [Google Scholar] [CrossRef]
- Bhatt, B.; Kalel, N.; Darpe, A.; Bijwe, J. Role of Promaxon-D in Controlling Tribological Performance of Cu-Free Brake Pads. Metals 2021, 11, 441. [Google Scholar] [CrossRef]
- Ademoh, N.A.; Adeyemi, O.I. Development and Evaluation of Maize Husks (Asbestos-Free) Based Brake Pad. Ind. Eng. Lett. 2015, 5, 67–80. [Google Scholar]
- Pinca-Bretotean, V.; Josan, C.; Putan, A. Testing of brake pads made of non-asbestos organic friction composite on the specialized station. Mater. Today Proc. 2021, 45, 4183–4188. [Google Scholar] [CrossRef]
- Elakhame, Z.U.; Shuaib-Babata, Y.L.; Jimoh, S.O.; Bankole, L.K.; Ambali, I.O. Production and Characterization of Asbestos Free Brake Pads From Kenaf Fiber Composite. Adeleke Univ. J. Eng. Technol. 2020, 3, 69–78. [Google Scholar]
- Kumar, V.V.; Kumaran, S.S.; Dhanalakshmi, S.; Sivaramakrishnan, R. Tribological performance evaluation of fused mullite-reinforced hybrid composite brake pad for defence application. J. Braz. Soc. Mech. Sci. Eng. 2019, 41, 179. [Google Scholar] [CrossRef]
- Devnani, G.; Sinha, S. Epoxy-based composites reinforced with African teff straw (Eragrostis tef) for lightweight applications. Polym. Polym. Compos. 2019, 27, 189–200. [Google Scholar] [CrossRef]
- Ikpambese, K.; Gundu, D.; Tuleun, L. Evaluation of palm kernel fibers (PKFs) for production of asbestos-free automotive brake pads. J. King Saud Univ. Eng. Sci. 2016, 28, 110–118. [Google Scholar] [CrossRef]
- Irawan, A.P.; Fitriyana, A.P.; Tezara, D.F.; Siregar, C.; Hadi, J.P.; Hazim, A.E.; Hamdan, M.; Najid, M. Overview of the Important Factors Influencing the Performance. Polym. J. 2021, 14, 1180. [Google Scholar]
- Adetunji, O.R.; Adedayo, A.M.; Ismailia, S.O.; Dairo, O.U.; Okediran, I.K.; Adesusi, O.M. Effect of silica on the mechanical properties of palm kernel shell based automotive brake pad. Mech. Eng. Soc. Ind. 2022, 2, 7–16. [Google Scholar] [CrossRef]
- Kumar, N.; Natrayan, L.; Kasirajan, G.; Kaliappan, S.; Kamal, M.D.R.; Patil, P.P.; Chewaka, M.D. Development of Novel Bio-mulberry-Reinforced Polyacrylonitrile (PAN) Fibre Organic Brake Friction Composite Materials. Bioinorg. Chem. Appl. 2022, 2022, 6426763. [Google Scholar] [CrossRef]
- Afolabi, M.; Abubakre, O.; Lawal, S.; Raji, A. Experimental Investigation of Palm Kernel Shell and Cow Bone Reinforced Polymer Composites for Brake Pad Production. Int. J. Chem. Mater. Res. 2015, 3, 27–40. [Google Scholar] [CrossRef]
- Idris, U.; Aigbodion, V.; Abubakar, I.; Nwoye, C. Eco-friendly asbestos free brake-pad: Using banana peels. J. King Saud Univ. Eng. Sci. 2015, 27, 185–192. [Google Scholar] [CrossRef]
- Wang, Z.-Y.; Wang, J.; Ma, Y.-H. The Evaluation of Physicomechanical and Tribological Properties of Corn Straw Fibre Reinforced Environment-Friendly Friction Composites. Adv. Mater. Sci. Eng. 2019, 2019, 1562363. [Google Scholar] [CrossRef] [Green Version]
- Zwawi, M. A Review on Natural Fiber Bio-Composites; Surface Modifications and Applications. Molecules 2021, 26, 404. [Google Scholar] [CrossRef]
- Arman, N.S.N.; Chen, R.S.; Ahmad, S. Review of state-of-the-art studies on the water absorption capacity of agricultural fiber-reinforced polymer composites for sustainable construction. Constr. Build. Mater. 2021, 302, 124174. [Google Scholar] [CrossRef]
Figure 1.
Schematic diagram of the overall experimental procedures.
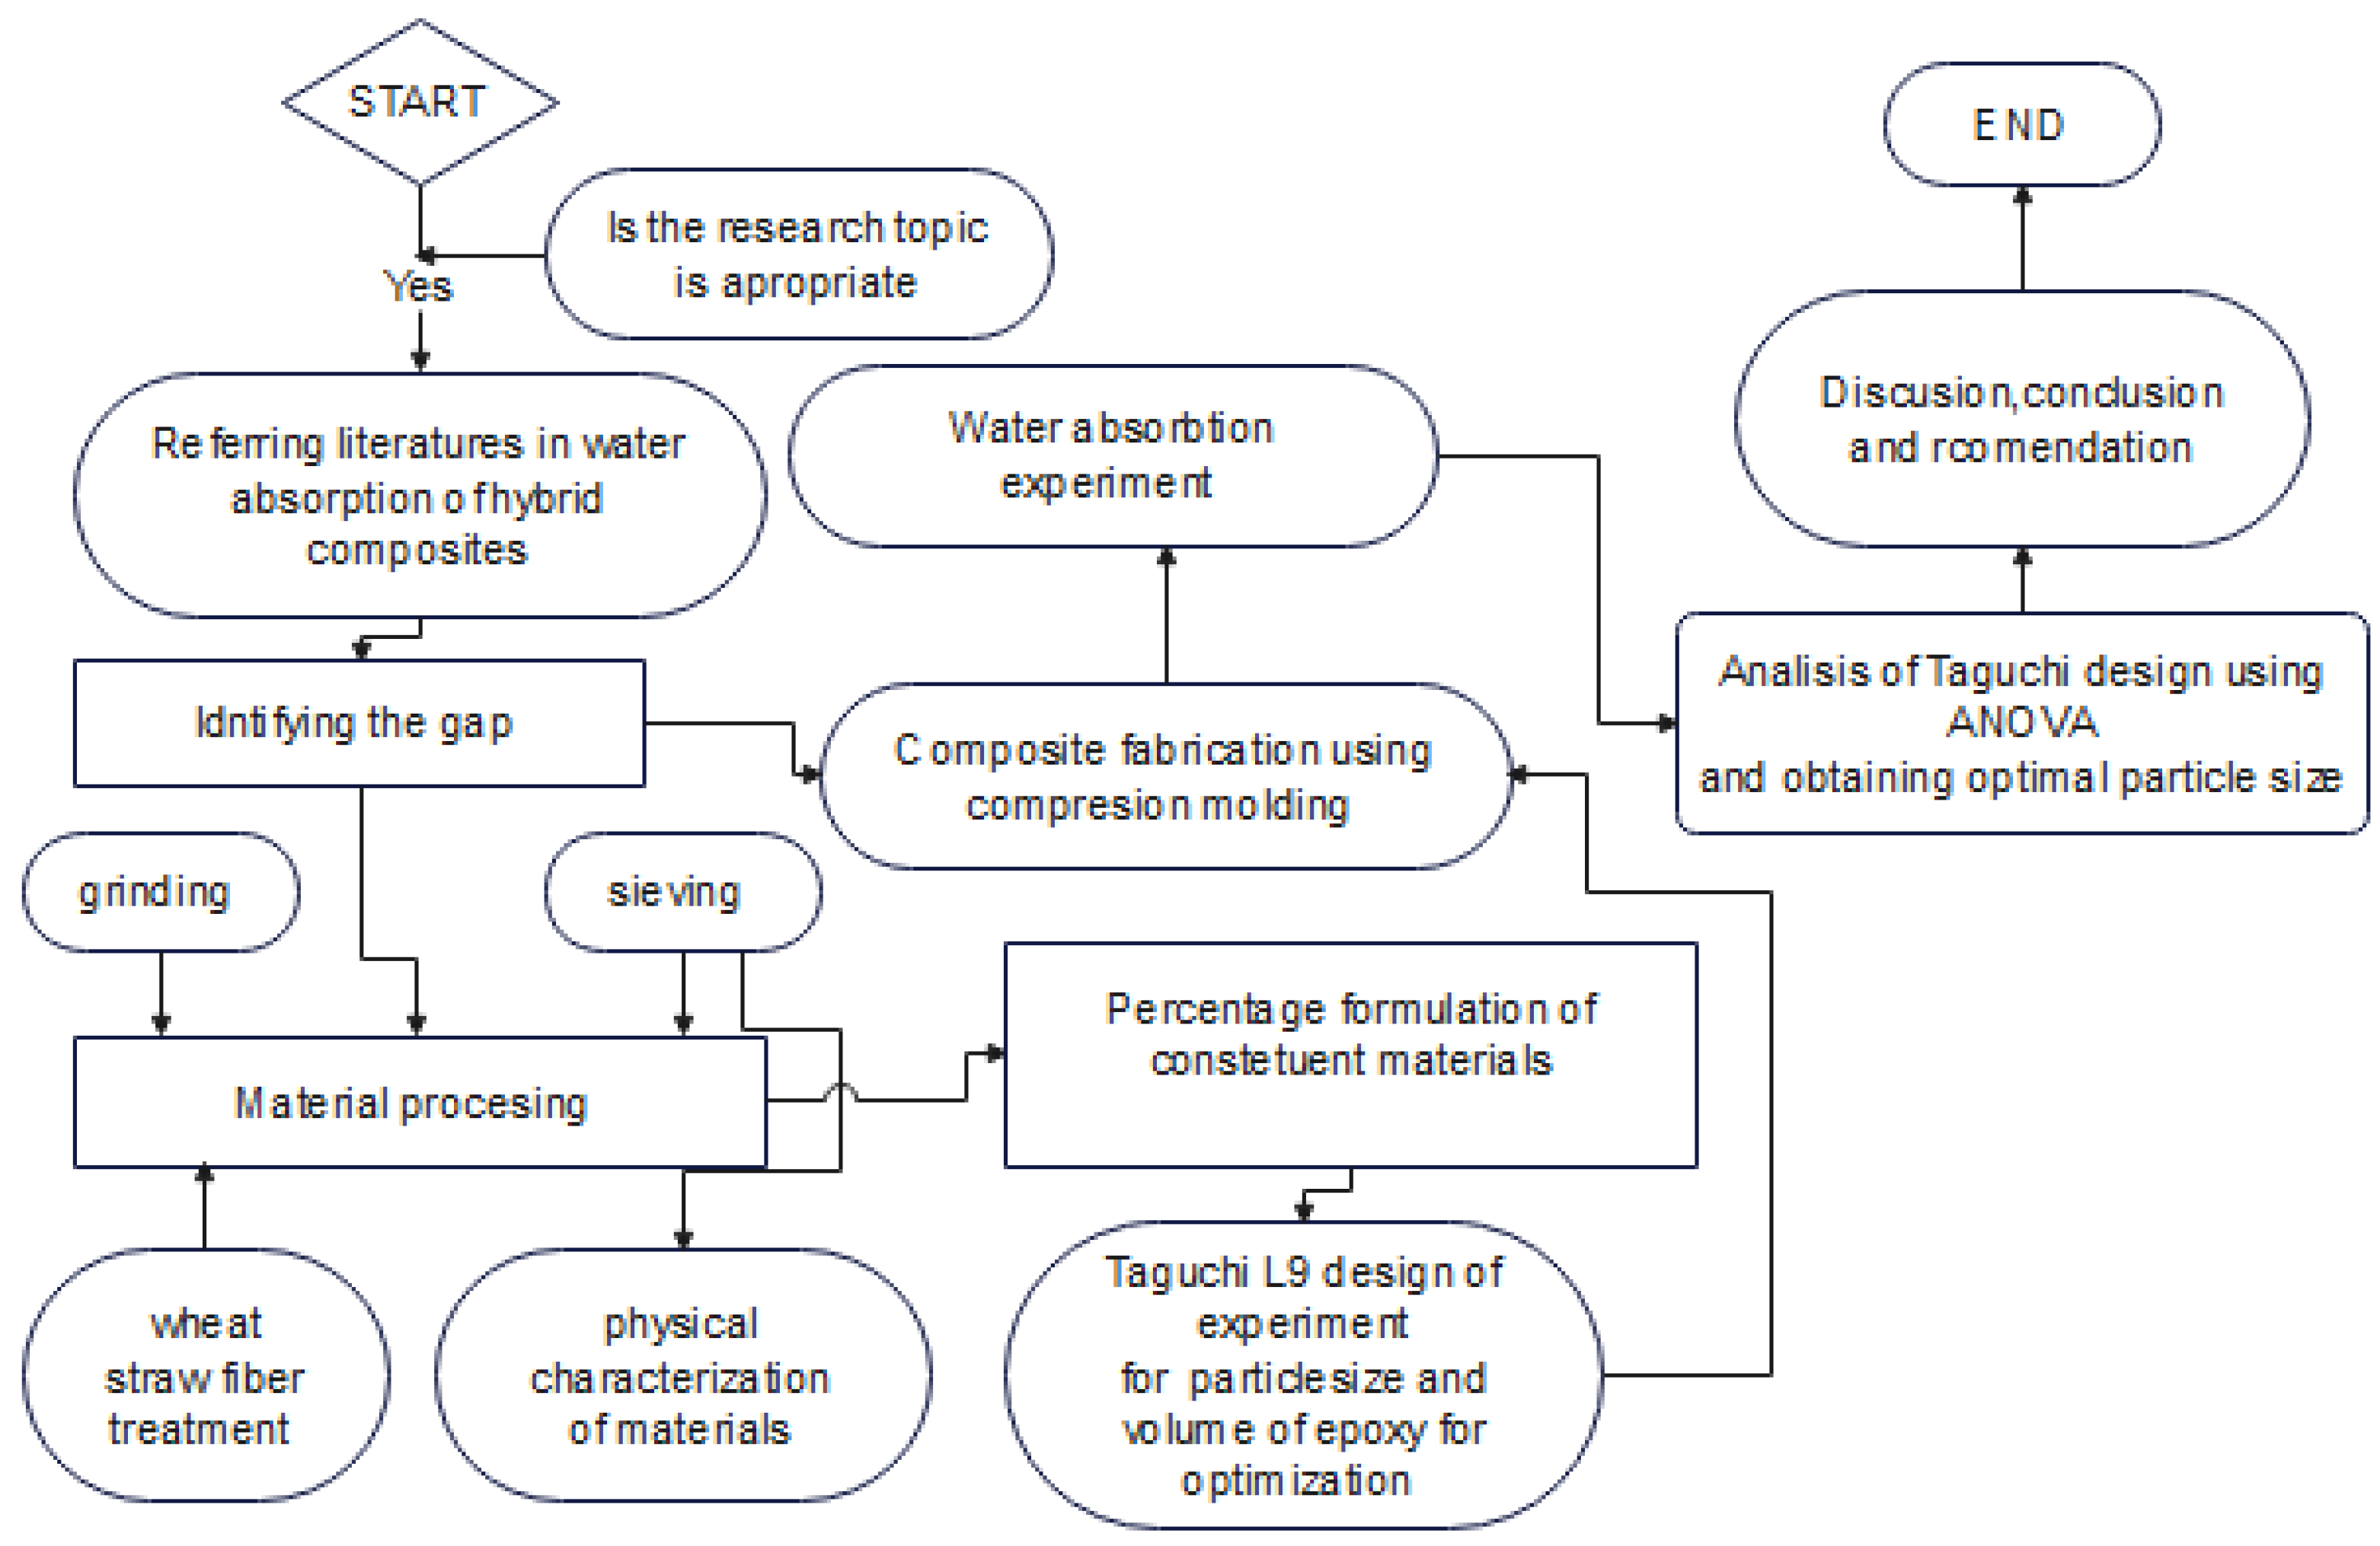
Figure 2.
Composites’ surfaces for water absorption test (a), experiment setup of water absorption (b).
Figure 2.
Composites’ surfaces for water absorption test (a), experiment setup of water absorption (b).

Figure 3.
XRD analysis of modified fiber (a) and unmodified fiber (b).

Figure 4.
SEM images of surface microstructure at the optimum variation of particle size of ingredients (a) and surface microstructure at non-optimal particle size (b).
Figure 4.
SEM images of surface microstructure at the optimum variation of particle size of ingredients (a) and surface microstructure at non-optimal particle size (b).

Figure 5.
Optimal morphology after optimization of particle size low magnification image (a) and non-optimal particle size sample morphology (b), the arrow shows the micro void of water segregation.
Figure 5.
Optimal morphology after optimization of particle size low magnification image (a) and non-optimal particle size sample morphology (b), the arrow shows the micro void of water segregation.
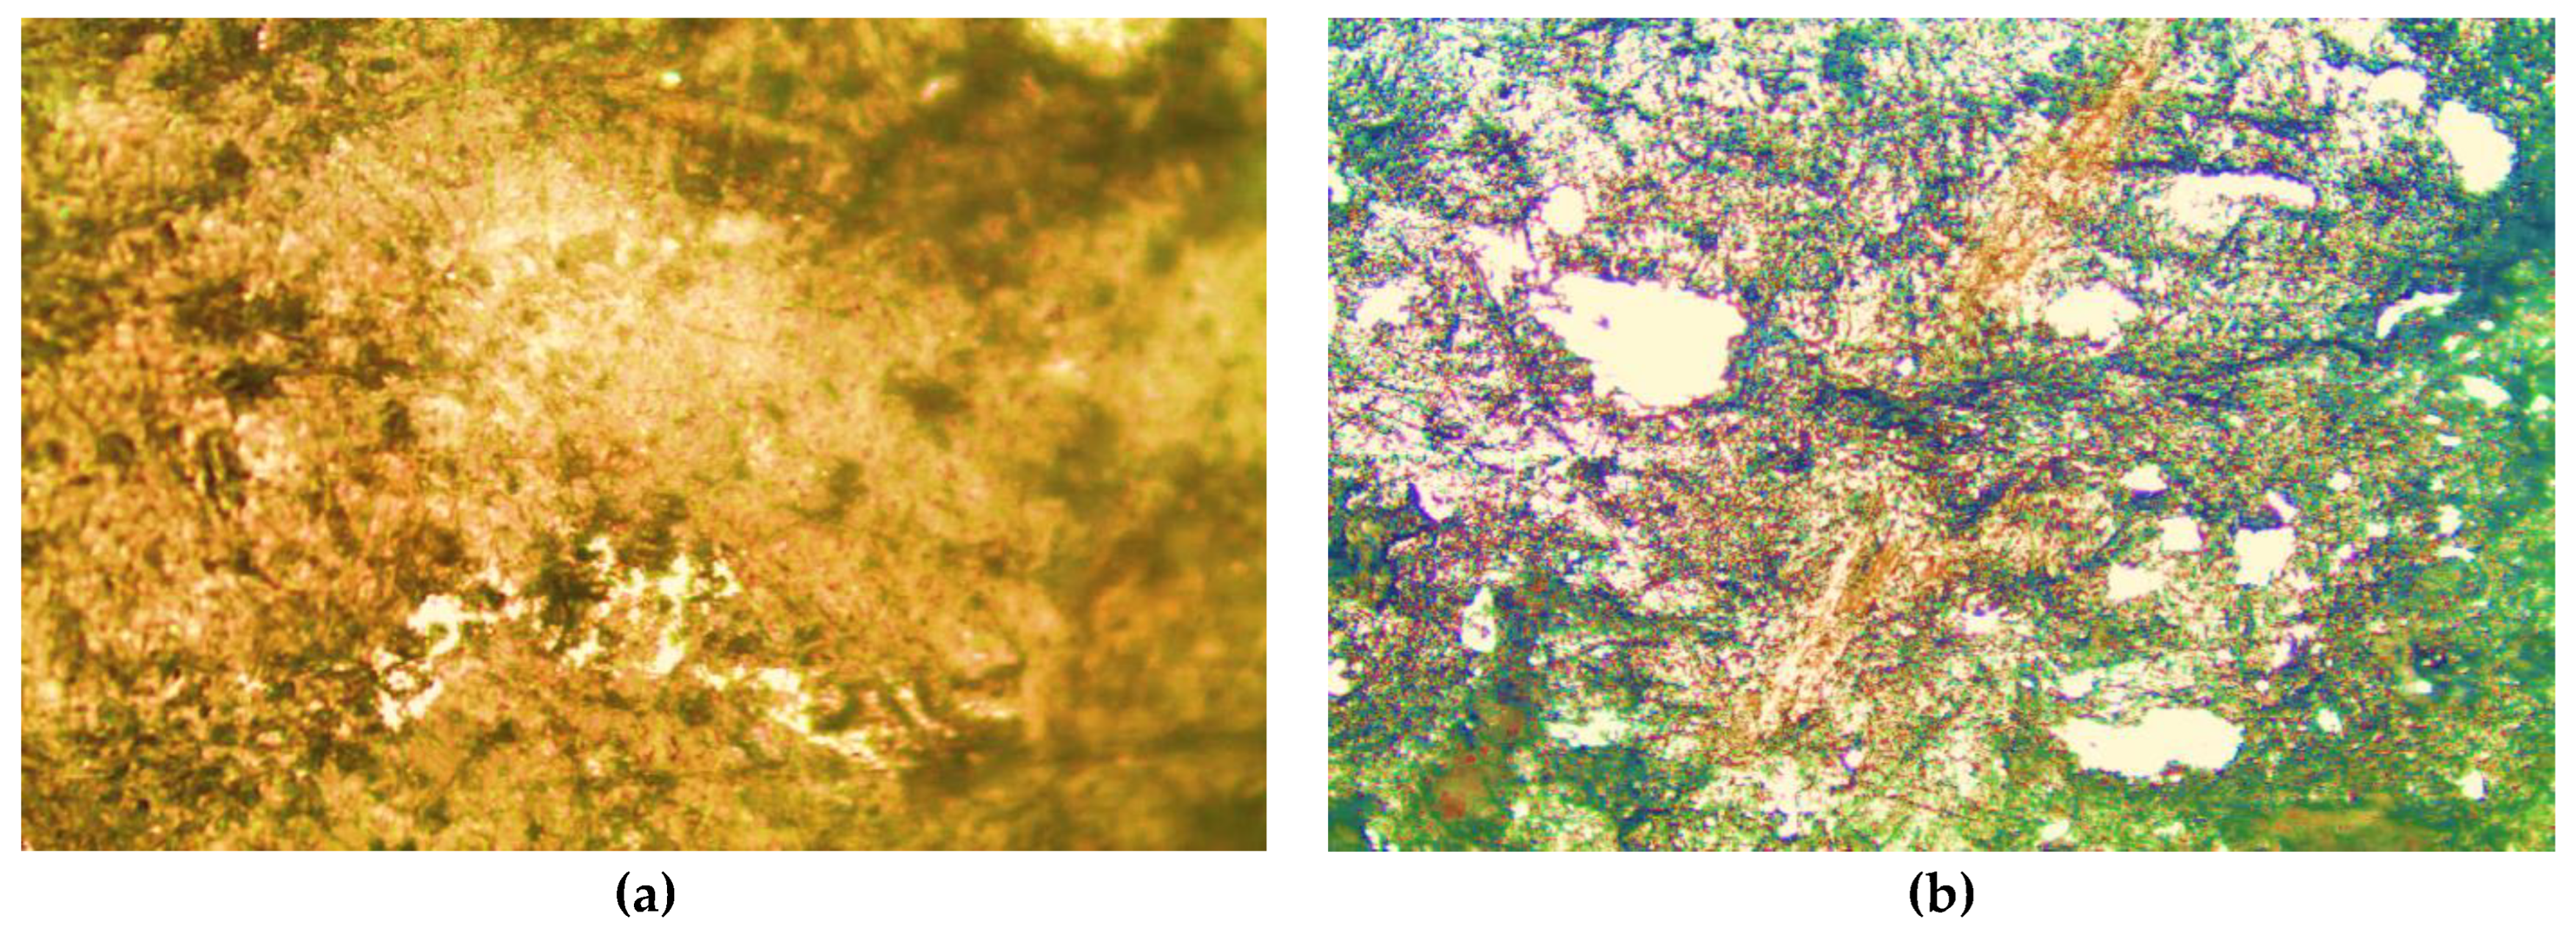
Figure 6.
(a) Compression test after the optimal condition of particle size and (b) compression test before the optimal condition of particle size.
Figure 6.
(a) Compression test after the optimal condition of particle size and (b) compression test before the optimal condition of particle size.

Figure 7.
pie chart of % contribution of particle size to the water absorption of the composite.

Figure 8.
The correlation of water absorption with particle size and epoxy volume changes.


Table 1.
Composition (%) of the composite materials.
| Composition | Basalt Particle Volume (%) | Wheat Straw Fiber Volume (%) | Steel Particle Volume (%) | Graphite Dust Particle Volume (%) | River Sand Particle Volume (%) | Volume of Epoxy (%) |
|---|---|---|---|---|---|---|
| C1 | 38 | 8 | 8 | 8 | 8 | 30 |
| C2 | 40 | 10 | 10 | 10 | 10 | 20 |
| C3 | 38 | 8 | 8 | 8 | 8 | 30 |
| C4 | 40 | 10 | 10 | 10 | 10 | 20 |
| C5 | 40 | 10 | 10 | 10 | 10 | 20 |
| C6 | 38 | 8 | 8 | 8 | 8 | 30 |
| C7 | 38 | 8 | 8 | 8 | 8 | 30 |
| C8 | 40 | 10 | 10 | 10 | 10 | 20 |
Table 2.
The fiber size, mass, and bulk density of wheat straw fiber.
| Size of Fiber (µm) | Mass (%) | The Bulk Density of Fiber (kg/m3) |
|---|---|---|
| <250 | 62.486 | 366 |
| 250–355 | 18.633 | 258 |
| 355–500 | 7.024 | 180 |
| 500–710 | 9.308 | 156 |
| 710–1000 | 2.546 | 78 |
Table 3.
The bulk density of particle materials for fractions under 35 mesh.
| Materials | Basalt Particle | Wheat Straw Fiber | River Sand | Graphite Particle | Steel Particle |
|---|---|---|---|---|---|
| bulk density (kg/m3) | 757 | 156 | 1267 | 2250 | 600 |
Table 4.
Composition (%) of steel particle.
| Element | C | Si | Mn | P | S | Cr | Mo | Ni | Cu | Al | Co | Nb | Ti | V | w | Fe |
|---|---|---|---|---|---|---|---|---|---|---|---|---|---|---|---|---|
| wt.% | 0.005 | 0.021 | 0.005 | 0.091 | 0.013 | 0.01 | 0.01 | 0.084 | 0.005 | 0.003 | 0.005 | 0.005 | 0.003 | 0.00001 | 0.03 | 99.79 |
Table 5.
The layout of Taguchi l8 orthogonal experiment for particle size of materials and volume of epoxy resin.
Table 5.
The layout of Taguchi l8 orthogonal experiment for particle size of materials and volume of epoxy resin.
| Composition | Basalt Particle Size (mm) | Wheat Straw Fiber Size (mm) | Steel Particle Size (mm) | Graphite Dust Particle Size (mm) | River Sand Particle Size (mm) | Volume of Epoxy (%) |
|---|---|---|---|---|---|---|
| C1 | 1 | 0.5 | 0.5 | 1 | 0.5 | 30 |
| C2 | 1 | 1 | 0.5 | 0.5 | 1 | 20 |
| C3 | 1 | 1 | 1 | 0.5 | 0.5 | 30 |
| C4 | 0.5 | 1 | 1 | 1 | 0.5 | 20 |
| C5 | 1 | 0.5 | 1 | 1 | 1 | 20 |
| C6 | 0.5 | 1 | 0.5 | 1 | 1 | 30 |
| C7 | 0.5 | 0.5 | 1 | 0.5 | 1 | 30 |
| C8 | 0.5 | 0.5 | 0.5 | 0.5 | 0.5 | 20 |
Table 6.
Water absorption experimental results(%).
| % Water Absorption | |||||
|---|---|---|---|---|---|
| Composition | Run 1 | Run 2 | Run 2 | Average Water Absorption (%) | Response Total |
| C1 | 3.236 | 3.638 | 3.767 | 3.55 | 10.641 |
| C2 | 26.751 | 26.947 | 26.879 | 26.86 | 80.577 |
| C3 | 4.623 | 4.645 | 4.736 | 4.67 | 14.004 |
| C4 | 9.837 | 9.992 | 9.958 | 9.93 | 29.787 |
| C5 | 4.734 | 4.556 | 5.665 | 4.99 | 14.955 |
| C6 | 7.386 | 7.456 | 6.944 | 7.26 | 21.786 |
| C7 | 17.345 | 17.589 | 17.347 | 17.43 | 52.281 |
| C8 | 18.896 | 18.734 | 18.365 | 18.67 | 55.995 |
| Grand total (Gab) = 280.03 | |||||
Table 7.
Table of parameters’ impact on water absorption by Taguchi rank method.
| Materials | Basalt Particle Size (mm) | Wheat Straw Fiber Size (mm) | Steel Particle Size (mm) | River Sand Particle Size (mm) | Graphite Dust Particle Size (mm) | Volume of Epoxy Resin (%) |
|---|---|---|---|---|---|---|
| Change in water absorption (%) | 3.306 | 1.024 | 4.831 | 10.474 | 4.931 | 6.884 |
| Rank | 5th | 6th | 4th | 1st | 3rd | 2nd |
Table 8.
Analysis of variance.
| Source of Variation | DF | Seq SS | Adj SS | Adj MS | F | P |
|---|---|---|---|---|---|---|
| Basalt dust particle(A) | 1 | 52.476 | 52.476 | 52.476 | 2.03 | 0.389 |
| Wheat straw fiber(B) | 1 | 1.929 | 1.929 | 1.929 | 0.07 | 0.830 |
| Steel particle(C) | 1 | 12.807 | 12.807 | 12.807 | 0.50 | 0.609 |
| river sand particle(D) | 1 | 113.249 | 113.249 | 113.249 | 4.39 | 0.283 |
| Graphite dust particle(E) | 1 | 27.536 | 27.536 | 27.536 | 1.07 | 0.490 |
| Epoxy resin(F) | 1 | 57.611 | 57.611 | 57.611 | 2.23 | 0.375 |
| Residual Error | 1 | 25.790 | 25.790 | 25.79 | ||
| Pooled error | 3 | 68.062 | 68.062 | 17.015 | ||
| Total | 7 | 291.399 |
Table 9.
Results of confirmation experiment.
| Replication | 1 | 2 | 3 | Mean (µ) |
|---|---|---|---|---|
| Response | 6.925 | 4.66 | 5.568 | 5.718 |
Disclaimer/Publisher’s Note: The statements, opinions and data contained in all publications are solely those of the individual author(s) and contributor(s) and not of MDPI and/or the editor(s). MDPI and/or the editor(s) disclaim responsibility for any injury to people or property resulting from any ideas, methods, instructions or products referred to in the content. |
© 2023 by the authors. Licensee MDPI, Basel, Switzerland. This article is an open access article distributed under the terms and conditions of the Creative Commons Attribution (CC BY) license (https://creativecommons.org/licenses/by/4.0/).
Share and Cite
MDPI and ACS Style
Yilma, W.M.; Singh, B.; Asrat, G.; Hossain, N. Taguchi Method Optimization of Water Absorption Behavior by Wheat Straw-Basalt Hybrid Brake Pad Composite. J. Compos. Sci. 2023, 7, 62. https://doi.org/10.3390/jcs7020062
AMA Style
Yilma WM, Singh B, Asrat G, Hossain N. Taguchi Method Optimization of Water Absorption Behavior by Wheat Straw-Basalt Hybrid Brake Pad Composite. Journal of Composites Science. 2023; 7(2):62. https://doi.org/10.3390/jcs7020062
Chicago/Turabian StyleYilma, Worku Mamuye, Balkeshwar Singh, Getinet Asrat, and Nazia Hossain. 2023. "Taguchi Method Optimization of Water Absorption Behavior by Wheat Straw-Basalt Hybrid Brake Pad Composite" Journal of Composites Science 7, no. 2: 62. https://doi.org/10.3390/jcs7020062