
Plasma Synthesis and Characterization of PANI + WO3 Nanocomposites and their Supercapacitor Applications


G. A. Krestov Institute of Solution Chemistry of RAS, Academicheskaja str., 1, 153045 Ivanovo, Russia
*
Author to whom correspondence should be addressed.
J. Compos. Sci. 2023, 7(4), 174; https://doi.org/10.3390/jcs7040174
Submission received: 27 March 2023
/
Revised: 12 April 2023
/
Accepted: 19 April 2023
/
Published: 20 April 2023
(This article belongs to the Section Polymer Composites)
Abstract
:In this work, an underwater impulse discharge initiated in polyaniline (PANI) aqueous dispersion between tungsten rods is applied to produce metal oxide nanoparticles and create polymer nanocomposites. The prepared materials were analyzed by X-ray diffraction (XRD), ultraviolet-visible spectroscopy (UV-Vis), Fourier transform infrared spectroscopy (FTIR), transmission electron microscopy (TEM), and scanning electron microscopy (SEM). XRD, FTIR, and TEM confirmed the presence of tungsten oxide particles in the final composite, while spectroscopic characterization revealed the interaction between the metal oxide and PANI. The results showed that the incorporation of WO3 into the PANI matrix could improve the optical bandgap of the nanocomposites. In addition, the electrochemical performance of the hybrid nanocomposites was tested by cyclic voltammetry (CV) and galvanostatic charge-discharge (GCD). The results obtained indicated that the PANI + WO3 nanocomposite could be a promising candidate as an electrode material for high-power supercapacitor applications.
1. Introduction
Conductive polymers have attracted much attention for their potential applications in solid-state device fabrication [1,2]. Among conductive polymers, polyaniline (PANI) has been widely used due to its advantages of easy synthesis, good flexibility, high conductivity, and good environmental stability [3,4]. Polyaniline has attracted the most attention due to the highest specific capacity, good electronic properties [5], improved thermal stability, and reasonable cost [6]. PANI has long been used in energy storage and conversion devices, including supercapacitors [7], batteries [8], and fuel cells [9]. Therefore, it has been extensively studied and emerged as the most promising candidate for commercial applications. There is broad room for improvement by combining organic materials with their inorganic counterparts to form composites [10]. In recent years, research on hybrid materials based on nanoparticle conductive polymers such as metal oxides have also attracted extensive attention due to their wide applications in sensors, electrodes, batteries, photovoltaics, medicine, electrochemistry, and other fields [11,12]. Many authors have studied the synthesis of polyaniline nanocomposites with different nanoparticles, such as Fe3O4 [13], ZnO [14], ZrO2 [15], TiO2 [16], Al2O3 [17], and WO3 [18]. By doping conducting polymers with metal oxides, defined properties such as high electrical conductivity, high electron affinity, and improved mechanical properties can be achieved [19]. Most of the current research on various pseudocapacitive materials is based on transition metal oxides [20]. Due to its easy synthesis, good conductivity, high capacitance and strong versatility, WO3 is currently the best electrode material for supercapacitors [21]. When it comes to n-type semiconductors, WO3 boasts exceptional electron transport properties and unparalleled resistance to corrosion. [22]. For example, hydrothermally grown hierarchical WO3 nanofibers enriched in a carbon coating give excellent performance in cyclability, specific capacity, initial discharge capacitance, and stability [23]. The incorporation of PANI into tungsten trioxide can lead to promising applications, such as gas sensors [24], supercapacitors [25], humidity sensors [26], electrochromic energy storage devices [27], and catalysts [28]. Among them, the progress of supercapacitors in energy storage applications has received due attention. In particular, the advantages of the PANI + WO3 composite is that it promotes an equivalent degree of ion transfer capability of the two materials [29,30]. Studies have shown that PANI beads can be used as promising catalysts for WO3 thin films, while WO3 endows PANI with advantages in supercapacitor applications [31]. PANI + WO3 composites have been synthesized by a chemical polymerization method and used as gas sensors with good performance [32].
Studies have shown that low-temperature underwater plasma is a simple, reagent-free, and efficient method to obtain various metal oxide nanoparticles [33,34]. In [35], tungsten trioxide nanoparticles were synthesized using underwater pulse discharge. The energy cost per atom in oxides has shown promise compared to other typical plasma synthesis techniques. The diameter of the synthesized nanoparticles was found to depend on the discharge current. The obtained tungsten oxide powders exhibited high photocatalytic activity, which might be attributed to the low bandgap value and porous structure of the samples. Furthermore, plasma-liquid contact is an effective method for modifying various polymeric materials [36,37]. During plasma chemical treatment, new oxygen-containing functional groups are formed and polymer crosslinking and decomposition processes take place. Plasma-modified polymers can be used as a matrix for impregnating nanoparticles. In previous studies, one-step synthesis of polymer composites with encapsulated metal oxide nanoparticles was successfully investigated. However, studies aimed at obtaining oxide nanoparticles by plasma-chemical methods by inducing electrical discharges in aqueous dispersions of PANI were never carried out. Furthermore, there is little data in the literature on polyaniline processes that occur under the action of underwater pulsed plasmas.
In the present work, nanocomposites were prepared from polyaniline and tungsten trioxide nanoparticles in a one-step stage using impulse underwater discharge plasma. The samples obtained were characterized by XRD, FTIR, SEM, TEM, and CV in order to determine the properties and electrochemical behavior.
2. Materials and Methods
2.1. Methods of Synthesis
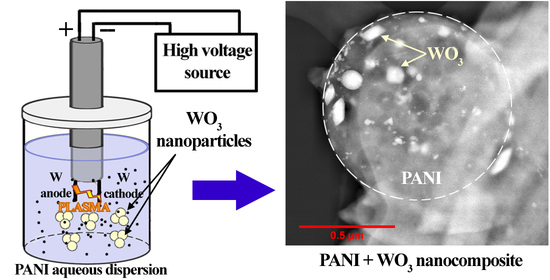
Synthesis of nanocomposites was carried out in the glass cell using the underwater plasma. 0.5 g of polyaniline in the form of emeraldine salt (BLD Pharmatech Ltd., Shanghai, China) was placed in 200 mL of bidistilled water and dispersed for two hours using an ultrasonic bath 3DT (Stegler, Russia). Tungsten rods (99.99% purity, Sigma-Aldrich, St. Louis, MO, USA) with a diameter of 1.0 mm were used as the electrodes in the experiments. These rods were placed in a ceramic tube. The non-isolating length of the electrodes was 3 mm. The electrodes were immersed in the water dispersion of PANI. Direct current (DC) underwater plasma was ignited between electrodes in water using a homemade DC power supply with output voltage up to 5 kV and a 0.5 kOhm ballast resistor. The details of the experiment are described in [35]. The experiments were carried out at two plasma currents: 0.25 A and 0.8 A. The time of treatment was 5 min. Formed composites were centrifuged using an ELMI CM-50M centrifuge (LLC BIOLIGHT SPB, Saint Petersburg, Russia) at a speed of 15294 × g, and precipitates were dried at 25 °C for 3 h. To determine the quantitative yield of nanoparticles, the electrodes were weighed before and after the ignition of the discharge. The HR-150AZ analytical balance (AND, Tokyo, Japan), with a measurement error of 5%, was used.
2.2. Characterization
The optical emission spectra during the burning of discharge were registered through the quartz window using an AvaSpec ULS-3648 fiber optic spectrometer (Avantes BV, Apeldoorn, The Netherlands) in the range of 250–900 nm.
The phase composition of obtained structures was analyzed by X-ray diffraction (X-ray diffractometer D2 Advance, CuKα source, Brucker, USA) in the range of 2θ: 5–70° with a step of 0.02°. The interpretation of XRD patterns was performed with the use of the COD open crystallographic database.
The spectra of aqueous dispersions of nanocomposites were analysed with an SF-56 spectrophotometer (Spectr, Saint Petersburg, Russia) at wavelengths in the range of 270–900 nm.
The surface morphology of PANI + WO3 composites were obtained with scanning electron microscopy (SEM, ThermoFisher, Waltham, MA, USA) and transmission electron microscopy (TEM, JEOL2200FS, Akishima, Japan). The Titan™ (Titan cubed) 300 high-resolution transmission electron microscope (Thermo Fisher Scientific, Waltham, MA, USA) equipped with an X-FEG high brightness Schottky electron gun, a Wien filter-type monochromator and Cs image corrector was used for TEM analysis. TEM imaging was performed at a 60 kV acceleration voltage, and a resolution of around 1 Å was achieved with a monochromator, decreasing the energy spread of the electron source and with an aligned corrector minimizing aberrations of the objective lens.
Measurements of the specific surface area by the Brunauer–Emmett–Teller (BET) method were conducted on a NOVAtouch NT LX-1 Quantachrome analyzer at 77 K (Quantachrome, Boynton Beach, FL, USA).
FTIR spectra of obtained films were detected by a spectrometer (VERTEX 80v, Brucker Optics, Billerica, MA, USA) in the range of 4000–400 cm−1. For this purpose, the composite powders were mixed with KBr (99.99% IR sort, Acros Organics, Fair Lawn, NJ, USA) at a ratio of 1:100 and then pressed into a tablet.
2.3. Electrochemical Characterization
Electrochemical behavior and capacitance determinations were carried out in a classical three electrode set up using cyclic voltammetry (CV) and galvanostatic charge-discharge (GCD) on a P-20X potentiostat-galvanostat (Electrochemical Instruments, Russia) with 0.5 M K2SO4 electrolyte at room temperature. For this, the nanocomposites on the steel substrate were used as a working electrode; a graphite plate served as a counter electrode and a standard calomel electrode (SCE) served as a reference electrode. The bare steel substrates (to deposit PANI film) were dipped in PANI suspension twice for 10 sec and dried at room temperature. A similar procedure was also carried out for suspensions containing the PANI + WO3 composites. The substrate specimen size was 60 × 15 × 3 mm, steel-grade AISI 201. The pre-treatment of the specimen comprised rough grinding of the sample pre-plating area with corundum wheel of 60, then fine grinding of the surface with sponge wheels of 300 and 800 grit, followed by chemical degreasing of the surface, distilled water washing and drying.
3. Results and Discussion
3.1. Evidence of Electrode’s Sputtering
The measurement of the change in electrode mass during plasma action makes it possible to calculate the sputtering rate of the electrode. The data are listed in Table 1. The data obtained on electrode sputtering rates made it possible to estimate the concentration of oxide nanoparticles in the polymer matrix (Table 1). The concentration of tungsten oxide nanoparticles in PANI (C) was calculated using the following formula:
where va is anode sputtering rate (g/h), vc is cathode sputtering rate (g/h), t is treatment tine (h), and mPANI is mass of polumer.
Thus, the concentration of oxide particles in the PANI matrix does not exceed 5%.
The scenario for the development of an underwater discharge initiated between two tungsten electrodes placed in an aqueous dispersion of polyaniline can be represented as follows. The development of the discharge begins with the formation of a gas bubble near the anode. We can assume that in the initial phase of electrolysis, chemical processes take place on the electrodes. Oxidation processes at the anode form a hydrophilic surface of the electrode (oxide film). At the same time, hydrogen evolution at the cathode keeps the surface of the material hydrophobic. This makes the outgassing process less noticeable. At the very beginning, the solution is still insufficiently heated. It can be assumed that this is not a bubble of water vapor, but oxygen, or at least it consists mainly of oxygen. The breakdown occurs and a discharge appears, resulting in a sharp increase in current when the interelectrode space is filled with air bubbles. An increase in current causes overheating of the solution and an expansion in the bubble diameter due to the formation of water vapor. Furthermore, the current decreases and the process repeats. The total time of one discharge impulse is about 2 ms, and the active burning time of the discharge is about 300 μs [35]. The formation of a discharge causes a significant overheating of the tips of the tungsten electrodes. According to previous studies of this type of discharge, the temperature of the gas in the plasma reaches 4500 K [33]. This leads to melting of the electrodes and further atomization of the metal in the plasma. Next, metal atoms react with atomic oxygen, which leads to the formation of metal oxide nanoparticles. The nanoparticles are then dispersed in the cooling medium through three transformation steps of nucleation, growth, and condensation.
The emission spectrum of the discharge confirms the sputtering of the electrodes in the plasma and the formation of nanoparticles. The emission spectrum of the discharge is presented in Figure 1. The atomic oxygen lines at 777 and 844 nm and the hydrogen Balmer lines of Hβ at 486 nm and Hα at 656 nm are registered. The bands of OH radicals in the range of 250–350 nm are represented. The intense emission lines of tungsten atoms can be observed at 400.8 nm and 429.5 nm.
It can be seen from the Figure 1 that the emission spectrum of the discharge has a wide band with a maximum at 620 nm. The presence of the continuum may be related to the emission of the formed metal oxide nanoparticles. These particles absorb energy, heat up and emit light that approximates black body radiation. This is consistent with the data presented in [38,39]. It should be noted that there are no bands for CH, NH, or lines of C atoms in the emission spectra of the discharge. Thus, the destruction of PANI is not observed under our experimental conditions.
3.2. Characterization of Obtained Materials
Figure 2a shows the UV-Vis absorption spectra of PANI initially dissolved in water and the resulting suspension containing WO3 nanoparticles. Polyaniline exhibits two characteristic absorption bands. The first band at 290–394 nm is attributable to π–π* transitions of benzene-based rings. The second band at 550 nm is attributable to transitions of quinone excitons, indicating delocalization of electrons in polymers [40].
In the case of nanocomposites with metal oxide nanoparticles, the π–π* transitions of the bands are reduced in intensity compared to PANI, and the edge of its own absorption has been shifted to the long wavelength region. It can be assumed that the nanoparticles affect the electron distribution in the benzene ring region and form a large conjugated system due to the incorporation of metal oxide into the PANI matrix [41]. The results of UV/Vis studies revealed electronic interactions between metal oxides and PANI via coordination bonds between lone electron pairs of amine nitrogen and empty orbitals of metal oxides [42].
The UV-Vis spectra provide insight into the optical properties and bandgap energy values. The indirect bandgap energies of materials can be obtained from the Tauc plot (Figure 2b) as follows [43]:
where B0 is a constant related to the type of band–band transition, v is the frequency of the incident radiation, n is an index related to the type of optical transition, and Eg is the optical bandgap of the material. The bandgap values obtained were 3.74 eV, 3.64 eV, and 3.48 eV for PANI, PANI + WO3 0.8 A, and PANI + WO3 0.25 A, respectively. The addition of nanoparticles to the polyaniline matrix reduces the value of the band gap. This observed trend could be explained by the size of the metal oxide nanoparticles, which is considered to play a dominant role in their optical properties. Previous studies have shown that increasing the discharge current leads to an increase in the size of the nanoparticles [33,35].
Figure 3 shows the FTIR spectra of PANI and its nanocomposites. The characteristic peaks relating to PANI-ES recorded at 1481 cm−1 and 1583 cm−1 were attributed the stretching vibrations of the benzenoid unit and quinoid unit groups, respectively [43]. The characteristic peak of PANI at 3470 cm−1 was attributable to the stretching of N–H [44]. The peaks at 1249 cm−1 and 795 cm−1 corresponded to the secondary aromatic amine stretching and aromatic C–H out-of-plane bending, respectively [45]. The peak at ~2990 cm−1 was formed due to C–H stretching modes of alkyl groups. The FTIR spectra of nanocomposites show that these materials contained the same characteristic PANI bands, while some bands presented a shifting compared to PANI, which may be associated with the interaction existing between metal oxide nanoparticles and polymer.
The spectrum of the PANI + WO3 nanocomposite showed characteristic bands at 665 cm−1 and 595 cm−1, which are attributed to the stretching and bending vibrations for O–W–O and W–O–W in WO3, respectively [46]. The assignments of IR bands identified within the spectra are shown in Table 2.
The XRD diffractogram of PANI showed several peaks with reasonable intensities (Figure 4). The peaks diffracted at an angle of 2θ = 20.3° and 24.6°, which corresponds to (110) and (100) planes of PANI respectively, and showed low crystallinity of the conductive polymers due to the repetition of benzenoid and quinoid rings in PANI chains [47]. The additional peaks at 2θ ≈ 15.2° and 14.7° are also observed and are in agreement with the reported data [48]. There is a small intense peak at 2θ = 6.5°, which is due to long PANI chains and more ordered structure. There is a small peak at an angular position of 2θ≈23°, which represents the emeraldine salt form of PANI [12]. For nanocomposites, all peaks were present for tungsten trioxide, while the broad peaks between 10° and 30° attributed to the amorphous structures of PANI confirmed the polymer–metal oxide interaction [17]. The characteristic diffraction lines at 2θ = 23.6°, 24.2°, 28.6°, 28.9°, 33.2°, and 34.1° correspond to the (020), (200), (112), (022), (202), and (222) planes of the γ-monoclinic WO3 phase (COD card No. 9621063) [35]. With an increase in the discharge current, the rate of sputtering of tungsten electrodes and the content of tungsten oxide in the polymer matrix increase.
In addition to the increase in the amount of dopant, the intensity of the peaks correlated in WO3 has increased. In the XRD patterns of metal oxide-polymer composites, the peak at 2θ = 32° has appeared. The peak corresponds to neither the crystal phase of PANI nor structures of WO3. It may refer to a new texture pattern that appears as a result of strong interactions between the active centers of tungsten oxide and PANI. The shift of the peaks relative to the initial PANI is associated with the strong interaction of the polymer with the formed oxide structures of tungsten. This interaction can be understood from the estimates of interchain separation (R) using Equation (2) [49,50]. It is the measure of the packing of polymer chains in the semi-crystalline region of the samples. The calculated values are presented in Table 2. The inclusion of WO3 does not change the interplanar distance. On the other hand, it leads to the formation of a more compact structure due to the interaction of the metal with the active groups of the polymer.
where λ is the wavelength of the X-ray (λ = 1.5405 Å) and θ is Bragg diffraction angle.
The crystallite sizes of polymer matrix and metal oxide particles (D) were calculated using the Debye–Scherrer formula (Table 3):
where β is the broadening of the diffraction peak measured in the width at half-maximum of the peaks.
The initial PANI is polycrystalline in nature and the minimum crystallite size was estimated at 10.5 nm using Debye–Scherrer’s equation. The crystallite size of WO3 in a polymer was calculated as 55 nm. An increase in current causes a slight increase in the size of crystallites of metal oxide, which is consistent with the data obtained earlier [33]. It should be noted that the synthesis of tungsten trioxide using an underwater pulsed discharge in water leads to higher values of the crystallite sizes [35]. Therefore, it could be deduced that encapsulation of the WO3 in the PANI matrix affects the metal oxide crystallite sizes.
The N2 adsorption-desorption technique was used to characterize the porous structure of powders. The BET surface area, BJH surface area, BJH desorption average pore diameter, and pore volume of synthesized powder are summarized in Table 4. The pore size distribution was calculated by the Barrett-Joyner-Halenda (BJH) method, using the nitrogen adsorption branch of the isotherm. The obtained composites have an average mesopore diameter of about 3.6 nm. The introduction of tungsten oxide nanoparticles into the composite increases the porosity.
The surface morphologies of PANI and PANI + WO3 composites obtained at different discharge currents were examined using SEM, as shown in Figure 5. The particles of initial PANI powder are spherical. As can be seen from the image, the WO3 particles are embedded in the PANI matrix. The particles are randomly distributed on the surface of the powder. The randomness of the particles results in some gaps between them, which can be called pores.
Figure 6 shows the TEM images of PANI + WO3 nanocomposites. The tungsten oxide nanoparticles depict a spherical morphology, but there are also particles of cubic shape. The average sizes of the nanoparticles at different discharge were 45 nm and 52 nm, respectively. Moreover, TEM images of the nanocomposites show that all metal oxide particles were well dispersed in the PANI matrix. In addition, the morphology of all hybrid materials was found to be spherical.
3.3. Electrochemical Behavior
All samples analyzed displayed a nearly rectangular shape with two pairs of anodic and cathodic current peaks, indicative of the typical Faradaic energy storage mechanism of PANI and characteristic of supercapacitors [51]. The observed symmetry between the two pairs of peaks suggests a high degree of reversibility in the relevant redox reactions. The first pair of peaks, occurring within the 0.44–0.29 V range, corresponded to the oxidation of the leucoemeraldine-emeraldine form, while the second pair, between 0.82 and 0.71 V, corresponded to the oxidation of the polyaniline from emeraldine to pernigraniline of [52]. Interestingly, the inclusion of WO3 nanoparticles in PANI + WO3 shifted the ox/red peaks to a lower potential, suggesting that the reaction kinetics were surface-limited and that the electrochemical properties were determined by more than simply the nature of the polymer matrix, but also by the metal oxides [53].
Figure 7b shows the galvanostatic charge/discharge curves of samples. The current density was kept constant at 1.0 A/g and the potential varied from 0.2 to 0.8 V. PANI + WO3 exhibited a rapid voltage surge from 0 V to 0.3 V, followed by a curve flattening at 0.4 V to 0.5 V due to emeraldine oxidized to pernigraniline [54]. Pseudocapacitive behavior caused curve distortion due to swift PANI redox reactions. A linear correlation between potential and time emerged during GCD processes, which, alongside rectangular CVs, contributed to a material’s capacitance behavior. Crystalline WO3 nanoparticles, with their high porosity, boosted the materials’ stability. Thus, the nanocomposites exhibited high electrochemical reversibility.
The proper functioning of supercapacitors depends heavily on their cycling stability. Unfortunately, conductive polymers frequently experience shrinkage and swelling during charging and discharging, leading to limited cycling stability [54]. However, the hybrid materials examined in this study proved exceptionally stable, with capacity retention holding steady between 74.6% and 89.2%, even after 1000 cycles at a high current density of 1.0 A/g (as demonstrated in Figure 7c).
The specific capacitance from the CV curve of the composites is calculated using the following relation [55]:
where i is the current (A), is the voltammetric charge obtained by integration of the area under the reverse peak of the CV with a dimension of ‘‘Amp. Volt’’, v is the potential scan rate (V/s), V is the capacitive potential interval (V), and m is the mass sample (g). The data was summarized in Table 5. The mass of PANI and two composites were measured using a high-precision weight balance and were evaluated as 0.1213, 0.1876, and 0.1988 g, respectively.
4. Conclusions
PANI + WO3 composites were synthesized by underwater pulse discharge induced in aqueous polyaniline dispersion between tungsten rods. X-ray diffraction and Fourier transform infrared spectroscopic analysis confirmed the successful preparation of PANI + WO3 nanocomposites. Furthermore, transmission electron microscopy images revealed spherical morphology of the nanocomposite, with a size of 35 nm. The optical properties of the samples were also examined. The optical bandgap energies of PANI, PANI + WO3 0.8 A, and PANI + WO3 0.25 A samples reached about 3.74 eV, 3.64 eV, and 3.48 eV, respectively. In addition, the electrochemical performance of the materials was tested by cyclic voltammetry, galvanostatic charge/discharge, and cycling stability techniques. The results of this work could significantly advance the future of supercapacitor electrodes made of nanocomposites.
Author Contributions
Conceptualization, N.S.; methodology, A.K.; investigation, N.S. and A.K.; writing—original draft preparation, N.S.; writing—review and editing, A.K. and N.S.; supervision, N.S.; project administration, A.K. All authors have read and agreed to the published version of the manuscript.
Funding
This work is supported by the Russian Science Foundation under grant 21-73-00034.
Data Availability Statement
Not applicable.
Acknowledgments
Authors would like to thank D. Smirnova for performing the XRD analysis, M. Yurov for conducting the SEM analysis, A. Bazanov for performing the BET analysis, Yu. Fadeeva for conducting FTIR analysis at the center of joint use of scientific equipment (the Upper Volga Regional Center for Physical-Chemical Research, Russia), and M. Lovygin for performing TEM analysis (Group of materials science and microelectronics at Systems for microscopy and analysis, LLC).
Conflicts of Interest
The authors declare no conflict of interest.
References
- Skotheim, T.A. Handbook of Conducting Polymers, 2nd ed.; Marcel, D., Ed.; CRC Press: New York, NY, USA, 1998. [Google Scholar]
- Gurunathan, K.; Amalnerkar, D.P.; Trivedi, D.C. Synthesis and Characterization of Conducting Polymer Composite (PAn/TiO2) for Cathode Material in Rechargeable Battery. Mater. Lett. 2003, 57, 1642–1648. [Google Scholar] [CrossRef]
- MacDiarmid, A.; Yang, L.; Huang, W.; Humphrey, B. Polyaniline: Electrochemistry and Application to Rechargeable Batteries. Synth. Met. 1987, 18, 393–398. [Google Scholar] [CrossRef]
- Mizumoto, M.; Namba, M.; Nishimura, S.; Miyadera, H.; Koseki, M.; Kobayashi, Y. Polyaniline as an Electrode of Rechargeable Battery. Synth. Met. 1989, 28, 639–646. [Google Scholar] [CrossRef]
- Patanè, S.; Triolo, C.; Cardiano, P.; Lo Schiavo, S. Capacitive Properties of the Hydrophobic [2-(Methacryloyloxy)Ethyl]-Trimethyl Ammonium Nonafluoro-1-Butanesulfonate Poly (Ionic Liquid) Thin Film. Ionics 2017, 23, 1481–1487. [Google Scholar] [CrossRef]
- Sonawane, J.M.; Patil, S.A.; Ghosh, P.C.; Adeloju, S.B. Low-Cost Stainless-Steel Wool Anodes Modified with Polyaniline and Polypyrrole for High-Performance Microbial Fuel Cells. J. Power Sources 2018, 379, 103–114. [Google Scholar] [CrossRef]
- Wang, H.; Lin, J.; Shen, Z.X. Polyaniline (PANi) Based Electrode Materials for Energy Storage and Conversion. J. Sci. Adv. Mater. Devices 2016, 1, 225–255. [Google Scholar] [CrossRef]
- Yu, F.; Zhang, C.; Wang, F.; Gu, Y.; Zhang, P.; Waclawik, E.R.; Du, A.; Ostrikov, K.; Wang, H. A zinc bromine “supercapattery” system combining triple functions of capacitive, pseudocapacitive and battery-type charge storage. Mater. Horiz. 2020, 7, 495–503. [Google Scholar] [CrossRef]
- Li, X.; Chen, D.; Xu, D.; Zhao, C.; Wang, Z.; Lu, H.; Na, H. SPEEKK/Polyaniline (PANI) Composite Membranes for Direct Methanol Fuel Cell Usages. J. MembR. Sci. 2006, 275, 134–140. [Google Scholar] [CrossRef]
- Yang, C.; Chen, C. Synthesis, Characterisation and Properties of Polyanilines Containing Transition Metal Ions. Synth. Met. 2005, 153, 133–136. [Google Scholar] [CrossRef]
- Anbarasan, R.; Ponprapakaran, K.; Harihara Subramani, R.; Baskaran, R.; Tung, K.-L. Synthesis, Characterization and Catalytic Activity of Copolymer/Metal Oxide Nanocomposites. Polym. Bull. 2019, 76, 4117–4138. [Google Scholar] [CrossRef]
- Bekhoukh, A.; Moulefera, I.; Sabantina, L.; Benyoucef, A. Development, Investigation, and Comparative Study of the Effects of Various Metal Oxides on Optical Electrochemical Properties Using a Doped PANI Matrix. Polymers 2021, 13, 3344. [Google Scholar] [CrossRef] [PubMed]
- Zhang, Z.; Wan, M. Nanostructures of Polyaniline Composites Containing Nano-Magnet. Synth. Met. 2003, 132, 205–212. [Google Scholar] [CrossRef]
- He, Y. A Novel Emulsion Route to Sub-Micrometer Polyaniline/Nano-ZnO Composite Fibers. Appl. Surf. Sci. 2005, 249, 1–6. [Google Scholar] [CrossRef]
- Wang, S.; Tan, Z.; Li, Y.; Sun, L.; Zhang, T. Synthesis, Characterization and Thermal Analysis of Polyaniline/ZrO2 Composites. Thermochim. Acta 2006, 441, 191–194. [Google Scholar] [CrossRef]
- Cheng, Q.; Fang, Z.; Yi, X.-S.; An, X.; Tang, B.; Xu, Y. “Ex Situ” Concept for Toughening the RTMable BMI Matrix Composites, Part I: Improving the Interlaminar Fracture Toughness. J. Appl. Polym. Sci. 2008, 109, 1625–1634. [Google Scholar] [CrossRef]
- Benykhlef, S.; Bekhoukh, A.; Berenguer, R.; Benyoucef, A.; Morallon, E. PANI-Derived Polymer/Al2O3 Nanocomposites: Synthesis, Characterization, and Electrochemical Studies. Colloid Polym. Sci. 2016, 294, 1877–1885. [Google Scholar] [CrossRef]
- Rahim, A.; Teknologi, U.; Ahmad, M.; Noor, M.; Bouzid, B.; Sapienza, L.; Carvalho, I.; Shivaji Mahavidyalaya, S.; Dickert, I.; de la Rosa, G.; et al. Synthesis of WO3-Polyaniline Composites and Their Gas Properties. Sens. Transducers J. 2010, 113, 82–94. [Google Scholar]
- Dakshayini, B.S.; Reddy, K.R.; Mishra, A.; Shetti, N.P.; Malode, S.J.; Basu, S.; Naveen, S.; Raghu, A.V. Role of Conducting Polymer and Metal Oxide-Based Hybrids for Applications in Ampereometric Sensors and Biosensors. Microchem. J. 2019, 147, 7–24. [Google Scholar] [CrossRef]
- Chidembo, A.T.; Aboutalebi, S.H.; Konstantinov, K.; Wexler, D.; Liu, H.K.; Dou, S.X. Liquid Crystalline Dispersions of Graphene-Oxide-Based Hybrids: A Practical Approach towards the Next Generation of 3D Isotropic Architectures for Energy Storage Applications. Part. Part. Syst. Charact. 2014, 31, 465–473. [Google Scholar] [CrossRef]
- Wang, H.; Ma, G.; Tong, Y.; Yang, Z. Biomass Carbon/Polyaniline Composite and WO3 Nanowire-Based Asymmetric Supercapacitor with Superior Performance. Ionics 2018, 24, 3123–3131. [Google Scholar] [CrossRef]
- Yuan, C.; Lin, H.; Lu, H.; Xing, E.; Zhang, Y.; Xie, B. Anodic Deposition and Capacitive Property of Nano-WO3·H2O/MnO2 Composite as Supercapacitor Electrode Material. Mater. Lett. 2015, 148, 167–170. [Google Scholar] [CrossRef]
- Yao, S.; Zheng, X.; Zhang, X.; Xiao, H.; Qu, F.; Wu, X. Facile Synthesis of Flexible WO3 Nanofibers as Supercapacitor Electrodes. Mater. Lett. 2017, 186, 94–97. [Google Scholar] [CrossRef]
- Wang, S.-H.; Shen, C.-Y.; Su, J.-M.; Chang, S.-W. A Room Temperature Nitric Oxide Gas Sensor Based on a Copper-Ion-Doped Polyaniline/Tungsten Oxide Nanocomposite. Sensors 2015, 15, 7084–7095. [Google Scholar] [CrossRef] [PubMed]
- Yuksel, R.; Durucan, C.; Unalan, H.E. Ternary Nanocomposite SWNT/WO3/PANI Thin Film Electrodes for Supercapacitors. J. Alloy Compd. 2016, 658, 183–189. [Google Scholar] [CrossRef]
- Kumar, R.; Yadav, B.C. Fabrication of Polyaniline (PANI)—Tungsten Oxide (WO3) Composite for Humidity Sensing Application. J. Inorg. Organomet. Polym. Mater. 2016, 26, 1421–1427. [Google Scholar] [CrossRef]
- Wei, H.; Yan, X.; Wu, S.; Luo, Z.; Wei, S.; Guo, Z. Electropolymerized Polyaniline Stabilized Tungsten Oxide Nanocomposite Films: Electrochromic Behavior and Electrochemical Energy Storage. J. Phys. Chem. C 2012, 116, 25052–25064. [Google Scholar] [CrossRef]
- Janáky, C.; de Tacconi, N.R.; Chanmanee, W.; Rajeshwar, K. Electrodeposited Polyaniline in a Nanoporous WO3 Matrix: An Organic/Inorganic Hybrid Exhibiting Both p- and n-Type Photoelectrochemical Activity. J. Phys. Chem. C 2012, 116, 4234–4242. [Google Scholar] [CrossRef]
- Samu, G.F.; Pencz, K.; Janáky, C.; Rajeshwar, K. On the Electrochemical Synthesis and Charge Storage Properties of WO3/Polyaniline Hybrid Nanostructures. J. Solid State Electrochem. 2015, 19, 2741–2751. [Google Scholar] [CrossRef]
- Song, X.; Yan, L.; Dai, C.; Hao, C.; Guo, H.; Xie, M.; Zhang, Y. Preparation of complementary electrochromic devices with WO3/PANI and NiO/PB double-hybrid electrodes. J. Mater. Sci. Mater. Electron. 2022, 33, 8292–8304. [Google Scholar] [CrossRef]
- Kadam, A.V.; Patil, S.B. Polyaniline Globules as a Catalyst for WO3 Nanoparticles for Supercapacitor Application. Mater. Res. Express 2018, 5, 085036. [Google Scholar] [CrossRef]
- Asim, N.; Syuhami, M.F.; Badiei, M.; Yarmo, M.A. WO3 Modification by Synthesis of Nanocomposites. APCBEE Procedia 2014, 9, 175–180. [Google Scholar] [CrossRef]
- Khlyustova, A.; Sirotkin, N.; Kraev, A.; Titov, V.; Agafonov, A. Parameters of Underwater Plasma as a Factor Determining the Structure of Oxides (Al, Cu, and Fe). Materialia 2021, 16, 101081. [Google Scholar] [CrossRef]
- Khlyustova, A.V.; Sirotkin, N.A.; Kraev, A.S.; Titov, V.A.; Agafonov, A.V. Synthesis and Characterization of Titanium Oxide Nanoparticles by Plasma in Contact with Liquid. Plasma Chem. Plasma Process. 2021, 41, 643–657. [Google Scholar] [CrossRef]
- Sirotkin, N.A.; Khlyustova, A.V.; Titov, V.A.; Krayev, A.S.; Nikitin, D.I.; Dmitrieva, O.A.; Agafonov, A.V. Synthesis and Photocatalytic Activity of WO3 Nanoparticles Prepared by Underwater Impulse Discharge. Plasma Chem. Plasma Process. 2020, 40, 571–587. [Google Scholar] [CrossRef]
- Morent, R.; De Geyter, N.; Verschuren, J.; De Clerck, K.; Kiekens, P.; Leys, C. Non-Thermal Plasma Treatment of Textiles. Surf. Coat. Technol. 2008, 202, 3427–3449. [Google Scholar] [CrossRef]
- Khlyustova, A.; Sirotkin, N.; Kraev, A.; Agafonov, A.; Titov, V. Effect of Metal Oxides Added onto Polyvinyl Alcohol via Pulsed Underwater Plasma on Their Thermal, Electrical and Dielectric Properties. J. Appl. Polym. Sci. 2021, 138, 51174. [Google Scholar] [CrossRef]
- Hontañón, E.; Palomares, J.M.; Stein, M.; Guo, X.; Engeln, R.; Nirschl, H.; Kruis, F.E. The Transition from Spark to Arc Discharge and Its Implications with Respect to Nanoparticle Production. J. Nanopart. Res. 2013, 15, 1957. [Google Scholar] [CrossRef]
- Miron, C.; Bratescu, M.A.; Saito, N.; Takai, O. Time-Resolved Optical Emission Spectroscopy in Water Electrical Discharges. Plasma Chem. Plasma Process. 2010, 30, 619–631. [Google Scholar] [CrossRef]
- Popov, A.; Brasiunas, B.; Mikoliunaite, L.; Bagdziunas, G.; Ramanavicius, A.; Ramanaviciene, A. Comparative Study of Polyaniline (PANI), Poly(3,4-Ethylenedioxythiophene) (PEDOT) and PANI-PEDOT Films Electrochemically Deposited on Transparent Indium Thin Oxide Based Electrodes. Polymers 2019, 172, 133–141. [Google Scholar] [CrossRef]
- Deshmukh, M.A.; Patil, H.K.; Bodkhe, G.A.; Yasuzawa, M.; Koinkar, P.; Ramanaviciene, A.; Shirsat, M.D.; Ramanavicius, A. EDTA-Modified PANI/SWNTs Nanocomposite for Differential Pulse Voltammetry Based Determination of Cu(II) Ions. Sens. Actuators B Chem. 2018, 260, 331–338. [Google Scholar] [CrossRef]
- Wei, Y.; Jang, G.-W.; Hsueh, K.F.; Scherr, E.M.; MacDiarmid, A.G.; Epstein, A.J. Thermal Transitions and Mechanical Properties of Films of Chemically Prepared Polyaniline. Polymer 1992, 33, 314–322. [Google Scholar] [CrossRef]
- Bhandari, S. Polyaniline: Structure and Properties Relationship. In Polyaniline Blends, Composites, and Nanocomposites; Elsevier: Amsterdam, The Netherlands, 2018; pp. 23–60. [Google Scholar] [CrossRef]
- Bava, A.; Gornati, R.; Cappellini, F.; Caldinelli, L.; Pollegioni, L.; Bernardini, G. D-Amino Acid Oxidase–Nanoparticle System: A Potential Novel Approach for Cancer Enzymatic Therapy. Nanomedicine 2013, 8, 1797–1806. [Google Scholar] [CrossRef] [PubMed]
- Abdiryim, T.; Xiao-Gang, Z.; Jamal, R. Comparative Studies of Solid-State Synthesized Polyaniline Doped with Inorganic Acids. Mater. Chem. Phys. 2005, 90, 367–372. [Google Scholar] [CrossRef]
- Najafi-Ashtiani, H.; Bahari, A.; Gholipour, S.; Hoseinzadeh, S. Structural, Optical and Electrical Properties of WO3-Ag Nanocomposites for the Electro-Optical Devices. Appl. Phys. A 2018, 124, 24. [Google Scholar] [CrossRef]
- Wang, Y.; Jing, X. Formation of Polyaniline Nanofibers: A Morphological Study. J. Phys. Chem. B 2008, 112, 1157–1162. [Google Scholar] [CrossRef]
- Xu, H.; Chen, X.; Zhang, J.; Wang, J.; Cao, B.; Cui, D. NO2 Gas Sensing with SnO2–ZnO/PANI Composite Thick Film Fabricated from Porous Nanosolid. Sens. Actuators B Chem. 2013, 176, 166–173. [Google Scholar] [CrossRef]
- Halasa, A.F.; Wathen, G.D.; Hsu, W.L.; Matrana, B.A.; Massie, J.M. Relationship between Interchain Spacing of Amorphous Polymers and Blend Miscibility as Determined by Wide-Angle X-ray Scattering. J. Appl. Polym. Sci. 1991, 43, 183–190. [Google Scholar] [CrossRef]
- Hassen, A.; El Sayed, A.M.; Morsi, W.M.; El-Sayed, S. Influence of Cr2O3 Nanoparticles on the Physical Properties of Polyvinyl Alcohol. J. Appl. Phys. 2012, 112, 093525. [Google Scholar] [CrossRef]
- Rahman, S.U.; Röse, P.; Shah, A.U.H.A.; Krewer, U.; Bilal, S.; Farooq, S. Exploring the Functional Properties of Sodium Phytate Doped Polyaniline Nanofibers Modified FTO Electrodes for High-Performance Binder Free Symmetric Supercapacitors. Polymers 2021, 13, 2329. [Google Scholar] [CrossRef]
- Popov, A.; Brasiunas, B.; Damaskaite, A.; Plikusiene, I.; Ramanavicius, A.; Ramanaviciene, A. Electrodeposited Gold Nanostructures for the Enhancement of Electrochromic Properties of PANI–PEDOT Film Deposited on Transparent Electrode. Polymers 2020, 12, 2778. [Google Scholar] [CrossRef]
- Simon, P.; Gogotsi, Y.; Dunn, B. Where Do Batteries End and Supercapacitors Begin? Science 2014, 343, 1210–1211. [Google Scholar] [CrossRef] [PubMed]
- Rahman, S.U.; Röse, P.; Surati, M.; Shah, A.U.H.A.; Krewer, U.; Bilal, S. 3D Polyaniline Nanofibers Anchored on Carbon Paper for High-Performance and Light-Weight Supercapacitors. Polymers 2020, 12, 2705. [Google Scholar] [CrossRef] [PubMed]
- Noori, A.; El-Kady, M.F.; Rahmanifar, M.S.; Kaner, R.B.; Mousavi, M.F. Towards establishing standard performance metrics for batteries, supercapacitors and beyond. Chem. Soc. Rev. 2019, 48, 1272–1341. [Google Scholar] [CrossRef] [PubMed]
Figure 1.
The emission spectrum of discharge ignited in PANI water suspension (tungsten electrodes, current—0.25 A).
Figure 1.
The emission spectrum of discharge ignited in PANI water suspension (tungsten electrodes, current—0.25 A).

Figure 2.
UV–Vis absorbance spectra of PANI and nanocomposites of PANI + WO3 (a) and Tauc plots for samples (b).
Figure 2.
UV–Vis absorbance spectra of PANI and nanocomposites of PANI + WO3 (a) and Tauc plots for samples (b).

Figure 3.
FTIR spectra of samples.

Figure 4.
XRD patterns of samples.

Figure 5.
SEM images of samples.

Figure 6.
TEM images of samples.

Figure 7.
Cyclic voltammogram records of PANI and PANI + WO3 composites at a scanning rate of 100 mV/s (a), galvanostatic charge–discharge curves of samples (b), and cyclic stability at 1.0 A/g over 1000 cycles for material (c).
Figure 7.
Cyclic voltammogram records of PANI and PANI + WO3 composites at a scanning rate of 100 mV/s (a), galvanostatic charge–discharge curves of samples (b), and cyclic stability at 1.0 A/g over 1000 cycles for material (c).


Table 1.
Sputtering rates of electrodes and concentration of tungsten trioxide in PANI.
| Sample | υ, g/h | Concentration, wt% | |
|---|---|---|---|
| Anode | Cathode | ||
| PANI + WO3 0.25 A | 0.324 | 0.039 | 3.03 |
| PANI + WO3 0.8 A | 0.546 | 0.067 | 5.11 |
Table 2.
IR-spectral bands of PANI and PANI + WO3 composites.
| Wavenumber [cm−1] | Assignments |
|---|---|
| 3473 | N-H stretching vibration |
| 3210 | O-H stretching |
| 2992 | symmetric -CH2- stretching vibration credited to pyranose ring |
| 2855 | N-H vibration |
| 1665 | C=N stretching vibrations of quinoid ring |
| 1583 | C=C stretching vibrations of quinoid ring |
| 1481 | C=C stretching vibrations of benzoid ring |
| 1306 | C–N stretching vibrations of aromatic ring |
| 1249 | C–N stretching vibrations in aromatic primary amine |
| 1125, 1027 | in-plane bending vibrations of aromatic C–H |
| 795 | aromatic C–H out of plane bending |
| 665, 595 | W-O Stretching |
Table 3.
Structural characteristics of PANI and composites.
| Sample | DPANI, nm | DWO3, nm | R, nm |
|---|---|---|---|
| PANI | 10.5 | --- | 0.81 |
| PANI + WO3 0.25 A | 9.4 | 30 | 0.79 |
| PANI + WO3 0.8 A | 9.1 | 34 | 0.80 |
Table 4.
Texture properties of PANI and PANI + WO3 composites.
| Sample | SBET, m2g−1 | SBJH, m2g−1 | Dp, nm | Vp, cm3g−1 |
|---|---|---|---|---|
| PANI | 15.26 | 8.04 | 2.99 | 0.0181 |
| PANI + WO3 0.25 A | 16.51 | 9.57 | 3.42 | 0.0265 |
| PANI + WO3 0.8 A | 16.74 | 9.73 | 3.81 | 0.0268 |
Table 5.
The charge storage properties of the samples.
| Sample | Potential Window (V) | Sweep Rate (V/s) | Specific Capacitance (F/g) |
|---|---|---|---|
| PANI | −0.1–1.0 | 0.1 | 27.45 |
| PANI + WO3 0.25 A | −0.1–1.0 | 0.1 | 83.22 |
| PANI + WO3 0.8 A | −0.1–1.0 | 0.1 | 87.46 |
Disclaimer/Publisher’s Note: The statements, opinions and data contained in all publications are solely those of the individual author(s) and contributor(s) and not of MDPI and/or the editor(s). MDPI and/or the editor(s) disclaim responsibility for any injury to people or property resulting from any ideas, methods, instructions or products referred to in the content. |
© 2023 by the authors. Licensee MDPI, Basel, Switzerland. This article is an open access article distributed under the terms and conditions of the Creative Commons Attribution (CC BY) license (https://creativecommons.org/licenses/by/4.0/).
Share and Cite
MDPI and ACS Style
Sirotkin, N.; Khlyustova, A. Plasma Synthesis and Characterization of PANI + WO3 Nanocomposites and their Supercapacitor Applications. J. Compos. Sci. 2023, 7, 174. https://doi.org/10.3390/jcs7040174
AMA Style
Sirotkin N, Khlyustova A. Plasma Synthesis and Characterization of PANI + WO3 Nanocomposites and their Supercapacitor Applications. Journal of Composites Science. 2023; 7(4):174. https://doi.org/10.3390/jcs7040174
Chicago/Turabian StyleSirotkin, Nikolay, and Anna Khlyustova. 2023. "Plasma Synthesis and Characterization of PANI + WO3 Nanocomposites and their Supercapacitor Applications" Journal of Composites Science 7, no. 4: 174. https://doi.org/10.3390/jcs7040174