Article

Wear Behavior of AZ61 Matrix Hybrid Composite Fabricated via Friction Stir Consolidation: A Combined RSM Box–Behnken and Genetic Algorithm Optimization

by
Samuel Kefyalew Abebe
1,
Habtamu Beri
1,
Devendra Kumar Sinha
1,2,*,
Ali A. Rajhi
3,
Nazia Hossain
4,*,
Alaauldeen A. Duhduh
5,
Shaik Zainuddin
6,7 and
Gulam Mohammed Sayeed Ahmed
1,2
1
Department of Mechanical Engineering, School of Mechanical, Chemical and Materials Engineering, Adama Science & Technology University, Adama 1888, Ethiopia
2
Center of Excellence (COE) for Advanced Manufacturing Engineering, Department of Mechanical Engineering, Adama Science & Technology University, Adama 1888, Ethiopia
3
Department of Mechanical Engineering, College of Engineering, King Khalid University, Abha 61421, Saudi Arabia
4
School of Engineering, RMIT University, Melbourne, VIC 3001, Australia
5
Department of Mechanical Engineering Technology, College of Applied Industrial Technology, Jazan University, Prince Mohammed Street, P.O. Box 114, Jazan 45142, Saudi Arabia
6
Department of Materials Science and Engineering, Tuskegee University, Tuskegee, AL 36088, USA
7
Center for Advanced Materials, Tuskegee University, Tuskegee, AL 36088, USA
*
Authors to whom correspondence should be addressed.
J. Compos. Sci. 2023, 7(7), 275; https://doi.org/10.3390/jcs7070275
Submission received: 9 June 2023 / Revised: 23 June 2023 / Accepted: 26 June 2023 / Published: 4 July 2023
(This article belongs to the Section Composites Modelling and Characterization)

Abstract

:
Friction stir consolidation (FSC) is a promising manufacturing process for metal matrix hybrid composites (MMHC) with excellent mechanical properties. The originality of this study involves the exploration of the fabrication technique (FSC), the selection of materials and the optimization of wear behavior via a systematic investigation of the process parameters. The aim of this study was to optimize and investigate the wear behavior of MMHCs fabricated using FSC. The optimum sample was nominated for thermogravimetric analysis (TGA) and wear morphology analysis using SEM imaging. Material compositions of 7.5%wt of SiC, 7.5%wt of ZrO2 and 85%wt of AZ61 were considered for the experimental investigation. The RSM Box–Behnken design followed by a genetic algorithm (GA) was implemented to optimize the process parameters of sliding distance, speed and load at 350 m, 500 m and 650 m; 220 rpm, 240 rpm and 260 rpm; and 20 N, 30 N and 40 N, respectively. The RSM Box–Behnken result showed that the minimum wear rate of 0.008 mg/m was obtained at 350 m, 20 N and 240 rpm, whereas GA predicted the optimum parametric setup at 350 m, 20 N and 220 rpm. Additionally, TGA showed the material’s thermal stability from 375 °C to 480 °C. Generally, MMHCs exhibited a promising wear performance, proving the effectiveness of the FSC.

1. Introduction

Composite materials are a combination of two or more materials, in which every single material has its own desirable property contribution, which contributes to the final property of the composite. Primarily, the aim of producing a metal matrix composite (MMC) is to enhance the property of a matrix material, which cannot be attained by itself [1]. For instance, the primary reason for the selection of matrix materials is their lower density and wettability properties in order to achieve less weight, so that a high strength-to-weight ratio can be achieved. Magnesium alloys are known for their low density, high strength-to-weight ratio, and excellent damping capacity, which make them attractive for a wide range of applications in the aerospace and automotive industries. However, the low wear resistance of magnesium alloys limits their use in high-stress applications. In order to address this limitation, researchers reinforced magnesium alloys with different reinforcements, such as silicon carbide, which significantly improves the wear resistance. However, not only can reinforcement significantly affect the MMC materials but the synthesis processes via which the materials pass can also significantly affect the final property of the composite material. According to researchers, metal matrix composites with the same composition but synthesized via different processes, such as stir casting and powder metallurgy, possess different properties [2,3]. There are numerous processing methods for MMC materials, of which the dominant methods of MMC fabrication are stir casting and powder metallurgy techniques, which have several drawbacks. For instance, a study revealed the major drawbacks of the stir casting process and listed them as problems in insufficient wetting, non-uniform distribution of reinforcements across the melted matrix and agglomeration of reinforcements [4]. Furthermore, the drawbacks of the stir casting process are the fracture of reinforcement particles, gas entrapment and local solidification [5]. In addition to this, researchers identified that the high temperature in stir casting resulted in the formation of aluminum carbide, which was very brittle and affected the final mechanical properties during the experimentation of the Al-SiC metal matrix composite [6]. As a result, these processes exhibit an inferior wear property for the produced MMCs. Friction stir consolidation (FSC) is a thermo-mechanical process in which powders or particles are pressed under the high pressure of a rotating die inside a fixed chamber to produce frictional heat. Thus, the heat created due to the rotational motion under high-pressure results in the plasticization of the matrix material, which helps in the creation of sufficient heat so that bonds among powders or particles can occur. Moreover, the process is operated at relatively low temperatures, reducing the risk of defects associated with high-temperature methods. The development of high-performance magnesium alloy matrix composites with improved wear resistance is essential for expanding their potential use in engineering applications. However, the fabrication of magnesium alloy matrix composites using prevalent methods, such as stir casting and powder metallurgy, is associated with several challenges, including porosity, poor bonding and uneven distribution of the reinforcing particles. Moreover, magnesium alloy matrix composites are widely used in aerospace and automotive industries due to their high strength and high specific strength. However, they are prone to wear and thermal deformation at high temperatures, which can limit their performance and durability. Thus, to adopt the FSC process for the production of metal matrix composites, the properties of the produced samples should meet the desired tribological and thermal properties. Likewise, the application areas for metal matrix composite materials are in different fields of technology, such as aerospace (engine parts, landing gear components and structural elements), military (armor systems, ballistic protection and military vehicle components), automotive (brake discs, pistons, connecting rods and cylinder liners) and electronics industries (heat sinks, electronic substrates and circuit boards). To improve the tribological and mechanical characteristics of matrix metals, different reinforcements are added, and corresponding composites are formed. The performance of MMC concerning their tribology and thermal property needs to be investigated [7]. V. Krishnaraj et al. [8] optimized the machining parameters for drilling carbon fiber-reinforced plastic laminates at high speeds by considering the process parameters (spindle speed and feed rate). Moreover, the authors implemented an analysis of variance (ANOVA) to investigate the percentage contribution of process parameters to the response with a confidence level of 95%, and they found that the thrust force was more influenced by the feed rate. In addition to this, the authors developed and confirmed a regression model with error percentages of 3.411% to 8.9122% for different responses. Likewise, they used a genetic algorithm via MATLAB R2010a, and the optimized operating condition predicted by the GA was found to be 12,000 rpm at 0.137 mm/rev. R. Zitoune et al. [9] investigated the effect of process parameters (spindle speed (rpm) 2020 and 2750; feed rate (mm/rev) 0.05, 0.1, 0.15 and 0.3) on the tool wear during drilling of copper mesh/CFRP/woven ply experimentally and they found that increasing the spindle speed from 2020 rpm to 2750 rpm led to a minor decrease in the thrust force. Due to the friction between the tool and CFRP, increasing the spindle speed increases the temperature of machining, which softens the material and reduces the thrust force.
The aim of this study is the optimization of the wear properties of magnesium alloy matrix hybrid composites using the RSM Box–Behnken approach followed by a genetic algorithm. Thermogravimetric analysis for the optimum sample is typically selected to cover the ranges of temperature that the material is expected to experience during its service life and to address the effect of processing parameters, such as load, sliding speed and sliding distance, on the wear rate of the MMHCs produced via the FSC process. Furthermore, this research aims to develop a regression model for predicting the wear behavior of magnesium alloy hybrid composites based on independent variables. The wear behavior of magnesium alloy (AZ61) matrix composite materials produced by the FSC process has not been investigated so far. Likewise, there is a lack of studies when it comes to the analysis of the wear and thermal properties of MMHCs fabricated using the FSC process. Therefore, the purpose of this study is to fill this gap by examining the wear and thermal behavior of MMHCs fabricated via the FSC process.

2. Materials and Methods

2.1. Materials

In this experimental study, 7.5%wt of SiC and 7.5%wt of ZrO2 as a reinforcement and 85%wt of AZ61 magnesium alloy in weight percent as a matrix were used for the fabrication of magnesium alloy matrix hybrid composite. Table 1 lists the chemical composition of AZ61 aluminium alloy [10]. The average matrix morphology was mostly spherical with an average diameter of 130 micrometer, whereas the sizes of ZrO2 and SiC were 5–20 μm with an average diameter of 15 micrometer (for most powders) and 15–20 with an average size of 17 μm, respectively.
The detailed methodology of this experimental study is classified as material preparation method (FSC), wear rate test method (pin-on-disc apparatus), experimental design (RSM Box–Behnken design), GA optimization, verification of optimized results and finally a comparison of optimum results predicted by the RSM Box–Behnken model and GA. The AZ61 magnesium alloy powder was mixed with the reinforcements (SiC and ZrO2) in the desired proportions (7.5%wt of SiC, 7.5%wt of ZrO2 and 85%wt of AZ61) for 20 min using a high-energy ball mixer to obtain a uniform distribution of reinforcements. Similarly, ½ balls to powder ratios were taken during the milling or mixing process, and 10 mm zirconia balls were used. The mixture was then loaded into a friction stir consolidation process development system and consolidated under appropriate process parameters, including applied load, consolidating time, speed, thickness and composition, to produce the magnesium alloy matrix hybrid composite. The magnesium alloy hybrid composite samples were fabricated based on the pre-optimized FSC process parameters listed in Table 2.
The FSC process assembly on a conventional milling machine is illustrated in Figure 1, in which the hybrid magnesium matrix composite was processed. The upper rotating die illustrated in the figure below was assembled on the spindle of a conventional milling machine, and the non-rotating bottom die was firmly gripped by the vice attached to the table of the milling machine. The non-rotating bottom die was made split to allow easy removal of the consolidated sample.

2.2. RSM Box–Behnken Experimental Design

The Box–Behnken optimization technique was used to design the experiments. This design allows for efficient modeling of the response surface and the estimation of the interaction effects between factors and quadratic effects. Additionally, it provides a more detailed analysis of the responses and allows for optimization within the design space. Three independent variables—load, sliding speed and sliding distance—were selected as the input parameters. Each variable was varied at three levels (−1, 0 and 1) based on their low, central and high values, respectively, as presented in Table 3. Then, the experimental data obtained from the wear testing were analyzed using the statistical software Minitab 19 to develop a model to predict the wear rate as a function of the input process parameters. The model was optimized to identify the optimum parametric combination for the minimum wear rate of the MMHCs.
A total of 15 experiments were performed to cover the Box–Behnken design space and investigate the effect of the input variables on the wear properties of the AZ61 magnesium alloy matrix composite, as shown in Table 4.

3. Pin-On-Disc Wear Testing

The pin-on-disc wear testing machine was used to evaluate the wear rate of the magnesium alloy matrix composite samples. A steel disc was used as the counter face material, and the samples were subjected to predetermined parametric combinations at room temperature. Finally, the wear rates of the samples were measured. Figure 2 shows a sample ready to mount and being tested. To study the tribological behavior of the composites, dry sliding wear tests were carried out in accordance with ASTM G99-05 using a pin-on-disk wear tester of DUCOM TR-20 instrument (instruments Pvt. Ltd. Company in Peenya Industrial Area, Bangalore, India). ASTM G99-05 states that the length-to-diameter ratio is not to exceed two units. Therefore, the samples were prepared with a diameter of 6 mm and length of 12 mm, mounted on a pin on the disc apparatus of the wear testing machine. The dry sliding wear rate test was conducted at room temperature (20 °C). According to various studies, wear rates are calculated by converting the mass loss measurements into volume loss using the corresponding densities [11]. In another study, the wear rates of metal matrix composites were calculated using Equation (1) below [12].
Wear   rate = ( M a s s   o f   p i n   b e f o r e   w e a r   t e s t M a s s   o f   p i n   a f t e r   w e a r   t e s t ) S l i d i n g   d i s t a n c e

4. Genetic Algorithm Optimization

A genetic algorithm is a type of optimization algorithm based on principles inspired by biological evolution. The algorithm starts with a population of candidate solutions and evolves through selection, crossover and mutation, in a process similar to natural selection [13,14,15,16,17,18]. The genetic algorithm is essential for predicting an excellent optimal solution compared to most conventional optimization techniques [16]. To check the global and local minima of the Box–Behnken model, a genetic algorithm was implemented using MATLAB 14a, and the optimized results were compared with the Box–Behnken model to ensure the accuracy of the optimization. The basic flowchart followed in this study is shown in Figure 3 [16].
The optimum process parameters were used to fabricate a new set of AZ61 magnesium alloy matrix composite samples, which were tested for their wear properties using a pin-on-disc wear testing machine. The wear rates of the optimized sample using RSM Box–Behnken design and GA were compared with those of the initial samples, and the results were analyzed statistically to verify the optimization.

5. Results

5.1. Wear Rate Parametric Optimization Using RSM Box–Behnken Design

When two solid surfaces move in close proximity, two significant tribological phenomena, called friction and wear, typically result in energy loss and material degradation [19]. Additionally, wear is caused by mechanical and/or chemical processes and is the gradual loss of material from one or both mating surfaces during sliding [20]. The test results showed that the minimum wear rate of 0.008 mg/m was recorded for the testing parameters of 20 N load, 240 RPM sliding speed and 350 m sliding distance at room temperature, and the highest wear rate of 0.181 mg/m was recorded at a parametric combination of 40 N load, 260 RPM speed and 500 m sliding distance. Table 5 shows the wear rate results for different loading conditions (20, 30 and 40 N), sliding speed (220 rpm, 240 rpm and 260 rpm) and sliding distance (350 m, 500 m and 650 m).
Kumar et al. [21] experimentally investigated the wear property of AA8011/Boron Nitride metal matrix composite and considered four parameters, namely, the volume fraction of reinforcement (V) (7.5 10 12.5), load (L) (75 100 125 N), time (T) (30 40 50 min) and speed (S) (200 220 240 rpm), for wear parameter optimization using Taguchi design. In addition, the authors found that the optimum parametric setup for minimum wear was V, L, T and S at 12.5 V, 75 N, 200 rpm and 30 min, respectively, for a minimum wear of 70.12 μm. The effect of load [10 30 50 N], sliding velocity (2 3 4 m/s), %wt of red mud (3 4 5 %wt) and counterpart material hardness (58 60 62 HRC) on the wear behavior of red mud-reinforced aluminum composites was experimentally investigated and optimized using grey relation analysis for the responses of specific wear and coefficient of friction (COF) [22]. The results showed that the optimum parametric setup of the load was at 10 N, sliding velocity at 3 m/s, 5%wt of red mud and counterpart material hardness at 62 HRC. Researchers studying the tribological properties of AA6061 at 10, 20 and 30 N loads, reinforced with different compositions of ZrB2 processed via the stir casting route, found a wear rate of 0.0044 mm3/m [23]. This shows that the samples produced via the friction stir consolidation process exhibit acceptable wear rate behavior. Moreover, the different loading conditions of the wear study confirm and obey the law of Archard’s principle, which states that the wear rate and applied load are directly proportional [24]. The satisfying bond of SiC and ZrO2 with the AZ61 well resists the wear at load ranges of 20–40 N. Likewise, the sample pin experienced the highest stress at the interface of the rotating disc of the pin-on-disc wear test apparatus at the maximum load of 40 N.

5.2. Analysis of Variance

The accuracy and validity of the model have to be examined, which can be achieved using the analysis of variance [25]. Moreover, ANOVA is useful for analyzing the effects of each parameter and its influence on the extent to which they can affect the wear rate. To analyze the wear rate results, a significance level of 5% and a confidence level of 95% were taken into consideration. The influence of the load seems to have the highest contribution (73.6%) and the lowest speed contribution (4.49%), whereas the sliding distance accounts for about 9.19% of the wear rate. A p-value less than 0.05 indicates that the factors influence the wear rate significantly. Hence, the sliding distance, load and speed were found to be significant. Blaža Stojanovic et al. [26] also experimentally verified the significance of these parameters on the wear rate. The p-value of the lack-of-fit is 0.174, which is insignificant; this indicates how well the model fits the data [27]. R2 and R2 (Adj) accounted for about 96.80% and 91.03%, respectively, indicating the fitness of the model, as presented in Table 6. The interaction effects of two independent parameters on the wear rate are presented in Figure 4—(a) load and sliding speed, (b) load and sliding distance, and (c) sliding speed and sliding distance—by considering the other parameters at the medium level.
The surface plots show that the wear rate is higher at higher levels of load and minimum at lower levels of load. The surface plot results indicate that among the three factors, the load has the highest influence on the wear rate, whereas speed has the lowest effect compared to the sliding distance. This suggests that the load is the most significant factor affecting the wear rate, and changing the load can result in significant changes in the wear rate. Moreover, the surface plot analysis reveals that the effect of load versus speed on the wear rate is greater, which means that the combination of load and speed has a significant impact on the wear rate. Specifically, the analysis shows that the wear rate is more than 0.15 mg/m when higher levels of load and speed are combined. This suggests that increasing the load or speed alone may not have a significant effect on the wear rate; however, when both factors are combined at their higher level, there is a considerable increase in the wear rate. In contrast, lower levels of load and sliding speed can significantly lower the wear rate to 0.008 mg/m. Higher levels of sliding speed and load factors result in a wear rate of more than 0.15 mg/m, as shown in Figure 5a. However, the surface plot in Figure 5b indicates that the minimum wear rate, which was close to the optimum result, was obtained at minimum levels of load and sliding distance. The two factors with a moderate contribution to the wear rate, as presented in Figure 5c, produced a wear rate of 0.10 to 0.15 mg/m at their highest level and a wear rate of very close to 0.05 at their lowest level.
In a study by Uthayakumar et al. [28], dry sliding parameters were optimized on a metal matrix composite material of Fly Ash Reinforced AA-6351 by considering process parameters such as the applied load (9.81 19.62 29.43 N), sliding speed (1 2 3 m/s) and percentage of fly ash (5 10 15 %wt). Their results indicated that the optimum parametric combination for minimum wear was a load at 19.62 N sliding speed at 3 m/s and fly ash at a percentage of 5%wt In addition to this, their investigation revealed that the applied load and sliding speed are the most influential factors. Wear behavior parametric optimization of AA7075-Al2O3 composites fabricated via the stir casting route using the Taguchi technique was implemented by researchers, considering wear parameters such as the applied load at 10 30 40 N and sliding distance at 200 600 1200 m [29]. Their graphical and analytical result revealed that the optimum parametric combination that bears the minimum wear mass loss was found at a load of 10 N and a sliding distance of 400 m. In another study, wear properties of B4C and MoS2 reinforced copper metal matrix composites, considering wear parameters such as normal load (5 15 25 35 N), sliding distance (800 1600 2400 3200 m), sliding speed (0.565 1.13 1.7 2.26 m/s) and reinforcement composition (0 2.5 5 7.5 %wt) that were optimized using the Taguchi design. Their results indicated that the optimum parametric combination for the minimum wear loss was found at 7.5%wt, a load of 5 N, a sliding distance of 1600 m and a sliding speed of 1.13 m/s [30].
The results portrayed in Figure 5a indicate that the probability plot of residuals remained distinctly close to a straight line, confirming the normal distribution of errors and the good fit of the regression model to the obtained results [26,31]. Moreover, Figure 5b clearly shows the excellent relationship between the observed and fitted values, with a result variation between −0.15 and 0.15.

5.3. Mathematical Model

The regression equation predicts the relationship between the input variables (load, sliding speed and sliding distance) and response (wear rate) [32]. The equation represented in Equation (2) was obtained from the statistical software Minitab 19 In order to verify the correctness of the developed regression model, a verification experiment was conducted using different parametric combinations that did not exist in the RSM (Box–Behnken). Three different and random experimental combinations were used to verify the consistency of the regression model. Based on the findings of the confirmation experiments in Table 7, the wear rates obtained experimentally and those estimated using the regression model differed considerably by a small margin. An error percentage of less than 10% was recorded for all the experiments, which indicates that the developed regression model accurately estimates the wear rates for the given ranges of the experimental study [32].
Wear Rate = −0.2960 + 0.000128 X1 + 0.005436 X2 + 0.000671 X3
where W is the wear rate in mg/m, X1 is the sliding distance in m, X2 is the load in N and X3 is the speed in rpm. The verification experiment results in Table 7 show the consistency and reliability of the regression model with error percentages of 3.89%, 4.55% and 3.39% for experiment numbers 1, 2 and 3, respectively.

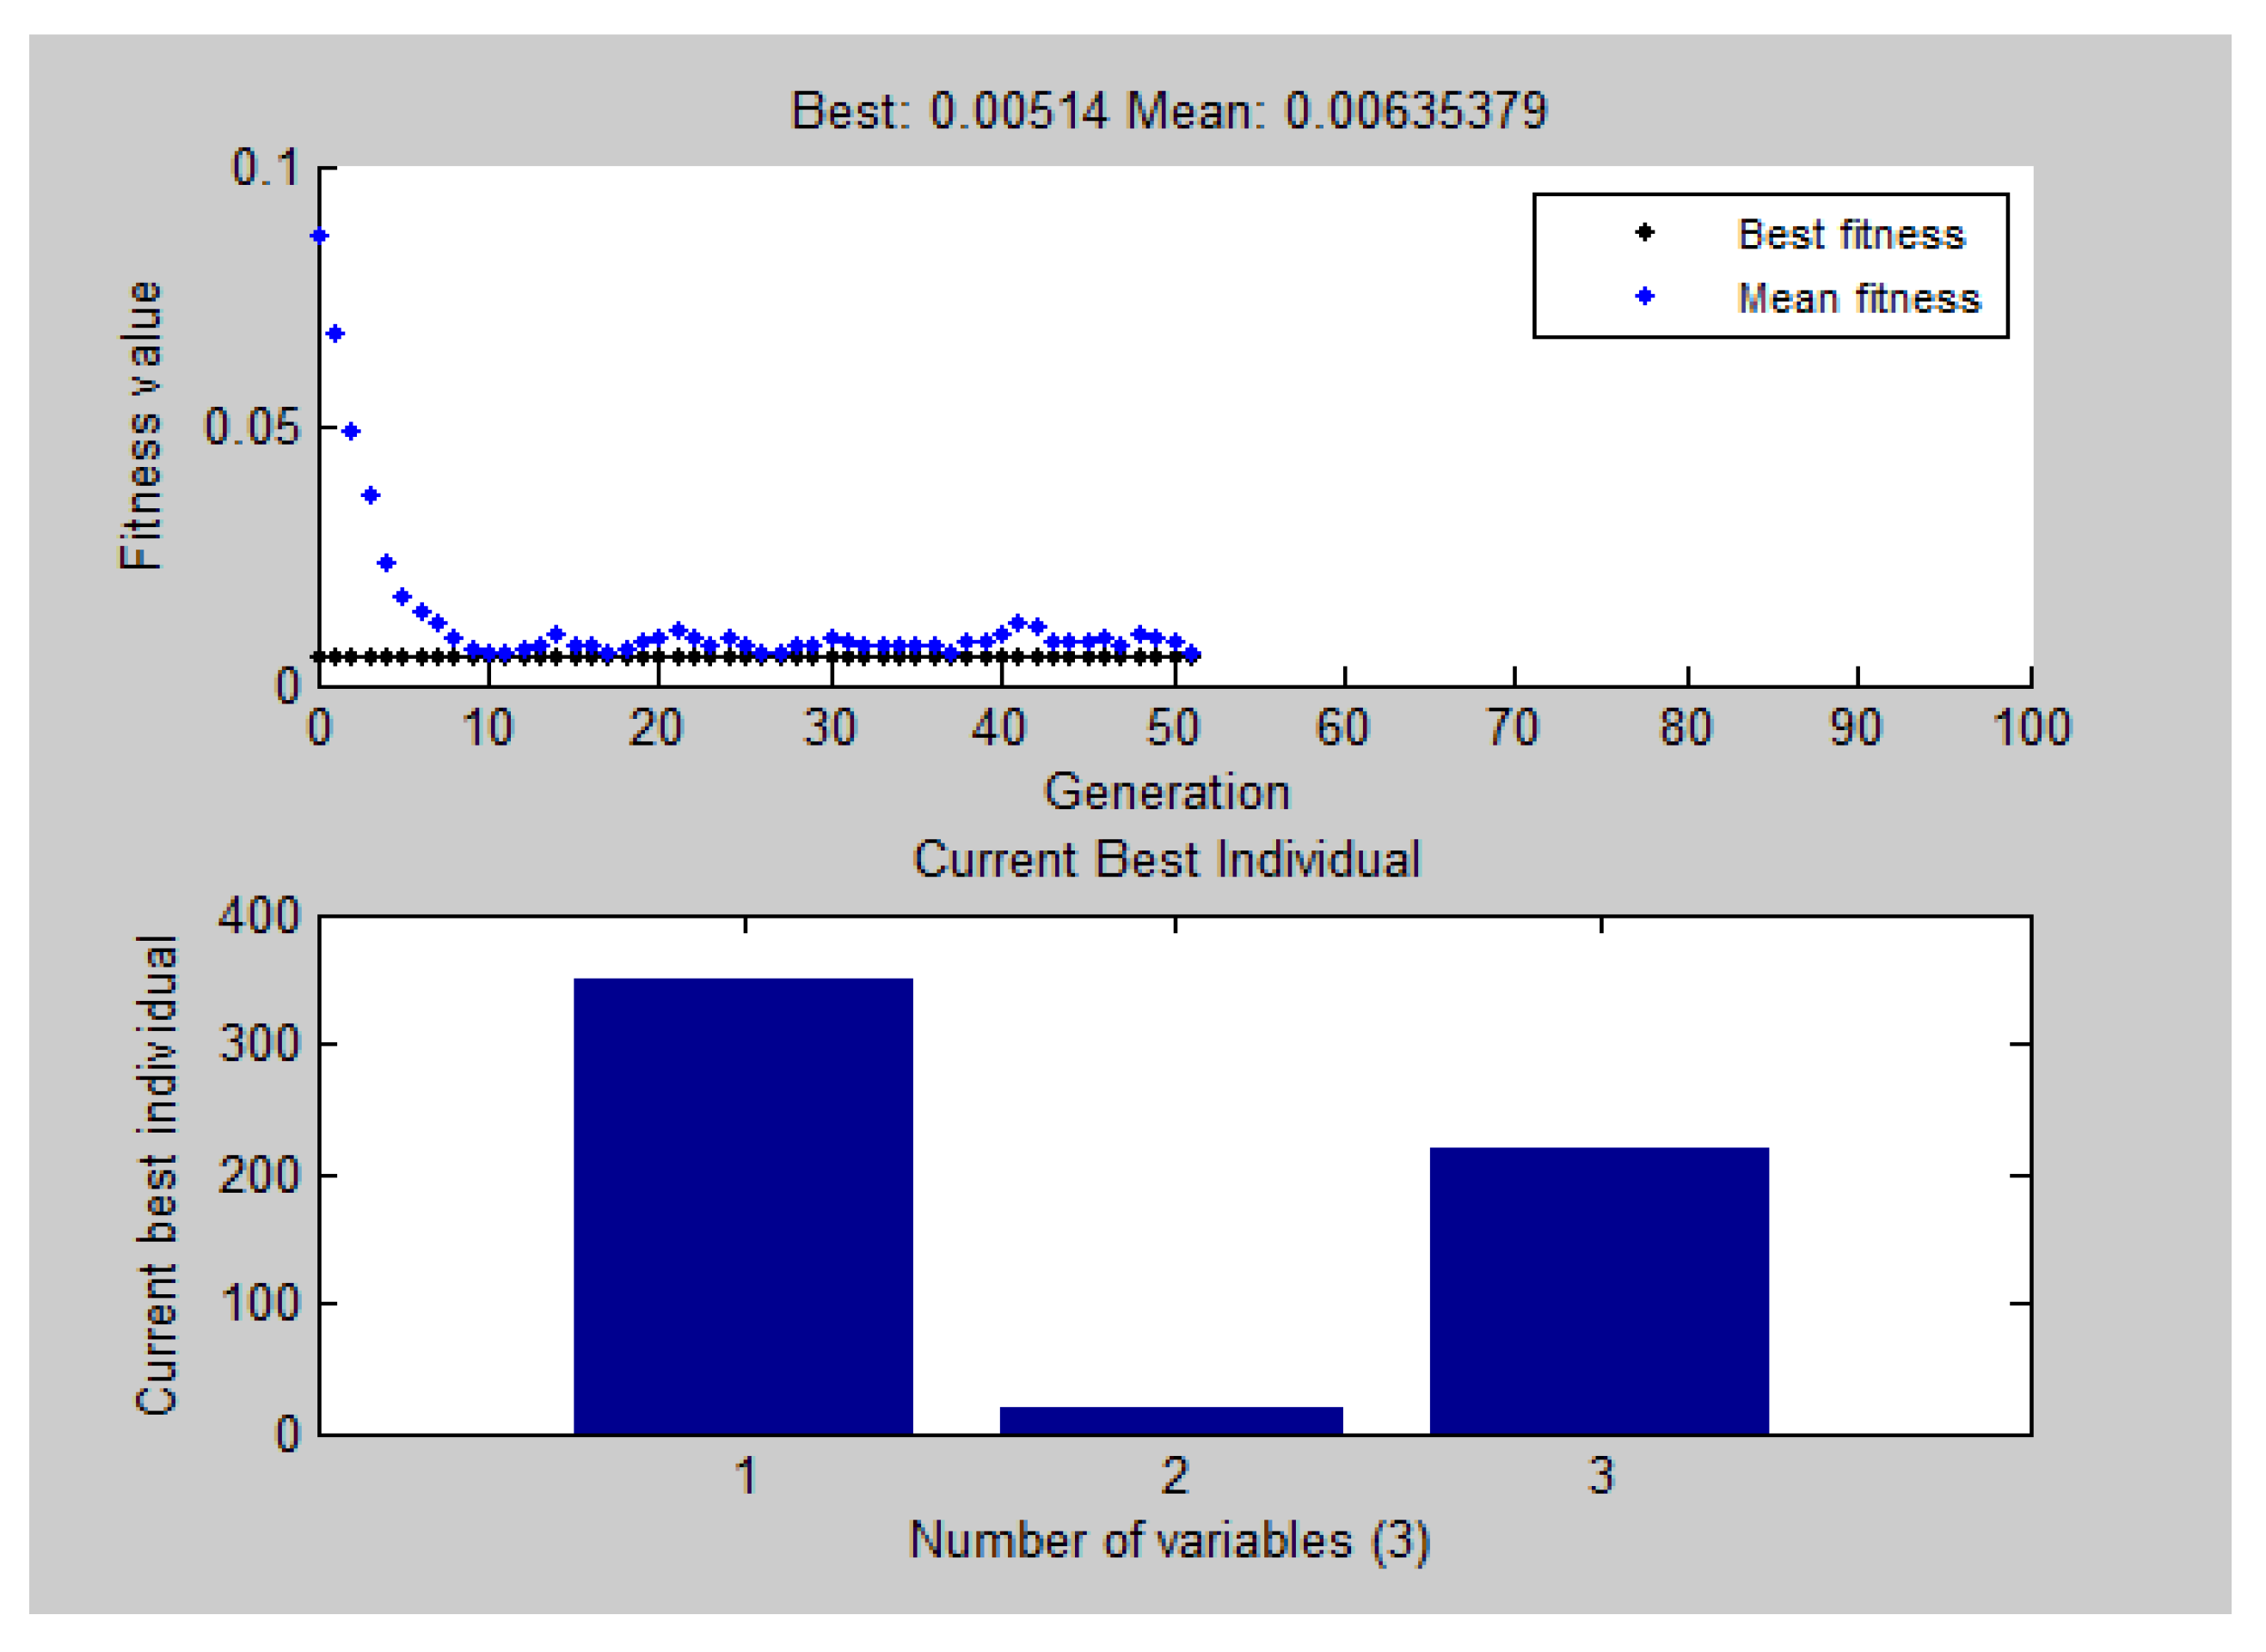
5.4. Parametric Optimization Using Genetic Algorithm

After the RSM Box–Behnken parametric optimization, the GA was executed using MATLAB R2014a to further optimize the value of the wear rate result. The generation and population sizes were 100 and 50, respectively. The fitness function 2 was transformed into a minimization problem in MATLAB to find the optimum result. Based on the levels of each process parameter, the upper and lower bounds were selected. Demography was selected as a double vector type of population [16]. The creation function of the constraint dependent was set. A uniform mutation with a mutation function at a rate of 0.15 was taken while the crossover fraction was 0.8, as illustrated in Table 8.
Moreover, roulette parent selection was preferred [16]. The most precise result of the minimum wear rate, which was predicted by the GA, was 0.00514 mg/m at 51 iterations, as presented in Figure 6. The optimum parametric combination with their corresponding levels for the minimum wear rate was load, sliding speed and sliding distance at 20 N, 220 RPM and 350 m, respectively, as illustrated in Table 9.

5.5. Verification Experiment for RSM and GA

The final step was to confirm the performance enhancement using the optimal levels of the design parameters for RSM (load, sliding speed and sliding distance at 20 N, 240 rpm and 350 m, respectively) and for GA (load, sliding speed and sliding distance at 20 N, 220 rpm and 350 m, respectively). Table 10 shows a comparison of the predicted and actual experimental results of RSM and GA with their corresponding errors in percentages. According to Table 10, an improvement in performance is noticed when the optimum conditions of GA are used. The three replication confirmation or verification experiments demonstrated the persistency and reliability of the regression equation developed by the Box–Behnken design, with an error percentage of 5%, whereas the GA prediction for the optimum parametric combination for the minimum wear rate was verified with an error percentage of 4.41%. The authors investigated the predicted and experimental errors optimized using RSM and GA, which were found to be 12.65%. However, they proved that ANN accurately predicted the wear rate results with an error percentage of zero [26]. In another study, where the wear rate was optimized using the Taguchi method, the error obtained was found to be 4.21% [33]. This showed that close results were achieved in previous studies.

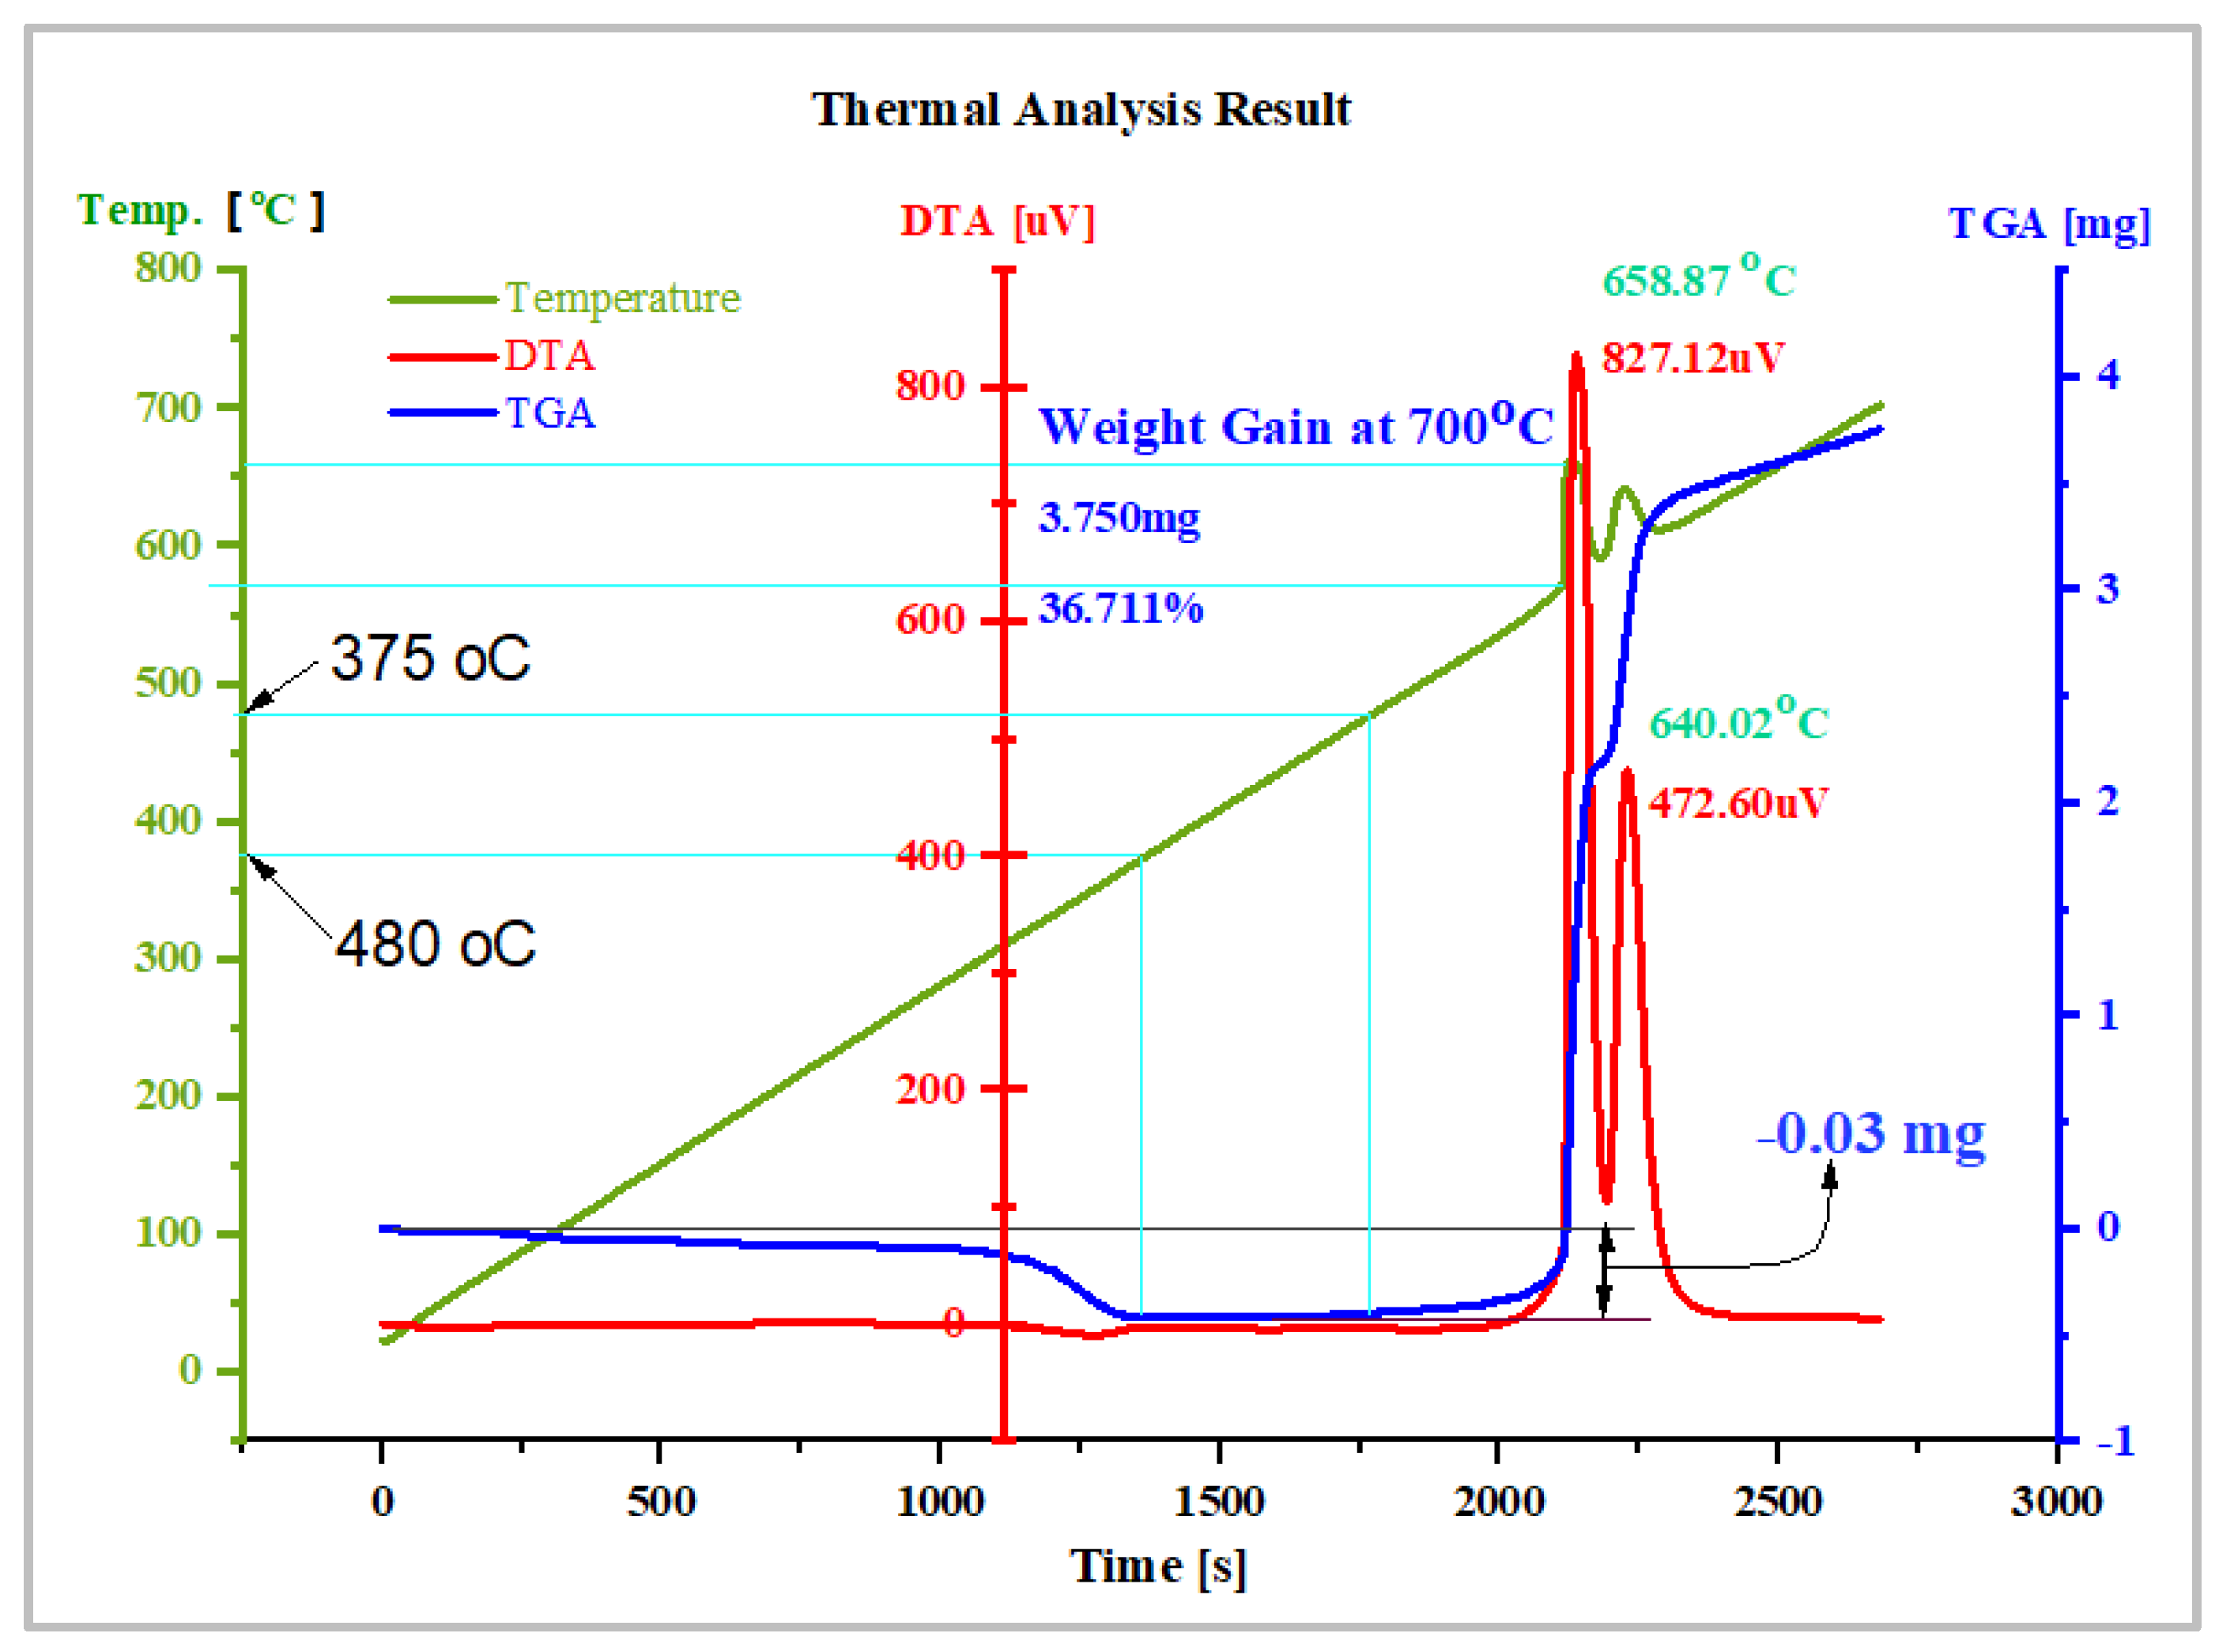
5.6. Thermogravimetric Analysis of Optimized Composite

Thermogravimetry analysis (TGA) is a thermal analysis method in which the material is tested for its weight loss at various temperatures over time. The friction stir consolidated sample was tested for TGA to verify its application in areas where it can meet stability under various temperatures. Likewise, the TGA analysis provides information about the temperature at which the sample starts to degrade or decompose with respect to time. The thermal analysis of the optimum sample is shown in Figure 7.
Thermogravimetric analysis (TGA) is a technique that is used to study the thermal decomposition of materials. Moreover, Nasrollahzadeh et al. [34] described TGA as a frequently used technique to analyze certain properties of materials that show mass gain or loss due to oxidation, decomposition, or loss of volatiles (such as moisture). In this study, the TGA of the optimum MMHC (85%wt AZ61-7.5%wt of ZrO2-7.5%wt of SiC) with a sample weight of 10.215 mg was conducted using a (DTG-60H detector SHIMADZU Corporation (Japan) Serial Number of C30575100456TK) at a heating rate of 15 °C/min over a temperature range of 15–700 °C in nitrogen gas at a flow rate of 50 mL/min. The results provided in Figure 7 show the temperature, DTA (differential thermal analysis), and TGA values at different time intervals. The results showed that weight loss increased negligibly until the temperature reached 375 °C. This may be likely due to the moisture escaping or the release of a volatile component [35]. From 375 °C to 480 °C, MMHC showed thermal stability with no weight loss or gain. Shyam et al. [35] conducted a thermal test for Al7075/SiC/Al2O3 hybrid composite, and the TGA result showed that the composites had good thermal stability from 400 °C to 600 °C. When the temperature surpassed 480 °C, the material showed slight weight gain. However, when the temperature surpassed 570 °C, the material started to gain weight eminently up to 3.75 mg, and the DTA exothermic peak occurred at a temperature of 658.87 °C witnessing a phase transition at that specific temperature [36]. The DTA plot shows the existence of two exothermic peaks (at a temperature of 658.87 °C and 640.02 °C) and one endothermic peak at 109.51 microvolts (temperature of 599.62 °C, and a weight loss of 2.23 mg). The exothermic reaction at 658.87 °C may be indicative of combustion or oxidation since the temperature at that specific point showed a sudden increment and returned to its uniformly increasing pattern with time. Moreover, TGA showed eminent weight gain at that specific temperature. Overall, the results suggest that the material is relatively stable at temperatures less than 658.87 °C, but starts to gain weight at higher temperatures. The weight gain is sudden and continues over time, suggesting that the material may be decomposing via a complex series of reactions. Generally, TGA showed that the thermal stability of MMHC ranged from 375 °C to 480 °C. Likewise, DTA showed that the phase transformation starts at 658.87 °C.

5.7. SEM Metallographic Structure of Metal Matrix Hybrid Composite

Microscopic analysis, such as scanning electron microscopy (SEM), is a valuable tool for investigating the microstructure of metal matrix hybrid composites. The SEM images provide high-resolution details of the distribution and morphology of the reinforcing particles within the matrix. The distribution of zirconia and silicon carbide particles within the metal matrix hybrid composite is crucial for understanding the composite’s mechanical properties. The particles can be dispersed uniformly or clustered, thereby affecting the load transfer mechanism and overall composite strength. An examination of the SEM images reveals that both zirconia and silicon carbide particles are well dispersed throughout the metal matrix. Figure 8 shows the SEM image of the sample with a composition of 85%wt of AZ61, 7.5%wt of SiC and 7.5%wt of ZrO2 before the wear test. Additionally, the mechanical and physical properties of metal matrix hybrid composites fabricated via the FSC process were well investigated in our previous study [37].

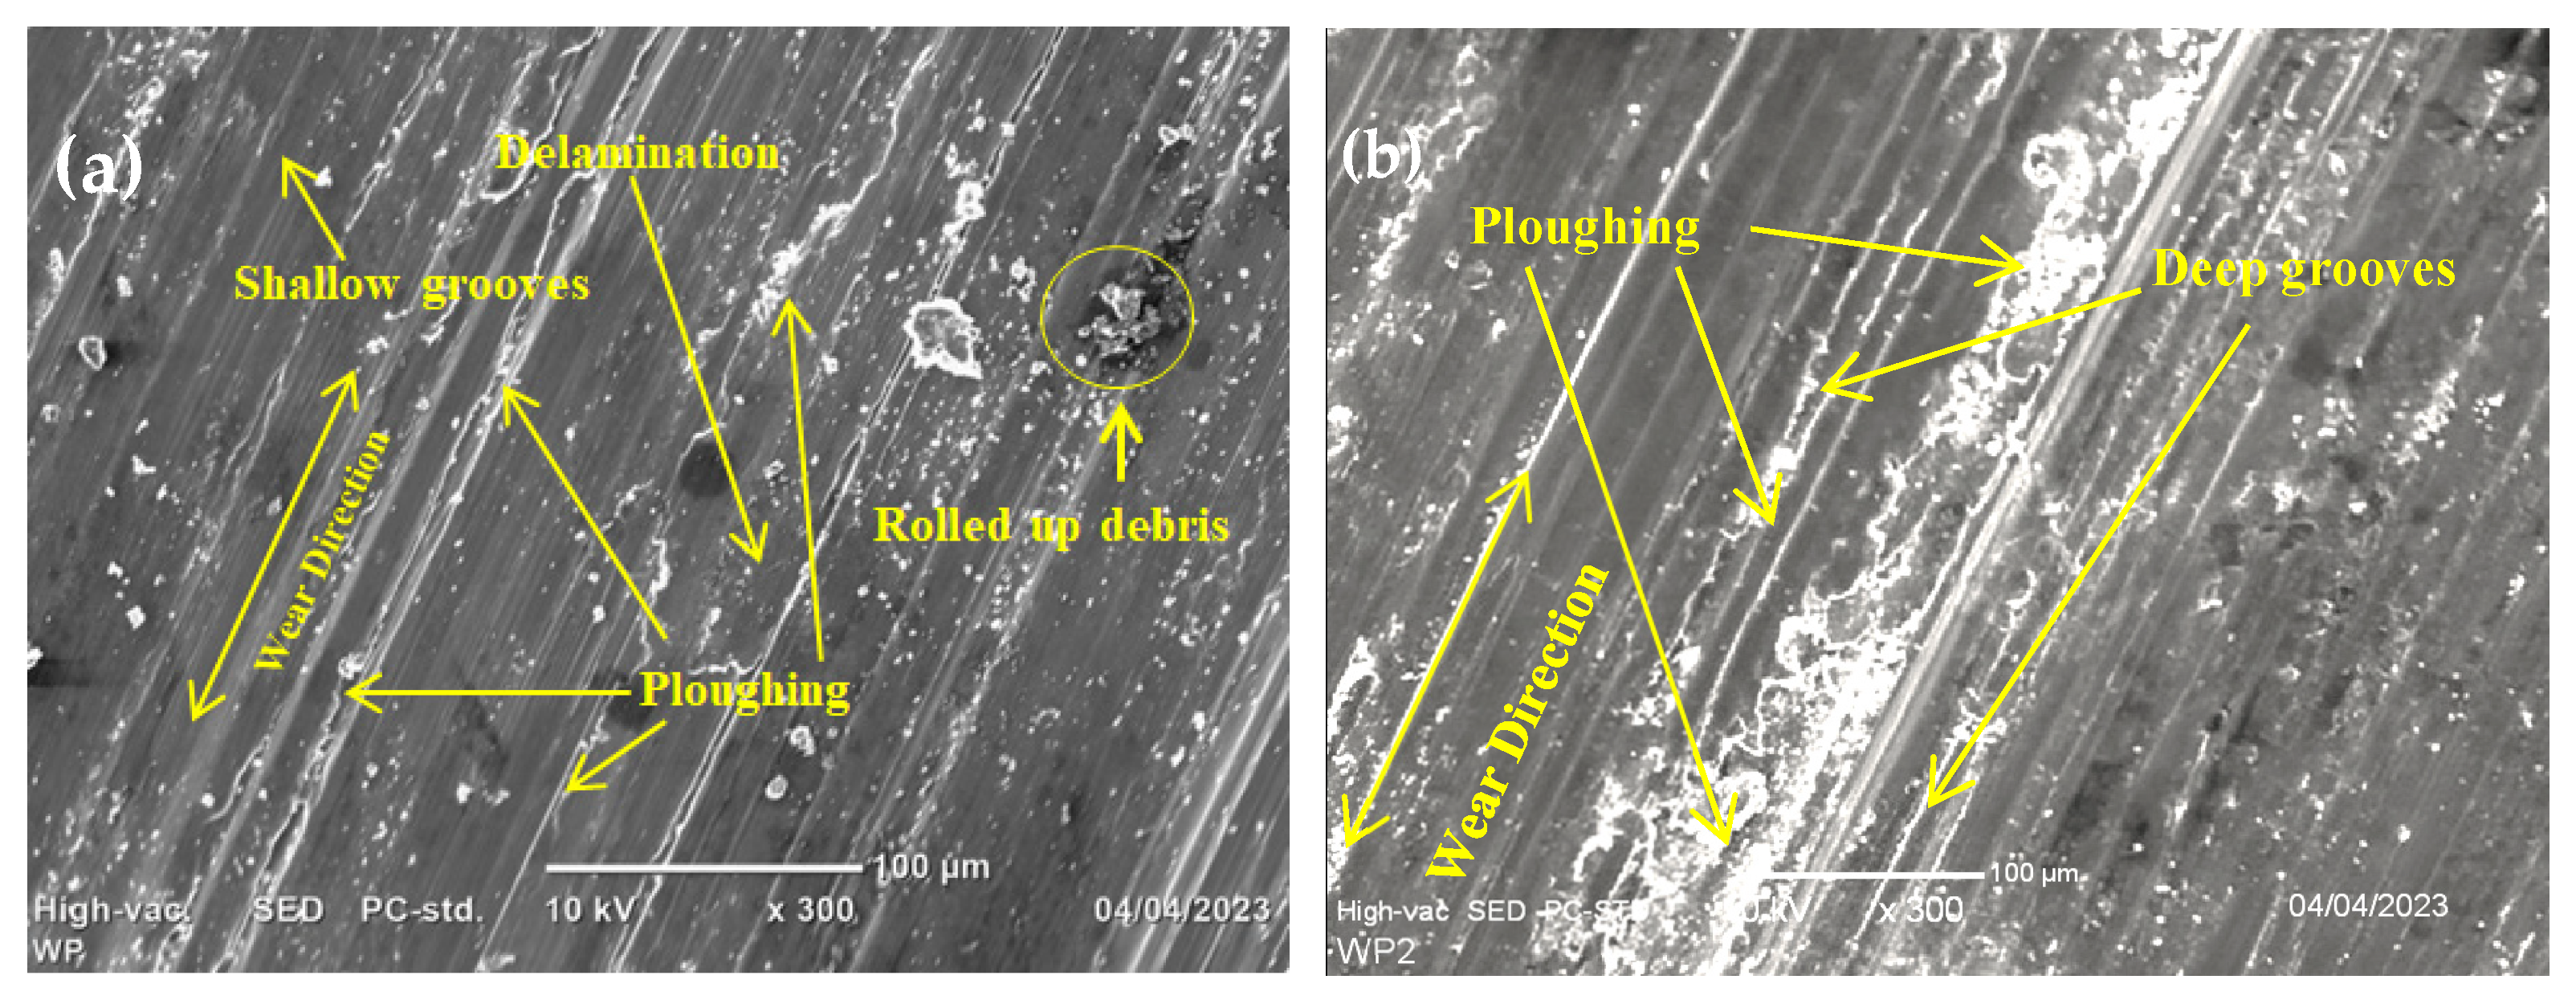
5.8. SEM Analysis of Worn-Out Optimum Sample Predicted by GA and RSM Box–Behnken

The worn-out samples were examined using scanning electron microscopy to determine the wear of the hybrid composite. As the type of wear involved was dry sliding, wear mechanisms such as micro ploughing, grooves and delamination played a prominent role in defining the wear, as shown in Figure 9a. Likewise, due to mild abrasive wear, surface fatigue, and delamination, the worn surface showed greater extents of abrasive wear characteristics such as ploughs (displacing material to the sides) [38]. The debris is visible as broken pieces that are crushed between the test sample and the rotating disc. Less wear is visible in the wear debris of graphite and ZrO2-based composites, which contain tiny particles like pin fragments that have been pulled out. The extent of wear in a composite material is determined by the size and shape of the debris [39]. Additionally, a study by Ram K. et al. [40] found that, as the rubbing time increases, the ploughing effect occurs. This depicted the evidence of shallow ploughs that occurred due to the minimum levels of sliding distance and sliding speed.
The SEM in Figure 9a depicts the minimum delamination and ploughing, which shows that the material had resistance to wear, as investigated in the study by Ram K. et al. [40], demonstrating the occurrence of an anti-friction layer at the interface, thereby lowering the material’s wear rate. Generally, the loss of material caused by the movement of tough particles across a surface is known as abrasive wear [41]. The rolled-up debris, delamination, shallow grooves and shallow ploughs were also observed, which indicated that the wear formation in the sample was mostly abrasive wear.
From the SEM images in Figure 9b, the wear mechanism of abrasive wear shows signs of reduced abrasive particles on the surface and less material removal. RSM optimization fine-tunes parameters to minimize the abrasive interactions within the design combinations, resulting in a rougher surface with a wear rate of 0.008 mg/m compared to the GA-optimized sample. From the SEM images in Figure 9a, the presence of shallow grooves may indicate progress towards achieving a smoother surface. The GA gradually refines the solutions over iterations, and the presence of shallow grooves suggests improvements in wear resistance, but further optimization may be required. Moreover, the abrasive wear mechanism may display variations depending on the optimization progress. Initially, the presence of abrasive particles and material removal may be more prominent. However, as the GA iterations progress, the optimization tends to converge towards solutions that minimize abrasive wear, leading to a smoother surface with fewer signs of wear compared with the RSM-optimized wear morphology.

6. Conclusions

The wear rate parametric optimization of magnesium alloy hybrid composites (7.5%wt of SiC, 7.5%wt of ZrO2 as a reinforcement and 85%wt of AZ61 magnesium alloy) fabricated via the FSC process was experimentally investigated. The RSM Box–Behnken and GA were implemented in the optimization. The GA-optimized thermal properties were also studied. The Box–Behnken design allowed for the efficient exploration of the parameter space by systematically varying the input factors, such as load, sliding speed and sliding distance. By running a minimum number of experiments, the Box–Behnken design efficiently attained complex interactions between the independent variables, allowing for the development of a mathematical model to describe the wear behavior. Generally, based on the obtained results, the following conclusions have been drawn.
  • Using RSM optimization, the optimal wear rate of 0.008 mg/m was achieved with the following parameter combination: a sliding distance of 350 m, a sliding speed of 240 rpm and a load of 20 N. These findings demonstrate that RSM optimization effectively reduces wear and improves the wear resistance of the metal matrix hybrid composite. However, the GA optimization outperformed the RSM, achieving a minimum wear rate of 0.00514 mg/m. The optimized parameter combination for the GA was identical to that of the RSM, with a sliding distance of 350 m, a sliding speed of 220 rpm and a load of 20 N. This suggests that GA optimization further enhanced the wear resistance of the composite, surpassing the optimization achieved by RSM.
  • In summary, this research study demonstrates the effectiveness of both RSM and GA techniques in optimizing the wear behavior of the metal matrix hybrid composite fabricated via the friction stir consolidation process. While RSM yielded significant improvements in the wear rate, GA optimization further reduced the wear rate, achieving a lower value. These findings highlight the potential of these optimization methods to enhance the wear resistance of metal matrix hybrid composites. Likewise, thermogravimetric results showed that, from the temperature 375 °C to 480 °C, the MMHC showed thermal stability with no weight loss or gain.
  • Future research can be applied to the study of microstructural changes and mechanisms responsible for the improved wear behavior observed with RSM and GA optimization. Additionally, long-term performance and durability studies should be conducted to evaluate the practical applicability of the optimized composite materials in real-world scenarios.
Finally, the combination of friction stir consolidation fabrication, RSM optimization, and GA optimization has proven to be a promising approach for improving the wear behavior of metal matrix hybrid composites. The results obtained from this study contribute to the existing knowledge in the field of wear behavior optimization and provide valuable insights for the development of advanced composite materials with superior wear resistance properties.

Author Contributions

Conceptualization, S.K.A., H.B. and D.K.S.; methodology, S.K.A., H.B. and D.K.S.; software, S.K.A., D.K.S., N.H., S.Z. and G.M.S.A.; validation, H.B. and D.K.S.; formal analysis, A.A.R., A.A.D., N.H., S.Z. and G.M.S.A.; investigation, S.K.A., H.B. and D.K.S.; resources, A.A.R., A.A.D., G.M.S.A., N.H. and S.Z.; writing—original draft preparation, S.K.A. and H.B.; writing—review and editing, A.A.R. and G.M.S.A.; visualization, G.M.S.A., N.H. and S.Z.; supervision, S.K.A., H.B. and D.K.S.; project administration, A.A.R., A.A.D. and G.M.S.A.; funding acquisition, A.A.R. and A.A.D. All authors have read and agreed to the published version of the manuscript.

Funding

The authors extend their appreciation to the Deanship of Scientific Research at King Khalid University, Saudi Arabia, for funding this work through the Research Group Program under, Grant No. RGP. 2/282/44.

Data Availability Statement

The data used to support the findings of this study are included within the article. Further data or information is available from the corresponding authors upon request.

Acknowledgments

The authors extend their appreciation to the Deanship of Scientific Research at King Khalid University, Saudi Arabia, for funding this work through the Research Group Program under, Grant No. RGP. 2/282/44.

Conflicts of Interest

The authors state that they have no recognized competing financial interest or personal relationship that could appear to have influenced the work described in this paper.

References

  1. Kumar, A.; Vichare, O.; Debnath, K.; Paswan, M. Fabrication methods of metal matrix composites (MMCs). Mater. Today Proc. 2020, 46, 6840–6846. [Google Scholar] [CrossRef]
  2. Manjunatha, L.; Yunus, M.; Alsoufi, M.; Dinesh, P. Development and Comparative Studies of Aluminum-Based Carbon Nano Tube Metal Matrix Composites using Powder Metallurgy and Stir Casting Technology. Int. J. Sci. Eng. Res. 2017, 8, 521–526. [Google Scholar]
  3. Sankhla, A.M.; Patel, K.M.; Makhesana, M.A.; Giasin, K.; Pimenov, D.Y.; Wojciechowski, S.; Khanna, N. Effect of mixing method and particle size on hardness and compressive strength of aluminium based metal matrix composite prepared through powder metallurgy route. J. Mater. Res. Technol. 2022, 18, 282–292. [Google Scholar] [CrossRef]
  4. Annigeri, U.K.; Veeresh Kumar, G.B. Method of stir casting of Aluminum metal matrix Composites: A review. Mater. Today Proc. 2017, 4, 1140–1146. [Google Scholar] [CrossRef]
  5. Shivalingaiah, K.; Nagarajaiah, V.; Selvan, C.P.; Kariappa, S.T.; Chandrashekarappa, N.G.; Lakshmikanthan, A.; Chandrashekarappa, M.P.G.; Linul, E. Stir Casting Process Analysis and Optimization for Better Properties in Al-MWCNT-GR-Based Hybrid Composites. Metals 2022, 12, 1297. [Google Scholar] [CrossRef]
  6. Lai, S.; Chung, D.D.L. Consumption of S i c whiskers by the AI-Sic reaction in aluminium-matrix SiC whisker composites. J. Mater. Chem. 1996, 6, 469–477. [Google Scholar] [CrossRef]
  7. Swamy, P.K.; Mylaraiah, S.; Gowdru Chandrashekarappa, M.P.; Lakshmikanthan, A.; Pimenov, D.Y.; Giasin, K.; Krishna, M. Corrosion behaviour of high-strength Al 7005 alloy and its composites reinforced with industrial waste-based fly ash and glass fibre: Comparison of stir cast and extrusion conditions. Materials 2021, 14, 3929. [Google Scholar] [CrossRef]
  8. Krishnaraj, V.; Prabukarthi, A.; Ramanathan, A.; Elanghovan, N.; Kumar, M.S.; Zitoune, R.; Davim, J.P. Optimization of machining parameters at high speed drilling of carbon fiber reinforced plastic (CFRP) laminates. Compos. Part B Eng. 2012, 43, 1791–1799. [Google Scholar] [CrossRef]
  9. Zitoune, R.; El Mansori, M.; Krishnaraj, V. Tribo-functional design of double cone drill implications in tool wear during drilling of copper mesh/CFRP/woven ply. Wear 2013, 302, 1560–1567. [Google Scholar] [CrossRef]
  10. Abd-Elwahed, M.S.; Ibrahim, A.F.; Reda, M.M. Effects of ZrO2 nanoparticle content on microstructure and wear behavior of titanium matrix composite. J. Mater. Res. Technol. 2020, 9, 8528–8534. [Google Scholar] [CrossRef]
  11. Yilmaz, O.; Buytoz, S. Abrasive wear of Al2O3-reinforced aluminium-based MMCs. Compos. Sci. Technol. 2001, 61, 2381–2392. [Google Scholar] [CrossRef]
  12. Sivanesh Prabhu, M.; Elaya Perumal, A.; Arulvel, S.; Franklin Issac, R. Friction and wear measurements of friction stir processed aluminium alloy 6082/CaCO3 composite. Meas. J. Int. Meas. Confed. 2019, 142, 10–20. [Google Scholar] [CrossRef]
  13. Cardoso-jaime, V.; Broderick, N.A.; Maya-maldonado, K. Metal ions in insect reproduction: A crosstalk between reproductive physiology and immunity. Curr. Opin. Insect Sci. 2022, 52, 100924. [Google Scholar] [CrossRef]
  14. Sheelwant, A.; Jadhav, P.M.; Narala, S.K.R. ANN-GA based parametric optimization of Al-TiB2 metal matrix composite material processing technique. Mater. Today Commun. 2021, 27, 102444. [Google Scholar] [CrossRef]
  15. Cao, X.; Li, Z.; Zhou, X.; Luo, Z.; Duan, J. Modeling and optimization of resistance spot welded aluminum to Al-Si coated boron steel using response surface methodology and genetic algorithm. Meas. J. Int. Meas. Confed. 2021, 171, 108766. [Google Scholar] [CrossRef]
  16. Panwar, V.; Kumar Sharma, D.; Pradeep Kumar, K.V.; Jain, A.; Thakar, C. Experimental investigations and optimization of surface roughness in turning of en 36 alloy steel using response surface methodology and genetic algorithm. Mater. Today Proc. 2020, 46, 6474–6481. [Google Scholar] [CrossRef]
  17. Fan, M.; Li, T.; Hu, J.; Cao, R.; Wei, X.; Shi, X.; Ruan, W. Artificial neural network modeling and genetic algorithm optimization for cadmium removal from aqueous solutions by reduced graphene oxide-supported nanoscale zero-valent iron (nZVI/rGO) composites. Materials 2017, 10, 544. [Google Scholar] [CrossRef] [Green Version]
  18. Álvarez, M.J.; Ilzarbe, L.; Viles, E.; Tanco, M. The Use of Genetic Algorithms in Response Surface Methodology. Qual. Technol. Quant. Manag. 2009, 6, 295–307. [Google Scholar] [CrossRef]
  19. Omrani, E.; Moghadam, A.D.; Menezes, P.L.; Rohatgi, P.K. Influences of graphite reinforcement on the tribological properties of self-lubricating aluminum matrix composites for green tribology, sustainability, and energy efficiency—A review. Int. J. Adv. Manuf. Technol. 2016, 83, 325–346. [Google Scholar] [CrossRef]
  20. Sanjay, M.R.; Madhu, P.; Jawaid, M.; Senthamaraikannan, P.; Senthil, S.; Pradeep, S. Characterization and Properties of Natural Fiber Polymer Composites: A Comprehensive Review; Elsevier: Amsterdam, The Netherlands, 2018; Volume 172, ISBN 9198944711. [Google Scholar]
  21. Kumar, B.S.P.; Shobha, K.R.; Singh, M.K.; Rinawa, M.L.; Madhavarao, S.; Wadhawa, G.C.; Alrebdi, T.A.; Christopher, D. Optimization and Wear Properties for the Composites of Metal Matrix AA8011/Boron Nitride Using Taguchi Method. J. Nanomater. 2022, 2022, 6957545. [Google Scholar] [CrossRef]
  22. Shanmugavel, R.; Sundaresan, T.K.; Marimuthu, U.; Manickaraj, P. Process Optimization and Wear Behavior of Red Mud Reinforced Aluminum Composites. Adv. Tribol. 2016, 2016, 9082593. [Google Scholar] [CrossRef] [Green Version]
  23. Morampudi, P.; Venkata Ramana, V.S.N.; Vikas, K.S.; Rahul; Prasad, C. Enhancing wear properties of Al6061 metal-matrix composites by reinforcement of ZrB2 nano particles. Mater. Today Proc. 2022, 59, A45–A51. [Google Scholar] [CrossRef]
  24. Jojith, R.; Radhika, N.; Govindaraju, M. Reciprocating Wear Behavioural Analysis of Heat-treated Aluminium ZrO2/Al7Si0.3Mg Functionally Graded Composite Through Taguchi’s Optimization Method. Silicon 2022, 14, 11337–11354. [Google Scholar] [CrossRef]
  25. Seeman, M.; Ganesan, G.; Karthikeyan, R.; Velayudham, A. Study on tool wear and surface roughness in machining of particulate aluminum metal matrix composite-response surface methodology approach. Int. J. Adv. Manuf. Technol. 2010, 48, 613–624. [Google Scholar] [CrossRef]
  26. Stojanović, B.; Gajević, S.; Kostić, N.; Miladinović, S.; Vencl, A. Optimization of parameters that affect wear of A356/Al2O3 nanocomposites using RSM, ANN, GA and PSO methods. Ind. Lubr. Tribol. 2022, 74, 350–359. [Google Scholar] [CrossRef]
  27. Umanath, K.; Palanikumar, K.; Sankaradass, V.; Uma, K. Materials Today: Proceedings Optimization of wear properties on AA7075/Sic/Mos2 hybrid metal matrix composite by response surface methodology. Mater. Today Proc. 2021, 46, 4019–4024. [Google Scholar] [CrossRef]
  28. Uthayakumar, M.; Kumaran, S.T.; Aravindan, S. Dry sliding friction and wear studies of fly ash reinforced AA-6351 metal matrix composites. Adv. Tribol. 2013, 2013, 365602. [Google Scholar] [CrossRef] [Green Version]
  29. Baradeswaran, A.; Elayaperumal, A.; Franklin Issac, R. A statistical analysis of optimization of wear behaviour of Al- Al2O3 composites using taguchi technique. Procedia Eng. 2013, 64, 973–982. [Google Scholar] [CrossRef] [Green Version]
  30. Gangwar, S.; Sharma, S.; Pathak, V.K. Preliminary Evaluation and Wear Properties Optimization of Boron Carbide and Molybdenum Disulphide Reinforced Copper Metal Matrix Composite Using Adaptive Neuro-fuzzy Inference System. J. Bio- Tribo-Corrosion 2021, 7, 1–19. [Google Scholar] [CrossRef]
  31. Das, A.; Sarkar, S.; Karanjai, M.; Sutradhar, G. RSM Based Study on the Influence of Sintering Temperature on MRR for Titanium Powder Metallurgy Products using Box-Behnken Design. Mater. Today Proc. 2018, 5, 6509–6517. [Google Scholar] [CrossRef]
  32. Radhika, N.; Sai Charan, K. Experimental Analysis on Three Body Abrasive Wear Behaviour of Stir Cast Al LM 25/TiC Metal Matrix Composite. Trans. Indian Inst. Met. 2017, 70, 2233–2240. [Google Scholar] [CrossRef]
  33. Kalhapure, V.A.; Khairnar, H.P. Taguchi method optimization of operating parameters for automotive disc brake pad wear. Appl. Eng. Lett. 2021, 6, 47–53. [Google Scholar] [CrossRef]
  34. Nasrollahzadeh, M.; Atarod, M.; Sajjadi, M.; Sajadi, S.M.; Issaabadi, Z. Plant-Mediated Green Synthesis of Nanostructures: Mechanisms, Characterization, and Applications, 1st ed.; Elsevier Ltd.: Amsterdam, The Netherlands, 2019; Volume 28, ISBN 9780128135860. [Google Scholar]
  35. Lal, S.; Kumar, S.; Khan, Z.A. Microstructure evaluation, thermal and mechanical characterization of hybrid metal matrix composite. IEEE J. Sel. Top. Quantum Electron. 2018, 25, 1187–1196. [Google Scholar] [CrossRef]
  36. Ashebir, D.A.; Mengesha, G.A.; Sinha, D.K. The Role of Tetra Hybrid Reinforcements on the Behavior of Aluminum Metal Matrix Composites. J. Nanomater. 2022, 2022, 1988293. [Google Scholar] [CrossRef]
  37. Kefyalew Abebe, S.; Sinha, D.K.; Beri Tufa, H.; Mengesha, G.A. Physical and mechanical behavior of aluminum-magnesium alloy matrix hybrid composite fabricated through friction stir consolidation process. Adv. Mech. Eng. 2023, 15, 16878132231180013. [Google Scholar] [CrossRef]
  38. Jojith, R.; Radhika, N. Reciprocal dry sliding wear of SiCp/Al–7Si-0.3 Mg functionally graded composites: Influence of T6 treatment and process parameters. Ceram. Int. 2021, 47, 30459–30470. [Google Scholar] [CrossRef]
  39. Kumar, R.; Deshpande, R.G.; Gopinath, B.; Harti, J.; Nagaral, M.; Auradi, V. Mechanical Fractography and Worn Surface Analysis of Nanographite and ZrO2-Reinforced Al7075 Alloy Aerospace Metal Composites. J. Fail. Anal. Prev. 2021, 21, 525–536. [Google Scholar] [CrossRef]
  40. Ram Kumar, S.; Gowtham, S.; Radhika, N. Fabrication of Cu-Sn/SiC Metal Matrix Composites and Investigation of its Mechanical and Dry Sliding Wear Properties. Mater. Today Proc. 2018, 5, 12757–12771. [Google Scholar] [CrossRef]
  41. Alpas, A.T.; Bhattacharya, S.; Hutchings, I.M. Wear of Particulate Metal Matrix Composites; Elsevier Ltd.: Amsterdam, The Netherlands, 2017; Volume 4, ISBN 9780081005330. [Google Scholar]
Figure 1. FSC experimental setup on a conventional milling machine.
Jcs 07 00275 g001
Figure 2. Pin-on-disc apparatus of wear testing machine.
Jcs 07 00275 g002
Figure 3. Flowchart of basic genetic algorithm.
Jcs 07 00275 g003
Figure 4. Response surface plots for (a) wear rate vs. load and sliding speed; (b) wear rate vs. load and sliding distance; and (c) wear rate vs. sliding speed and sliding distance.
Jcs 07 00275 g004
Figure 5. Normal probability (a) plot of residuals for wear rate and (b) residuals versus the fitted value for wear rate.
Jcs 07 00275 g005
Figure 6. GA plot for wear rate.
Jcs 07 00275 g006
Figure 7. Thermogravimetric and differential thermal analysis curves of the optimized MMHC.
Jcs 07 00275 g007
Figure 8. SEM Metallographic Structure of Metal Matrix Hybrid Composite.
Jcs 07 00275 g008
Figure 9. SEM image of wear morphology of (a) GA optimized sample (350 m, 220 rpm and 20 N) and (b) RSM Box–Behnken optimized sample (350 m, 240 rpm and 20 N).
Jcs 07 00275 g009
Table 1. Chemical composition of AZ61-Mg alloy.
CompositionsAlZnMnNiCuFeSiPbCaSn
Weight %6.40.740.350.00120.00290.0010.0150.0010.001<0.001
Table 2. FSC parametric combinations used during sample manufacturing.
Factors
Speed [rpm]Load [N]Thickness [mm]Time [min.]Composition [%wt]
80050012615
Table 3. Factors with their corresponding levels.
FactorsCodedUnitLevelLevellevel
−101
LoadX2N203040
Sliding SpeedX3Rpm220240260
Sliding DistanceX1m350500650
Table 4. Box–Behnken experimental design.
RunCoded FactorsActual Factors
X1X2X3LoadSliding SpeedSliding Distance
1−1−1020220500
20−1130220650
31−1040220500
400030240500
5−10−120240350
600030240500
710140240650
811040260500
90−1−130220350
1001130260650
1110−140240350
1200030240500
1301−130260350
14−11020260500
15−10120240650
Table 5. Box–Behnken design and wear rate results.
RunCoded FactorsActual Factors Responses
X1X2X3LoadSliding SpeedSliding DistanceWeight before Test (g)Weight after Test (g)Weight Loss (g)Conversion into mgWear Rate (mg/m)
1−1−10202205000.64280.63440.00848.40.0450 ± 0.0002
20−11302206500.64280.58730.055555.50.0854 ± 0.0004
31−10402205000.64270.57740.065365.30.1310 ± 0.0003
4000302405000.64270.594650.066148.40.0961 ± 0.0005
5−10−1202403500.64280.64010.00272.70.0080 ± 0.0004
6000302405000.64270.60220.040540.50.0830 ± 0.0005
7101402406500.64290.54540.097597.50.1500 ± 0.0003
8110402605000.64290.55240.090590.50.1750 ± 0.0007
90−1−1302203500.64280.6250.017817.80.0480 ± 0.0005
10011302606500.64270.56230.080480.40.1240 ± 0.0005
1110−1402403500.64280.58640.054656.40.1610 ± 0.0006
12000302405000.64270.59420.066548.50.0970 ± 0.0005
1301−1302603500.64270.62800.042714.70.0510 ± 0.00025
14−110202605000.64280.60940.033433.40.0668 ± 0.0004
15−101202406500.64280.60240.040440.40.0623 ± 0.0005
Table 6. Analysis of variance for wear rate.
SourceDFAdj SSAdj MSF-Valuep-Value
Model90.0310950.00345516.790.003
Linear30.0280370.00934645.410.000
Load10.0236420.023642114.870.000
Speed10.0014420.0014427.010.046
Distance10.0029530.00295314.350.013
Square30.0015510.0005172.510.173
Load X Oad10.0008670.0008674.210.095
Speed X Speed10.0000310.0000310.150.713
Distance X Distance10.0005340.0005342.600.168
2-Way Interaction30.0015060.0005022.440.180
Load X Speed10.0001230.0001230.600.474
Load X Distance10.0010660.0010665.180.072
Speed X Distance10.0003170.0003171.540.270
Error50.0010290.000206
Lack-of-Fit30.0009060.0003024.920.174
Pure Error20.0001230.000061
Total14R2 = 96.80% and R2(Adj) = 91.03%
Table 7. Verification experiment.
S.No.Factors
LoadSpeedDistanceRegression WearExperimental WearError
1402606500.18 mg/m0.1873.89%
2302605000.11 mg/m0.1154.55%
3302203500.059 mg/m0.0613.39%
Table 8. Parameter functions along with their values in GA.
Parameter FunctionParameter Value
Population size50
Population typeDouble vector
Creation FunctionConstraint dependent
Fitness Scaling FunctionRank
Selection FunctionRoulette
Reproduction: Elite CountDefault (0.05 × Population size) = 2.5
Reproduction: Crossover FractionDefault: 0.8
Mutation FunctionUniform: Rate at 0.15
Crossover FunctionConstraint dependent
Number of Generations100
Function Tolerance1 × 10−6
Constraint Tolerance1 × 10−6
Table 9. GA predicted the best individual for minimum wear rate.
Process ParametersLevels
Load20 N
Sliding Speed220 rpm
Sliding Distance350 m
Table 10. Confirmation tests for RSM and GA for optimized process parameters.
MethodsOptimized ParametersWear Rate (WR)Sample-1Sample-2Sample-3Average WR (mg)/m
RSMLoad = 20 NExperiment0.00850.00830.00840.0084
Sliding Speed = 240 rpmPredicted0.0080.0080.0080.008
Sliding Distance = 350 m% Error6.253.7555%
GALoad = 20 NExperiment0.00540.005380.005320.00537
Sliding Speed = 220 rpmPredicted0.005140.005140.005140.00514
Sliding Distance = 350 m% Error5.064.673.54.41%
Disclaimer/Publisher’s Note: The statements, opinions and data contained in all publications are solely those of the individual author(s) and contributor(s) and not of MDPI and/or the editor(s). MDPI and/or the editor(s) disclaim responsibility for any injury to people or property resulting from any ideas, methods, instructions or products referred to in the content.

