
Tuning the Tensile and Shear Properties of a Scar Healing Composite for Mechanotherapy


School of Fashion and Textiles, The Hong Kong Polytechnic University, Hung Hom, Kowloon, Hong Kong 999077, China
*
Author to whom correspondence should be addressed.
J. Compos. Sci. 2024, 8(1), 22; https://doi.org/10.3390/jcs8010022
Submission received: 15 November 2023
/
Revised: 15 December 2023
/
Accepted: 3 January 2024
/
Published: 8 January 2024
(This article belongs to the Section Composites Manufacturing and Processing)
Abstract
:Conventional scar treatment options of single pressure garment therapy (PGT) or silicone gel sheeting (SGS, Cica-Care®, Smith and Nephew, London, UK) alone lack mechanical property tunability. This article discusses a scar healing composite (PGF-Biopor®AB, Dreve Otoplastik GmbH, Unna, Germany) and how its mechanical properties can be tuned for improved mechanotherapy. A balance between compression and tension was achieved by tuning the tensile and shear properties, facilitating tension shielding and pressure redistribution for scar therapeutics. Biopor®AB-wrapping on biaxial-tensioned pressure garment fabric (PGF) allowed compression therapy and internal pressure redistribution. The Biopor®AB surface, with a coefficient of friction close to 1, strategically localizes stress for effective tension shielding. A substantial five-fold reduction in silicone tension, amounting to 1.060 N, achieves tension shielding and pressure redistribution. Simultaneously, a dynamic internal pressure-sharing mechanism distributes 0.222 kPa from each SPK-filament bundle, effectively managing internal pressure. Alongside the principle compression-silicone dual therapy, this composite design with dynamic internal pressure sharing and mechanical property tunability provides an additional pressure-relieving strategy for multiple scar therapeutics.
1. Introduction
Scar tissues have high-load stiffness, with high tissue tension for pronounced scarring [1]. For fibrosis at scarring, the non-linear elasticity in the fibrous extracellular matrix (ECM) provides a non-linear strain, and strain at the scarring site makes the cells contract and the ECM stiff [2]. A rigid environment activates cells towards a fibrotic phenotype, yielding disrupted ECM homeostasis and aberrant healing [2]. Fibrosis in highly tensioned tissues increases matrix deposition and remodelling [2,3]. When healing processes become skewed, leading to continuous infections, vascular dysfunction and excess inflammation delay scar maturation for extensive hypertrophic scars. Traditional methods of scar treatment, solely relying on single pressure garment therapy (PGT) or silicone gel sheeting (SGS), lack the capability for mechanical property tunability. In the realm of PGT, compression therapy is performed by volume reduction; the stretching of the fabric increases skin tension to counteract fibrosis, with the unavoidable drawback of potential scratching–friction-induced wounds. On the other hand, SGS treatment offers advantages like good viscoelasticity and high fabrication flexibility, yet the hydrophobic nature of silicones renders them impermeable, and their poor mechanical properties are challenging to modulate. The use of silicone membranes for surgical wounds has a long history of effectiveness in tension shielding and scar reduction [4]. Human embrace devices and murine micro silicone rubber membrane bilayers have been used in tension-shielding biomaterials [5,6,7,8].
Huang et al. initially defined mechanotherapy as “therapeutic interventions that reduce or reverse injuries to damaged tissues or promote tissue homeostasis through mechanical means at the molecular, cellular, or tissue level” [9]. Bo Ri Seo and David J. Mooney further refined the requirements of mechanotherapy, emphasizing flexible materials with great conformability, programmability, and controllability (e.g., elastomers and fabric) [10]. They also highlighted the importance of flexible and soft material interfaces, such as thermal-responsive textiles [10]. Additionally, they generalized polymer needs for mechanotherapy to exhibit high toughness while maintaining a low elastic modulus and stretchability or to be capable of functional force and recovery, addressing tension-offloading in tissue strain and inflammatory factor levels [10].
According to the theory of pressure-redistribution, pressure control can conform proportionally to applied friction, compression, or pressure at the scarring site (Figure 1A). Through “warp insertions” mobility within PGF-Biopor®AB, pressure-driven “warp insertions” shifting enables internal pressure redistribution, and dynamic perpendicular load sharing reduces internal force (Figure 1B). Furthermore, compression pressure induces an enlarged surface area on the rougher Biopor®AB-surface (Figure 1C), redistributing pressure to reduce stress-strain and shear resistance for force reduction [6,7,8,11,12,13]. Tension shielding facilitates skin tension reduction, and pressure redistribution enables lower mechanical force distribution. Pressure-sharing and pressure-releasing effects allow for the least tissue pressure/force exerted at contact with cells for scar therapeutics [14,15].
Here, we present a solution for 3D mechanomodulatory composite making for PGF-Biopor®AB. Our method combines PGF (warp knit structure) and Biopor®AB via screen-printing. The incorporation of Biopor®AB screen-marked microchannels established a rougher surface structure, wherein pressure Biopor®AB wrapping increased cross-linking density and surface area, enhancing tensile and shear tunability. The high Biopor®AB modulus with PGF-inlaid represents a useful deformation tunability for tension and shear. The application of Biopor®AB wrapping on biaxial-tensioned pressure garment fabric (PGF) allows “warp insertions” mobility, enabling pressure-driven “warp insertions” shifting for compression therapy and internal pressure redistribution. Through enhancing the mechanomodulatory capacity via tensile and shear tunability, tension shielding provides tissues with external mechanical support, and pressure redistribution performs tension–stress reduction for scar therapeutics [16]. The dynamic “warp insertions” shifting within the mechanically versatile Biopor®AB pressure-relieving structure ensures mechanical tension offloading and pressure sharing, ultimately aiding tissue regeneration in scar therapeutics.
2. Material and Methods
2.1. Materials and Rationale for Our Choice of Materials
PGF consists of a wrapping yarn of nylon 50D (72F) with 420D (144F) spandex enclosing 12 safe package kit (SPK) filament bundles of warp insertions (spandex-covered yarn) (Figure 2), with 68% nylon, 32% spandex, and an areal density of 210 gm/m2. PGF (Polliam Trading Corp. Ltd., Hong Kong, China) is a public hospital PGT-use material. Biopor®AB (Dreve Otoplastik GmbH, Unna, Germany) was bought from Widex Hong Kong Hearing & Speech Centre Ltd. (two-part room-temperature-vulcanizing (RTV2) medical silicone (PDMS); its material technical data sheet is listed in Table 1 [17]). Silicone gel sheeting (Cica-Care®, Smith and Nephew, UK) was officially supplied and served as the control. Screens with a mesh size of #1000 (i.e., 1000 openings per square inch) and #2000 in wooden frames of 8″ × 10″ and 14″ × 20″ were used. Tony Screen of Jet T Technology from C1A. G/F, 72 Hoi Yuen Rd, Kowloon, supplied the screens. Aveeno® skin relief moisturising lotion and filter paper were ordered from Market Place supermarkets.
In the context of scar healing, the medical silicone Biopor®AB and PGF are guaranteed scar-healing materials, and the fabrication of PGF-Biopor®AB is flexible. For the material aspect, the use of soft–stiff material domains and an all-direction-stretchable textile structure fulfilled the raw material requirements and polymer needs of mechanotherapy. Silicones function through occlusive hydration, with 100% oxygen permeability and biocompatibility in a silicone-close-to-skin density, altering the stratum corneum barrier properties to enhance the permeation of both hydrophilic and hydrophobic drugs, resulting in increased skin-effective transport for scar therapeutics [20]. The pressure garment fabric, with a basic warp-knitted structure incorporating warp insertion, provides an all-direction-stretchable framework. Recognizing the material type and structure, it is acknowledged that Biopor®AB, on its own, is not an ideal skin simulant due to its lack of mechanical stiffness, fibrous structure, and low mechanical properties. The creation of a composite in a PGF textile-reinforced structure addresses these Biopor®AB limitations and leverages the formulation advantages of two-part room-temperature-vulcanizing silicone (RTV2) for effective composite adhesion without the need for curing, enabling low-cost composite making using PGF and Biopor®AB [21]. The structural integration of PGF-inlaid addresses drawbacks in PGT and SGS treatments, achieving optimum dressing properties concurrently. Furthermore, the fabrication of Biopor®AB with textiles (PGF) should enable enhanced roughness and low adhesiveness, offering the potential for stress shielding, uniform adherence, and trauma-free dressing removal—an ideal combination for scar dressing [21]. All aspects of materials, fabrication methods, and mechanomodulatory capacity are thus fulfilled.
2.2. Preparation of PGF-Biopor®AB
The same fabrication method reported in [22] was adopted (Figure 3). A thin-layer set (2, 4, 6, and 8 layers) and a thick-layer set (25, 50, 75, and 100 layers) were used for a comparative study, and a 10-layer sample was used as a transition sample. Two screens (#1000 and #2000) were used to evaluate the screen size effect. PGF-Biopor®AB samples were labelled as PGF-x-y, where x denoted the screen#, and y denoted the number of printing layers. All as-prepared samples, together with the controls (Cica-care® and PGF), were kept under standard conditions at 65 ± 2% relative humidity and 20 ± 2 °C for at least 24 h before measurement and testing [23,24,25,26].
2.3. Mechanical Property Tunability
In this study, the Kawabata evaluation system of fabric (KES-F) enabled a full range of mechanical property characterization for PGF–Biopor®AB and control, including tensile modulus, elasticity, bendability, stretchability, and the ability of viscoelastic recovery [27]. The low-load assessments, measured in kPa, enabled the capture of a nonlinear mechanical profile encompassing elasticity and extensibility in tension, shear, and bending—ideal for assessing cellular sensitivity. The KES-F1 tensile–shear module was employed to gauge the tensile and shear characteristics. For tensile testing, the conditions included a rate of extension of 0.2 × 10⁻³ m/sec, a maximum tensile force of 490 N/m, and a pre-tension set at 20 N/m. Stress–strain curves were calculated and derived from load–elongation curves, with stress obtained by dividing the load from TM (thickness under tensile testing with low stress), and strain directly derived from elongation%.
In shear testing, the conditions comprised a rate of shear of 0.417 × 10−² m/sec, a maximum shear angle of ±8°, and pre-tension set at 20 N/m. The KES-F2 bending module was employed to assess bending characteristics, utilizing a sample size of (20 ×10−² m) × (20 × 10−² m). For bending testing, the conditions included a rate of bending of 0.5 sec/× 10−² m, with a maximum curvature of ±2.5/10−² m.
2.4. Surface and Compression Properties
A Leica digital microscope (M165C with HD290, Leica Mikrosysteme Vertriebs GmbH, Wetzlar, Germany) was used to examine the surface morphologies. An electronic scanning microscope (SEM) (Hitachi TM3000, Angstrom Scientific, Ramsey, NJ, USA) was used to investigate the surface and interfacial morphologies. The KES-F4 module measured surface friction and roughness, and the roughness profiles quantitatively displayed the surface patterns. SEM, OM topographic images and roughness profiles, together, revealed the Biopor®AB surface structure and “warp insertion” mobility design. Our evaluation of the Kawabata surface properties included the coefficient of friction (MIU), which investigates roughness; mean deviation for MIU (MMD), which investigates the variation in the roughness; and mean absolute deviation for MIU (SMD),which investigates the geometric roughness.
To further assess the tension shielding and pressure redistribution performances, KES-F3 and KES-F4 modules were used to measure the compression–force characteristics of the PGF-Biopor®ABs under no pressure and under the application of standard pressure. Compression pressure, forces, and enlarged surface area can be calculated using the Laplace formula using the below equation:
where pressure is represented by P (Pa), the tensile force in the PGF-Biopor®AB sample is represented by F (N), and the area of the PGF-Biopor®AB sample is represented by S (mm2). Given that the conservation of pressure in viscoelastic materials is kept constant, the degree of pressure applied by compression is proportional to the force applied and inversely proportional to the surface area. This law was applied to predict tension and surface area changes under a constant pressure application.
P = 2πF/S
With and without the pressure of application, by the conservation of volume in viscoelastic properties, PGF-Biopor®AB stayed in more or less the same volume to obtain the following:
where S is the area of the sensor, S′ is the enlarged area, To is the thickness of PGF-Biopor®AB at no pressure, and Tm is the thickness of PGF-Biopor®AB upon pressure application. This equation was used to predict enlarged surface area variation under a constant pressure-variated change in thickness.
3. Results and Discussion
3.1. Structural Analysis
3.1.1. Topological Features
Surface roughness is a crucial modulator for tension control and cell–tissue interactions. Topological (SEM) images and roughness profiles were used to show the surface structures of the PGF-Biopor®AB samples. The 3D SEM images (Figure 4A,D) and roughness profiles (Figure 4B,C,E,F) showed that all the PGF-Biopor®ABs had rougher surface structures of high uniformity at PGF-Biopor®AB technical back (TB). Referencing the PGF roughness profile and Cica-care© roughness profile, the uniform peaks and valleys at high PGF-Biopor®AB MIU indicate improved PGF-Biopor®AB interfaces, a result of strong uniform adhesions from a constant rate of Biopor®AB RTV2 vulcanization. The rougher surface structures of high uniformity and improved PGF-Biopor®AB interfaces in silicone viscoelasticity favoured pressure-induced surface area enlargement for mechanotherapy and cellular accessibility with tension offloading.
The use of a uniform screen gauge, biaxial-tensioned PGF, and the control of a uniform rate of vulcanization resulted in the observed uniform rougher surface structure. Biaxial tensioning first stationed PGF with no fabric orientation for effective PGF-Biopor®AB interfacial contacts. Elevated pressure balanced the elevated rate of Biopor®AB viscosity, achieving a uniform rate of Biopor®AB bonding to PGF. The Silica Biopor®AB surface was covered with silanol groups (in negative charge); the ethoxy-containing QM resins and catalyst fillers then modified the PGF-Biopor®AB interfaces with mechanical interlocking and chemical reactions. Specifically, hydrogen bonding from Biopor®AB modified the PGF-Biopor®AB interfaces with physio-sorption in van der Waals forces and electrostatic interactions.
Printing pressure caused the screen-mark microchannels with micro-sized surface roughness for the Biopor®AB. The use of a micro-sized screen gauge (screen #1000 or #2000) determined the sizes of the screen-mark microchannels, and the vulcanization rate controlled the coating thickness. Such micro-sized surface features not only provide tensile and shear tunability for tension shielding and pressure redistribution but also supply suitable sites for stimulating cellular adhesion, growth, and differentiation, hence inducing tissue regeneration for scar therapeutics [28,29,30,31,32,33].
The dyed OM cross-sectional images further illustrated the interior of a representative Biopor®AB-coated structure (Figure 5A). Distorted screen-mark microchannels were observed at the surface structure (1). As the dyed OM images display, biaxial tensioning did not allow for the infiltration of Biopor®AB into the bundles of warp insertions (2), leaving open spaces between fibres (3). This “warp insertions” mobility design is a prerequisite condition of pressure-driven “warp insertions” shifting, offering dynamic internal pressure redistribution. Different as-prepared PGF-Biopor®AB cross-sectional structures in screens #1000 and #2000 are also illustrated in Figure 5B, showing the influence of repeat Biopor®AB wrapping on a cross-sectional structure.
3.1.2. Surface Friction
The coefficient of friction (MIU) in surface properties indicates surface roughness quantitatively. Generally, MIU varies between 0 and 1; a close-to-0 MIU represents a smooth surface, and a close-to-1 MIU represents a rough surface. The interpretation of PGF-Biopor®ABMIU at the cellular level indicates the quality of cell infiltration and degree of stress localization [34]. Figure 6A–D display a collection of PGF-Biopor®ABMIU values (warp, weft) by different printing layers; the higher the number of printing layers, the higher the PGF-Biopor®ABMIU (warp, weft). Referencing controls of Cica-care© MIU (0.73, 0.95) and PGFMIU (0.19, 0.15), both PGF-Biopor®ABMIU, #1000 (0.39–0.96, 0.42–0.94) and PGF-Biopor®AB MIU, #2000 (0.42–1.00, 0.41–1.00) varied close to that of Cica-care© MIU. These results reflected PDMS dominance in composite characteristics, with no screen size effect. The raw material (PGF) originally had a low PGFMIU (0.19, 0.15), and the platinum cross-linking catalyst of RTV2 Biopor®AB and water in the air facilitated siloxane bond rearrangement. Mechanical interlocking from printing pressure and chemical reactions condensed PDMS networking, yielding enhanced functional groups and enhancing surface area. The screen-mark microchannels built a rougher surface structure of a close-to-1 PGF-Biopor®AB MIU. Inherent Biopor®AB viscoelastic properties are sustained, together with dynamic “warp insertions” shifting in PGF-inlaid, hence achieving a dynamic “living system” of full stress relaxation properties for enhancing tensile and shear tunability [35].
The mean deviation for MIU (MMD) indicates the variation in the roughness. The higher the material MMD (warp, weft) value, the higher the roughness variation. The values for PGF-Biopor®AB MMD are higher than PGF MMD and Cica-care© MMD (Figure 6E–H), indicating enhanced contact surface areas. The mean absolute deviation for MIU (SMD) indicates geometrical roughness. The higher the SMD value, the geometrically rougher it is. The high PGF-Biopor®AB warp SMD and PGF-Biopor®AB weft SMD characteristics (Figure 6I–L) indicated significant improvement in geometrical roughness, the sole effect of the mechanical interlocking and chemical reactions [36]. These improvements in MIU, MMD, and SMD not only provide tunability in tensile and shear properties for tension shielding and pressure redistribution but also offer suitable sites that stimulate cellular adhesion, growth, and differentiation, ultimately promoting tissue regeneration for scar therapeutics.
3.2. Mechanical Property Tunability
3.2.1. Tensile Tunability
To achieve tissue tension reduction, the tunability of mechanical properties can be demonstrated through bio-inspired designs that incorporate: (1) a low-modulus matrix, (2) a stretchable network, and/or (3) structural reinforcement [37]. Biopor®AB serves as a low-modulus matrix within a stretchable network, while PGF, with a warp knit and warp insertion design, constitutes an elastic structure with all-direction-stretchability suitable for compression therapy. The “warp insertions” mobility design, coupled with isotropic properties, ensures a nearly equal modulus in all directions. The balanced interplay of compression, stretch, and recovery allows for flexible skin shaping and reduction in skin tension. Mechanotherapy, representing the counteraction against high-tension scarring tissue for pressure and tension reduction, utilizes the viscoelasticity and surface roughness structure to provide external mechanical support to tissues and redistribute pressure. Tuning tensile properties is crucial for controlling skin tension, regulating interactions between cells and the extracellular matrix (ECM), and directing cell phenotype for scar therapeutics [38,39,40].
Characteristic hysteresis loops in the stress-strain curves of PGF-Biopor®AB are illustrated in Figure 7A–C and Figure 8A–C. Upon removing the load from tensile testing, the strain exhibited slow recovery. The strain increased with pseudo-elastic loading-unloading energy dissipation, indicating characteristics of multiple stretching-relaxation cycles and highlighting enhanced tensile tunability for elasticity and flexibility. Examining individual stress-strain curves reveals a relative “fattening” of characteristic hysteresis loops from thin to thick layers. Low-strain characteristics are observed in initial layers with low-viscosity printing, while high-strain characteristics result from repeated printing with pressure and viscosity accumulation. The “fattening” of hysteresis loops from thin to thick layers signifies an increase in viscosity and cross-linking with repeated printing, suggesting higher energy absorption. The conventional Mullins effect is employed to explain the characteristics of multiple stretching/relaxation cycles [41,42,43] (Figure 7D and Figure 8D). The Mullins effect indicates that Biopor®AB becomes slightly softer during the initial load cycles, with subsequent responses typically repeatable from cycle to cycle. The higher the number of stretching/relaxation cycles, the greater the elasticity and flexibility tunability.
The stress characteristics for screens #1000 and #2000 are similar, and they all fall in the same range of 100–335 kPa, with no screen size effect (Table 2). The strain characteristics for screens #1000 and #2000 are also similar—low strains for the thin layer set (0.87% to 3.30%) and high strains for the thick layer set (11.4% to 36%)—and have no screen size effect. The Young’s moduli are E#1000 (9.83–184.80 kPa, 27.10–187.24 kPa) and E#2000 (8.38–123.50 kPa, 20.90–112.29 kPa), indicating no screen size effect. The silicone micro-roughness, silicone surface enlarged area, and pressure-driven “warp insertions” mobility are the tension-sensitive features that contributed to the strain characteristics trends observed in the stress–strain curves. The enhanced tensile strength, Young’s modulus, and “warp insertions” shifting represented the dynamic enhancement in elasticity and extensibility, which, together, could help to maintain a suitable mechanically viable healing microenvironment. The tensile strength and similar-to-silicone elastic moduli should favour cell–substrate interactions and force modulation. The PGF-Biopor®AB composite can act like a force-modulating dressing, performing stress shielding to guide cellular structural alignment for scar therapeutics [1].
Most cell types exhibit elastic moduli in the range of ~1 to ~100 kPa, and some exhibit elastic moduli in the range of ~40–400 kPa if they are in a stiff environment (e.g., cardiac muscle tissues) [44]. When very few materials can cover the entire soft to stiff elastic moduli range of the human body (from kPa to MPa), PGF-Biopor®ABtensile strength (105.28–349.80 kPa, 106.67–332.10 kPa) and PGF-Biopor®ABYoung’s modulus (8.38–184.80 kPa, 20.90–187.24 kPa) are advantageous for touching both the “soft” and the modified “stiff” environment. In a study on chondrocytes cultured within 3D hydrogels, the cellular Young’s modulus of ~5 kPa in the stiffer gels could rapidly change to a higher Young’s modulus of ~20 kPa in cells [45], which is a 4-fold increase. On this basis, PGF-Biopor®AB Young’s modulus (8.38–184.80 kPa, 20.90–187.24 kPa) should enable the rapid development of high PGF-Biopor®AB Young’s moduli in cells ~(33.52–739.20 kPa, 83.6–748.96 kPa). Such projected high Young’s moduli in cells should enable an as effective tension shielding effect as that of 3D hydrogels. Specifically, the nonlinear mechanical property improvement in tensile and Young’s moduli should allow for mechanical support, architecture for cell growth, and structural alignment at the scarring site, assisting scar treatment [46]. The novel “warp insertions” mobility design with stress–strain relaxation properties therefore enables the dynamic tunability of PGF-Biopor®AB elasticity in the kPa range to fit the ECM elasticity. The enhanced cellular Young’s moduli, and tensile strength may help to restore skin’s viscoelastic behaviour for scar therapeutics.
According to Table 2, a better tensile strength and elasticity were displayed for screen #1000, indicating better tensile property tunability for screen #1000. According to Table 3, overall tensile energy increased with repeat printing, a reflection of increases in viscosity and cross-linking and enhanced tensile properties. These results suggest that the design of “warp insertion mobility” and PGF-inlaid do not compromise overall tensile properties but enhance tensile tunability.
Material and structure can be used to explain the increase in tensile tunability. Biopor®AB is originally amorphous and has low surface energy (low molecular attraction with surface energy lower than water). The Si-O-Si backbone in Biopor®AB offers intriguing properties of high flexibility, low bulk density and no dimension-dependent properties [48]. Nylon in PGF is of low density and high tensile strength, and fibres can be optimized to maximum strength and stiffness if continuous fibres in bulk bundles are stretched with mobility [49]. Screen printing using Biopor®AB, printing pressure modified the viscoelasticity of Biopor®AB under strain-softening followed by strain-hardening, and modulus increment increases tensile tunability [50,51]. In the “warp insertions” mobility design, bundle mobility also allowed dynamic fibre tensile strength optimization and high stiffness [52]. This unique composite structure therefore offered tensile and modulus tunability, offering desired mechanical responses matching to non-linear properties of biological scarring tissues.
3.2.2. Shear Tunability
Shear and bending properties are closely interconnected and hold significance in the context of scar therapeutics, offering insights into product adhesiveness and its adherence to scar curvature. Shear testing generates shear force-shear angle curves and values in terms of G and 2HG. Shear stiffness (G) indicates the ease of fibre sliding during shear deformation, representing their resistance to rotation [52]. Shear hysteresis (2HG) reflects recoverability under shear deformation, with G characterizing the overall stiffness of the structure [53].
In the realm of scar therapeutics, G values play a crucial role in determining the product’s readiness to conform to 3D curvature. A lower G value suggests greater adaptability to 3D curvature but reduced protection against shearing, and vice versa [52]. However, a higher 2HG value indicates poor recoverability. In the shear force-shear angle curves for PGF and Cica-care©, rather than a typical loading/unloading pattern, ripples appear at the ends. These ripples signify successive loading/unloading cycles involving both elastic and plastic deformation (Figure 9A–H). Initially deforming elastically, the region then experiences plastic deformation, and the characteristic ripples indicate elongated recovery after stretching, along with the coexistence of enlarged strains preventing immediate spring back to the original state. These unique ripples signify shear tunability, shear stiffness, and shear hysteresis accumulated through repeat printing. Payne’s effect elucidates this shear-thinning behaviour [54], which is a distinctive rheological flow characteristic of silicone and interfacial interactions under printing pressure (Figure 9I). Biopor®AB viscosity decreases with increasing shear rate, followed by softening during repeat cycles of printing. With more printing layers, the most significant stress softening occurs at the part with the most prominent ripple from high-viscosity printing. The increased number of printing layers and associated rise in Biopor®AB content and viscosity accentuate the nature of ripples, revealing more pronounced shear-thinning behaviour in conjunction with the reinforcement effect.
Table 4 lists the Kawabata testing values for the shear properties in G and 2HG. Compared to G PGF (0.60, 0.75), G PGF-Biopor®AB #1000 and #2000 showed a maximum increase in shear rigidity from 728% up to 1483% warpwisely and 593% up to 1127% weftwisely. Compared to G Cica-Care© (0.89, 0.85), they showed a maximum increase in shear rigidity from 491% up to 1000% warpwisely and from 524% to 1170% weftwisely. Compared to 2HGPGF (0.41, 1.85), 2HG PGF-Biopor®AB #1000 and #2000 showed a maximum increase in shear hysteresis from 805% up to 1588% warpwisely and 207% up to 404% weftwisely. Compared to 2HGCica-Care© (3.06, 0.82), they showed a maximum increase in shear hysteresis from 108% up to 213% warpwisely and from 467% to 911% weftwisely. Those overall significant enhancements in shear stiffness and shear hysteresis with ripples represented a significant shear improvement with high shear tunability. The comparatively lower Gthin layers indicated their greater readiness of conformity to the 3D curvature upon scar therapeutic application but lower protection from shearing. The comparatively higher Gthick layers indicated their comparatively lower readiness for conformity to the 3D curvature upon scar therapeutic application but higher protection from shearing. In our board analysis of shear hysteresis, PGF-Biopor®ABG and 2HG indicated better shaping and better skin adhesiveness to the scar site, as well as an improved effectiveness of skin contact at scar curvature. However, these results meant that the composites had poorer recoverability from shear deformation.
In a fibre-reinforced material PGF-Biopor®AB, the matrix (Biopor®AB) functioned as a medium for load transfer through the fibres utilizing shear stress. In the biaxial tensioning of PGF, the tension-aligned loops provided the shear stiffness alignment, while the spirality of the loops in Biopor®AB wrapping provided shear stress for shear hysteresis enhancement [55]. The shear stiffness alignment and hysteresis enhancement not only maintained good dimensional stability for tension shielding but also protected the fibres from breakage, enabling load sharing in “warp insertions” shifting for internal pressure redistribution.
3.2.3. Non-Tuneable Bending Properties
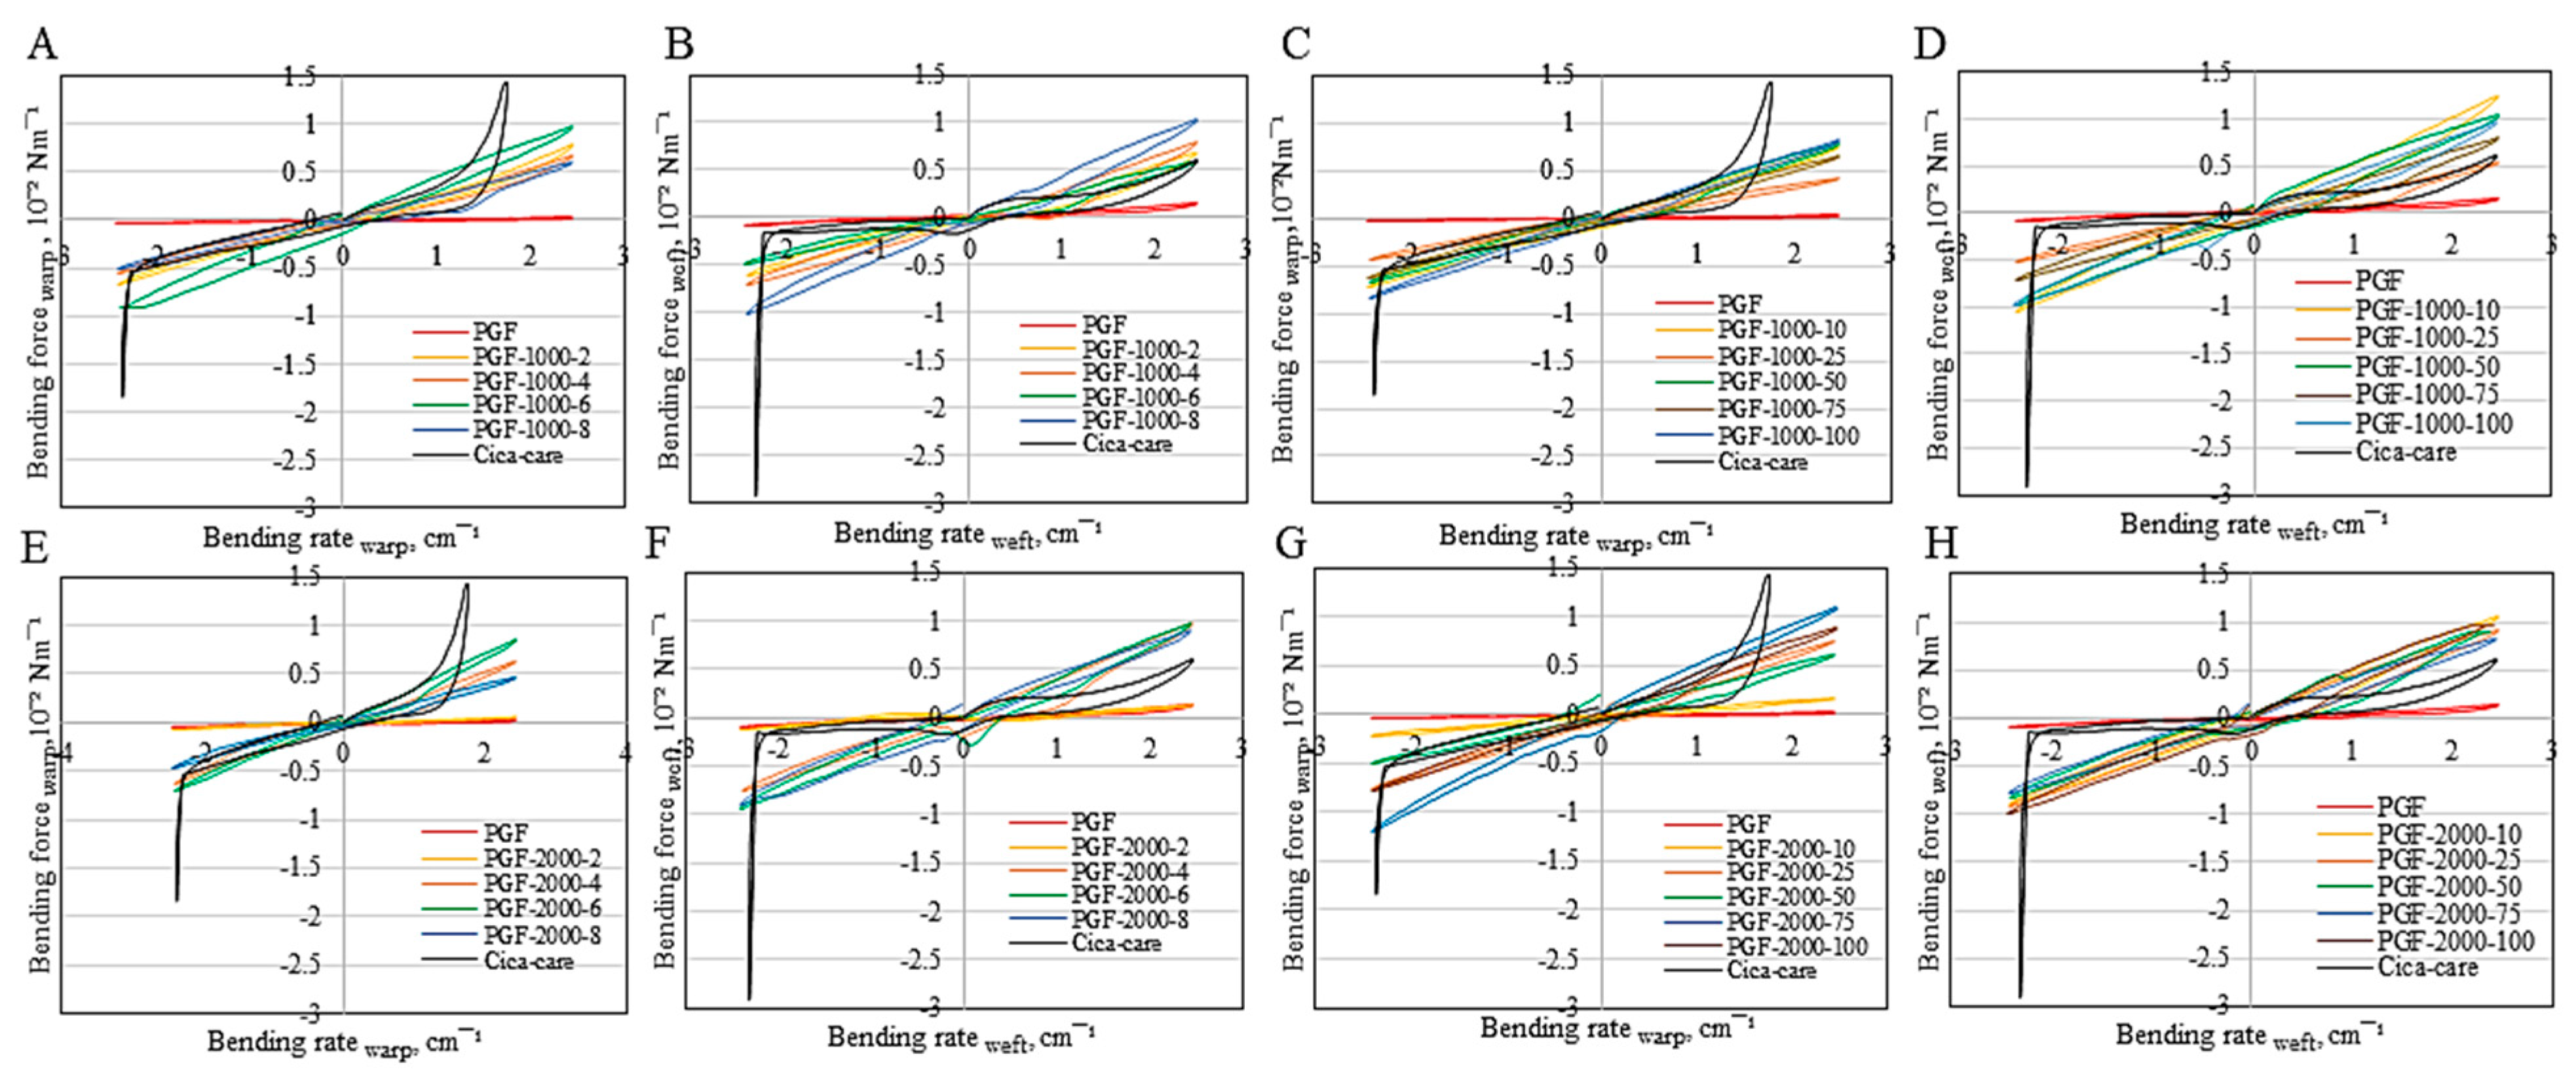
Bending rigidity (B) is a measure of bending resistance to bending deformation, indicating bending stiffness. A higher B indicates greater resistance to bending, and B reflects composite flexibility [56]. Bending hysteresis (2HB) represents its hysteresis under bending moment, a measure of its recovery from bending deformation. The smaller the 2HB, the better the bending recovery [1,31].
Figure 10 shows that all composites demonstrated a constant range of force and bending rate, as well as almost the same hysteresis as that of silicone (Cica-care©). These results imply that the composite bending nature is Biopor®AB-dominated. The bending of fabrics is generally non-linear, and the PGF-inlaid in PGF-BioporAB should be responsible for bending non-linearity [57]. The composite non-linear bending behaviour is likely due to the presence of friction and rate effects [57].
3.3. Mechano-Therapeutic Performance
3.3.1. Load Sharing in Internal Pressure Redistribution
Within the “spiral-through-the-thickness” structure, regions without Biopor®AB impregnation were intentionally left to facilitate the mobility of “warp insertions,” ensuring the maximum volume fraction for equitable load-sharing [58]. The Biopor®AB coating in this structure played a dual role by not only allowing the free movement of the 12 SPK-filament bundles but also preventing the breakage of these bundles. Microscopic assessment of PGF-Biopor®AB samples from trial patients confirmed the absence of fibre breakage, substantiating the validity of the condition r = 0 in achieving the “equal load-sharing bundle” model. According to this model, free “warp insertions” mobility leads to equal load-sharing, and the stress concentration for each SPK filament bundle can be expressed as
where r = 0 under the condition of no fibre breakage, and here, 1 represents 100% equal load sharing in fulfilment of the “equal load-sharing bundle” model [59,60].
kELS = 12/(12 − r) = 1
In a trial with bandaging pressure application at 20 mmHg (2.66 kN/m2), 12 SPK filament bundles of “warp insertions” were free to move inside the “spiral-through-the-thickness” structure. A calculated equal load sharing of 0.22 kN/m2 from each SPK filament bundle verified dynamic internal pressure redistribution, achieving a balance between compression and tension forces for scar therapeutics [61,62].
3.3.2. Force Reduction upon Tension Shielding and Pressure Redistribution
According to the Laplace formula, keeping a constant pressure of application on PGF-Biopor®AB, tensile force, and cross-sectional area maintains the function of the inversely proportional relationship, as Equation 1 listed. Maintaining a constant pressure of application in surface property testing from the Kawabata KES-F systems, using results from the Kawabata testing and Equation 1, we determined the variation in the tensile force and cross-sectional area for different PGF-Biopor®ABs.
Table 5 lists the results regarding the variation in tensile forces and cross-sectional areas from the Kawabata testing at the “Biopor®AB-skin-touching” surface of the PGF-Biopor®ABs. Comparing Cica-care S (2.476 cm2) and PGF S (2.256 cm2), the variation in the PGF-Biopor®Ab S varied in the range of 2.126 to 2.367 cm2. Comparing PGFF (1.80 kPa) and Cica-care F (1.97 kPa), the variation in PGF-Biopor®AB F varied in the range of 1.69 to 1.99 kPa. The results show that PGF-Biopor®AB F force reduction mostly fell in the range between PGF F and Cica-care F, with two samples yielding a force reduction larger than Cica-care F. These results imply that the larger the enlarged surface area of PGF-Biopor®AB S, the larger the PGF-Biopor®AB F force reduction at the scarring site. The polyamide yarns with spandex in PGF reinforced the vulcanized Biopor®AB layers in PGF-Biopor®AB, and pressure-driven “ warp insertions” shifting allowed for the dynamic maintenance of deformity and elasticity. In the PGF-Biopor®ABs, the PGF embedding in the Biopor®AB layers under biaxial tensioning did not alter the function of this 3D knitting–weaving structure, allowing for compression therapy and pressure redistribution. That is, the viscoelastic rougher surface structure and “warp insertions” shifting provided a decent quality of pressure redistribution, and effective force reduction demonstrated scar therapeutics.
4. Conclusions
This study optimized the mechano-therapeutic performance of a scar healing composite to achieve tension reduction and pressure sharing, forming a good tension-relieving mechanotherapy strategy for scar therapeutics. The PGF-Biopor®AB composite exhibited mechanotherapy using a rough surface structure and “warp insertions” mobility. The micro-roughness and viscoelastic properties of Biopor®AB wrapping contributed to its increased surface area, stiffness, and elastic modulus, enhancing mechanical tunability in tension and shear. At a testing pressure of 4.9 kPa, a tension reduction of 1.99 kPa was verified for the Biopor®AB surface structure with close-to-1 MIU silicone roughness, hence realizing tension shielding and pressure redistribution. Pressure-driven “warp insertions” shifting demonstrated 0.22 kPa of pressure sharing from each SPK filament bundle, verifying internal pressure redistribution. From the micro perspective, the projection of PGF-Biopor®AB Young’s moduli (8.38–184.80 kPa, 20.90–187.24 kPa) should enable the rapid development of high PGF-Biopor®AB Young’s moduli in cells (33.52–739.20 kPa, 83.6–748.96 kPa). A high cellular Young’s modulus would enable tension and pressure reductions and favour a high number of cell attachments, both assisting tissue regeneration for scar therapeutics.
Author Contributions
K.-C.L.: Methodology, Validation, Formal analysis, Investigation, Writing—original draft. X.W. and C.-W.K.: Methodology, Formal analysis, Writing—supervision, review and editing. All authors have read and agreed to the published version of the manuscript.
Funding
This research received no external funding.
Data Availability Statement
The data presented in this study are available on request from the corresponding author.
Acknowledgments
The first author would like to thank The Hong Kong Polytechnic University for a 4-year full-time research scholarship. Our special thanks go to Nuruzzaman Noor, Bin Fei, and Akanksha Pragya for their contributions to the initial work.
Conflicts of Interest
The authors declare no conflicts of interest.
References
- Ghosh, T.K.; Zhou, N. Characterization of fabric bending behaviour: A review of measurement principles. Indian J. Fibre Text. Res. 2003, 28, 471–476. [Google Scholar]
- Davidson, M.D.; Burdick, J.A.; Wells, R.G. Engineered Biomaterial Platforms to Study Fibrosis. Adv. Healthc. Mater. 2020, 9, 1901682. [Google Scholar] [CrossRef] [PubMed]
- Fernandes, M.G.; da Silva, L.P.; Marques, A.P. Skin mechanobiology and biomechanics: From homeostasis to wound healing. In Advances in Biomechanics and Tissue Regeneration; Academic Press: Cambridge, MA, USA, 2019; pp. 343–360. [Google Scholar]
- Swanson, E. Tension shielding with the embrace device: Does it really improve scars? Plast. Reconstr. Surg. 2014, 134, 662e–664e. [Google Scholar] [CrossRef] [PubMed]
- Hosseini, M.; Brown, J.; Khosrotehrani, K.; Bayat, A.; Shafiee, A. Skin biomechanics: A potential therapeutic intervention target to reduce scarring. Burn. Trauma 2022, 10, tkac036. [Google Scholar] [CrossRef] [PubMed]
- Barnes, L.A.; Marshall, C.D.; Leavitt, T.; Hu, M.S.; Moore, A.L.; Gonzalez, J.G.; Longaker, M.T.; Gurtner, G.C. Mechanical Forces in Cutaneous Wound Healing: Emerging Therapies to Minimize Scar Formation. Adv. Wound Care 2018, 7, 47–56. [Google Scholar] [CrossRef] [PubMed]
- Hsu, C.K.; Lin, H.H.; Hans, I.; Harn, C.; Hughes, M.W.; Tang, M.J.; Yang, C.C. Mechanical forces in skin disorders. J. Dermatol. Sci. 2018, 90, 232–240. [Google Scholar] [CrossRef] [PubMed]
- Kuehlmann, B.; Bonham, C.A.; Zucal, I.; Prantl, L.; Gurtner, G.C. Mechanotransduction in wound healing and fibrosis. J. Clin. Med. 2020, 9, 1423. [Google Scholar] [CrossRef] [PubMed]
- Huang, C.; Holfeld, J.; Schaden, W.; Orgill, D.; Ogawa, R. Mechanotherapy: Revisiting physical therapy and recruiting mechanobiology for a new era in medicine. Trends Mol. Med. 2013, 19, 555–564. [Google Scholar] [CrossRef]
- Seo, B.R.; Mooney, D.J. Recent and future strategies of mechanotherapy for tissue regenerative rehabilitation. ACS Biomater. Sci. Eng. 2022, 8, 4639–4642. [Google Scholar] [CrossRef]
- Ma, S.; Tang, Q.; Han, X.; Feng, Q.; Song, J.; Setchi, R.; Liu, Y.; Liu, Y.; Goulas, A.; Engstrøm, D.S.; et al. Manufacturability, mechanical properties, mass-transport properties and biocompatibility of triply periodic minimal surface (TPMS) porous scaffolds fabricated by selective laser melting. Mater. Des. 2020, 195, 109034. [Google Scholar] [CrossRef]
- Chan, C.K.; Jiang, X.Y.; Liew, K.L.; Chan, L.K.; Wong, W.K.; Lau, M.P. Evaluation of mechanical properties of uniform fabrics in garment manufacturing. J. Mater. Process. Technol. 2006, 174, 183–189. [Google Scholar] [CrossRef]
- Fletcher, J. Pressure ulcer education 4: Selection and use of support surfaces. Nurs. Times 2020, 116, 41–43. [Google Scholar]
- Gómez-González, M.; Latorre, E.; Arroyo, M.; Trepat, X. Measuring mechanical stress in living tissues. Nat. Rev. Phys. 2020, 2, 300–317. [Google Scholar] [CrossRef]
- Forbes, K.J.; Hjortsoe, I.M.; Nenova, T. The Shocks Matter: Improving Our Estimates of Exchange Rate Pass-Through. Available online: https://papers.ssrn.com/sol3/papers.cfm?abstract_id=2689737 (accessed on 10 November 2023).
- Fernandes, M.G.; da Silva, L.P.; Cerqueira, M.T.; Ibañez, R.; Murphy, C.M.; Reis, R.L.; Marques, A.P. Mechanomodulatory biomaterials prospects in scar prevention and treatment. Acta Biomater. 2022, 150, 22–33. [Google Scholar] [CrossRef] [PubMed]
- Klare, M. Elastomer Materials. Germany Patent DE 10 2011 115 061 A1, 11 April 2013. [Google Scholar]
- Chang, S.I.; Yoon, J.B. Shape-controlled, high fill-factor microlens arrays fabricated by a 3D diffuser lithography and plastic replication method. Opt. Express 2004, 12, 6366–6371. [Google Scholar] [CrossRef] [PubMed]
- Ahmed, S.; Yang, H.K.; Ozcam, A.E.; Efimenko, K.; Weiger, M.C.; Genzer, J.; Haugh, J.M. Poly (vinylmethylsilox ane) elastomer networks as functional materials for cell adhesion and migration studies. Biomacromolecules 2011, 12, 1265–1271. [Google Scholar] [CrossRef] [PubMed]
- Ogawa, R. Keloid and hypertrophic scars are the result of chronic inflammation in the reticular dermis. Int. J. Mol. Sci. 2017, 18, 606. [Google Scholar] [CrossRef]
- Puzey, G. The use of pressure garments on hypertrophic scars. J. Tissue Viability 2002, 2002, 11–15. [Google Scholar] [CrossRef]
- Lui, K.C.; Noor, N.; Kan, C.W.; Wang, X. A self-pumping composite dressing improved hypertrophic scar healing with dual therapy and active-fluid transport. J. Compos. Sci. 2023, 7, 192. [Google Scholar] [CrossRef]
- Ly, N.G.; Denby, E.F. A CSIRO inter-laboratory trial of the KES-F for measuring fabric properties. J. Text. Inst. 1988, 79, 198–219. [Google Scholar] [CrossRef]
- McNeely, M.R.; Sputea, M.K.; Tusneem, N.A.; Oliphant, A.R. Sample processing with hydrophobic microfluidics. J. Assoc. Lab. Autom. 1999, 4, 30–33. [Google Scholar] [CrossRef]
- Hong, S.; Minary-Jolandan, M.; Naraghi, M. Controlling the wettability and adhesion of carbon fibres with polymer interfaces via grafted nanofibers. Compos. Sci. Technol. 2015, 117, 130–138. [Google Scholar] [CrossRef]
- Andersson, C.H.; Dartman, T.; Gredinger, P.; Asplund, J.; Strandqvist, H. Flexible composites, strength, deformation, and fracture processes. 1. reinforcement structures and tensile strength. Mech. Compos. Mater. 1998, 34, 525–536. [Google Scholar] [CrossRef]
- Huang, H.; Kamm, R.D.; Lee, R.T. Cell mechanics and mechanotransduction: Pathways, probes, and physiology. Am. J. Physiol.-Cell Physiol. 2004, 287, C1–C11. [Google Scholar] [CrossRef] [PubMed]
- Venkatraman, S.; Gale, R. Skin adhesives and skin adhesion: 1. Transdermal drug delivery systems. Biomaterials 1998, 19, 1119–1136. [Google Scholar] [CrossRef]
- Verdier-Sévrain, S.; Bonté, F. Skin hydration: A review on its molecular mechanisms. J. Cosmet. Dermatol. 2007, 6, 75–82. [Google Scholar] [CrossRef] [PubMed]
- Wang, C.; Brown, G.O.; Burris, D.L.; Korley, L.T.; Epps, T.H., III. Coating architects: Manipulating multiscale structures to optimize interfacial properties for coating applications. Am. Chem. Soc. Appl. Polym. Mater. 2019, 1, 2249–2266. [Google Scholar] [CrossRef]
- Lahey, T.J.; Heppler, G.R. Mechanical modelling of fabrics in bending. J. Appl. Mech. 2004, 71, 32–40. [Google Scholar] [CrossRef]
- Owen, M.J.; Dvornic, P.R. (Eds.) Silicone Surface Science, Advances in Silicon Science 4; Springer: Dordrecht, The Netherlands, 2012. [Google Scholar]
- Kawabata, S.; Niwa, M. Objective measurement of fabric mechanical property and quality: Its application to textile and clothing manufacturing. Int. J. Cloth. Sci. Technol. 1991, 3, 7–18. [Google Scholar] [CrossRef]
- Stein, J.; Prutzman, L.C. Stress relaxation studies of model silicone RTV networks. J. Appl. Polym. Sci. 1988, 36, 511–521. [Google Scholar] [CrossRef]
- Xu, R.; Luo, G.; Xia, H.; He, W.; Zhao, J.; Liu, B.; Tan, J.; Zhou, J.; Liu, D.; Wang, Y.; et al. Novel bilayer wound dressing composed of silicone rubber with particular micropores enhanced wound re-epithelialization and contraction. Biomaterials 2015, 40, 1–11. [Google Scholar] [CrossRef] [PubMed]
- Akovali, G. (Ed.) Handbook of Composite Fabrication; Smithers Rapra Publishing: Gaithersburg, MD, USA, 2001. [Google Scholar]
- Jang, K.I.; Chung, H.U.; Xu, S.; Lee, C.H.; Luan, H.; Jeong, J.; Cheng, H.; Kim, G.; Han, S.Y.; Lee, J.W.; et al. Soft network composite materials with deterministic and bio-inspired designs. Nat. Commun. 2015, 6, 6566. [Google Scholar] [CrossRef]
- Aljghami, M.E.; Saboor, S.; Amini-Nik, S. Emerging innovative wound dressings. Ann. Biomed. Eng. 2019, 47, 659–675. [Google Scholar] [CrossRef] [PubMed]
- Kong, N.; Peng, Q.; Li, H. Rationally designed dynamic protein hydrogels with reversibly tunable mechanical properties. Adv. Funct. Mater. 2014, 24, 7310–7317. [Google Scholar] [CrossRef]
- Cordeiro, J.M.; Nagay, B.E.; Dini, C.; Souza, J.G.; Rangel, E.C.; da Cruz, N.C.; Yang, F.; van den Beucken, J.J.J.P.; Barão, V.A. Copper source determines chemistry and topography of implant coatings to optimally couple cellular responses and antibacterial activity. Biomater. Adv. 2022, 134, 112550. [Google Scholar] [CrossRef] [PubMed]
- Fuard, D.; Tzvetkova-Chevolleau, T.; Decossas, S.; Tracqui, P.; Schiavone, P. Optimization of poly-di-methyl-siloxane (PDMS) substrates for studying cellular adhesion and motility. Microelectron. Eng. 2008, 85, 1289–1293. [Google Scholar] [CrossRef]
- De Tommasi, D.; Puglisi, G.; Saccomandi, G. A micromechanics-based model for the Mullins effect. J. Rheol. 2006, 50, 495–512. [Google Scholar] [CrossRef]
- Ogden, R.W.; Roxburgh, D.G. A pseudo–elastic model for the Mullins effect in filled rubber. Proc. R. Soc. Lond. Ser. A Math. Phys. Eng. Sci. 1999, 455, 2861–2877. [Google Scholar] [CrossRef]
- Piel, M.; Théry, M. Micropatterning in Cell Biology, Part C (Chapter 3); Elsevier: Amsterdam, The Netherlands, 2014. [Google Scholar]
- Rehman, A.; Jabbar, M.; Umair, M.; Nawab, Y.; Jabbar, M.; Shaker, K. A study on the interdependence of fabric pore size and its mechanical and comfort properties. J. Nat. Fibers 2019, 16, 795–805. [Google Scholar] [CrossRef]
- Qian, W.; Hu, X.; He, W.; Zhan, R.; Liu, M.; Zhou, D.; Huang, Y.; Hu, X.; Wang, Z.; Fei, G.; et al. Polydimethylsiloxane incorporated with reduced graphene oxide (rGO) sheets for wound dressing application: Preparation and characterization. Colloids Surf. B: Biointerfaces 2018, 166, 61–71. [Google Scholar] [CrossRef]
- Chen, J.; Irianto, J.; Inamdar, S.; Pravincumar, P.; Lee, D.A.; Bader, D.L.; Knight, M.M. Cell mechanics, structure, and function are regulated by the stiffness of the three-dimensional microenvironment. Biophys. J. 2012, 103, 1188–1197. [Google Scholar] [CrossRef] [PubMed]
- Thostenson, E.T.; Chou, T.W. Aligned multi-walled carbon nanotube-reinforced composites: Processing and mechanical characterization. J. Phys. D Appl. Phys. 2002, 35, L77. [Google Scholar] [CrossRef]
- Santos, E.; Orive, G.; Hernández, R.M.; Pedraz, J.L. Cell-Biomaterial Interaction: Strategies to Mimic the Extracellular Matrix. In On Biomimetics; IntechOpen: London, UK, 2011. [Google Scholar]
- Sarkar, D.; Zhao, W.; Schaefer, S.; Ankrum, J.A.; Teo, G.S.; Pereira, M.N.; Lino Ferreira Karp, J.M. Overview of tissue engineering concepts and applications. In Biomaterials Science; Academic Press: Cambridge, MA, USA, 2013; pp. 1122–1137. [Google Scholar]
- Jorba, I.; Beltrán, G.; Falcones, B.; Suki, B.; Farré, R.; García-Aznar, J.M.; Navajas, D. Nonlinear elasticity of the lung extracellular microenvironment is regulated by macroscale tissue strain. Acta Biomater. 2019, 92, 265–276. [Google Scholar] [CrossRef]
- Mukhopadhyay, M. Mechanics of Composite Materials and Structures; Universities Press: Cambridge, MA, USA, 2005. [Google Scholar]
- Ahmadzadeh, S.M.H.; Hukins, D.W. Feasibility of using mixtures of silicone elastomers and silicone oils to model the mechanical behaviour of biological tissues. Proc. Inst. Mech. Eng. Part H J. Eng. Med. 2014, 228, 730–734. [Google Scholar] [CrossRef] [PubMed]
- Harwood, J.A.C.; Mullins, L.; Payne, A.R. Stress softening in natural rubber vulcanizates. Part II. Stress softening effects in pure gum and filler loaded rubbers. J. Appl. Polym. Sci. 1965, 9, 3011–3021. [Google Scholar] [CrossRef]
- Yunus, D.E.; He, R.; Shi, W.; Kaya, O.; Liu, Y. Short fibre reinforced 3D printed ceramic composite with shear induced alignment. Ceram. Int. 2017, 43, 11766–11772. [Google Scholar] [CrossRef]
- Renò, F.; Sabbatini, M.; Lombardi, F.; Stella, M.; Pezzuto, C.; Magliacani, G.; Cannas, M. In vitro mechanical compression induces apoptosis and regulates cytokines release in hypertrophic scars. Wound Repair Regen. 2003, 11, 331–336. [Google Scholar] [CrossRef]
- Lomov, S.V.; Belov, E.B.; Bischoff, T.; Ghosh, S.B.; Chi, T.T.; Verpoest, I. Carbon composites based on multiaxial multiply stitched preforms. Part 1. Geometry of the preform. Compos. Part A Appl. Sci. Manuf. 2002, 33, 1171–1183. [Google Scholar] [CrossRef]
- Krupp, T.; dos Santos, B.D.; Gama, L.A.; Silva, J.R.; Arrais-Silva, W.W.; de Souza, N.C.; Américo, M.F.; de Souza Souto, P.C. Natural rubber-propolis membrane improves wound healing in second-degree burning model. Int. J. Biol. Macromol. 2019, 131, 980–988. [Google Scholar] [CrossRef]
- Song, S.; Drotlef, D.M.; Majidi, C.; Sitti, M. Controllable load sharing for soft adhesive interfaces on three-dimensional surfaces. Proc. Natl. Acad. Sci. USA 2017, 114, E4344–E4353. [Google Scholar] [CrossRef]
- Gupta, A.; Mahesh, S.; Keralavarma, S.M. Strength distribution of large unidirectional composite patches with realistic load sharing. Phys. Rev. E 2017, 96, 043002. [Google Scholar] [CrossRef] [PubMed]
- Habeeb, C.I.; Mahesh, S. Strength distribution of planar local load-sharing bundles. Phys. Rev. E 2015, 92, 022125. [Google Scholar] [CrossRef] [PubMed]
- Abdul-Bari, M.M.; McQueen, R.H.; Nguyen, H.; Wismer, W.V.; de la Mata, A.P.; Harynuk, J.J. Synthetic clothing and the problem with odour: Comparison of nylon and polyester fabrics. Cloth. Text. Res. J. 2018, 36, 251–266. [Google Scholar] [CrossRef]
Figure 1.
Pressure redistribution at the scarring site: (A) the concept of pressure redistribution [15]; (B) in the “ warp insertions” mobility design, “warp insertions” mobility demonstrated shifting in “warp insertions” and load sharing for pressure redistribution; (C) at the “Biopor®AB-skin touching” surface, roughness, and silicone relaxation properties created an enlarged surface area for pressure redistribution.

Figure 2.
The warp knit structure of PGF: (A) Graphical representation. (B) Longitudinal view of PGF (Technical Face TF and Technical Back TB). (C) Cross-sectional view (wrapping loops and bundles of “warp insertions”).
Figure 2.
The warp knit structure of PGF: (A) Graphical representation. (B) Longitudinal view of PGF (Technical Face TF and Technical Back TB). (C) Cross-sectional view (wrapping loops and bundles of “warp insertions”).
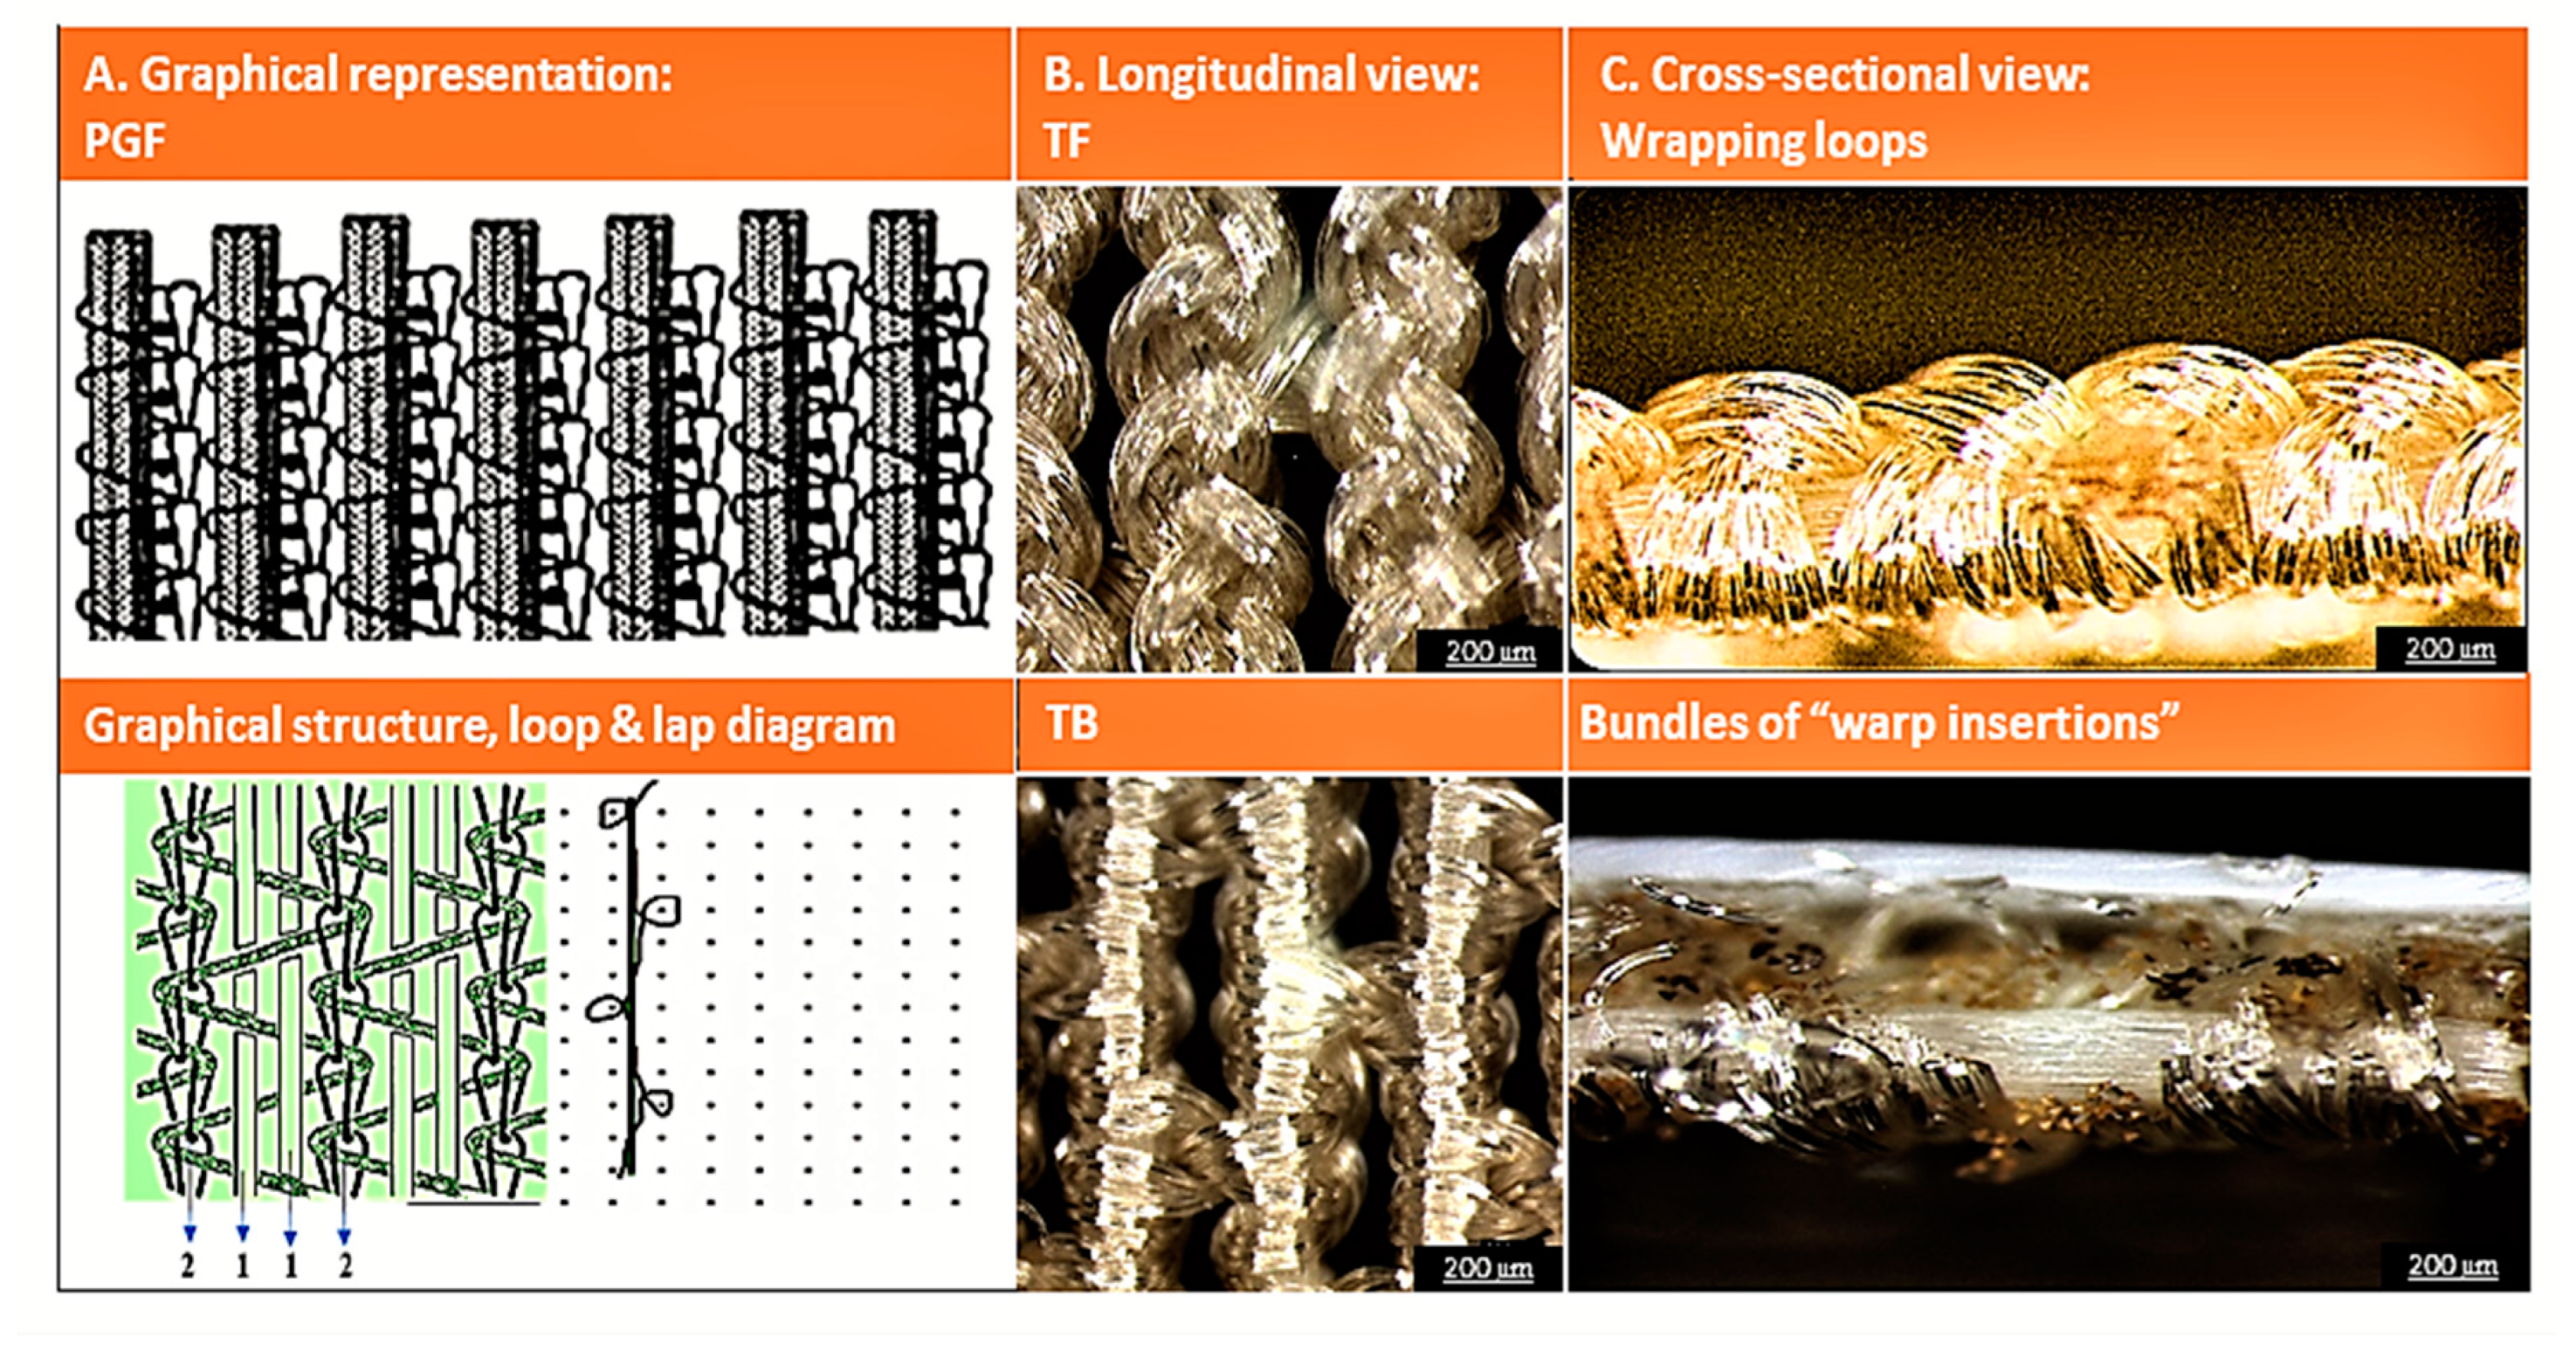
Figure 3.
The process of manufacturing the PGF-Biopor®AB structures.
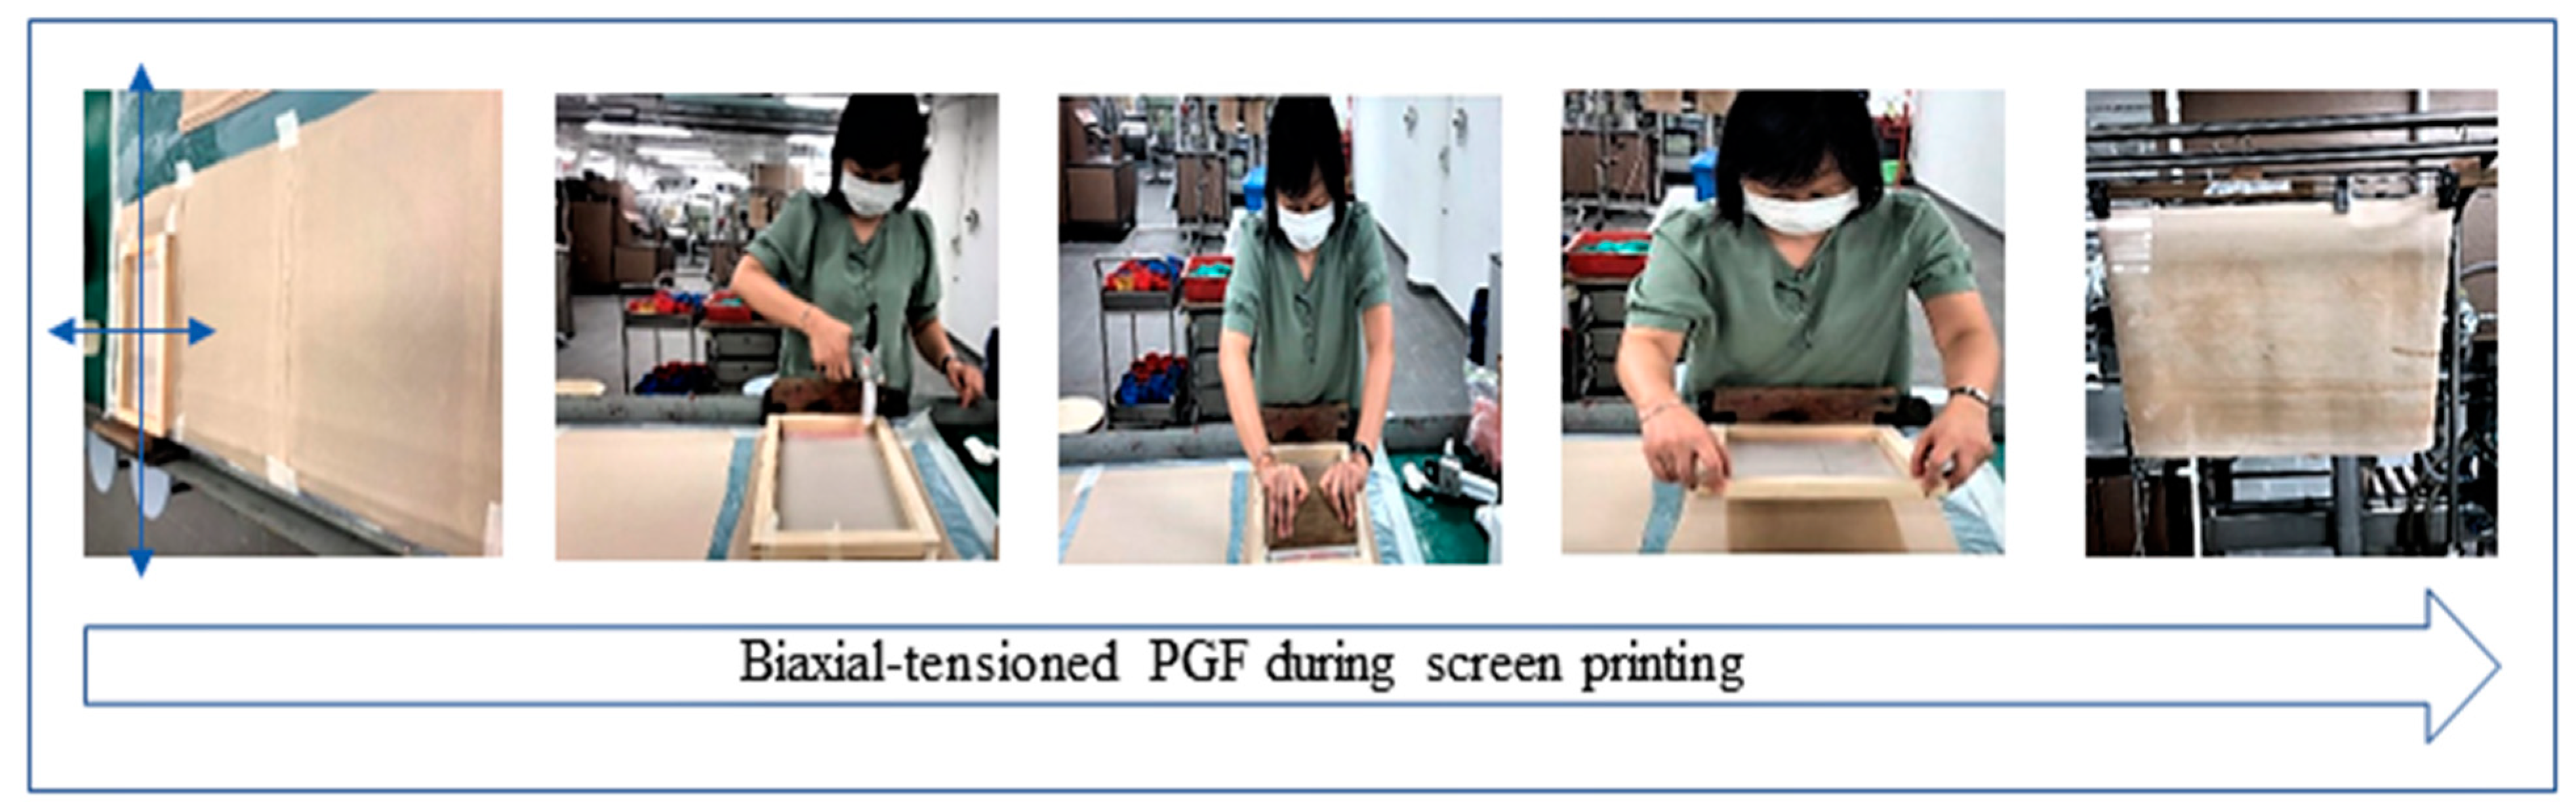
Figure 4.
PGF-Biopor®AB topological structures and roughness profiles with controls of PGF and Cica-care©: (A) #1000 SEM surface structures (SEM 60×, 1 mm), (B) #1000 MIU warp roughness profiles, and (C) #1000 MIU weft roughness profiles. (D) #2000 SEM surface structure (SEM 60×, 1 mm), (E) #2000 MIU warp roughness profiles, and (F) #2000 MIU weft roughness profiles. For each roughness profile, 125 data points were obtained from the KES-F surface and friction machine; the mode was selected out of six samples with a p-value below 0.05.

Figure 5.
Cross-sectional views of Biopor®AB-coated structures: (A) An illustration of the process of topological imperfections with OM cross-sectional images (OM 150×, 200 µm and 320×, 500 µm). In (A), 1—surface roughness structure, formed from the LBL screen-mark printed microchannels; 2—bundles of “warp insertions”; and 3—“Warp insertions” mobility, “blue-dyed wrapping yarn with spaces around bundles of “warp insertions”. (B) Different as-prepared PGF-Biopor®AB structures, with control cross-sectional structures in screens #1000 and #2000 (OM 150×, 200 µm, warpwise and weftwise).
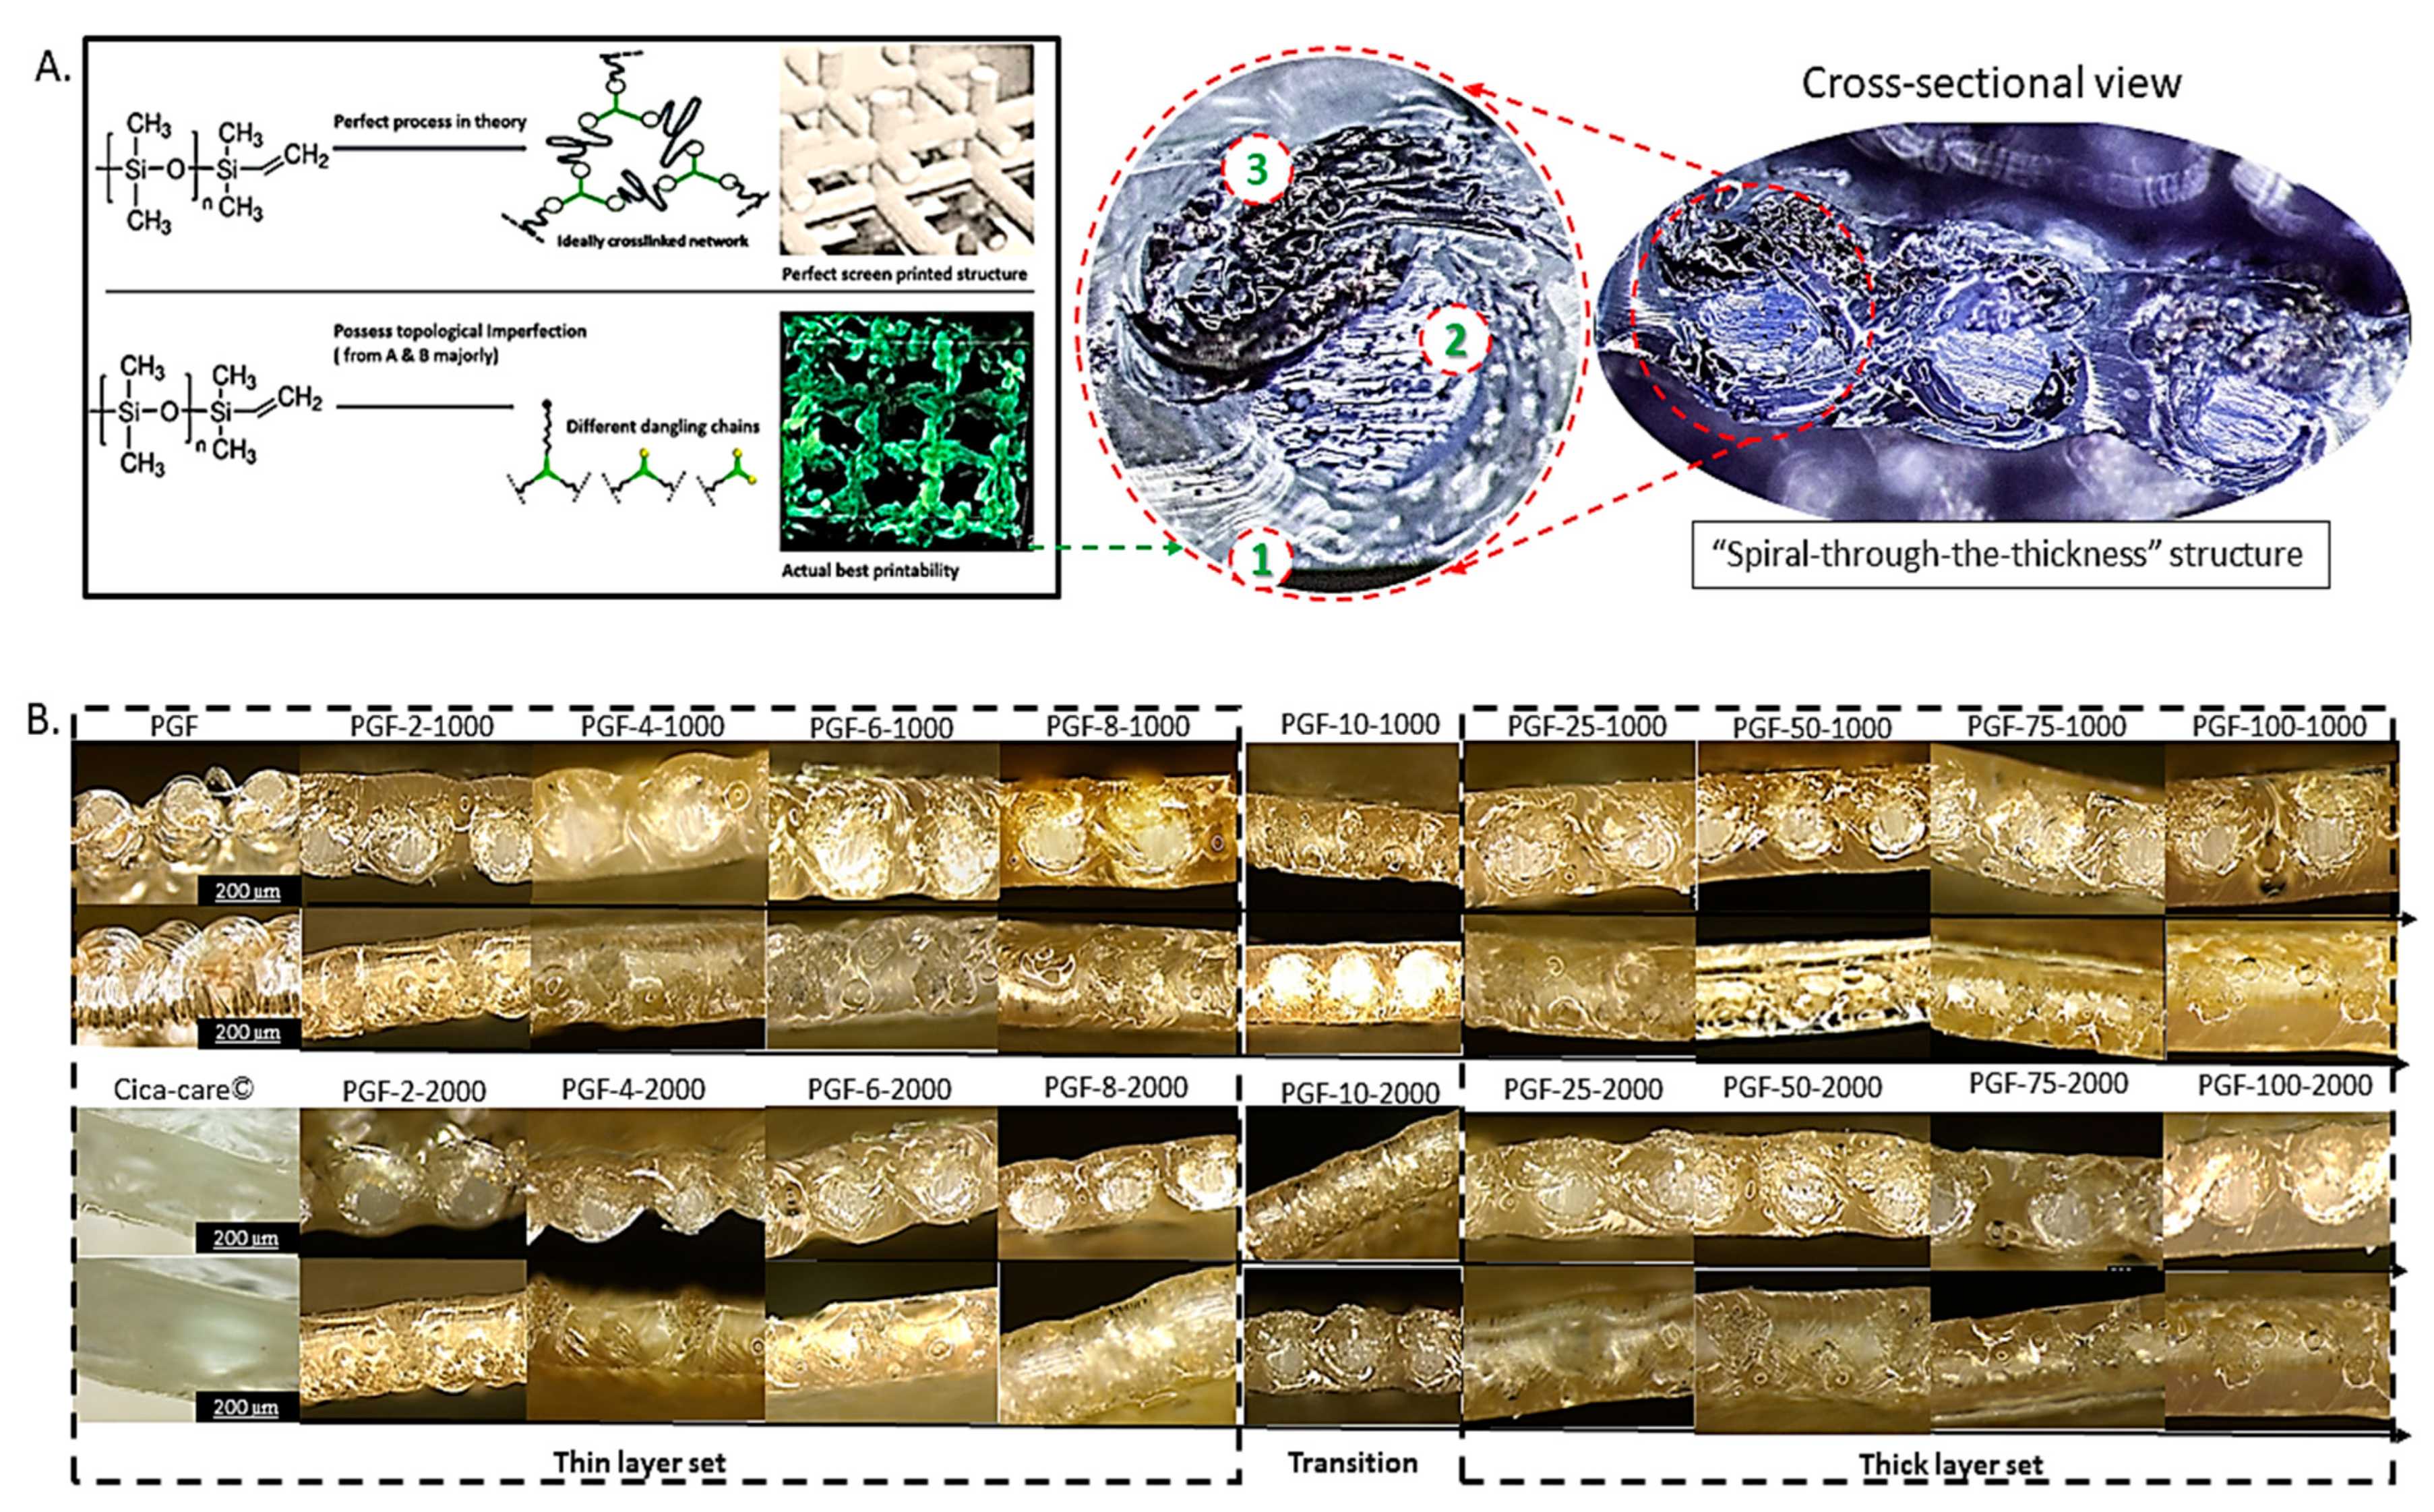
Figure 6.
MIU, MMD, and SMD displayed surface and friction properties. MIU (roughness)/MMD (variation in roughness)/SMD (geometrical roughness) of different as-prepared PGF-Biopor®AB samples in comparison to controls of PGF and Cica-care©: (A) MIUwarp, 2–8 layers; (B) MIUweft, 2–8 layers; (C) MIUwarp, 25–100 layers; (D) MIUweft, 25–100 layers; (E) MMDwarp, 2–8 layers; (F) MMDweft, 2–8 layers; (G) MMDwarp, 25–100 layers; (H) MMDweft, 25–100 layers; (I) SMDwarp, 2–8 layers; (J) SMDweft, 2–8 layers; (K) SMDwarp, 25–100 layers; (L) SMDweft, 25–100 layers. Note: Each data point was averaged from six samples, assessed at the skin contact side (rough technical back), and compared with the controls (commercial Cica-care© and PGF); for all the surface and friction tests, in KES-F module 4, 125 data points were measured, with a p-value below 0.05 being considered significant, and the MIU, MMD, and SMD were automatically generated by the Kawabata software.
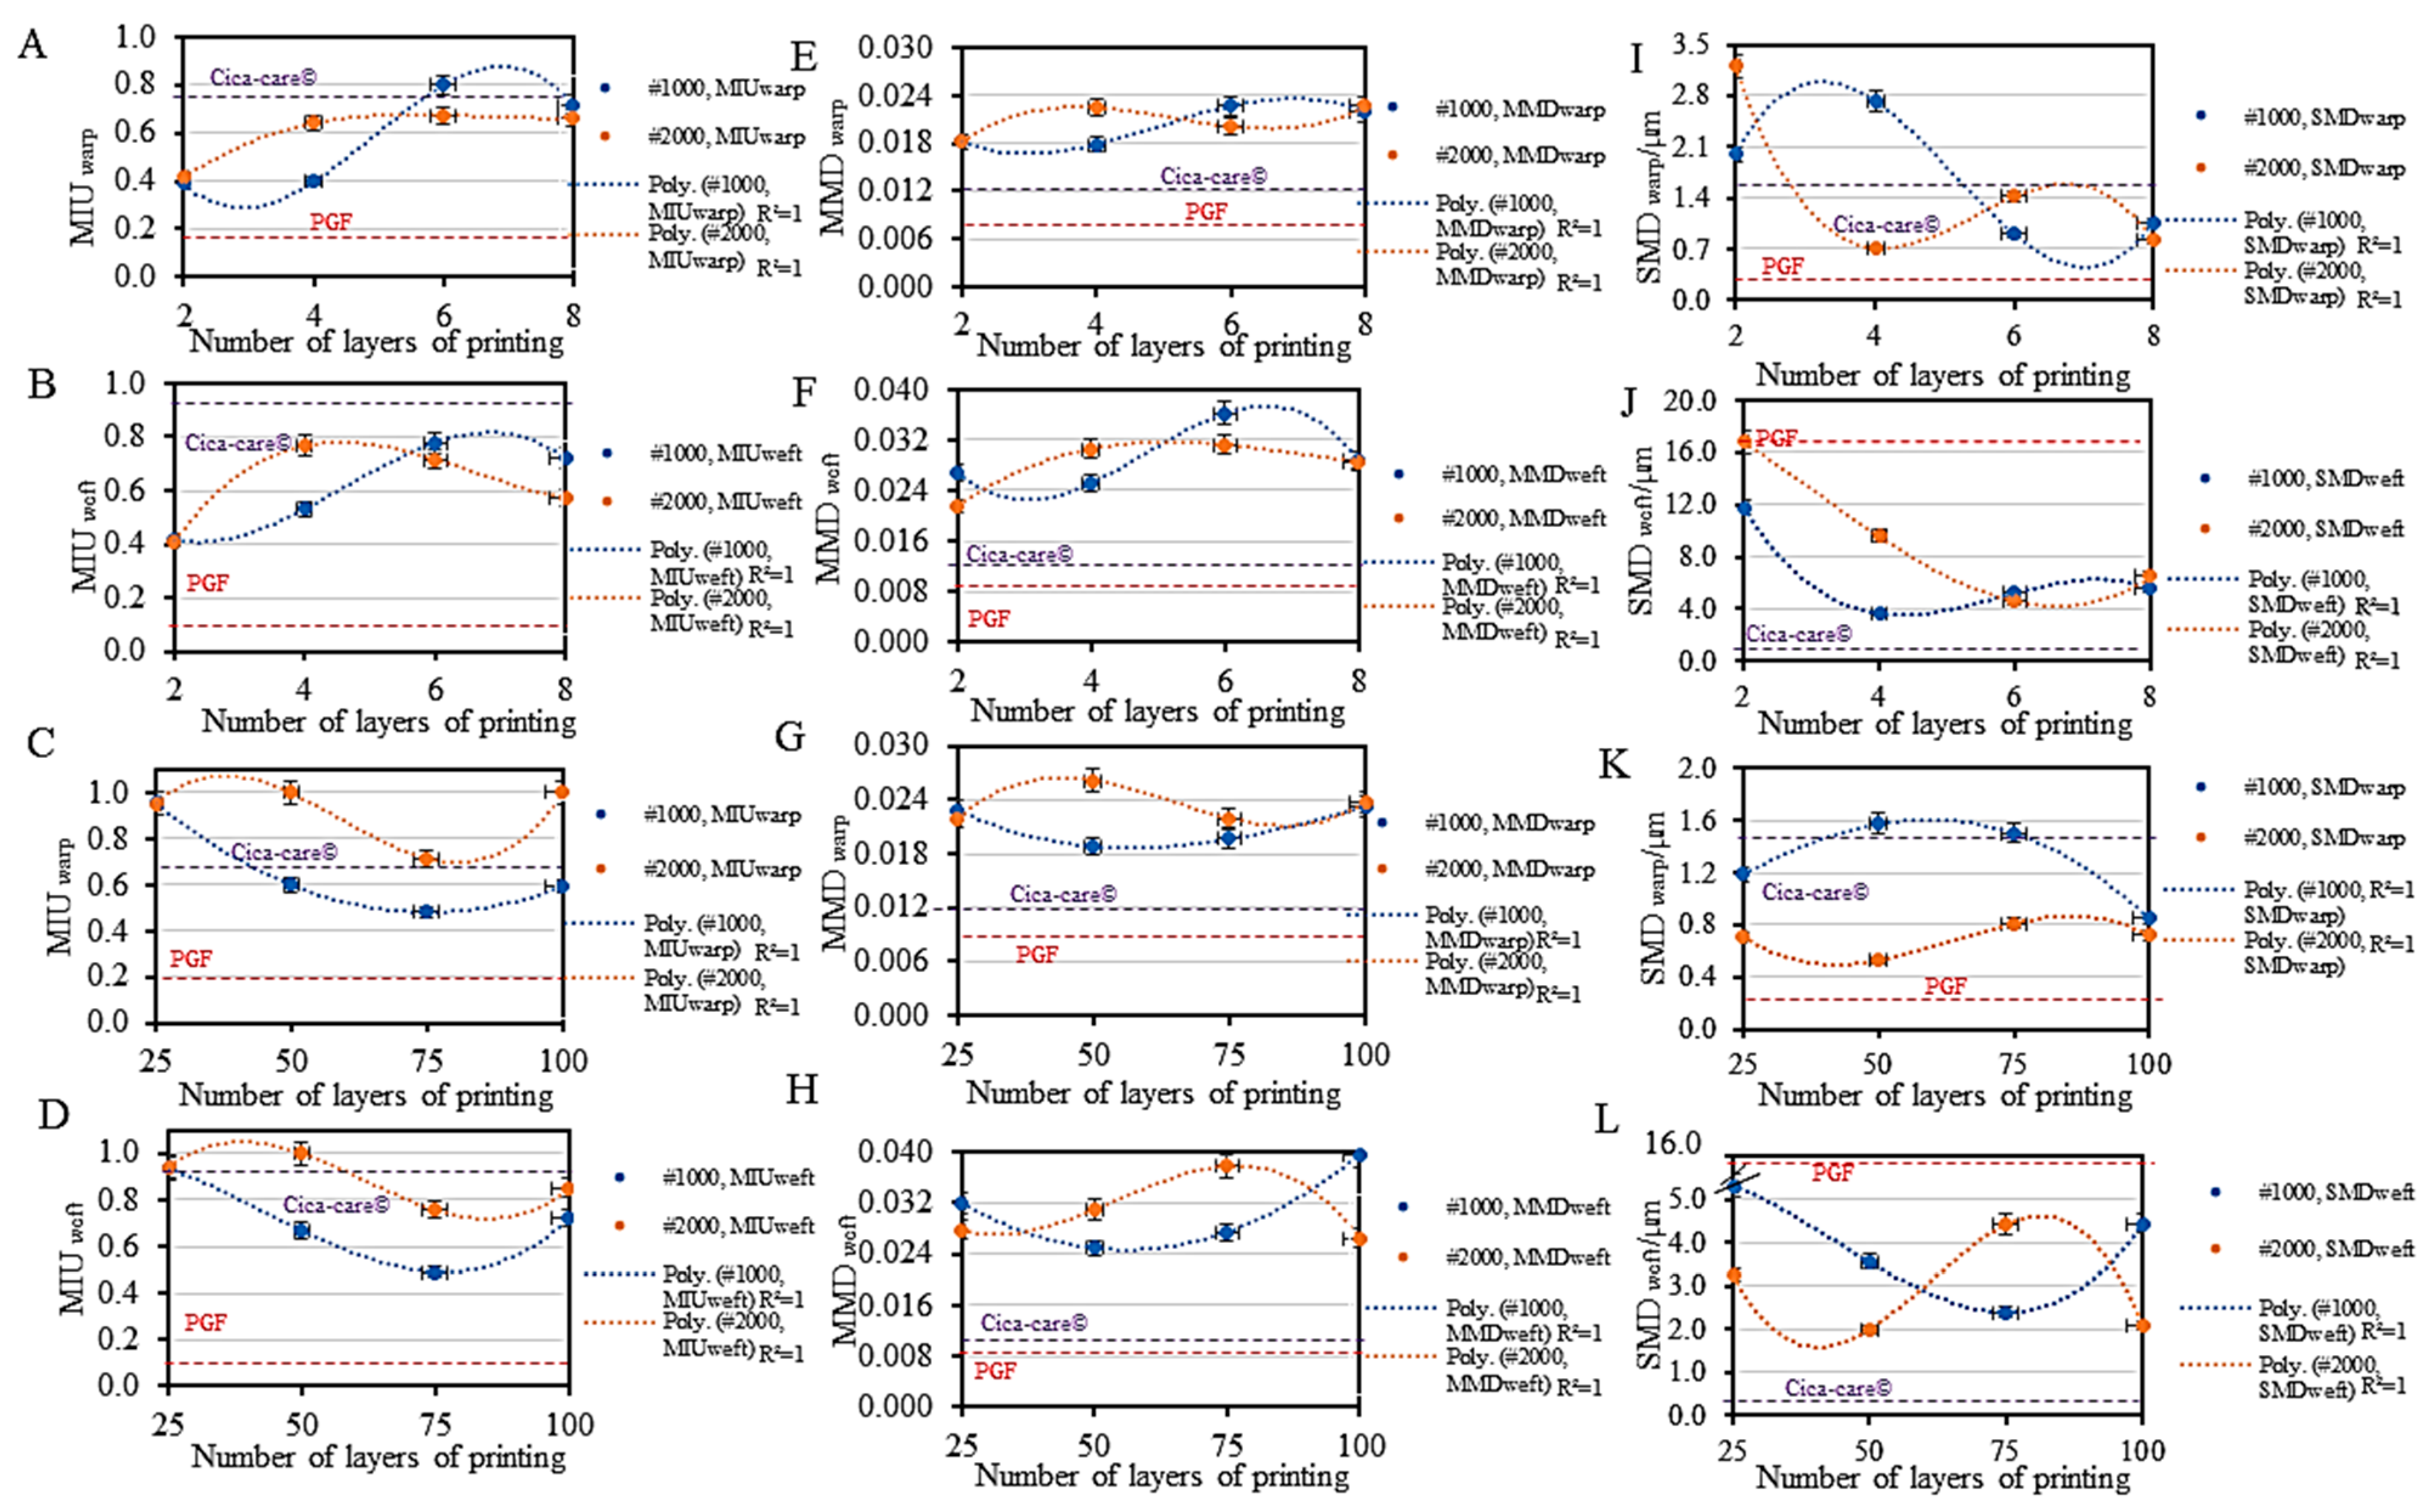
Figure 7.
Stresswarp—strainwarp curves of PGF-Biopor®AB structures for screens #1000 and #2000: (A) screen #1000 (2–100 layers); (B) screen #2000 (2–100 layers); (C) screen #1000 (2–8 layers); (D) screen #2000 (2–8 layers); (E) Cica-care; (F) Mullins effect illustrated in PGF-1000-50; x, y each denote one stretching–recovery cycle, and each sample was measured by at least 200 data points from the KES-F1 tensile–shear machine, and the mode was selected out of 6 samples with a p-value below 0.05.

Figure 8.
Stressweft—strainweft curves of PGF-Biopor®AB structures for screens #1000 and #2000: (A) screen #1000 (2–100 layers); (B) screen #2000 (2–100 layers); (C) screen #1000 (2–8 layers); (D) screen #2000 (2–8 layers); (E) Cica-care; (F) Mullins effect illustrated in PGF-1000-50; x, y each denote one stretching–recovery cycle, and for each stress–strain curve, at least 200 data points were measured from the KES-F1 tensile–shear machine; the mode was selected out of 6 samples with a p-value below 0.05.
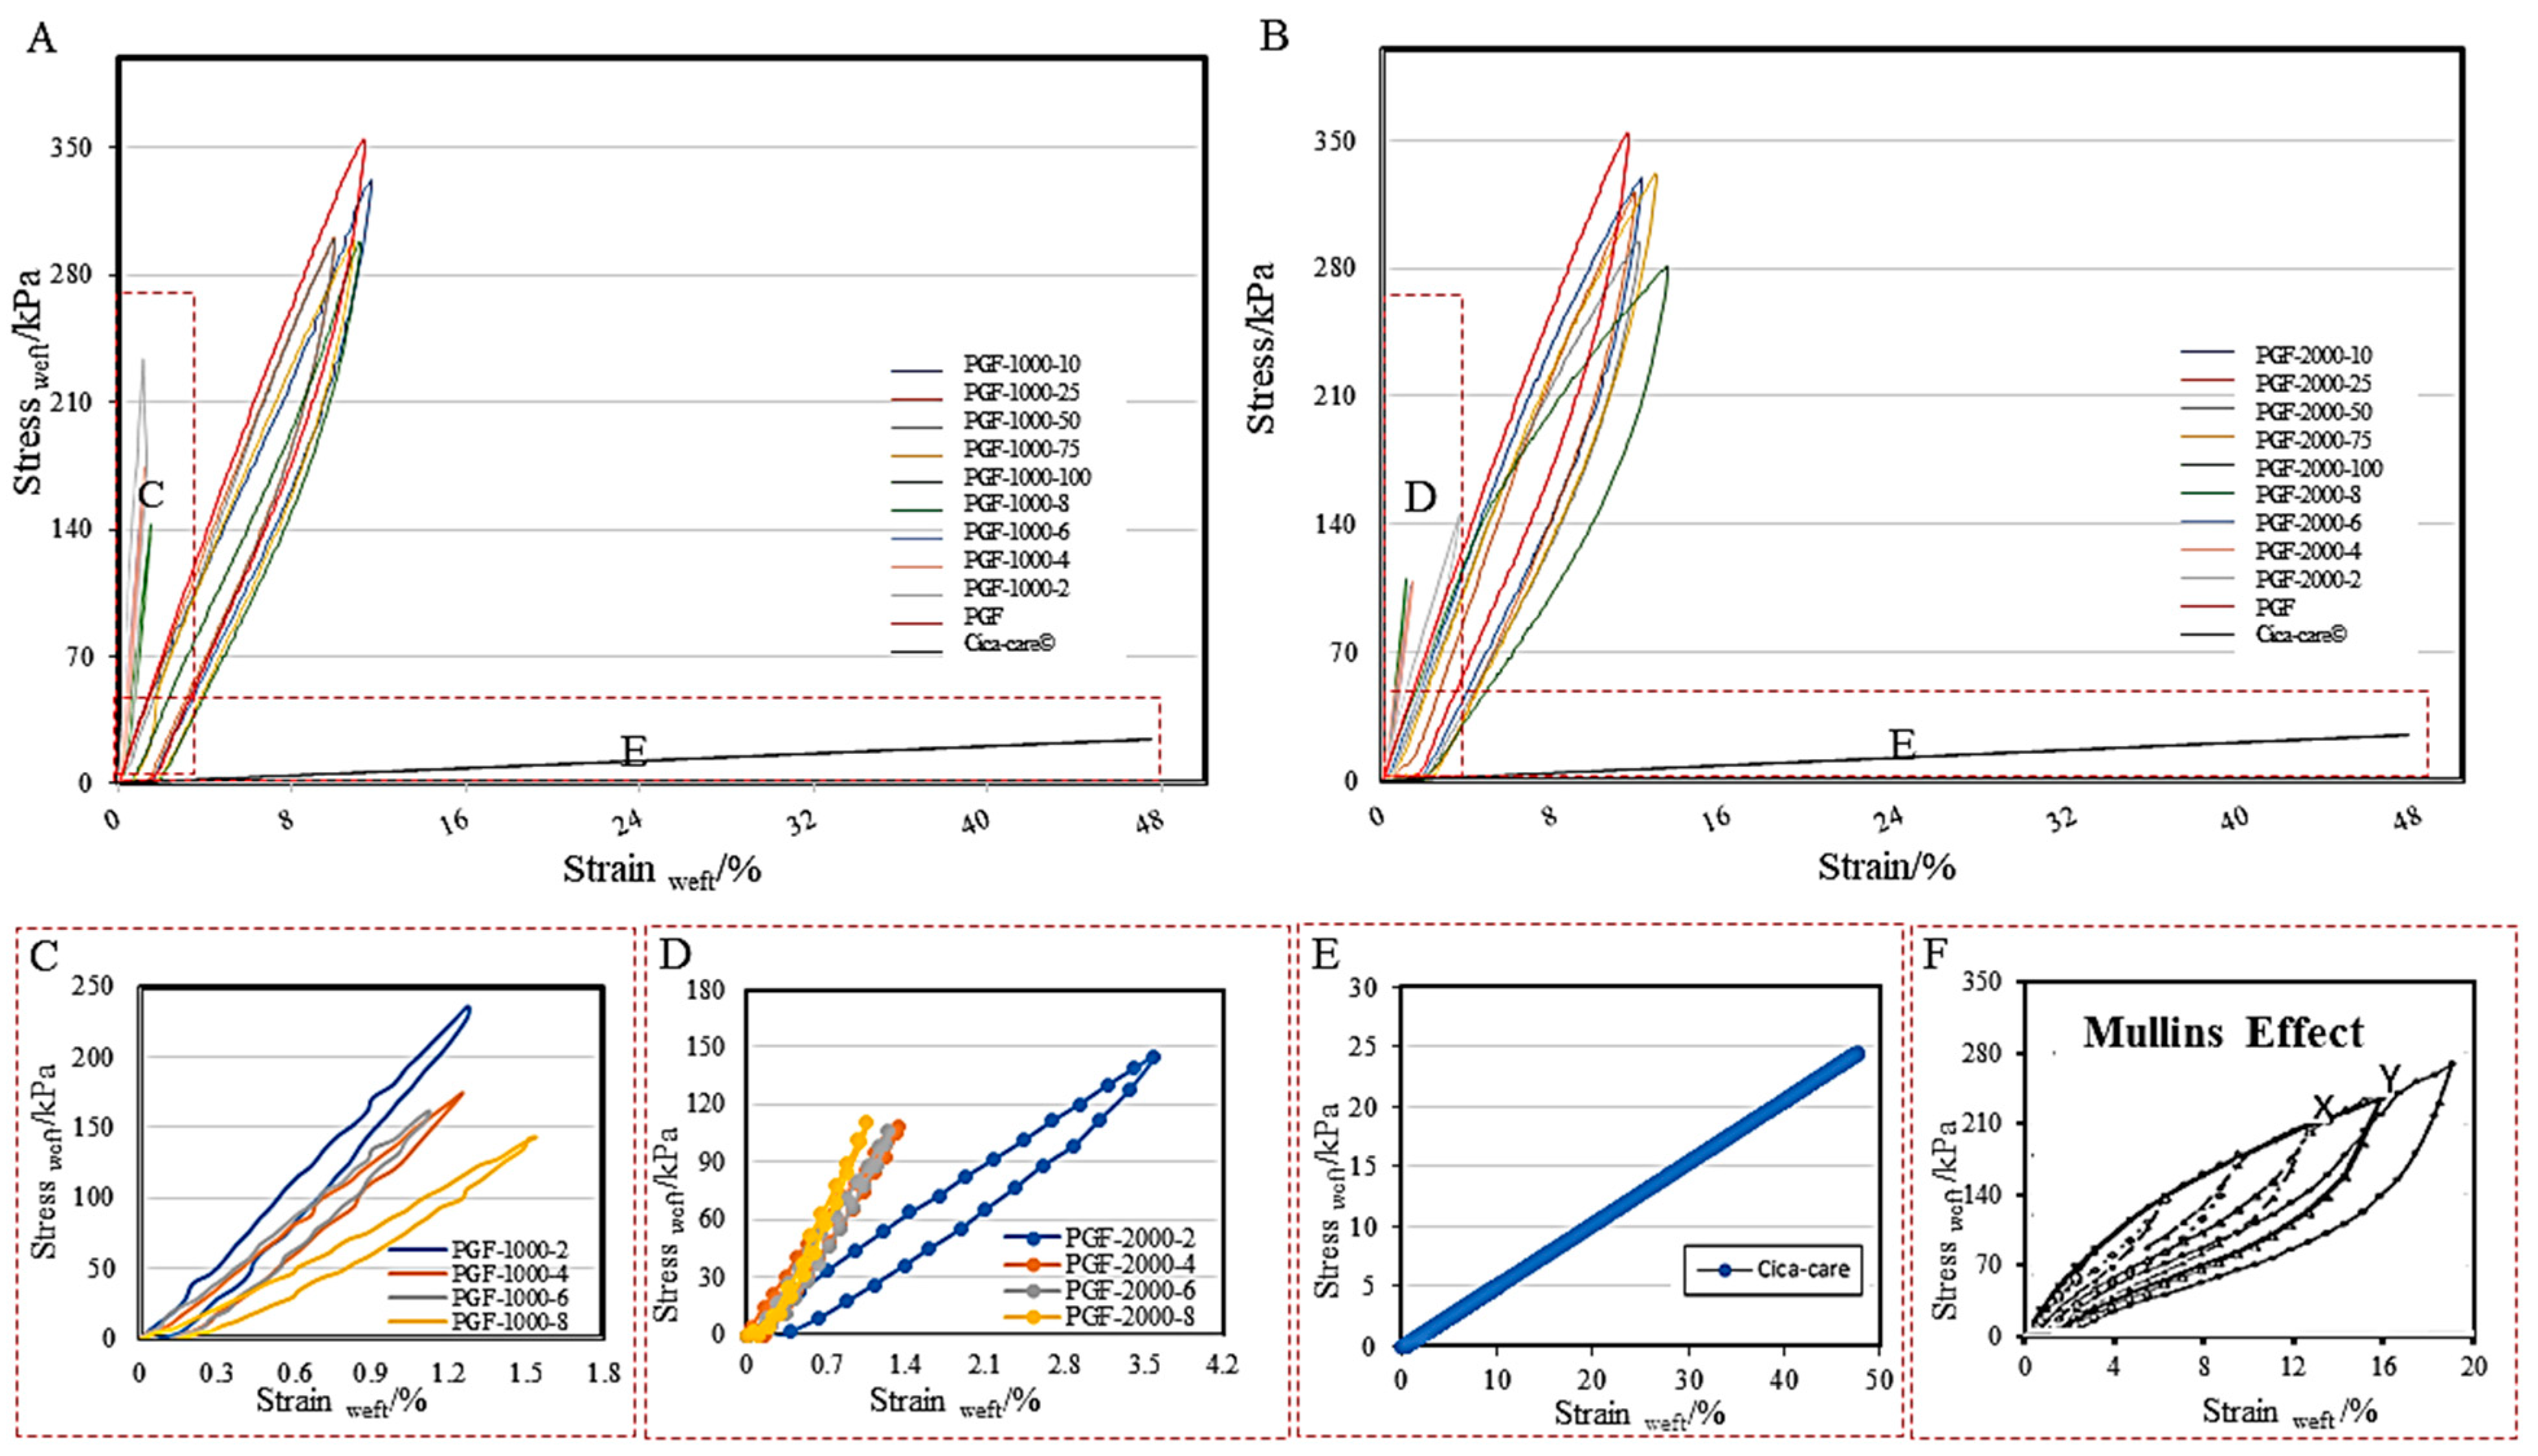
Figure 9.
Shear force–shear angle curves for different #1000 and #2000 PGF-Biopor®ABs: (A) screen #1000 warp (2–8 layers); (B) screen #1000 weft (2–8 layers); (C) screen #1000 warp (10–100 layers); (D) screen #1000 weft (10–100 layers); (E) screen #2000 warp (2–8 layers); (F) screen #2000 weft (2–8 layers); (G) screen #2000 warp (10–100 layers); (H) screen #2000 weft (10–100 layers); (I) Payne’s effect shows how ripple ends are formed at follow-up softening during repeat cycles of continuous printing, and each graph was measured by at least 200 data points from the KES-F1 tensile-shear machine, and the mode was selected out of 6 samples with a p-value below 0.05.
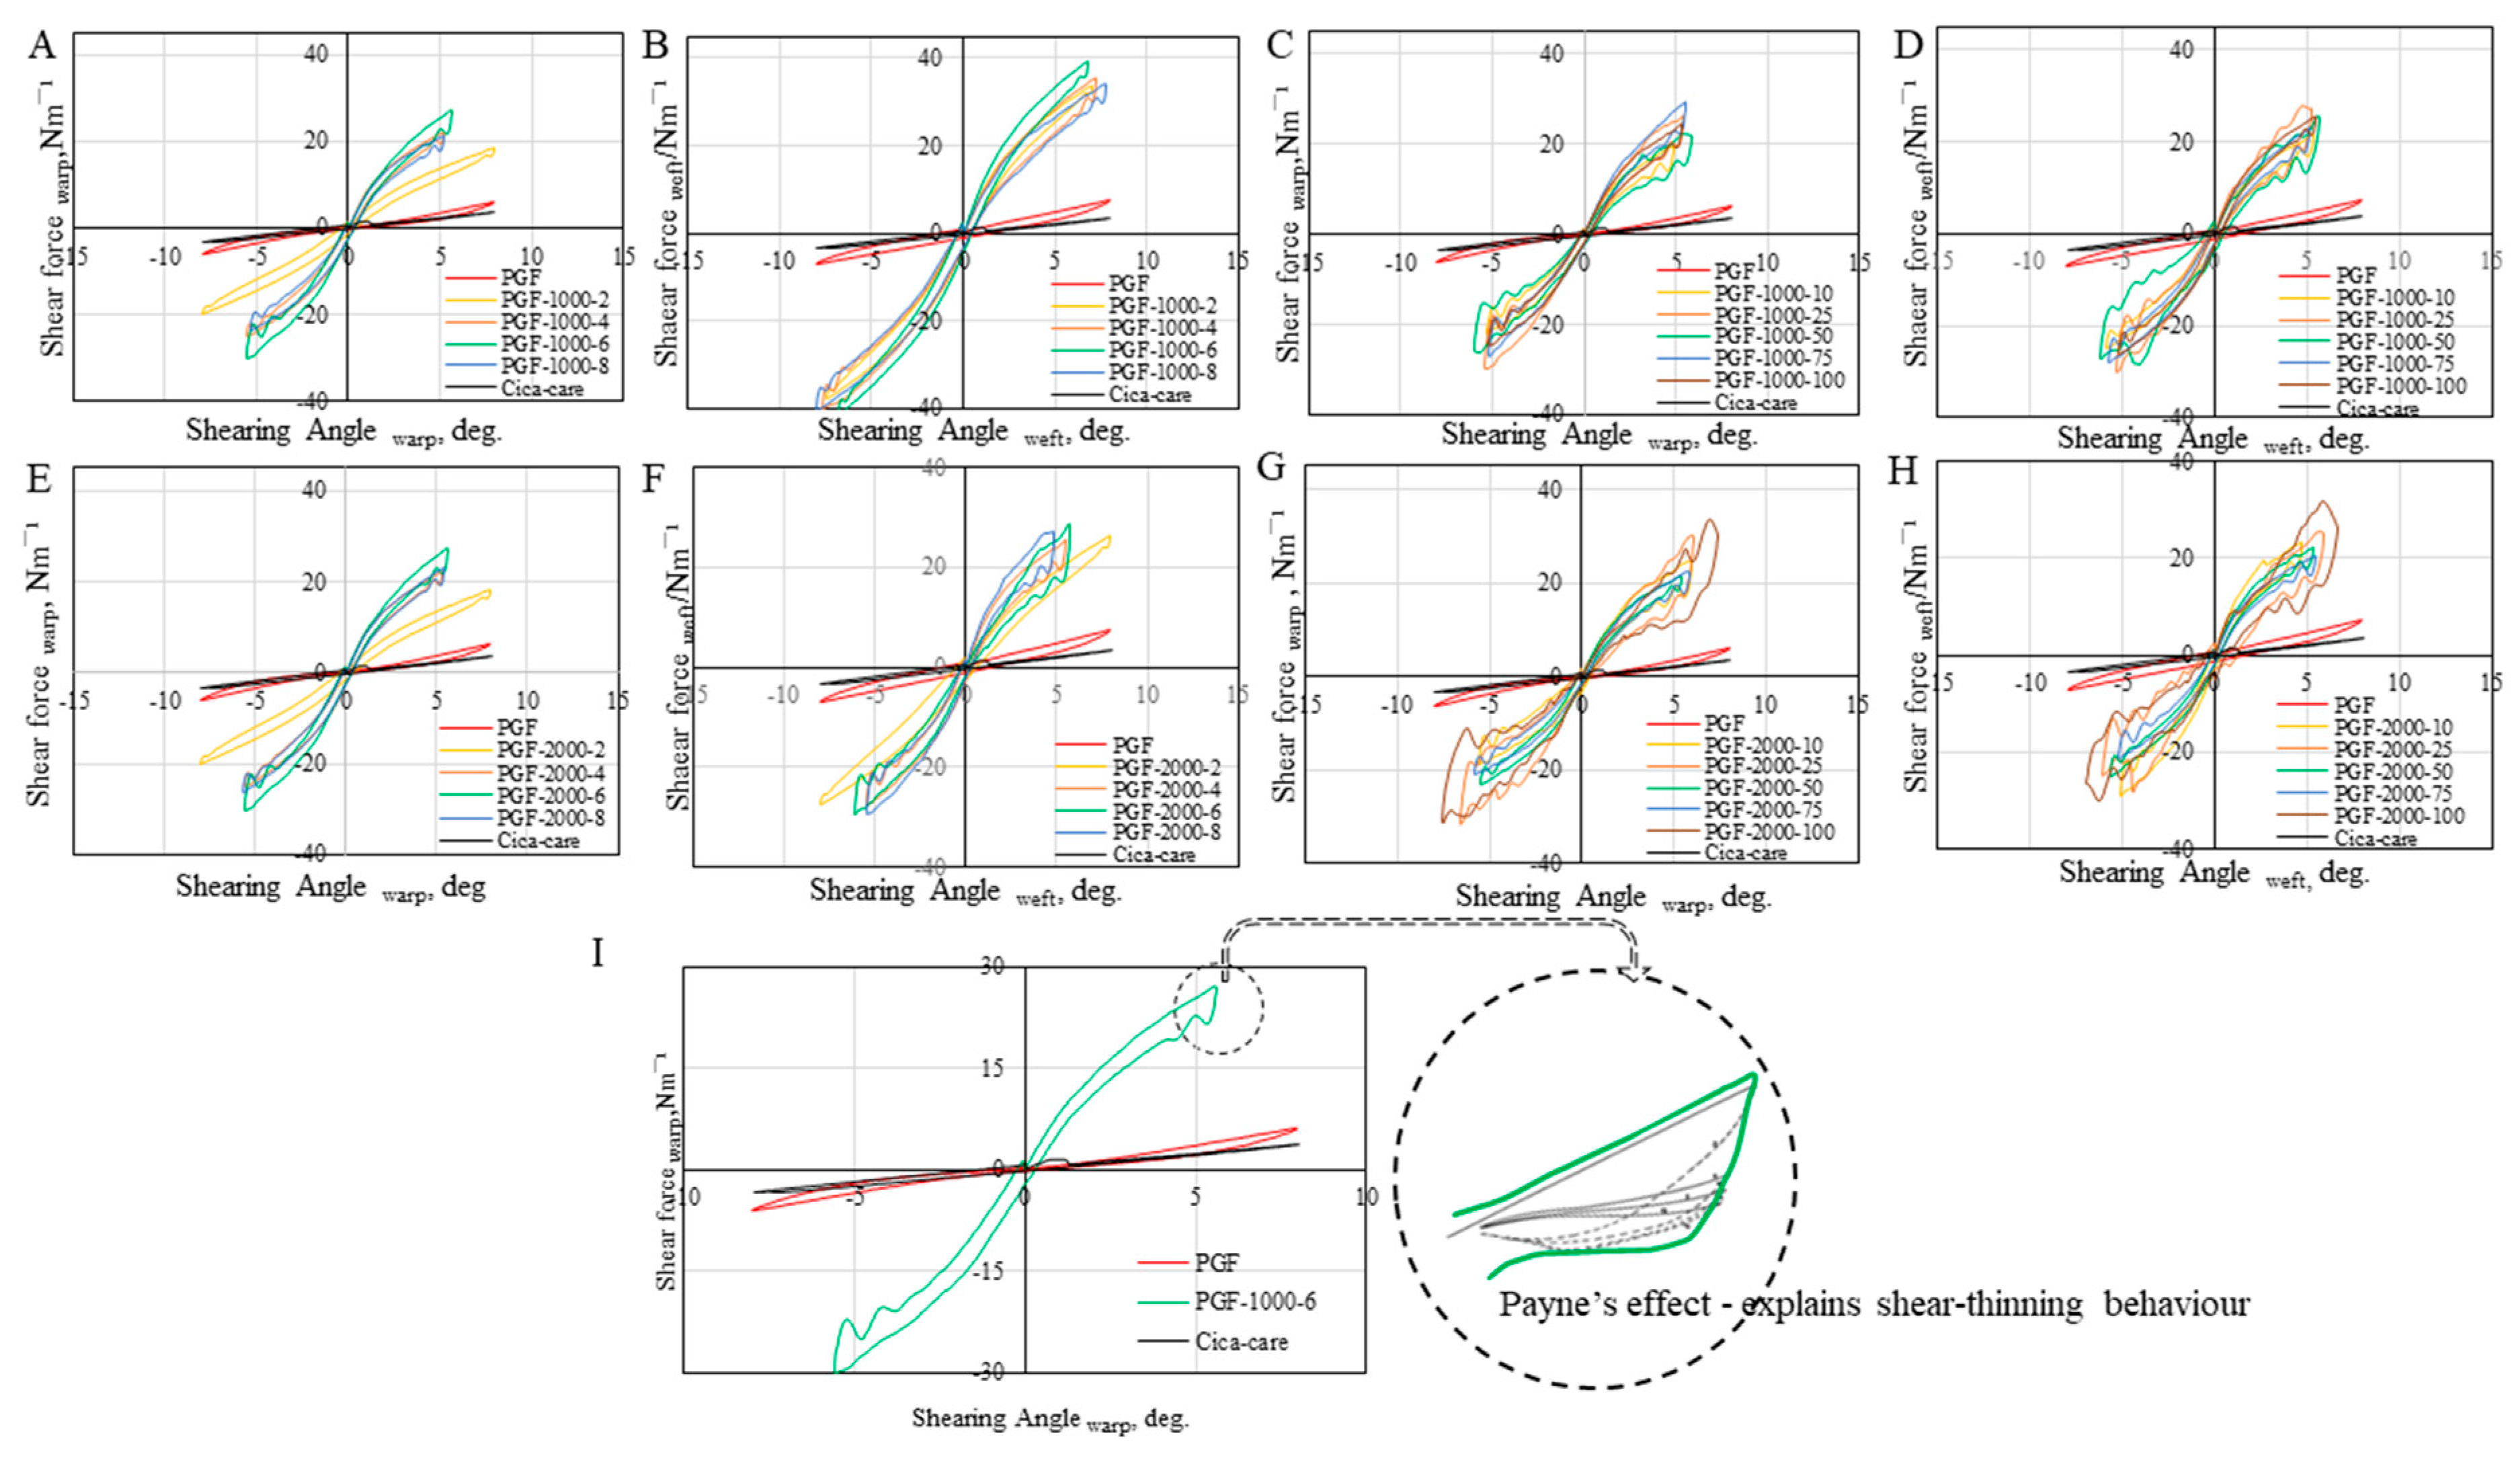
Figure 10.
Bending force–bending rate curves for different PGF-Biopor®ABs for screens #1000 and #2000: (A) screen #1000 warp, 2–8 layers; (B) screen #1000 weft, 2–8 layers; (C) screen #1000 warp, 10–100 layers; (D) screen #1000 weft, 10–100 layers; (E) screen #2000 warp, 2–8 layers; (F) screen #2000 weft, 2–8 layers; (G) screen #2000 warp, 10–100 layers; (H) screen #2000 weft, 10–100 layers. At least 200 data points were obtained from the KES-F2 bending machine; the mode was selected out of 6 samples with a p-value below 0.05.

Table 1.
Material technical data sheet for Biopor®AB [17].
Table 1.
Material technical data sheet for Biopor®AB [17].
| Catalyst Component (A) | Basic Component (B) |
|---|---|
| 58.9% by weight of vinyl-end polydimethylsiloxane 8.9 wt.% of a polydimethylsiloxane oil 12.0% by weight of a paraffin oil 21.7% by weight of a fumed silica (Surface-treated) with a BET in surface area > 50 m2/g 0.4% by weight of a platinum catalyst | 54.4% by weight of vinyl-end polydimethylsiloxane (with viscosities of 150–65 K mPas) 3.1% by weight of a polydimethylsiloxane oil 7.6% by weight of a paraffin oil 21.2 wt.% Of a fumed silica (surface-treated) with a BET in surface area > 50 m2/g 11.8% by weight of a polymethyl hydrogen siloxane having a SiH content of 2.3 mmol/g |
| The procedure of manufacture: a mixture of base component (A + B) and catalyst, each individually mixed homogeneously for 30 min. Each A and B mixture (A:B = 1:1) was then degassed in a vacuum for 15 min. | |
Note: Polydimethylsiloxane (PDMS) comprises both polar (Si-O-Si, organosilicon, asymmetric bond angles) and non-polar (CH₃, longer bond length) elements. The unique siloxane backbones endow them with flexibility, mobility, low-energy barriers, and inherent features of distinctive surface properties and structural design flexibility [18]. The curing catalyst in component A is a platinum compound, and in component B, the curing agent is an SiH-functional polysiloxanes. The additives (catalyst) in A act as adhesion promotors or rheology modifiers. The curing agents in B, SiH-functional polysiloxanes, perform immediate curing. The fillers introduce high interfacial friction at the interface of Biopor®AB, facilitating effective load transfer from the silicone matrix (Biopor®AB) to the ground fabric (PGF) for robust interfacial adhesion. PDMS and vinyl-end polydimethylsiloxane (PVMS) contribute inertness and stability in water, exhibiting a ‘cell-friendly’ nature conducive to cell proliferation [19].
Table 2.
Tensile strength by tensile stress (TSwarp stress, TSweft stress) and tensile strain (TSwarp strain, TSweft strain), and elasticity by Young’s modulus (Ewarp, Eweft) for screens #1000 and #2000.
Table 2.
Tensile strength by tensile stress (TSwarp stress, TSweft stress) and tensile strain (TSwarp strain, TSweft strain), and elasticity by Young’s modulus (Ewarp, Eweft) for screens #1000 and #2000.
| SAMPLES | TSwarp stress/KPA | TSweft stress/KPA | TSwarp strain/% | TSweft strain/% | Ewarp/ KPA | Eweft/ KPA |
|---|---|---|---|---|---|---|
| CICA-CARE® | 4.94 | 41.94 | 12.87 | 12.99 | 0.065 | 1.00 |
| PGF-1000-2 PGF-2000-2 | 233.36 111.71 | 235.68 145.08 | 1.27 2.54 | 1.27 3.59 | 184.8 42.64 | 187.24 39.99 |
| PGF-1000-4 PGF-2000-4 | 173.66 110.37 | 173.66 108.93 | 1.17 1.54 | 1.25 1.34 | 149.83 71.53 | 142.89 80.96 |
| PGF-1000-6 PGF-2000-6 | 161.27 105.28 | 161.27 106.67 | 1.71 1.44 | 1.12 1.25 | 92.22 73.55 | 145.90 87.64 |
| PGF-1000-8 PGF-2000-8 | 144.47 110.37 | 143.05 110.37 | 1.59 0.90 | 1.54 1.05 | 93.10 123.50 | 94.95 112.29 |
| PGF-1000-25 PGF-2000-25 | 263.89 320.96 | 300.87 320.96 | 25.04 30.24 | 9.94 11.65 | 9.83 9.03 | 30.44 30.32 |
| PGF-1000-50 PGF-2000-50 | 295.19 296.30 | 299.22 294.84 | 24.82 26.58 | 9.97 11.82 | 10.36 10.66 | 31.07 26.22 |
| PGF-1000-75 PGF-2000-75 | 349.80 333.75 | 299.22 332.10 | 31.73 36.47 | 10.87 12.63 | 9.75 8.38 | 29.03 27.89 |
| PGF-1000-100 PGF-2000-100 | 299.22 281.22 | 299.22 281.22 | 25.77 25.72 | 11.11 13.19 | 10.59 9.54 | 27.10 20.90 |
Note: Ewarp and Eweft were calculated from the slopes of the stress–strain curves (straight lines at the initial part of the purely elastic loading), with all 6 samples being assessed in the warp and weft directions [27], and for the construction of the stress–strain curves, at least 200 data points were obtained from the KES-F1 tensile–shear machine; the mean was selected out of 6 samples with a p-value below 0.05.
Table 3.
Tensile energy (TEwarp, TEweft), density, and energy/weight ratio (EWR).
| Samples | Density | TEwarp, TEweft | EWR | Samples | Density | TEwarp, TEweft | EWR | ||
|---|---|---|---|---|---|---|---|---|---|
| Unit | g.m−3 | 103.gf.cm−2 | g.m−3 | 103.gf.cm−2 | |||||
| PGF | 0.60 | 0.89 | 204.14 | 0.0037 | PGF | 0.60 | 0.89 | 204.14 | 0.0037 |
| Cica-care® | 4.28 | 5.23 | 1735.89 | 0.0027 | Cica-care® | 4.33 | 5.23 | 1735.89 | 0.0028 |
| PGF-1000-2 | 1.76 | 1.76 | 453.18 | 0.0039 | PGF-2000-2 | 1.64 | 5.25 | 375.63 | 0.0092 |
| PGF-1000-4 | 1.47 | 1.59 | 479.71 | 0.0032 | PGF-2000-4 | 0.77 | 0.78 | 439.64 | 0.0018 |
| PGF-1000-6 | 3.17 | 0.26 | 487.89 | 0.0035 | PGF-2000-6 | 0.66 | 0.73 | 525.68 | 0.0013 |
| PGF-1000-8 | 31.81 | 13.33 | 501.88 | 0.0450 | PGF-2000-8 | 0.42 | 0.43 | 514.45 | 0.0008 |
| PGF-1000-25 | 172.09 | 60.59 | 511.82 | 0.2270 | PGF-2000-25 | 225.97 | 98.57 | 573.88 | 0.2828 |
| PGF-1000-50 | 140.87 | 79.43 | 577.50 | 0.1907 | PGF-2000-50 | 185.05 | 76.40 | 638.93 | 0.2046 |
| PGF-1000-75 | 194.64 | 63.54 | 573.52 | 0.2251 | PGF-2000-75 | 248.43 | 85.14 | 554.22 | 0.3009 |
| PGF-1000-100 | 139.19 | 62.53 | 528.26 | 0.1909 | PGF-2000-100 | 175.81 | 70.39 | 580.60 | 0.2120 |
Note: {Energy = WT − WT’/TM = (WT/RT)/100TM} [47].
Table 4.
KES-F bending testing results of G and 2HG.
| Sample# | Gwarp | Gweft | 2HGwarp | 2HGweft | Sample# | Gwarp | Gweft | 2HGwarp | 2HGweft |
|---|---|---|---|---|---|---|---|---|---|
| Cica-care© | 0.89 | 0.85 | 3.06 | 0.82 | Cica-care© | 0.89 | 0.85 | 3.06 | 0.82 |
| PGF | 0.60 | 0.75 | 0.41 | 1.85 | PGF | 0.60 | 0.75 | 0.41 | 1.85 |
| PGF-1000-2 | 4.37 | 6.87 | 5.64 | 6.05 | PGF-2000-2 | 4.61 | 4.45 | 3.30 | 3.96 |
| PGF-1000-4 | 6.41 | 7.82 | 6.39 | 6.18 | PGF-2000-4 | 6.50 | 6.45 | 4.53 | 5.06 |
| PGF-1000-6 | 6.53 | 8.45 | 6.51 | 7.47 | PGF-2000-6 | 6.80 | 6.66 | 4.24 | 5.75 |
| PGF-1000-8 | 5.88 | 7.75 | 5.42 | 6.07 | PGF-2000-8 | 5.81 | 5.84 | 3.78 | 4.55 |
| PGF-1000-25 | 7.75 | 6.84 | 4.62 | 6.81 | PGF-2000-25 | 6.65 | 7.20 | 5.69 | 6.71 |
| PGF-1000-50 | 7.30 | 7.02 | 4.44 | 5.95 | PGF-2000-50 | 7.32 | 7.31 | 5.34 | 6.07 |
| PGF-1000-75 | 6.77 | 6.50 | 5.16 | 3.83 | PGF-2000-75 | 7.01 | 6.89 | 6.01 | 5.06 |
| PGF-1000-100 | 8.90 | 7.01 | 4.14 | 4.80 | PGF-2000-100 | 7.83 | 8.36 | 5.69 | 6.12 |
Note: 1. Each data point were averaged from six samples, testing in both warp and weft directions. 2. # represents sample numbers.
Table 5.
Variation in tensile forces and cross-sectional areas for different PGF-Biopor®ABs.
| Sample# | S cm2 | S’ cm2 | F’ kPa | T0 mm | TM mm | Sample# | S cm2 | S’ cm2 | F’ kPa | T0 mm | TM mm |
|---|---|---|---|---|---|---|---|---|---|---|---|
| Cica-care© | 2.000 | 2.476 | 1.97 | 2.491 | 2.012 | Cica-care© | 2.000 | 2.476 | 1.97 | 2.491 | 2.012 |
| PGF | 2.000 | 2.256 | 1.80 | 0.758 | 0.672 | PGF | 2.000 | 2.256 | 1.80 | 0.758 | 0.672 |
| PGF-1000-2 | 2.000 | 2.158 | 1.72 | 0.737 | 0.683 | PGF-2000-2 | 2.000 | 2.126 | 1.69 | 0.877 | 0.825 |
| PGF-1000-4 | 2.000 | 2.258 | 1.80 | 0.780 | 0.691 | PGF-2000-4 | 2.000 | 2.185 | 1.74 | 0.919 | 0.841 |
| PGF-1000-6 | 2.000 | 2.283 | 1.82 | 0.830 | 0.727 | PGF-2000-6 | 2.000 | 2.196 | 1.75 | 0.974 | 0.887 |
| PGF-1000-8 | 2.000 | 2.357 | 1.88 | 0.912 | 0.774 | PGF-2000-8 | 2.000 | 2.494 | 1.99 | 1.060 | 0.850 |
| PGF-1000-25 | 2.000 | 2.210 | 1.76 | 0.872 | 0.789 | PGF-2000-25 | 2.000 | 2.304 | 1.83 | 0.910 | 0.790 |
| PGF-1000-50 | 2.000 | 2.262 | 1.80 | 0.854 | 0.755 | PGF-2000-50 | 2.000 | 2.339 | 1.86 | 0.917 | 0.784 |
| PGF-1000-75 | 2.000 | 2.483 | 1,98 | 0.869 | 0.700 | PGF-2000-75 | 2.000 | 2.367 | 1.88 | 0.896 | 0.757 |
| PGF-1000-100 | 2.000 | 2.432 | 1.94 | 0.890 | 0.732 | PGF-2000-100 | 2.000 | 2.318 | 1.85 | 0.998 | 0.861 |
NOTE: P = 4.90 kPa. # represents sample numbers.
Disclaimer/Publisher’s Note: The statements, opinions and data contained in all publications are solely those of the individual author(s) and contributor(s) and not of MDPI and/or the editor(s). MDPI and/or the editor(s) disclaim responsibility for any injury to people or property resulting from any ideas, methods, instructions or products referred to in the content. |
© 2024 by the authors. Licensee MDPI, Basel, Switzerland. This article is an open access article distributed under the terms and conditions of the Creative Commons Attribution (CC BY) license (https://creativecommons.org/licenses/by/4.0/).
Share and Cite
MDPI and ACS Style
Lui, K.-C.; Wang, X.; Kan, C.-W. Tuning the Tensile and Shear Properties of a Scar Healing Composite for Mechanotherapy. J. Compos. Sci. 2024, 8, 22. https://doi.org/10.3390/jcs8010022
AMA Style
Lui K-C, Wang X, Kan C-W. Tuning the Tensile and Shear Properties of a Scar Healing Composite for Mechanotherapy. Journal of Composites Science. 2024; 8(1):22. https://doi.org/10.3390/jcs8010022
Chicago/Turabian StyleLui, Kam-Che, Xungai Wang, and Chi-Wai Kan. 2024. "Tuning the Tensile and Shear Properties of a Scar Healing Composite for Mechanotherapy" Journal of Composites Science 8, no. 1: 22. https://doi.org/10.3390/jcs8010022