
Automatic Extraction of Medication Information from Cylindrically Distorted Pill Bottle Labels


Computer Science Program, Division of Science and Engineering, Penn State Abington, Abington, PA 19001, USA
*
Author to whom correspondence should be addressed.
Mach. Learn. Knowl. Extr. 2022, 4(4), 852-864; https://doi.org/10.3390/make4040043
Submission received: 4 August 2022
/
Revised: 19 September 2022
/
Accepted: 20 September 2022
/
Published: 27 September 2022
(This article belongs to the Special Issue Language Processing and Knowledge Extraction)
Abstract
:Patient compliance with prescribed medication regimens is critical for maintaining health and managing disease and illness. To encourage patient compliance, multiple aids, like automatic pill dispensers, pill organizers, and various reminder applications, have been developed to help people adhere to their medication regimens. However, when utilizing these aids, the user or patient must manually enter their medication information and schedule. This process is time-consuming and often prone to error. For example, elderly patients may have difficulty reading medication information on the bottle due to decreased eyesight, leading them to enter medication information incorrectly. This study explored methods for extracting pertinent information from cylindrically distorted prescription drug labels using Machine Learning and Computer Vision techniques. This study found that Deep Convolutional Neural Networks (DCNN) performed better than other techniques in identifying label key points under different lighting conditions and various backgrounds. This method achieved a percentage of Correct Key points PCK @ 0.03 of 97%. These key points were then used to correct the cylindrical distortion. Next, the multiple dewarped label images were stitched together and processed by an Optical Character Recognition (OCR) engine. Pertinent information, such as patient name, drug name, drug strength, and directions of use, were extracted from the recognized text using Natural Language Processing (NLP) techniques. The system created in this study can be used to improve patient health and compliance by creating an accurate medication schedule.
1. Introduction
One of the crucial components of treating a disease is patient compliance with medication regimens; poor adherence or non-adherence can worsen illnesses and possibly lead to death. Medication non-compliance may include aspects such as not filling a prescription, taking an incorrect dose of medication, taking it at the wrong times, changing the frequency of doses, and taking more than prescribed [1,2]. Medication adherence problems may occur when the medication regimen is complex or when patients have difficulties reading and understanding instructions [2]. Various tools can be used to improve medication adherence, such as behavioral interventions, educational interventions, integrated care interventions, self-management interventions, packaging, and daily reminders; in one study, medication reminder systems showed a 65% improvement in adherence [3]. Moreover, the introduction of medication dispensing systems improves the adherence of older adults within the first week or month [4].
Various automatic pill dispensers and mobile applications on today’s market ensure the prescribed medications are taken on time. Some automatic pill dispensers can even recognize faces to guarantee medication was dispensed to or consumed by the correct patient. However, to utilize these aids, the user’s medication information and schedule must be entered manually. Entering this information could be time-consuming and prone to errors since the average national number of prescriptions per capita in the US in 2013 was 12.2 [5]. In addition, this process can be difficult for the elderly and people with decreased eyesight since they would have problems reading the information from medication labels.
Prescription medication labels contain essential information such as patient name, drug name, drug strength, and directions of use. The labels can also be found on the prescriber name, a number of refills, date filled, expiration date, cautions, and description of pills. This information can be used to construct a unique medication schedule for each patient. We implemented a system that automatically extracted and processed information from the prescription drug labels.
There are some challenges associated with this objective. First, each pharmacy utilizes a different label format for their medication bottles leading to pertinent information being located inconsistently. This information is spread across the label, requiring the user to take multiple images or a video to capture all of it. Since multiple frames are required, we need to stitch them together, and the first step is to correct cylindrical distortion. This distortion occurs because rectangular labels are wrapped around cylindrical containers.
Additionally, medication directions are provided by physicians and are in free-form text; therefore, there is no universal pattern that would fit all cases. The National Drug Code (NDC), a unique product identifier used in the US for human drugs, is not provided on the prescription drug labels. Therefore, we need to find a way to identify the drug and extract other relevant information.
This paper proposes an automated extraction of pertinent information from real-life medication container images. This study is motivated by the observed need for such a system, especially for elderly people. To the best of the authors’ knowledge, there is no research that solves the problem at hand in a simple way that requires no additional hardware. The proposed approach requires only a simple camera and can be deployed on mobile devices.
We explored methods for automatic information extraction from cylindrically distorted labels using Machine Learning and Computer Vision techniques. A diagram of the study approach can be found in Figure 1. We investigated traditional Computer Vision algorithms as well as Deep Convolutional Neural Networks (DCNN) to localize and unwarp the label. DCNNs showed a better performance and were found to be more resistant to lighting conditions and background changes. The processed label images were then stitched together to obtain the whole label. Different image preprocessing methods were explored to identify the best way for successful text extraction using Optical Character Recognition (OCR). Information such as patient name, drug name, drug strength, and directions of use were extracted from the recognized text using Natural Language Processing (NLP) techniques.
2. Related Works
Several studies focus on information extraction from drug and other product labels [6,7,8,9,10,11]. One of the studies proposed a system that can identify unapproved and potentially dangerous medications based on the label using a deep learning approach [6]. X. Liu et al. used a Connectionist Text Proposal Network (CTPN) to extract sub-images based on the text followed by OCR; then, the text was vectorized using universal sentence embedding for finding cosine similarity to reference images. Another study extracted metadata from retail product label images [7]. This study used various Computer Vision and NLP techniques to assess the quality of the image and extract the brand and product name, nutrition facts, and net weight extraction. In addition, another study implemented a system with drug label detection functionality for the elderly [8]. Tangtisanon utilized a Connected Component Analysis (CCA) algorithm with two key steps of blob filtering and line construction to extract text from the label. Importantly, these methods analyzed complete flat labels, which are rarely used in prescription medications. In this study, we focus on the labels wrapped around cylindrical containers since they are often used for prescriptions.
There are several proposed approaches to processing cylindrical labels using Computer Vision. One possible approach is to use multiple cameras to capture all parts of the label [9]. This method is fast and produces reliable results in product inspection in industrial settings. However, this would be difficult to implement in a home setting since it requires a setup of costly cameras. Another approach is to use a single camera and rotate the object around its axis [10]. In this study, motion-based background subtraction was used to detect the labels on complex backgrounds: the user holds the object still and then lightly shakes it for several seconds. When the label portions were detected, they were unwrapped and stitched together. A text localization algorithm followed by OCR was then used to extract text and transform it into audio.
All the methods above utilized complex cylindrical distortion models. Alternatively, Zankevich [11] approached the problem differently: the distortion model was approximated with just six key points defining the label. This is a simple model that requires accurate localization of points. The article suggests using Hough transform or Neural Networks to localize the points [11].
NLP plays a vital role in understanding medical text data. It allows for analyzing and extracting meaningful data from unstructured raw text. There are various problems in healthcare that scientist attempt to solve using NLP algorithms. One prominent example in this area is analyzing and extracting data from the clinical notes entered by doctors in free form. One recent study utilized the Bigram Language Model for annotating clinical notes to distinguish new information from redundant and improve the performance of medical personnel [12]. Another example of applying NLP in healthcare is extracting adverse drug reactions and interactions from medical texts. One effective approach for this problem is to use a Recurrent Neural Network, i.e., Bidirectional Long Short-Term Memory (BiLSTM) and Conditional Random Fields (CRF) [13,14]. The most powerful NLP models are often based on Transformer architecture published by Google in 2017 [15]. One variation of Transformer, Bidirectional Encoder Representations from Transformers (BERT), is effectively used for Entity Recognition of Chinese electronic medical records [16]. Word2vec [17] and Terms Frequency-Inverse Document Frequency (TF-IDF) have also shown potential for extracting pertinent information from unstructured medical texts, e.g., identifying different symptoms [18].
3. Methods
This section discusses in detail the following steps taken in extracting information from the pill bottles. Section 3.1 addresses label dewarping, Section 3.2 discusses image stitching, Section 3.3 text extraction, and Section 3.4 discusses NLP and information extraction.
3.1. Label Dewarping
3.1.1. Cylindrical Warp Model
In the current study, we focus on extracting information from the prescription medication labels placed on pill containers. These containers usually have a cylindrical shape, and the rectangular labels are wrapped around them. Therefore, magnification reaches its maximum at the center of the label and minimum at its vertical edges. The model resembles barrel distortion but with different warping along the vertical axis. In our case, the upper and lower edges of the label are ellipses formed by circles viewed from an angle (Figure 2). The half-ellipses and vertical edges of the label defined our warp model.
We sampled an equal number of points on both ellipses with a fixed angle step. The equidistant points were placed on lines connecting points with the same angle on both ellipses. These points defined our warp mesh (Figure 3). Perspective rendering is used to transform quadrangles define by each point and its three neighbors into fixed rectangles. The resulting rectangles were concatenated to output the dewarped image. Since the quadrangles located close to vertical edges are narrow, the result of perspective rendering is blurry. Therefore, we cropped 15% from the left and right sides of the final images. The percentage was chosen empirically to reliably eliminate artifacts.
Our model makes the following assumption about the ellipses: the major axis connects the vertical edges. This assumption allowed us to define each ellipse with just three points: two of them were on the conjunction of the major axis and vertical edges, and the last one was the outermost point of the minor axis. Since there are two ellipses, six key points were required. Therefore, the task was reduced to finding the coordinates of six key points. Zankevich [11] first introduced this six-point model in his article on label dewarping. Section 3.1.2 to Section 3.1.5 of this paper focus on key point localization.
We also consider a ten-point model, where each ellipse is described by five points instead of three: additional two points lie between the first and the last two points of the six-point model (Figure 3). The intent is to obtain higher precision by introducing more points. We used the total least squares method to approximate the ellipse by five points [19]. Occasionally, when the points lie on the same line, this method fails; in such cases, we rolled back and used spline approximation, which is less accurate but yields acceptable results.
3.1.2. Hough Transform Based Key Point Detection
We first attempted to use traditional Computer Vision techniques to detect key points. The first method is based on Canny edge detection [20], followed by Hough transformations [21,22]. The first Hough transform was used to detect vertical edges of labels, and the second one to detect two ellipses (horizontal edges). We implemented the Hough transform for ellipses based on Xie and Ji [22], but with additional constraints (according to Section 3.1.1), which allowed us to reduce computation time and simplify the selection of ellipses of interest.
This method consists of the following steps:
- Apply Gaussian blur followed by Canny edge detector;
- Apply Hough transform to find lines. Select the vertical edges by finding the most voted parallel lines close to being vertical and having sufficient distance between them;
- Rotate the image so that detected edges are vertical;
- Apply Hough transform for ellipses between vertical edges. Select the ellipses of interest by maximizing the distance and average intensity between lower and upper ellipses;
- Extract the key points from the found ellipses.
The pipeline for this method is represented in Figure 4.
3.1.3. Morphological and Contour Based Key Point Detection
The second method of detecting key points using traditional Computer Vision techniques consisted of finding the contours of the labels.
This method has the following steps:
Perform steps 1–3 from Section 3.1.2;
Apply Gaussian blur followed by adaptive thresholding;
Apply a series of erosion and dilation morphological operations to highlight the label;
Find all closed contours and choose the one with the largest area;
Traverse the contour and find the key points.
The pipeline for this method is represented in Figure 4.
3.1.4. Dataset Collection
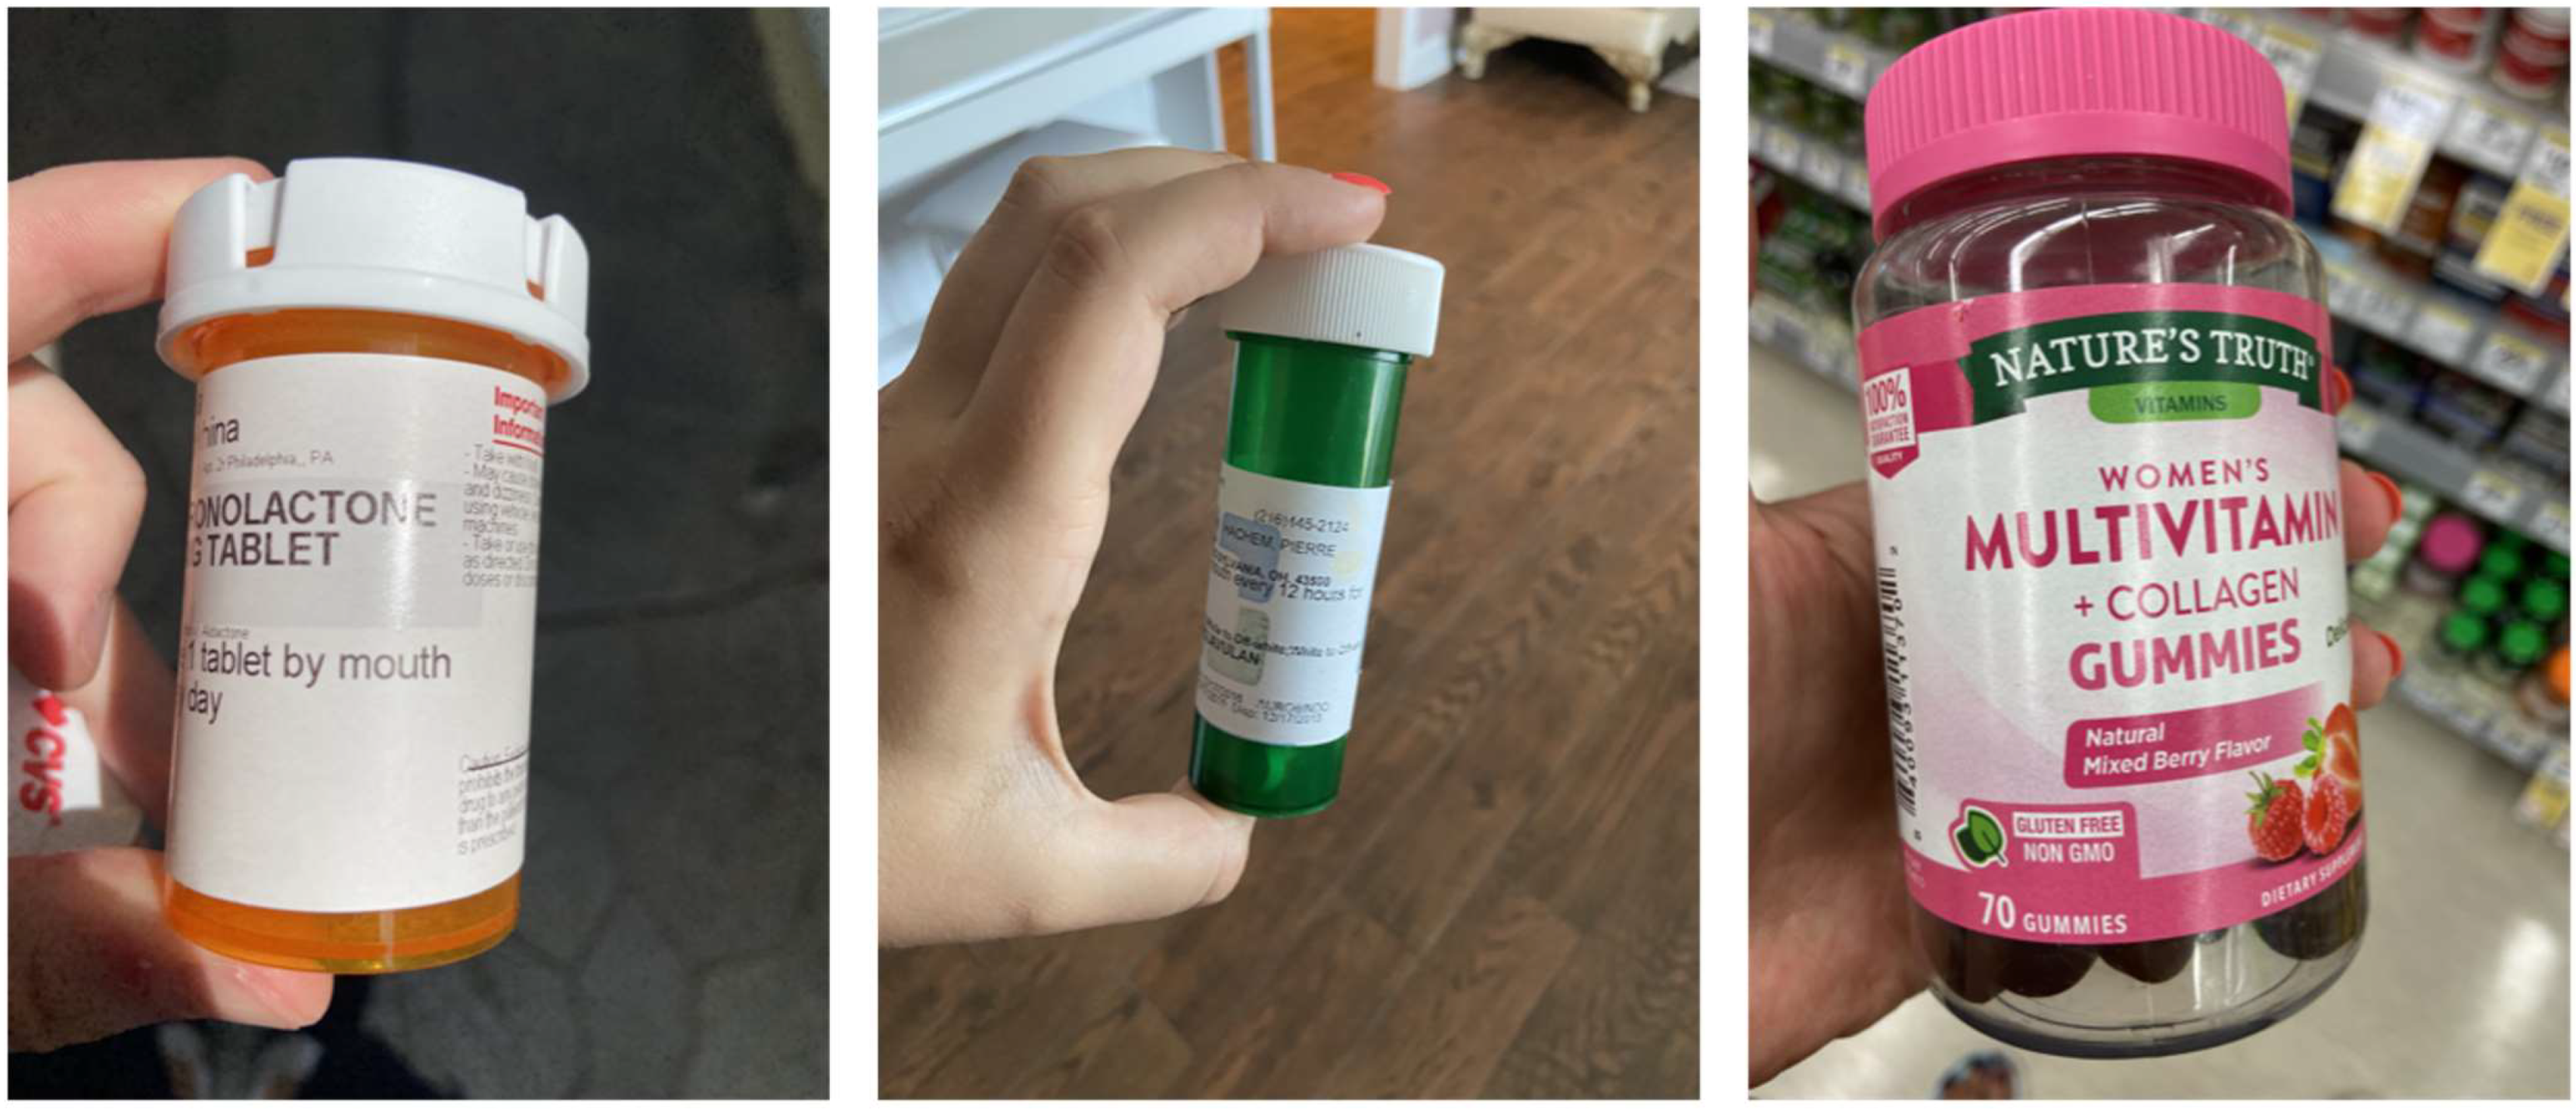
We trained a machine learning model to detect the key points. The first step in machine learning is to obtain a well-crafted dataset. Since prescription medication labels contain sensitive information, there was no publicly available dataset; therefore, we compiled it manually. We photographed the prescription medication containers, over-the-counter drugs, and supplements available in local pharmacies. The photos have different aspect ratios, scales, backgrounds, lighting conditions, and tilt to make the model more robust. To simplify the annotation process of the obtained photographs, we created a simple program that allows us to mark the points directly on images, view the dewarping result, and interactively adjust the points to get the best outcome. In total, our dataset contained 300 annotated images (210 images of prescription pill bottles and 90 over-the-counter medication bottles). Some samples are shown in Figure 5.
After the dataset for the six-point model was collected, we programmatically extended it to suit the ten-point model. The obtained datasets were then split into train, test, and validation sets in proportion 80-10-10.
Deep convolutional neural networks require many images to yield good performance [23]. The number of collected images was not sufficient and could cause overfitting. Thus, we extensively applied data augmentation to extend the dataset and make the model more resistant to various conditions. The following random operations were used: horizontal flip, independent x and y scaling, rotation, change of contrast and color. These operations were performed on-the-fly during the training process to reduce storage requirements and create unique randomized samples on each epoch, which makes the dataset almost infinite. In other words, we applied the above-mentioned random transformations for each image before feeding it into the model during training. The model receives unique non-repeating images in each epoch. During the validation and testing phases, we used unmodified original images.
3.1.5. DCNN Regression Using Transfer Learning
We explored several CNN architectures. The first model that we implement is direct regression using transfer learning. In this case, we use a pre-trained classification model, i.e., EfficientNet [24]. We replaced the fully connected layers with several convolutional layers, where the last layer had six kernels with the size of 1. This method is sufficient to detect the key points of the labels similar to those present in the training set; however, it fails to generalize and is resistant to changes in scale and position. For instance, the model performs significantly worse when the labels are far from the center of the image or scaled out. This is likely because the model gradually reduced the image dimensions using max-pooling and increased the number of channels, effectively “encoding” the input image. This encoding causes partial loss of feature spatial information. This characteristic is especially important for classification tasks where location-invariant features were needed, but it negatively impacted the performance in the regression tasks.
Due to the reasons mentioned above, instead of predicting specific coordinates, we decided to use heatmaps of the key points as an output of the model (Figure 6). A heatmap is a probability distribution of the location of the point; this concept is widely and successfully used in state-of-the-art human pose estimation models [25,26,27,28,29]. We expected this model to work well in our setup since we also needed to localize points. To implement it, we transformed the labels in the dataset into heatmaps, which consisted of Gaussian functions centered on the key points with a standard deviation of 1 to 4 pixels depending on the model. We train models with various architectures to compare the performance for our context. All explored architectures followed the same principle: first, the input image is encoded (convolved) into a low-dimensional structure with many channels and then decoded (deconvolved) into higher-dimensional output representing heatmaps. The encoders, EfficientNetB0, EfficientNetB1 [24], and MobileNetV2 [30], are widely used architectures for classification tasks.
The first model we used was SimpleBaseline, which is presented in “Simple Baseline for Human Pose Estimation and Tracking” [25]. It is one of the simplest ways to generate heatmaps. The model appended a few deconvolutional layers that used transpose convolution operation to the base model. We explored several options—adding three and four deconvolutional layers to EfficientNetB0 outputting 56 × 56 and 112 × 112 heatmaps and adding three deconvolutional layers to EfficientNetB1 outputting 128 × 128 heatmaps. The second model we explore is a more sophisticated U-Net [31]. Like SimpleBaseline, it uses deconvolutional layers but also introduces skip connections between encoder and decoder layers. In our variant of U-Net, the encoder was MobileNetV2, and the output dimensions match the input. We explored two options: 112 × 112 and 224 × 224 image sizes.
After obtaining the heatmaps, we needed to convert them to key point coordinates. We calculated a weighted average of x, y coordinates of n pixels with the largest intensity in the heatmap; n ranged from 20 to 40 depending on the model and have been chosen to minimize mean squared error (MSE).
To compare the models, we introduced the Percentage of Correct Keypoints (PCK) as a metric similar to Newell et al. [26]. It was calculated as the percentage of correctly predicted key points whose distance to the actual location is within a certain fraction of the label diagonal. The fraction is specified after the @ sign as follows: [email protected].
3.2. Image Stitching
Multiple dewarped images were stitched together to create a complete label. There are various approaches for image stitching, and one of the most effective algorithms was introduced by Brown and Lowe [32]. OpenCV library’s implementation of the image stitching algorithm is based on this algorithm. This algorithm can stitch multiple images together while ignoring unrelated ones. Moreover, the input images do not have to have a specific order. Due to these reasons, we have decided to use the standard OpenCV stitcher in the proposed system.
Another important aspect is capturing and selecting frames from a video. Capturing frames too often may result in significant computation time, while having too few frames may cause the algorithm to fail. In this work, we used a simple approach to capture frames every 0.5 s, which is a good trade-off. It often yielded satisfactory results, but occasionally, some images were blurred, thus affecting the quality of the result or causing the algorithm to fail. The blurred images can potentially be detected and filtered using Discrete Fourier Transform (DFT)-based methods [33]. However, this step was not implemented in our system due to time constraints.
3.3. Text Extraction
After the images were stitched together, the next step was to extract the text from the obtained label. This study explores and compares two methods of text extraction: (1) using Optical Character Recognition (OCR) directly and (2) using Document Alignment followed by OCR. In both cases, we utilize the Tesseract version 4 OCR engine [34], which uses deep learning, i.e., Long Short-Term Memory (LSTM).
For method 1, OCR, although it is possible to apply OCR directly to an image, the best results are achieved if an image is preprocessed. Therefore, we first transformed the image to grayscale and removed the noise using the Gaussian Blurring function to preprocess the image. In addition, Tesseract documentation recommends using thresholding to binarize the image. In our case, we used Adaptive Mean thresholding to compensate for different lighting conditions; the threshold value is a mean of the given neighborhood defined by kernel size. After the image was preprocessed, we applied OCR, which outputted the recognized words assigned to different text blocks. However, due to the structure of some labels, these blocks were randomly organized and can contain unrelated data, which can affect further information extraction.
For method 2, document alignment followed by OCR, the initial step included template preparation. We scanned a flat label. Then, we removed all prescription data on the label using an image editing tool. The result is shown in Figure 7. The next step was to use a document alignment and registration algorithm to align the stitched label with the template [35]. This algorithm used Scale-Invariant Feature Transform (SIFT) to detect the features, followed by the RANSAC (random sample consensus) algorithm to match the detected features of two images and determine their correspondence. After that, the homography matrix was constructed and used to align the images using perspective rendering. When the two images—label (Figure 8) and template—are aligned (Figure 9), we could crop the image’s predefined areas since we knew where the information of our interest was located. Afterward, we utilized the same image preprocessing steps as in Method 1 and applied OCR to extract the text. Using this method, we could extract the exact information we needed. However, a significant disadvantage to this method is that it does not work for the labels for which we do not have a template in our collection.
3.4. NLP and Information Extraction
The directions of use placed on the prescription drug labels contain crucial information for constructing a schedule. Thus, from an instruction such as “take one tablet by mouth every day for 14 days,” it can be inferred that one tablet of the medication should be taken once a day, seven days a week, for 14 days. These directions typically have common patterns and regular expressions that can be used to extract necessary information; however, there are too many variations, and it requires a very complex regular expression to accommodate all of them. Moreover, directions come to the pharmacy directly from physicians and are in free text format. Therefore, we conclude regular expressions cannot be reliable enough for this context.
In this paper, we used Machine Learning techniques to overcome this problem. We collected and annotated a dataset of directions obtained from the available medication labels and from the article on patient directions in electronic prescriptions [36]. The collected dataset of 120 samples was then manually annotated; the tags included quantity, # times a day, # times a week, and duration.
Any text classification problem requires data preprocessing. We use the transformation of the text into lowercase, removing punctuation and stop words and lemmatization. We also replaced all stand-alone numbers from 1 to 9 with terms. The Natural Language Tool Kit (NLTK) [37] library was used for removing stop words and lemmatization. The preprocessed dataset was then split into training and testing sets that correspondingly included 70% and 30% of the data. We used a Term Frequency Inverse Document Frequency (TF-IDF) vectorizer to transform the text into a machine-readable format. The TF-IDF vectorizer is a standard algorithm in NLP to encode textual data into integers or floating-point numbers representing how often each word appears in a text. We used the TF-IDF vectorizer from Scikit learn library [38].
The next step was to train the models. The Naïve Bayes and Support Vector Machine (SVM) are the two most used models for text classification problems. We use these classifiers for each category we need to predict, i.e., eight models are trained. Even though it took more time to train the SVM model due to its computational complexity (the model aims to maximize the margin around a hyperplane separating classes), it showed better results in classifying each category we needed.
The next step was to extract the drug name and its strength from the label. In this case, the standard pattern was used. The drug name is followed by its strength and units, e.g., Levothyroxine 100 MCG (micrograms). In this case, a simple regular expression can be used. As mentioned above, since the drug name is the only identification of the medication on a label, we had to ensure it was extracted correctly. We queried the OpenFDA [39] database and assumed that the drug name was correctly extracted if there was a match.
4. Results
We utilized two traditional Computer Vision approaches for detecting the key points of labels based on Hough transform and contour detection. These two methods are not robust to lighting conditions, backgrounds, and label orientation changes. Their performance varies from image to image, and the fine-tuning of various parameters is required for some images. The method utilizing Hough transforms works only when the label is in front of the camera, and there is no tilt in multiple directions. In this case, the ellipses are not skewed, and the model could successfully detect them. The contour-based method solves this issue but is unreliable under different lighting and background conditions. Furthermore, this method is susceptible to glares inherent to plastic pill containers.
After these two methods failed, we switched to DCNNs. We trained models with several architectures and different hyperparameters. We used the Percentage of Correct Key-points (PCK) as a metric to compare the performance of the final models on the test set. Since the PCK value depends on the chosen threshold, we provided PCK vs. threshold curves for the explored models (Figure 10). Most heatmap-based models converge to 98–99% accuracy at a threshold of 4%. However, U-Net with 224 × 224 input and output sizes shows the best results at lower normalized distance values. This model is also preferable since it has fewer parameters resulting in lower inference time. The Direct Regression model has the worst performance indicating that heatmap models have better generalization for unseen data. The ten-point localization model has the same accuracy as the six-point model; however, the ellipse approximation task is more complex and less stable: it fails or yields inaccurate results in some scenarios, which affects the stitching unit.
In this study, we explored two classification models, i.e., SVM and the Naïve Bayes model, to parse the directions of use from pill bottles. The SVM model showed at least 81% accuracy in all four categories of interest. The SVM performed better than the Naïve Bayes model on the test set for each type (Table 1). One possible explanation is that the Naïve Bayes model assumes independence between features while the SVM searches for interactions between them.
The proposed system can reliably identify labels; however, it has some limitations. First of all, if the label is located far from the camera, the localization model accuracy may suffer, resulting in insufficient dewarping and stitching outcomes. In addition, the label’s resolution can affect OCR performance. Secondly, the parser of directions of use does not have a medical-grade accuracy. It is because the model does not consider the order of words; the accuracy can be improved by using sequential models such as Recurrent Neural Networks (RCNN) [40].
5. Conclusions
This paper proposed a promising application capable of extracting pertinent information from prescription drug labels. A DCNN is designed and trained to identify the key points of pill labels. The model has an accuracy of 97% within a 3% error margin. Based on the detected key points, images are dewarped, stitched together, and aligned with a template. Finally, crucial information is extracted, including directions of use via SVM, with an accuracy ranging between 81% and 90% for each category of relevant information.
The system proposed in this research is a propitious step toward the successful automatic information extraction from cylindrical prescription labels. The developed application will help the elderly and people with visual disabilities. A mobile app can be developed to implement the proposed methods in future work.
Author Contributions
Conceptualization, K.G. and V.E.; methodology, K.G. and V.E.; software, K.G.; validation, K.G. and V.E.; formal analysis, K.G. and V.E.; resources, K.G. and V.E.; data curation, K.G. and V.E.; writing—original draft preparation, K.G.; writing—review and editing, K.G. and V.E.; visualization, K.G. and V.E.; supervision, V.E.; project administration, V.E. All authors have read and agreed to the published version of the manuscript.
Funding
This research received no external funding.
Institutional Review Board Statement
Not applicable.
Informed Consent Statement
Not applicable.
Data Availability Statement
Not applicable.
Acknowledgments
This research was conducted at Penn State Abington and sponsored by the Multi-Campus Research Experience for Undergraduates (MCREU) program, Pennsylvania State University (PSU).
Conflicts of Interest
The authors declare no conflict of interest.
References
- Jin, J.; Sklar, G.E.; Min Sen Oh, V.; Chuen, L.S. Factors affecting therapeutic compliance: A review from the patient’s perspective. Ther. Clin. Risk Manag. 2018, 4, 269–286. [Google Scholar] [CrossRef]
- Jimmy, B.; Jose, J. Patient medication adherence: Measures in daily practice. Oman Med. J. 2011, 26, 155–159. [Google Scholar] [CrossRef] [PubMed]
- Costa, E.; Giardini, A.; Savin, M.; Menditto, E.; Lehane, E.; Laosa, O.; Pecorelli, S.; Monaco, A.; Marengoni, A. Interventional tools to improve medication adherence: Review of literature. Patient Prefer. Adherence 2015, 9, 1303–1314. [Google Scholar] [CrossRef] [PubMed]
- Arain, M.; Ahmad, A.; Chiu, V.; Kembel, L. Medication adherence support of an in-home electronic medication dispensing system for individuals living with chronic conditions: A pilot randomized controlled trial. BMC Geriatr. 2021, 21, 56. [Google Scholar] [CrossRef] [PubMed]
- Prescription Per Capita in the United States by Age Group. Statista Research Department. 2013. Available online: https://www.statista.com/statistics/315476/prescriptions-in-us-per-capita-by-age-group/ (accessed on 1 August 2021).
- Liu, X.; Meehan, J.; Tong, W.; Wu, L.; Xu, X.; Xu, J. DLI-IT: A deep learning approach to drug label identification through image and text embedding. BMC Med. Inform. Decis. Mak. 2021, 20, 68. [Google Scholar] [CrossRef]
- Gundimeda, V.; Murali, R.S.; Joseph, R.; Babu, N.N. An automated computer vision system for extraction of retail food product metadata. In First International Conference on Artificial Intelligence and Cognitive Computing, 1st ed.; Springer Nature: Singapore, 2019; pp. 199–216. [Google Scholar] [CrossRef]
- Tangtisanon, P. Healthcare system for elders with automatic drug label detection. In Proceedings of the 16th International Conference on Control, Automation and Systems (ICCAS), Gyeongju, Korea, 16–19 October 2016; pp. 666–670. [Google Scholar] [CrossRef]
- Xu, J.; Chen, C.; Xie, H.; Lu, F. Cylindrical product label image stitching method. In Proceedings of the 2017 2nd IEEE International Conference on Computational Intelligence and Applications (ICCIA), Beijing, China, 8–11 September 2017; pp. 331–335. [Google Scholar] [CrossRef]
- Ye, Z.; Yi, C.; Tian, Y. Reading labels of cylinder objects for blind persons. In Proceedings of the 2013 IEEE International Conference on Multimedia and Expo (ICME), San Jose, CA, USA, 15–19 July 2013; pp. 1–6. [Google Scholar] [CrossRef]
- Zankevich, A. How to Unwrap Wine Labels Programmatically, Medium. Available online: https://medium.com/hackernoon/how-to-unwrap-wine-labels-programmatically-31c8c62b30ce (accessed on 15 June 2021).
- Su, Y.-H.; Chao, C.-P.; Hung, L.-C.; Sung, S.-F.; Lee, P.-J. A Natural Language Processing Approach to Automated Highlighting of New Information in Clinical Notes. Appl. Sci. 2020, 10, 2824. [Google Scholar] [CrossRef] [Green Version]
- Christopoulou, F.; Tran, T.T.; Sahu, S.K.; Miwa, M.; Ananiadou, S. Adverse drug events and medication relation extraction in electronic health records with ensemble deep learning methods. J. Am. Med. Inform. Assoc. 2020, 27, 39–46. [Google Scholar] [CrossRef] [PubMed]
- Wei, Q.; Ji, Z.; Li, Z.; Du, J.; Wang, J.; Xu, J.; Xiang, Y.; Tiryaki, F.; Wu, S.; Zhang, Y.; et al. A study of deep learning approaches for medication and adverse drug event extraction from clinical text. J. Am. Med. Inform. Assoc. 2020, 27, 13–21. [Google Scholar] [CrossRef] [PubMed]
- Vaswani, A.; Shazeer, N.; Parmar, N.; Uszkoreit, J.; Jones, L.; Gomez, A.N.; Polosukhin, I. Attention is all you need. Adv. Neural Inf. Process. Syst. 2017, 30, 15. [Google Scholar] [CrossRef]
- Qin, Q.; Zhao, S.; Liu, C. A BERT0-BiGRU-CRF Model for Entity Recognition of Chinese Electonic Medical Records. Artif. Intell. Smart Syst. Simul. 2021, 2021, 6631837. [Google Scholar] [CrossRef]
- Mikolov, T.; Chen, K.; Corrado, G.; Dean, J. Efficient Estimation of Word Representations in Vector Space. arXiv 2013, arXiv:1301.3781. [Google Scholar] [CrossRef]
- Zhu, W.; Zhang, W.; Li, G.-W.; He, C.; Zhang, L. A Study of Damp-Heat Syndrome Classification Using Word2vec and TF-IDF. In Proceedings of the IEEE International Conference on Bioinformatics and Biomedicine (BIBM), Shenzhen, China, 15–18 December 2016; pp. 1415–1420. [Google Scholar] [CrossRef]
- Halir, R.; Flusser, J. Numerically stable direct least squares fitting of ellipses. In Proceedings of the 6th International Conference in Central Europe on Computer Graphics and Visualization, Plzen-Bory, Czech Republic, 9–13 February 1998; Volume 98, pp. 125–132. [Google Scholar]
- Canny, J. A Computational Approach to Edge Detection. IEEE Trans. Pattern Anal. Mach. Intell. 1986, 8, 679–698. [Google Scholar] [CrossRef] [PubMed]
- Duda, R.O.; Hart, P.E. Use of the Hough transformation to detect lines and curves in pictures. Commun. ACM 1972, 15, 11–15. [Google Scholar] [CrossRef]
- Xie, Y.; Ji, Q. A new efficient ellipse detection method. In Proceedings of the 2002 International Conference on Pattern Recognition, Quebec City, QC, Canada, 11–15 August 2002; Volume 2, pp. 957–960. [Google Scholar] [CrossRef]
- Shorten, C.; Khoshgoftaar, T.M. A survey on image data augmentation for deep learning. J. Big Data 2019, 6, 60. [Google Scholar] [CrossRef]
- Tan, M.; Le, Q. Efficientnet: Rethinking model scaling for convolutional neural networks. In Proceedings of the 36th International Conference on Machine Learning, Long Beach, CA, USA, 9–15 June 2019; pp. 6105–6114. [Google Scholar] [CrossRef]
- Xiao, B.; Wu, H.; Wei, Y. Simple baselines for human pose estimation and tracking. In Proceedings of the European Conference on Computer Vision (ECCV), Munich, Germany, 8–14 September 2018; pp. 466–481. [Google Scholar] [CrossRef]
- Newell, A.; Yang, K.; Deng, J. Stacked hourglass networks for human pose estimation. In Proceedings of the European Conference on Computer Vision, Amsterdam, The Netherlands, 8–16 October 2016; pp. 483–499. [Google Scholar] [CrossRef]
- Sun, K.; Xiao, B.; Liu, D.; Wang, J. Deep high-resolution representation learning for human pose estimation. In Proceedings of the IEEE/CVF Conference on Computer Vision and Pattern Recognition, Long Beach, CA, USA, 15–20 June 2019; pp. 5686–5696. [Google Scholar] [CrossRef]
- Wei, S.E.; Ramakrishna, V.; Kanade, T.; Sheikh, Y. Convolutional pose machines. In Proceedings of the IEEE Conference on Computer Vision and Pattern Recognition, Las Vegas, NV, USA, 27–30 June 2016; pp. 4724–4732. [Google Scholar] [CrossRef]
- Carreira, J.; Agrawal, P.; Fragkiadaki, K.; Malik, J. Human pose estimation with iterative error feedback. In Proceedings of the IEEE Conference on Computer Vision and Pattern Recognition, Las Vegas, NV, USA, 27–30 June 2016; pp. 4733–4742. [Google Scholar] [CrossRef]
- Sandler, M.; Howard, A.; Zhu, M.; Zhmoginov, A.; Chen, L.C. Mobilenetv2: Inverted residuals and linear bottlenecks. In Proceedings of the IEEE Conference on Computer Vision and Pattern Recognition (CVPR), Salt Lake City, UT, USA, 18–23 June 2018; pp. 4510–4520. [Google Scholar] [CrossRef]
- Ronneberger, O.; Fischer, P.; Brox, T. U-net: Convolutional networks for biomedical image segmentation. In Proceedings of the International Conference on Medical Image Computing and Computer-Assisted Intervention, Munich, Germany, 5–9 October 2015; pp. 234–241. [Google Scholar] [CrossRef]
- Brown, M.; Lowe, D.G. Automatic panoramic image stitching using invariant features. Int. J. Comput. Vis. 2007, 74, 59–73. [Google Scholar] [CrossRef]
- Liu, R.; Li, Z.; Jia, J. Image partial blur detection and classification. In Proceedings of the 2008 IEEE Conference on Computer Vision and Pattern Recognition, Anchorage, AK, USA, 23–28 June 2008; pp. 1–8. [Google Scholar] [CrossRef]
- Tesseract Documentation. Available online: https://tesseract-ocr.github.io/tessdoc/ImproveQuality (accessed on 1 August 2022).
- Hossein-Nejad, Z.; Nasri, M. An adaptive image registration method based on SIFT features and RANSAC transform. Comput. Electr. Eng. 2017, 62, 524–537. [Google Scholar] [CrossRef]
- Yang, Y.; Ward-Charlerie, S.; Dhavle, A.A.; Rupp, M.T.; Green, J. Quality and variability of patient directions in electronic prescriptions in the ambulatory care setting. J. Manag. Care Spec. Pharm. 2018, 24, 691–699. [Google Scholar] [CrossRef]
- Bird, S.; Loper, E.; Klein, E. Natural Language Processing with Python; O’Reilly Media Inc.: Sebastopol, CA, USA, 2009. [Google Scholar]
- Pedregosa, F.; Varoquaux, G.; Gramfort, A.; Michel, V.; Thirion, B.; Grisel, O.; Duchesnay, E. Scikit-learn: Machine learning in Python. J. Mach. Learn. Res. 2011, 12, 2825–2830. [Google Scholar]
- U.S. Food and Drug Administration (FDA) API Basics. Available online: https://open.fda.gov/api/reference (accessed on 1 August 2021).
- Liu, P.; Qiu, X.; Huang, X. Recurrent neural network for text classification with multi-task learning. arXiv 2016, arXiv:1605.05101. [Google Scholar] [CrossRef]
Figure 1.
Study Approach Diagram.

Figure 2.
Cylindrical Warp Model.

Figure 3.
Warp Mesh for six- and ten-point models. In this case, the mesh quality is similar in both cases. However, having more points makes the model more resistant to prediction errors on individual points and allows for the shape to be defined more precisely.
Figure 3.
Warp Mesh for six- and ten-point models. In this case, the mesh quality is similar in both cases. However, having more points makes the model more resistant to prediction errors on individual points and allows for the shape to be defined more precisely.

Figure 4.
Key points extraction using traditional Computer Vision.

Figure 5.
Sample images used to train DCNNs.

Figure 6.
Heatmap for the six-point model.

Figure 7.
CVS label template.

Figure 8.
Stitched Label.

Figure 9.
Alignment Result.

Figure 10.
Performance comparison of the explored models using Percentage of Correct Keypoint (PCK) curves. U-Net with and output sizes of 224 × 224 showed the best performance.
Figure 10.
Performance comparison of the explored models using Percentage of Correct Keypoint (PCK) curves. U-Net with and output sizes of 224 × 224 showed the best performance.


Table 1.
Directions of use parsers accuracy.
| Quantity | Times/Day | Times/Week | Duration | |
|---|---|---|---|---|
| SVM | 90% | 87% | 90% | 81% |
| Naïve Bayes | 85% | 77% | 89% | 73% |
Publisher’s Note: MDPI stays neutral with regard to jurisdictional claims in published maps and institutional affiliations. |
© 2022 by the authors. Licensee MDPI, Basel, Switzerland. This article is an open access article distributed under the terms and conditions of the Creative Commons Attribution (CC BY) license (https://creativecommons.org/licenses/by/4.0/).
Share and Cite
MDPI and ACS Style
Gromova, K.; Elangovan, V. Automatic Extraction of Medication Information from Cylindrically Distorted Pill Bottle Labels. Mach. Learn. Knowl. Extr. 2022, 4, 852-864. https://doi.org/10.3390/make4040043
AMA Style
Gromova K, Elangovan V. Automatic Extraction of Medication Information from Cylindrically Distorted Pill Bottle Labels. Machine Learning and Knowledge Extraction. 2022; 4(4):852-864. https://doi.org/10.3390/make4040043
Chicago/Turabian StyleGromova, Kseniia, and Vinayak Elangovan. 2022. "Automatic Extraction of Medication Information from Cylindrically Distorted Pill Bottle Labels" Machine Learning and Knowledge Extraction 4, no. 4: 852-864. https://doi.org/10.3390/make4040043