Static and Dynamic Performance of Wet Foam and Polymer-Enhanced Foam in the Presence of Heavy Oil


1
Department of Chemical and Petroleum Engineering, Schulich School of Engineering, University of Calgary, Calgary, AB T2N 1N4, Canada
2
School of Mining and Petroleum, Department of Civil and Environmental Engineering, University of Alberta, Edmonton, AB T6G 2R3, Canada
*
Author to whom correspondence should be addressed.
Colloids Interfaces 2018, 2(3), 38; https://doi.org/10.3390/colloids2030038
Submission received: 20 July 2018
/
Revised: 20 August 2018
/
Accepted: 28 August 2018
/
Published: 8 September 2018
(This article belongs to the Special Issue Colloids and Interfaces in Oil Recovery)
Abstract
:Inadequate sweep efficiency is one of the main concerns in conventional heavy oil recovery processes. Alternative processes are therefore needed to increase heavy oil sweep efficiency. Foam injection has gained interest in conventional oil recovery in recent times as it can control the mobility ratio and improve the sweep efficiency over chemical or gas flooding. However, most of the studies have focused on light crude oil. This study aims to investigate the static and dynamic performances of foam and polymer-enhanced foam (PEF) in the presence of heavy oil. Static and dynamic experiments were conducted to investigate the potential of foam and PEF for heavy oil recovery. Static analysis included foam/PEF stability, decay profile, and image analysis. A linear visual sand pack was used to visualize the performance of CO2 foam and CO2 PEF in porous media (dynamic experiments). Nonionic, anionic, and cationic surfactants were used as the foaming agents. Static stability results showed that the anionic surfactant generated relatively more stable foam, even in the presence of heavy oil. Slower liquid drainage and collapse rates for PEF compared to that of foam were the key observations through foam static analyses. Besides improving heavy oil recovery, the addition of polymer accelerated foam generation and propagation in porous media saturated with heavy oil. Visual analysis demonstrated more stable frontal displacement and higher sweep efficiency of PEF compared to conventional foam flooding. Unlike foam injection, lesser channeling (foam collapse) was observed during PEF injection. The results of this study will open a new insight on the potential of foam, especially polymer-enhanced foam, for oil recovery of those reservoirs with viscous oil.
1. Introduction
Inadequate sweep efficiencies resulting from unfavorable mobility ratios are the main challenges during enhanced oil recovery (EOR) methods, especially in heavy oil recovery. Foam and polymer-enhanced foam (PEF) flooding can control the mobility ratio and improve the sweep efficiency, especially in heterogeneous reservoirs. Foam can provide better control of the fluids injected and uniformity of the contact as stronger foams can block the flow channels in high-permeability media and divert it toward the low permeable parts [1,2].
Foam has shown its potential for improving reservoir sweep efficiency over gas injection-enhanced oil recovery projects [1,3]. Besides improving sweep efficiency in gas flooding, foam/PEF can be used for mobility control in chemical EOR where the foam is considered an alternative to polymer mobility control in micellar flooding [4]. Zhang et al. (2000) [5] reported on laboratory and field studies of foam in Daqing oilfield in China, where the foam was successfully applied in a heterogeneous porous media and compared with the performance of chemical flooding.
There are several challenges for widespread application of foam in porous media, such as in situ generation and propagation of foam. Although the principal mechanisms for foam generation have been identified, the precise condition when the strong foam can be generated in the reservoir remains unknown. In a homogeneous porous medium, with steady coinjection of gas and liquid, a minimum pressure gradient is required to create foam [6,7,8,9]. One of the proposed ways to enhance foam generation is using small, alternating slugs of liquid and gas, i.e., surfactant alternating gas (SAG) injection [7]. SAG injection has several advantages over coinjection of gas and surfactant as it reduces the contact between water and gas in the surface facilities [10,11], and besides improving injectivity, it can possibly improve foam generation in the near-well-bore region [7].
Another important challenge during foam EOR is the detrimental effect of crude oil. There have been several studies on static and dynamic performance of foam–oil systems [12,13,14,15,16,17]. These studies have mainly focused on performing foam stability experiments (bulk tests) in the presence of different types of light oils and measuring the foam half-life. Some of these researchers have also measured the spreading, entering, and birding coefficients in the foam–oil system and tried to explain the behavior of the foam–oil system. However, the relation between spreading phenomena and foam stability has been inconclusive for general applications. For instance, Andrianov et al. (2012) [13] concluded that there exists a strong correlation between spreading (S) and entering (E) coefficients and foam stability, while Vikingsad et al. (2005) [12] did not find any direct correlation between spreading coefficient and foam stability. Nikolov et al. (1986) [18] mentioned that as the oil drop approaches the liquid–gas interface, the thin liquid film forms between the oil drop and the gas phase called “pseudoemulsion film”. According to this study, oil drop cannot enter the interface when the pseudoemulsion film is stable, even if the values of E or S coefficients are different.
Chemical methods are among the most common nonthermal EOR process for heavy oil recovery after water flooding. One of the issues with the chemical method for heavy oil reservoirs is the low injectivity and inadequate sweep efficiency, especially in heterogeneous reservoirs. Foam and PEF can improve sweep efficiency over gas and chemical injections. Foam can reduce viscous fingering and gravity override during gas injection as the effective viscosity of foam is much higher than that of gas [19]. Shallow heavy oil reservoirs in Western Canadian Sedimentary Basin (WCSB), which can also be recovered by nonthermal processes, can be the potential target for foam/PEF EOR application. The high viscosity of the oil and high heterogeneity of these reservoirs can result in inadequate sweep efficiency of conventional nonthermal methods.
Most of the previous studies mentioned above have been performed on light crude oils. In this study, the effect of heavy crude oil is studied on the static and dynamic performance of foam. Moreover, PEF is also introduced for improving the performance of conventional foam in heavy oil reservoirs. For this aim, first, static experiments—including bulk foam stability—and surface tension studies were designed to study the behavior of bulk foam in the presence and absence of heavy oil as well as the effect of polymer addition on its behavior. In the second part, dynamic experiments of foam/PEF propagation through visual sand pack were performed to investigate the dynamic stability with and without the presence of heavy oil.
2. Materials and Methods
2.1. Materials
For the foam/PEF studies, various types of surfactant—nonionic, anionic, and cationic—were selected as foaming agents and one polymer was selected as a foam stabilizer, as follows:
Nonionic surfactant: Surfonic N85 (Huntsman Corporation), which is a nonylphenol-ethoxylated nonionic surfactant with the chemical formula C15H23 (OCH2CH2)n OH (Mw = 594 g/mol), was used.
Anionic Surfactant: Two anionic surfactants—sodium dodecylbenzenesulfonate (DDBS; C12H25C6H4SO3Na, Mw = 348.5 g/mol)) and C14–C16 alpha olefin sulfonate (AOS; R-SO3−Na+, Mw = 348.5 g/mol)—were used for static foam analysis.
Cationic Surfactant: Cetyltrimethylammonium bromide (CTAB) (Sigma-Aldrich, 99% purity) was also used as a cationic foaming agent (C19H42BrN, Mw = 364.5 g/mol).
Polymer: Polymer was used to increase the viscosity of the liquid phase. The anionic polyacrylamide polymer FLOPAAM 3330S (supplied by SNF SAS) was used in the preparation of polymer solutions. It had hydrolysis degree of 25–30% and average molecular weight of 8 × 10⁶. It should be mentioned that all foaming solutions were prepared with tap water (Ca2+ = 34 ppm, Mg2+ = 10 ppm, and Na2+ = 35 ppm) without the addition of any salt. The different salt concentration may have had an effect on the foam stability.
Hydrocarbons: For both static and dynamic experiments, heavy crude oil (sampled from the Canadian oilfields) with dead oil viscosity of 1320 cp (at 22 °C) and dead oil density of 933 kg/m3 was used. In addition, a mineral oil with a viscosity of 27 cp and density of 850 kg/m3 (22 °C) was used for only static analysis of the foam–oil system.
2.2. Foam Bulk (Static) Experiments
Foam and PEF generation: For the preparation of the foaming solution, surfactant (0.29 wt %)—and in some tests, polymer (0.15 wt %)—were mixed in water. A magnetic stirrer (400 rpm for 20 min) was used for mixing to avoid foam generation. Thereafter, foam or PEF was generated using a digital homogenizer (Kinematica Inc., Bohemia, NY, USA). It should be mentioned that all four surfactants were used for foam static analysis and among them, N85 was selected for the static study of PEF.
For foam generation, 100 cc of foaming solution was mixed in a glass cylinder at high speed for two minutes. The shearing speed and shearing time were kept constant for uniformity of foam created throughout all the experiments. In some experiments, 5 cc of oil was added to the foaming solution before high-speed mixing to study the effect of oil on foam/PEF stability.
Static stability: The glass cylinder was closed with a plastic seal after foam generation to avoid evaporation. In each experiment, immediately after mixing, the total height and the height of liquid were measured as a function of time. Foam stability (foam half-life) was recorded based on the time required to drain half of the liquid from the foam. Moreover, the initial foam height value was also recorded as the foamability of foaming solutions. A high-definition camera was used to analyze the foam behavior with and without the presence of oil. For some detailed analysis of foam–oil interaction, a Leica DM 6000M microscope was used to capture high-quality images. All experiments were repeated to assure the reproducibility of results. The reproducibility of foam high and foam half-life was ±1 cm and ± 0.5 min, respectively.
Surface tension and interfacial tension: The surface tension of the surfactant solutions and their mixtures with polymer was measured by the Du Noüy tensiometer (K6, KRÜSS Canada) using a platinum–iridium ring. The ring method directly measures the maximum pull on the interface to find surface tension value. After each measurement, the ring was carefully rinsed with deionized water and then a solvent (usually acetone) to remove impurities. Thereafter, the ring was cleaned with a flame to remove any impurities. The interfacial tension (IFT) measurements were performed using a spinning drop method (SITE100, KRÜSS Canada). The lowest measurement range for this instrument is as low as 10−6 mN/m, with rotational speed up to 15,000 rpm (with a capillary diameter of 2.5 mm).
2.3. Foam Dynamic Experiments
To analyze the dynamic performance of foam and PEF in porous media, a linear visual sand pack was used (1-ft in length with an inner diameter of 1-inch). The visual cell was packed with glass beads (40–70 meshes), and a special expandable rubber was used to seal both ends. A metal screen (80 meshes) was used to avoid sand production. After vacuuming the sand pack (at least 3 h), water saturation and permeability measurements were conducted. The measured porosity and permeability of the sand pack were 37 ± 0.5% and 38 ± 0.5 Darcy, respectively. The porous medium was then saturated with heavy crude oil (1320 cp) until no water was produced. A syringe pump (ISCO, Model 500D) and a pressure transducer (OMEGADYNE, Model PX409) were used for liquid injection and pressure record, respectively. A schematic of the dynamic experiments set up is shown in Figure 1.
In this study, the foam was generated in situ by surfactant alternating gas injection. During all the experiments, both liquid and gas rates were kept equal (20 ft/D). The injection rate was selected based on the high permeability of the sand pack and the shear rate of fluid within the porous media (between 1 to 100 s−1). In addition, the high rate ensured that the critical pressure gradient to generate strong foam was exceeded. A gas mass flow controller (EL-flow, Hoskin Scientific Ltd., Saint-Laurent, QC, Canada) was used for the accurate injection of CO2 gas at the constant volumetric flow rate. The slug volume of both liquid and gas was selected as 0.1 fractions of the total pore volume (0.1 PV). Pressure profile and oil recovery were measured, and sand pack images were captured during all the experiments to compare the performance of different foaming solutions in heavy oil recovery. It should be mentioned that all flooding tests were performed in tertiary recovery mode after reaching a constant water cut of 98% during water flooding. Table 1 summarizes details of the dynamic experiments on visual sand pack. Among the studied surfactants, nonionic N85 and anionic AOS were selected for foam flooding and N85 surfactant was selected for PEF flooding. All experiments were performed at ambient condition (22 °C) without using any backpressure. It should be mentioned that after oil saturation (initial oil saturation 92 ± 0.5%), the sand pack was aged overnight at room temperature.
3. Results and Discussion
3.1. Static Performance of Foam and PEF in the Absence of Heavy Oil
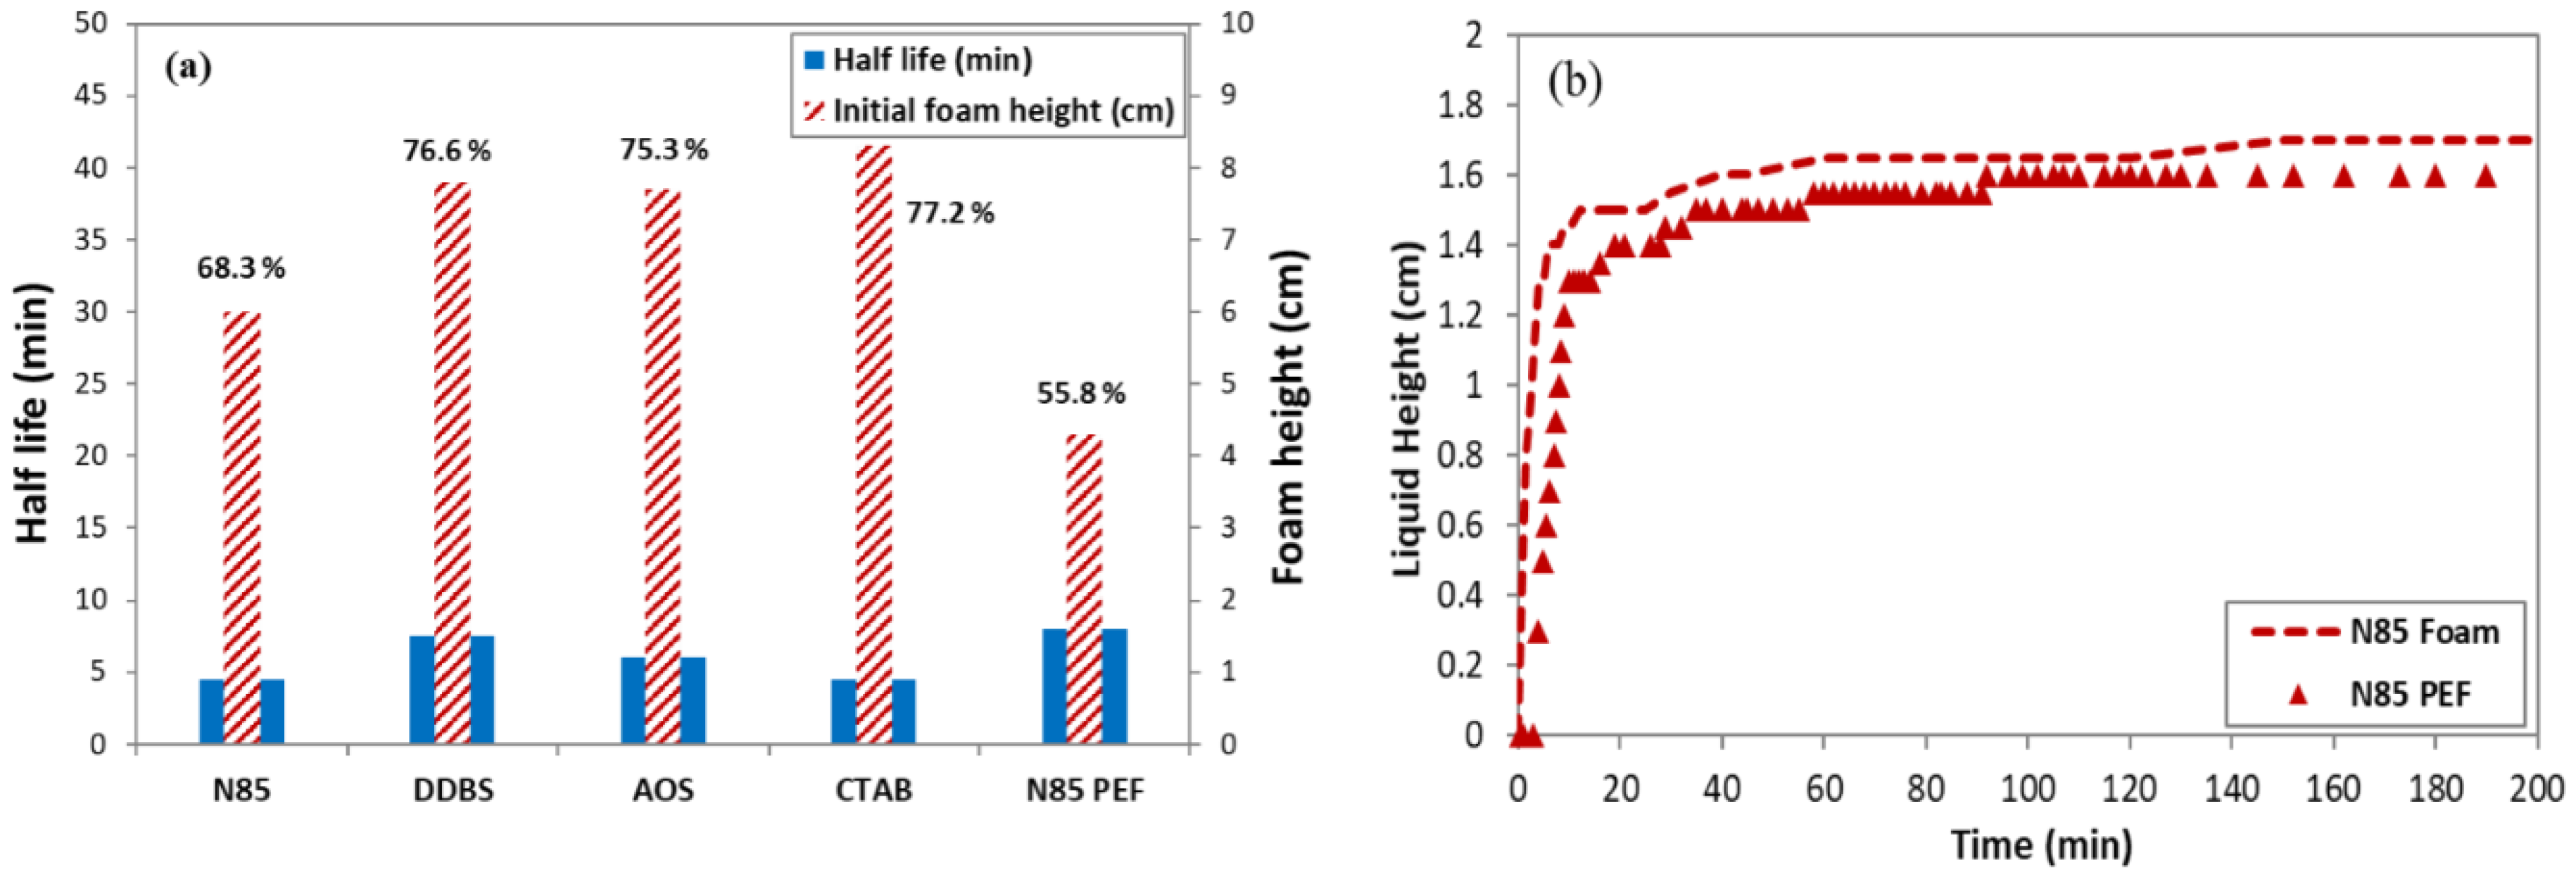
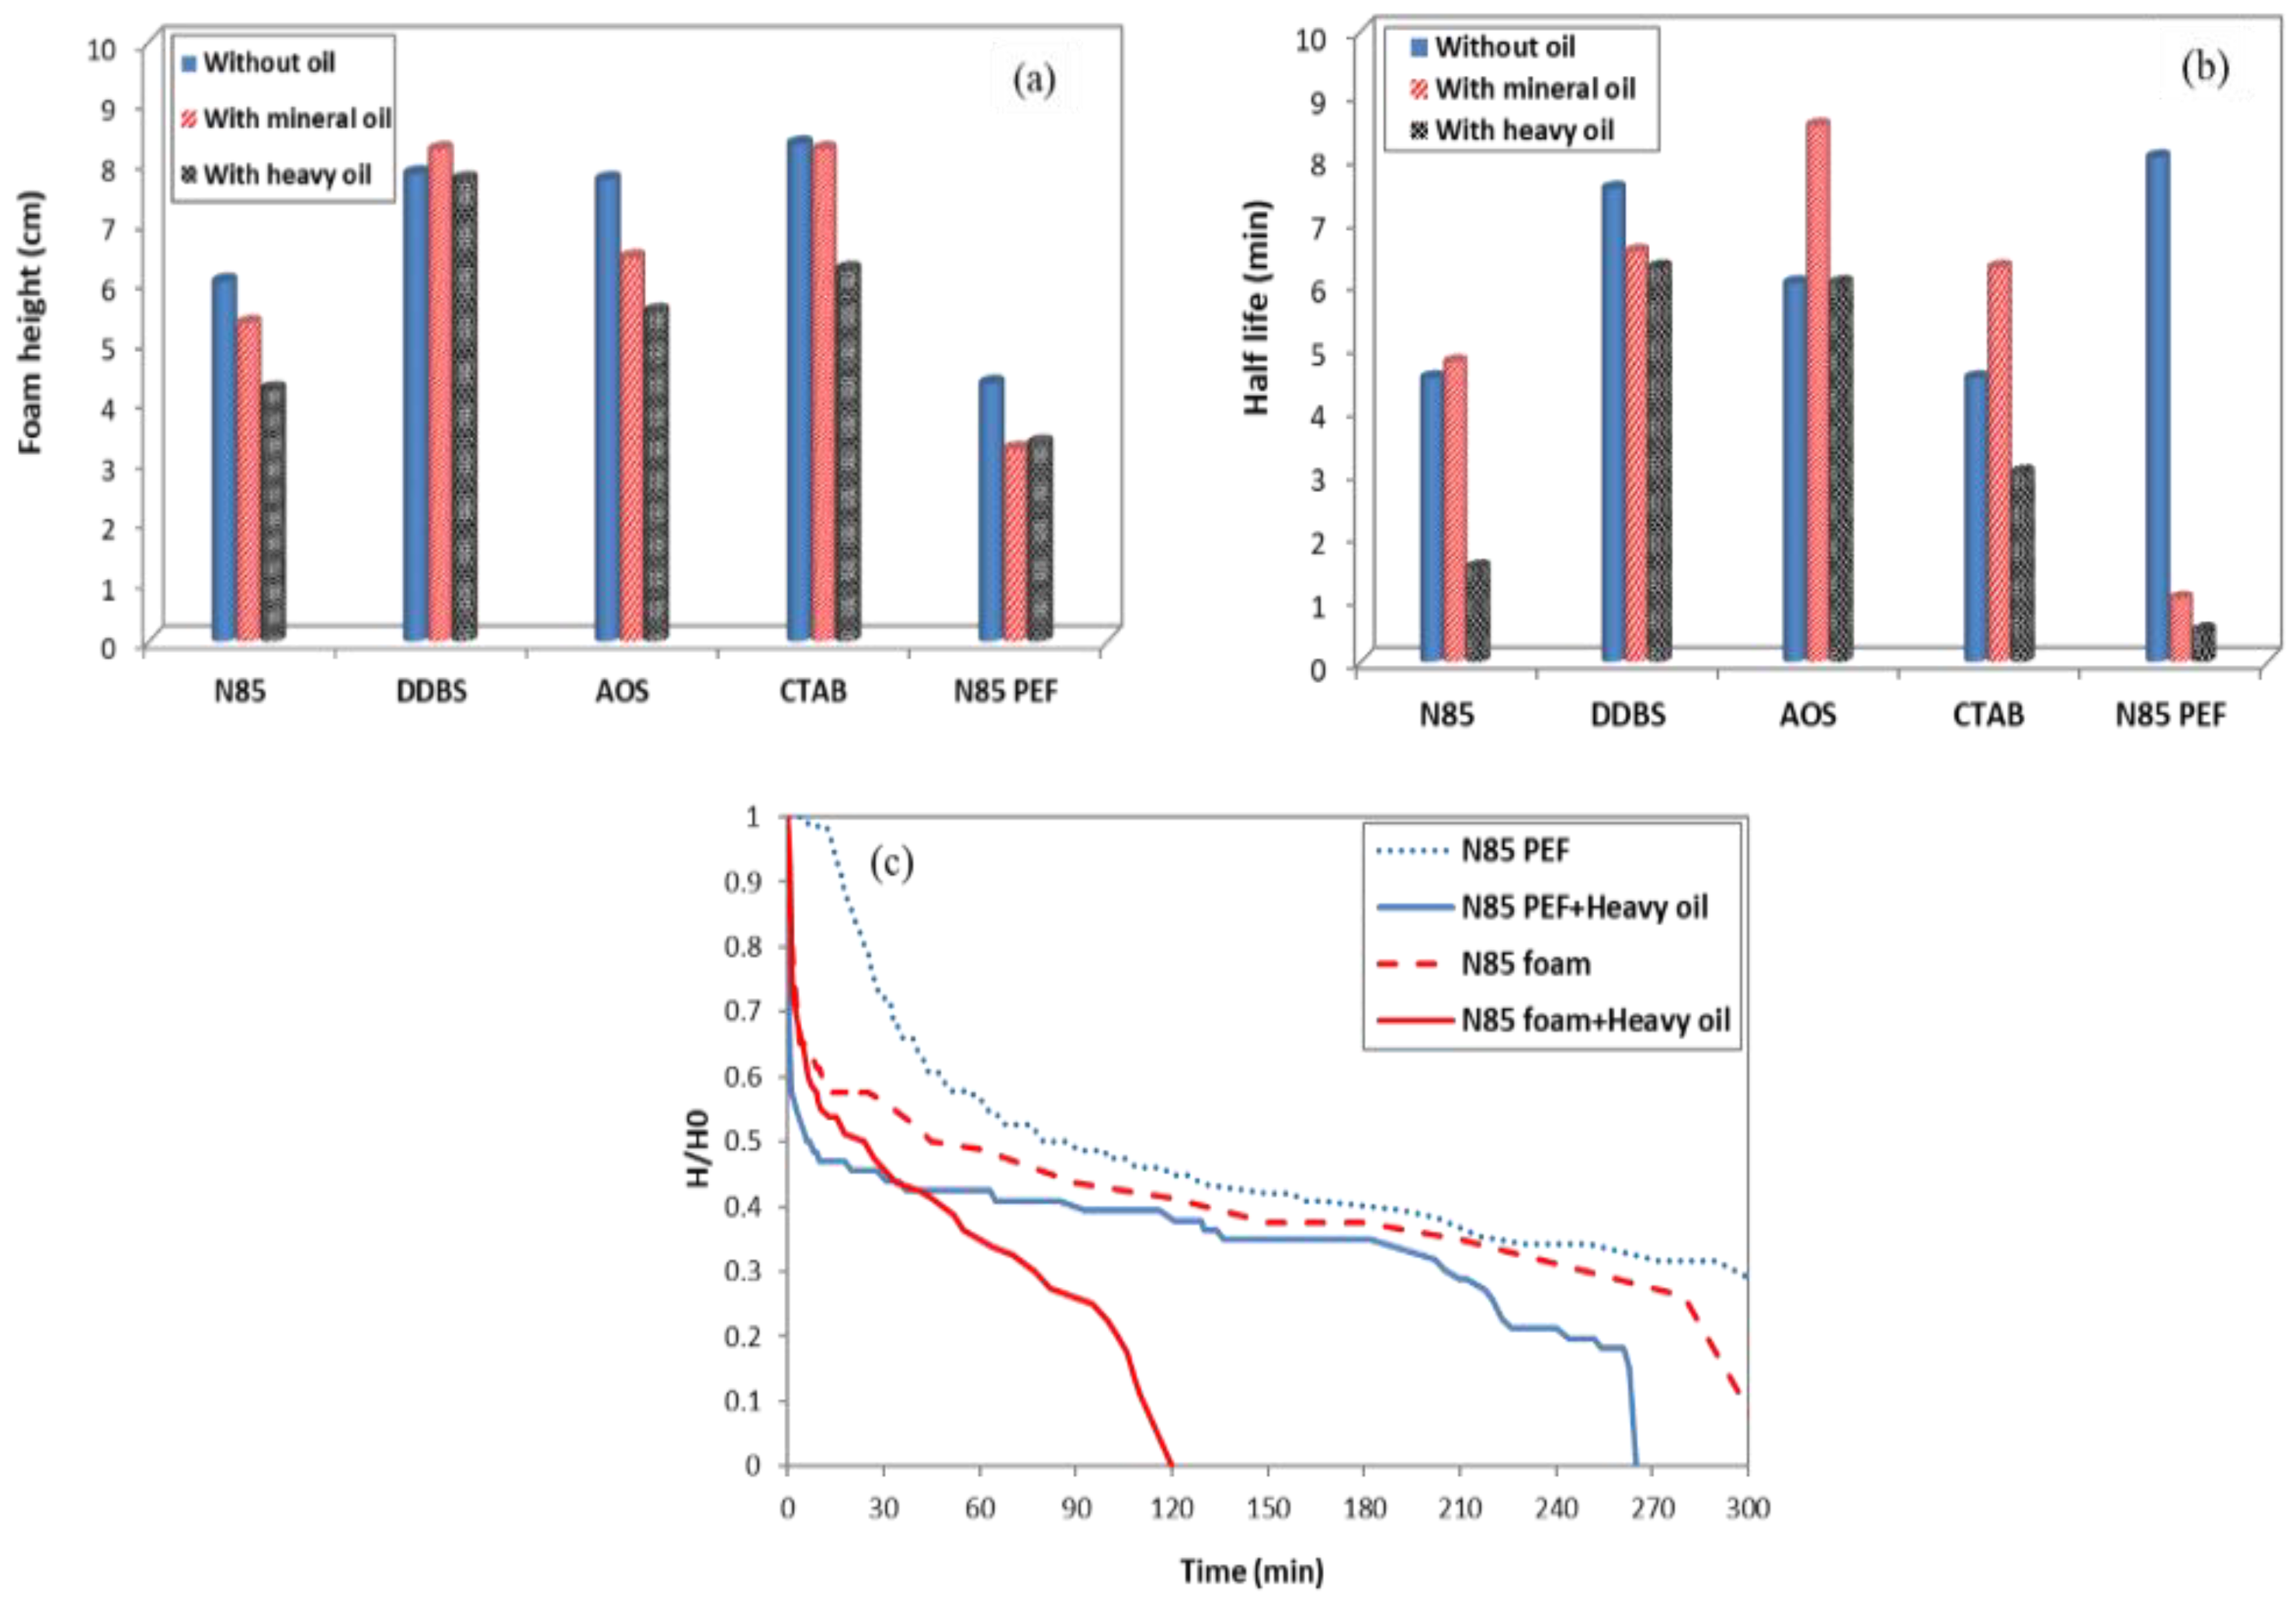
Effect of surfactant type: The changes of normalized foam height (H/H0) versus time, foamability, and foam stability (half-life) for all studied surfactants are shown in Figure 2. Among all studied surfactants, DDBS (and also AOS) showed better stability (half-life), while CTAB had highest foamability. Foamability is the ability of the surfactant to generate foam. The numbers in Figure 2a represents quality (gas content) of the foam. Several references have reported the good foamability of anionic surfactants [20,21,22], whereas the nonionic surfactants generally produce less foam. The stability of foams generated with ionic or nonionic surfactants is achieved by repulsive forces between the surfactant monolayers [23,24]. Therefore, the ionic surfactants—DDBS, AOS, and CTAB—generated more foam with relatively higher stability compared to that of nonionic N85 surfactant. According to Figure 2a, initial foam height (foamability) and half-life (foam stability) of anionic surfactants were slightly higher than that of the nonionic surfactant. The presence of ionic surfactants at the interface in the foam film will stabilize the film and induce a repulsive force that opposes the film thinning process. This is called the electric double-layer repulsion [25,26], which depends on the charge density and the film thickness.
Effect of polymer addition: One of the major advantages of polymer addition in foaming solution is the viscosity enhancement, which may improve the foam stability by lowering the liquid drainage rate in the foam. The N85 surfactant was selected for the PEF study. The foamability and half-life values for polymer-enhanced foams are shown in Figure 2a. Although the polymer increased the half-life value, it drastically decreased the foamability of surfactant. Polymer increased the viscosity of the liquid solution within the foam lamella, reduced the rate of liquid drainage, and consequently increased the stability of foam, as seen in Figure 2a,b. However, this enhancement was not significant for N85 surfactant, which is a relatively poor foaming agent. Therefore, proper selection of surfactant and polymer is essential to have optimum stability for PEF.
3.2. Static Performance of Foam and PEF in the Presence of Heavy Oil and Mineral Oil
Oils generally destabilize and can also stabilize a foam system [14]. In this study, the effect of heavy crude oil and mineral oil was examined on foam stability. The results are shown in Figure 3. The presence of heavy oil decreased the foamability and stability of foams and PEFs generated with all types of surfactants, especially N85. By contrast, the presence of mineral oil stabilized or destabilized the studied foams depending on the surfactant type. In terms of foamability, the addition of mineral oil had no drastic effect on foamability and foam stability of foams compared to that of heavy oil. Considering foam stability, in some cases, the addition of mineral oil resulted in an increase in the foam stability (N85, AOS, and CTAB foams). The addition of polymer did not improve the stability of N85 foam in the presence of oils. However, the decay profile (Figure 3c) showed that N85 foam completely collapsed after 2 h, whereas this value was more than 4 h for N85 PEF.
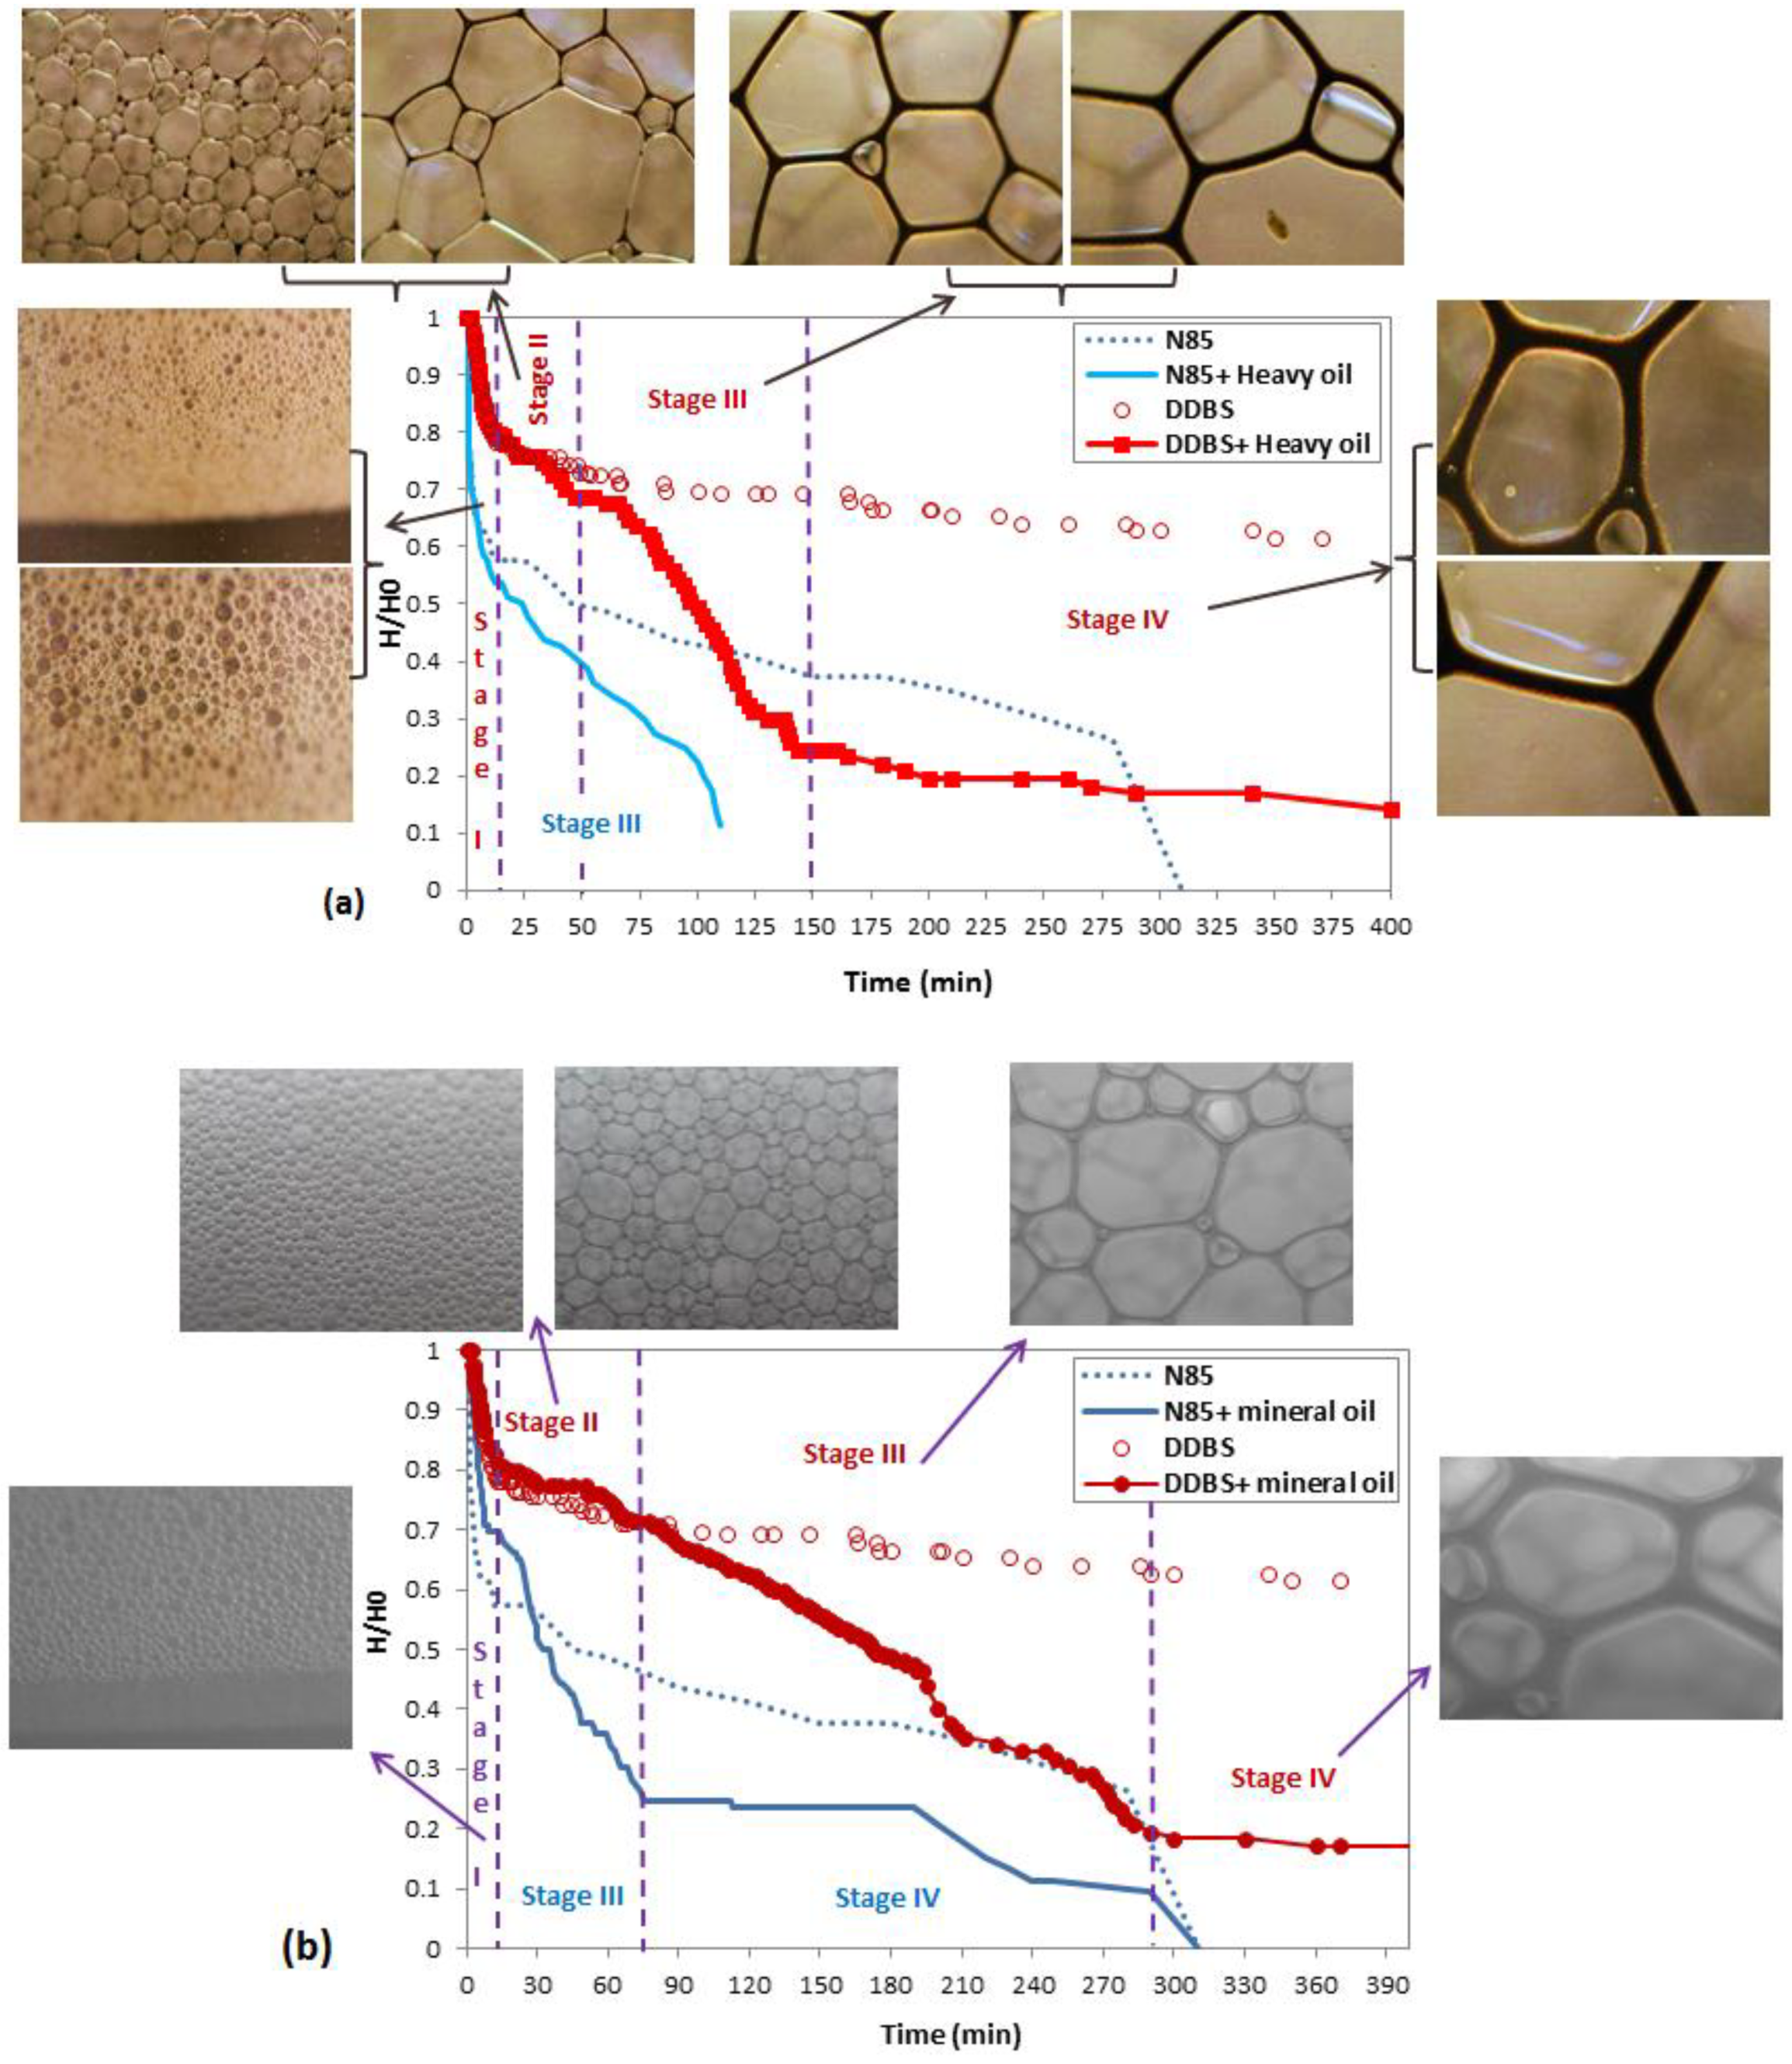
The decay profiles of DDBS, which was similar to AOS (the results are not presented here) and N85 surfactants, were selected for detailed discussion of foam–oil interaction. The foam decay profile was divided into four stages (according to Denkov, 2004) [27] as shown in Figure 4, where the normalized foam height is plotted versus time for different foam–oil systems. Both types of oil increased the foam destruction rate; however, mineral oil had relatively less drastic influence in both foam systems. This was more evident in the N85 foam system. By contrast, mineral oil, interestingly, reduced the liquid drainage rate (stage I) and had no drastic effect on foam decay life. The behavior of each foam–oil system at each stage can be explained as follows:
Stage I: During Stage I, the main process affecting the foam decay profile was liquid drainage. It should be mentioned that some minor bubble coarsening may have occurred during this stage, but the dominant phenomenon was the liquid drainage. Images of the foam bubble texture at the foam top and liquid–foam interface during this stage are shown in Figure 4.
Stage II: There was no significant liquid drainage in Stage II; however, the optical observation of the foam column demonstrated a significant change in bubbles structure during this period. The small bubbles disappeared and bubble coarsening occurred because of gas diffusion through the films (Figure 5). Stage II was too short in the case of N85 surfactant foam system. This is due to N85 (nonionic) surfactant having less potential to generate stable foam, with the foam starting to collapse almost immediately after the drainage stage. Besides surfactant weakness, the antifoaming effect of oil increased the rate of foam collapse. Stage II was about 40 min for the DDBS foam system, which showed the better stability of DDBS surfactant (anionic) to generate the most stable foam. A similar trend was seen in foam–mineral oil system; however, the length of stage II in DDBS–mineral oil system increased to more than 50 min, as seen in Figure 4b.
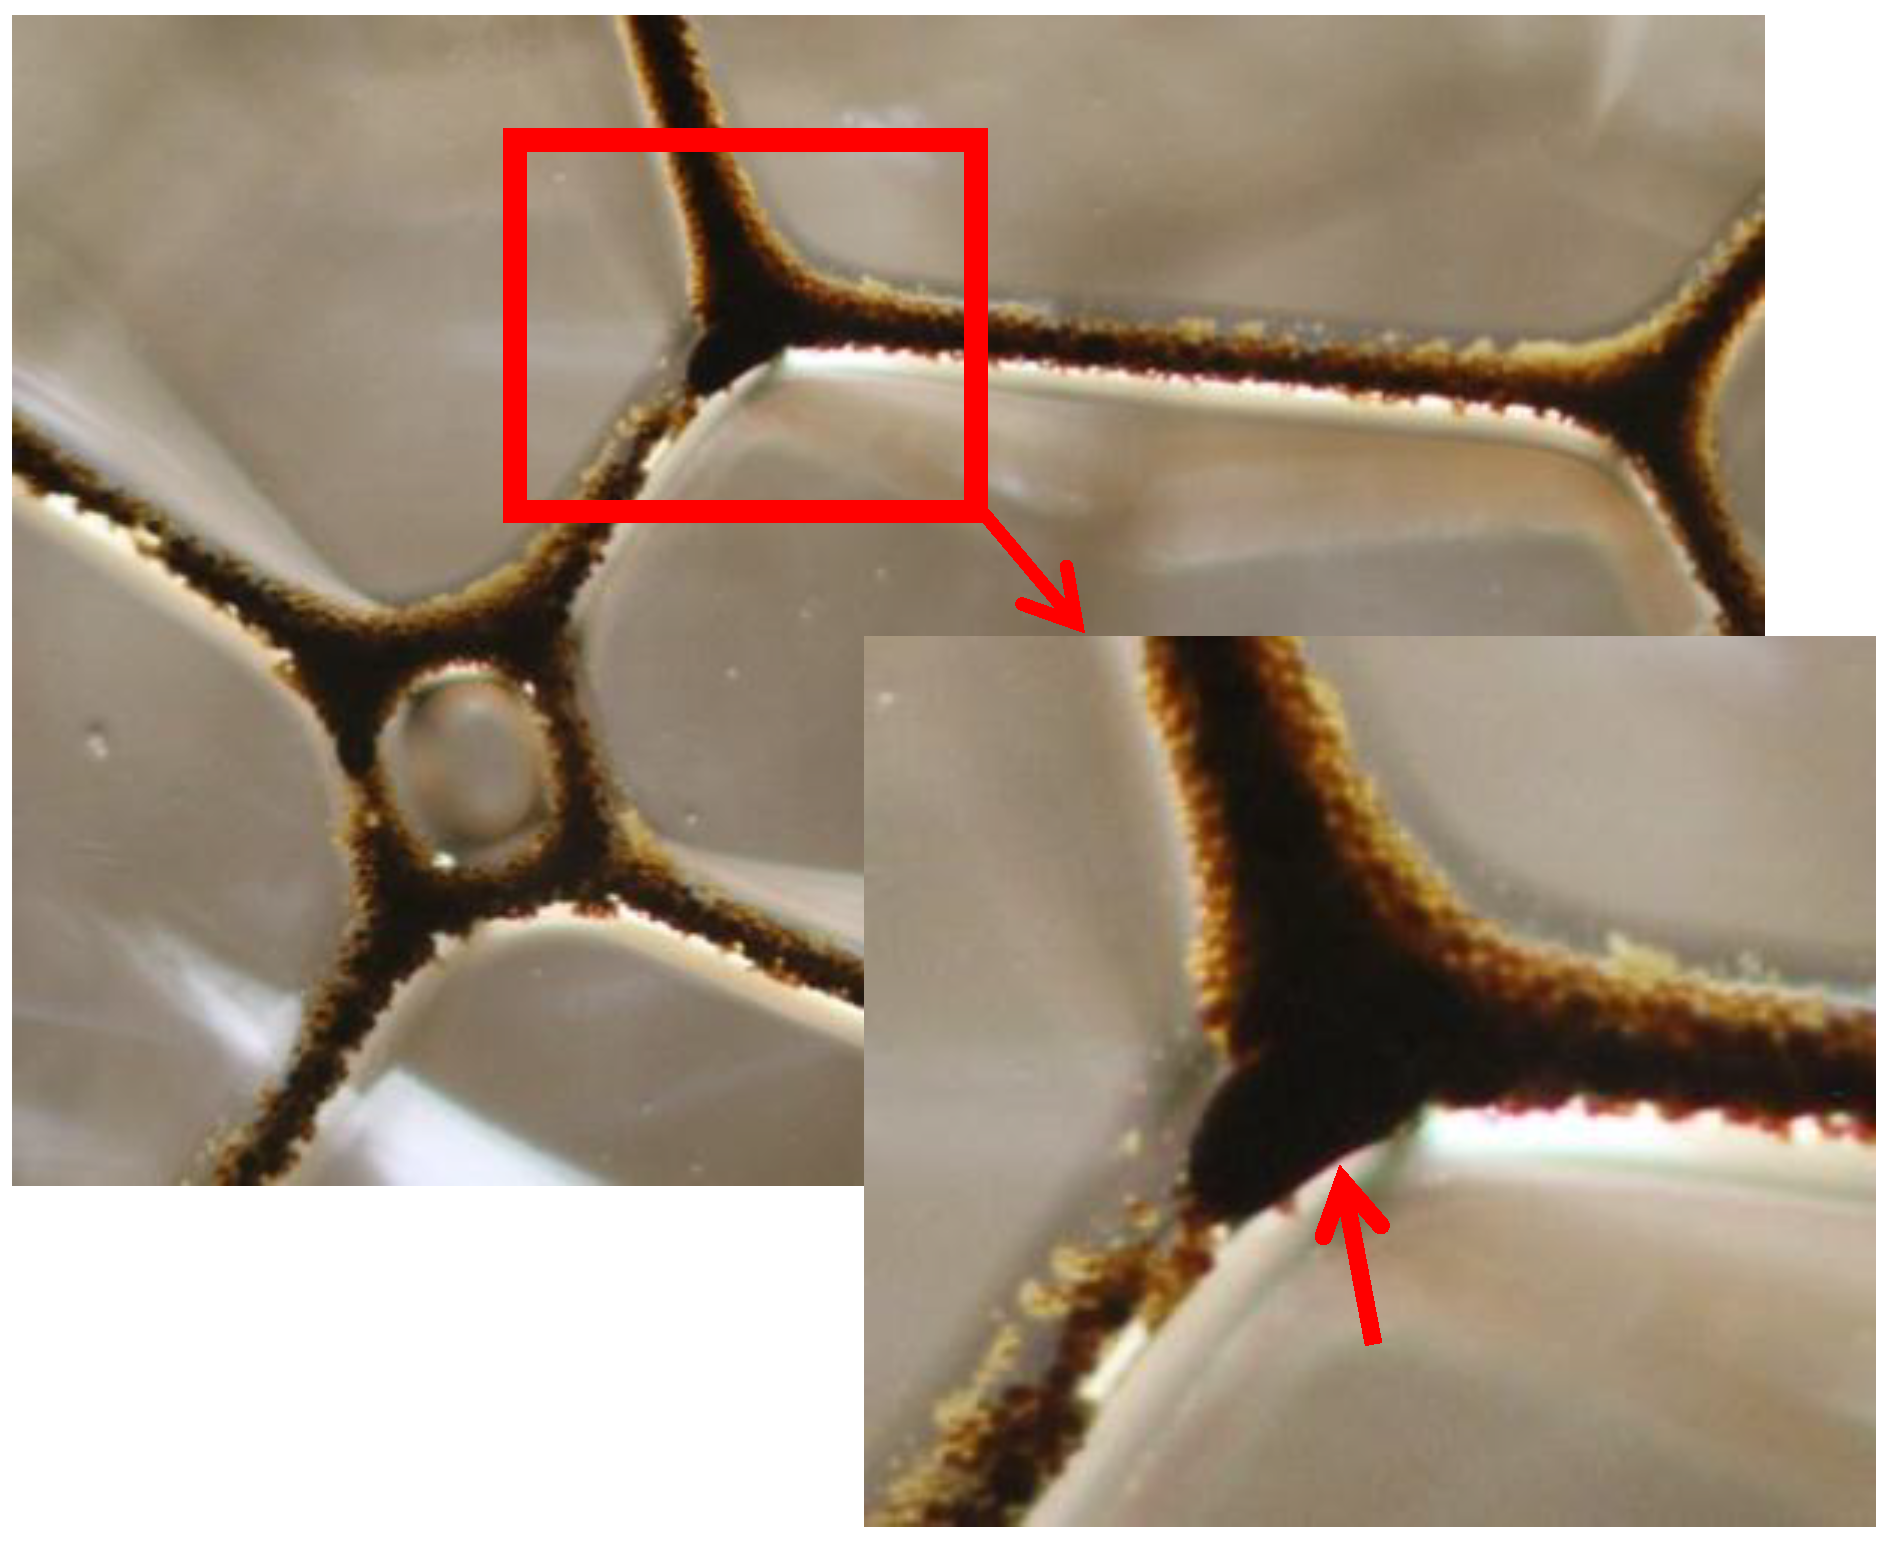
Stage III: The onset of stage III was identified by rupture of bubbles in the upper layer of the foam column. According to Denkov (2004), [27] when a certain critical value of the compressing capillary pressure (which is higher at the foam top) is reached, the foam starts to collapse. Stage III is called the “antifoaming” stage [27] because the shape of the profile strongly depends on the antifoaming behavior of the oil. In a foam–oil system, after foam generation, oil droplet is immediately drained from the foam film and rests in foam lamella and Plateau borders (PBs) because the droplets are smaller than the foam film thickness. During this stage, the lamella eventually will break by thinning the foam film/lamella and increasing oil droplet size (due to flocculation/coalescence of droplets). Figure 6 shows the collapse of foam lamella at the antifoaming stage, which is most probably due to the drastic effect of oil.
Comparing N85 and DDBS foams in the presence of heavy oil, the N85 foam started to collapse immediately after liquid drainage (stage I) and foam column collapsed in less than 2 h. Heavy oil also significantly reduced the length of stage III (increased rate of foam destruction) in DDBS foam. In mineral oil system, the rate of DDBS foam destruction (slope of the curve at stage III) was less than that of heavy oil, representing the less detrimental effect of mineral oil on foam stability.
Stage IV: Over time in Stage III, the rate of foam destruction gradually decreased in magnitude and stage IV was reached when the foam volume remained almost constant (residual foam height) before the foam died. Unlike N85 foam–heavy oil system, stage IV interval was evident in the DDBS foam system. In N85 foam–heavy oil system, foam collapsed right after the liquid drainage stage and died without any residual foam height, i.e., the height of the foam at stage IV. As noticed earlier, mineral oil showed less drastic effect; therefore, unlike the heavy oil system, stage IV could be seen in N85 foam–mineral oil system.
More Insight into Impact of Oil on the Foam Stability
A mixture of gas bubbles and oil droplets are called foamulsions or foamed emulsions [15]. In this structure, emulsion droplets are trapped and jammed between the gas bubbles, which may result in stable foamulsions [28]. The presence of emulsion droplets within the foam structure can slow down the drainage and coalescence [29]. During liquid drainage, the aqueous phase and emulsion drops flow together through the foam structure (foam film and plateau borders). However, oil drops drain slower than that of the aqueous phase. This is the reason for the increase in oil concentration within the lamella over the time, as seen in Figure 7. In this study, most of the oil stayed in the foam structure even after the collapse of the majority of foam lamellas. Oil droplet moves within foam lamella in the form of an emulsion (Figure 8 and Figure 9) and destabilizes a foam system by entering and spreading in the water–gas interface. Oil drop must first overcome the repulsive forces (electrostatic or steric interactions) in the aqueous pseudoemulsion film to destabilize a foam lamella [18,30]. Koczo et al. (1992) [15] studied the effect of emulsion on foam stability. Their study on solubilized oil and emulsified oil systems showed that the latter may improve the stability of foam system, while solubilized oil decreases the foam stability. The packed emulsion droplets (in emulsified oil systems) prevent the liquid drainage through the foam structure due to the increased hydrodynamic resistance.
The S and E coefficients can be calculated by surface tension and interfacial measurement by the following formula [14]:
where, σwg, σog, and σow are surface tension of the foaming solution, the surface tension of oil, and interfacial tension of water–oil interface, respectively. It is noteworthy that values of entering (E) and spreading (S) coefficients may give insight into the potential of the oil to destabilize a foam system; however, these coefficients cannot explain the rate of foam destabilization [30,31]. Spreading and entering coefficients values are presented in Table 2. Oil can spread as a lens over the gas–liquid interface when the spreading coefficient S is positive [32]. Similarly, an oil droplet is predicted to enter the aqueous–gas interface when the entering coefficient, E, is positive.
S = σwg − σwo − σog
E = σwg + σwo − σog
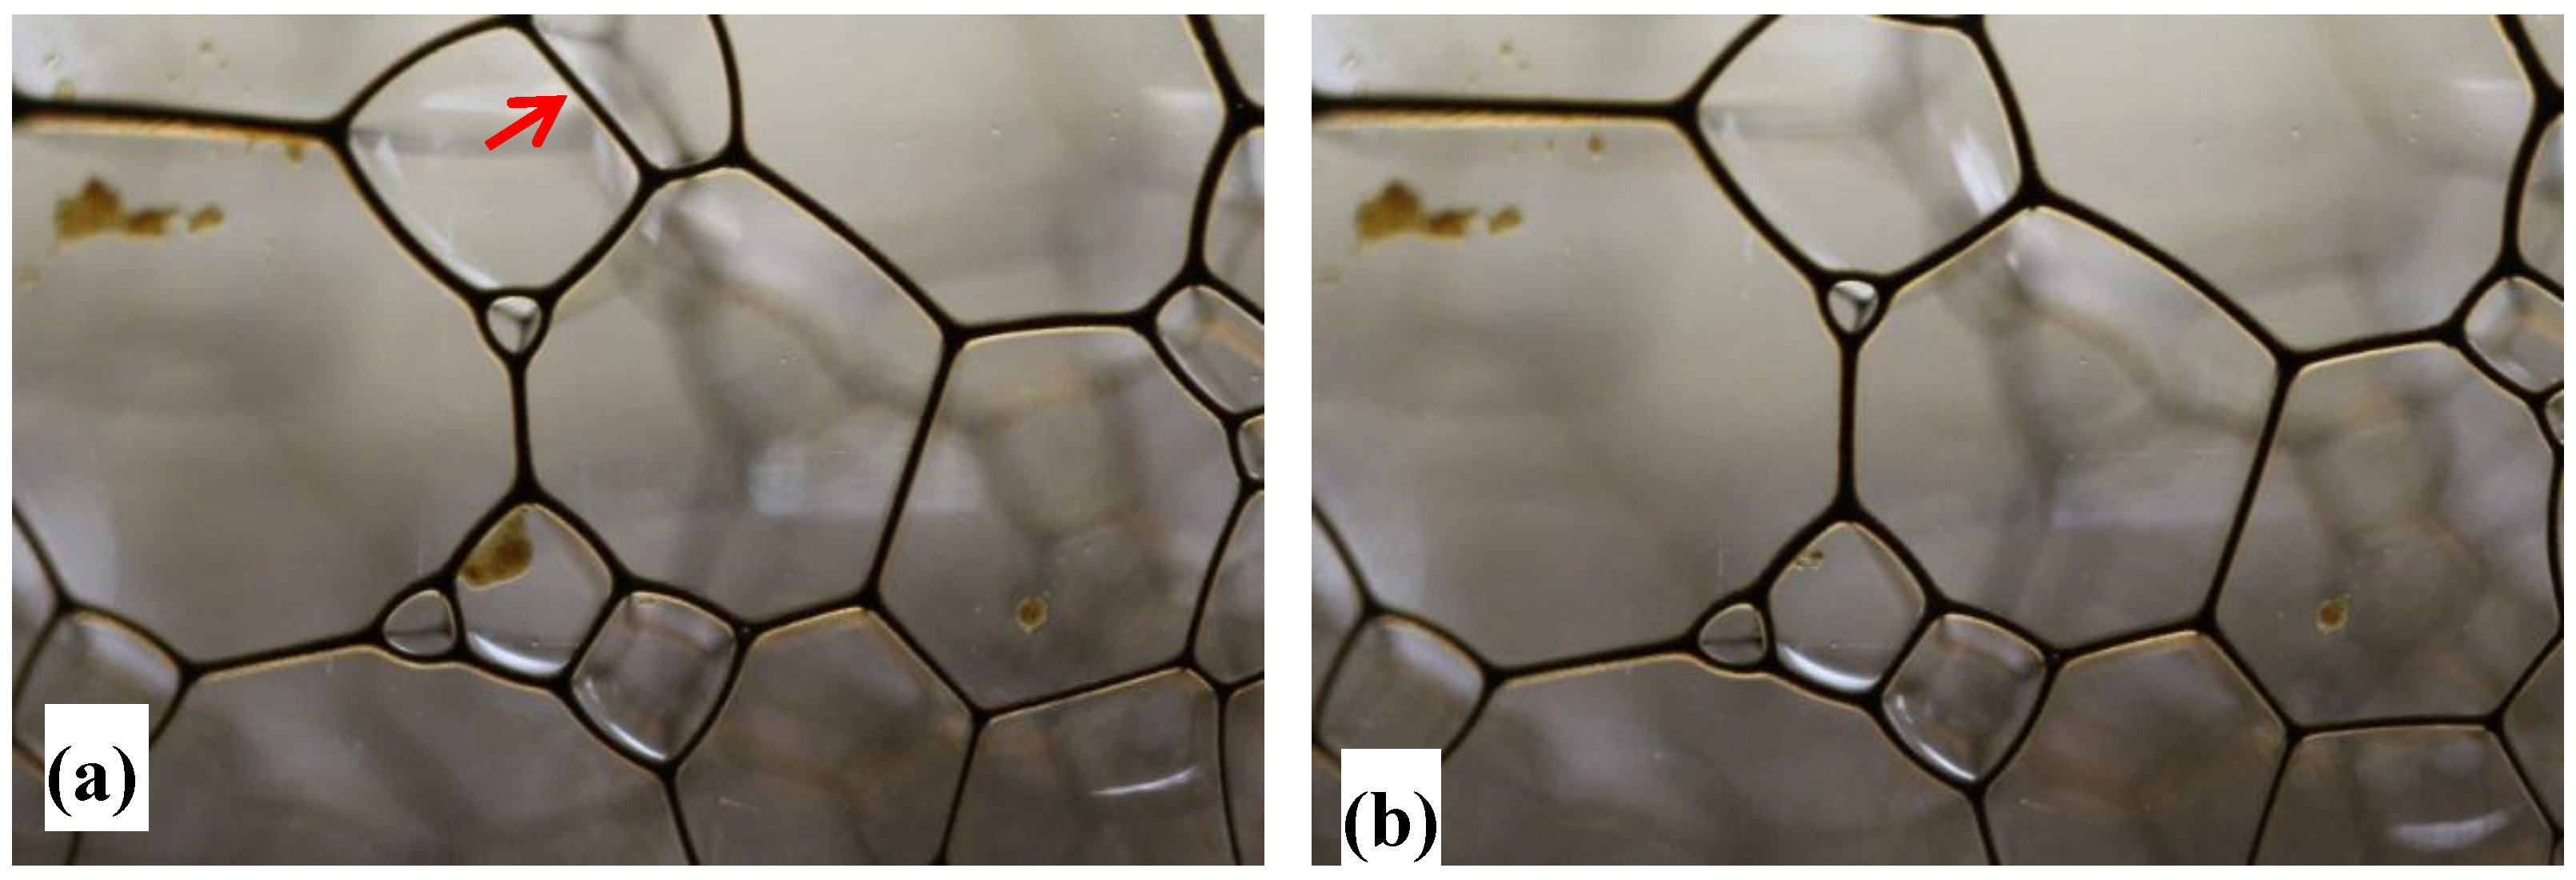
As shown in Table 2, all the surfactants studied here showed a positive entry coefficient, which indicates that oil entry is feasible in all systems. DDBS recorded the lowest spreading and entering coefficients, which is consistent with its highest stability in the presence of oil (Figure 3a). Although all surfactants had positive S and E coefficients, they showed decent stability in the presence of oil in the static test. Despite the positive values of E and S for AOS surfactant, it showed acceptable dynamic stability during heavy oil recovery. Therefore, the overall foam stability cannot be solely explained by these coefficients, and it may relate to the interfacial and bulk properties of the surfactant as well [31]. If the pseudoemulsion film is stable, oil droplet cannot destabilize the foam by entering the water–gas interface [18]. If the surfactants in the aqueous phase can stabilize foam films, then it can be expected that the same surfactants can, but not necessarily will, stabilize the pseudoemulsion film as well [18].
As seen in Figure 9, emulsion droplets within the foam lamella destabilized and created a bigger droplet. However, as long as the pseudoemulsion was stable the oil could not enter into the interface, create a lens, and destabilize the foam lamella.
In addition, the presence of emulsion droplets within the foam lamella affected the stability of the foam. Figure 9 shows the emulsion within the foam lamella created by mineral and heavy oil. These images can possibly show the reason for more stable foaming solutions in the presence of mineral oil than heavy oil. The presence of the dense assembly of droplets trapped and jammed in between the bubbles increased the local viscosity and reduced the rate of both films thinning and Plateau borders shrinking [29], resulting in a slowing down of the coarsening phenomena [33]. Note that in a higher fraction of oil, there should be enough free surfactant present in water to improve the foam stability [29]. However, this is not the case for the foam system with the presence of heavy oil. The microscopic images of heavy oil emulsion within the foam lamella demonstrated flocculation of several oil droplets within the lamella. The flocculation eventually resulted in droplet coalescence and formed bigger oil droplet or oil lens, which was detrimental to foam stability. As shown in Figure 4b, mineral oil slightly reduced the liquid drainage rate (stage I) and had no drastic effect on foam total life, i.e., N85 foam died after about 5 h with/without mineral oil.
Polymer increased the liquid viscosity within the foam lamella and significantly decreased the rate of liquid drainage (Figure 3). As a result, a longer time was required for bubble coalescence, and the bubble eventually collapsed due to the thin foam lamella. Consequently, the polymer-enhanced foam lasted much longer than conventional foam even in the presence of heavy oil.
3.3. Dynamic Performance of Foam and PEF in the Absence of Heavy Oil
The pressure profile during SAG injection in water-saturated sand pack can be divided into three distinct stages, as shown in Figure 10. The images of sand pack at each of the stages are also shown. Because the porous media was not presaturated with surfactant and the injection method was alternative, a relatively long time was required for the foam generation. During this time, surfactant and gas acted as separate slugs (two phases) and the foam was not generated. This was characteristic of Stage I. It can be said that the shorter length of Stage I demonstrated the better performance of the solution in terms of generating the foam faster within the porous media. The onset of foam generation coincided with the beginning of Stage II. An abrupt increase in pressure profile during SAG injection represented the generation of foam [34]. During Stage II, the foam was generated and propagated through porous media and resulted in an increase in the pressure drop. The slope of this stage shows how fast the foam can propagate within the porous media, and it can be used as criteria for comparing the performance of the foaming solutions. At the end of Stage II, foam occupied the whole length of sand pack and the pressure drop remained constant; this was the onset of Stage III. This stage can be termed as steady state foam injection. Pressure drop remained constant during Stage III; however, there might have been some fluctuations in pressure drop. Small pressure fluctuations during this stage demonstrated the temporary channeling or collapse of foam, which would be recovered at the end of same slug or the next successive slug injection. The sand pack images (Figure 10) show the foam-channeling phenomenon during stage III. Less channeling with lower pressure drop fluctuation can be used as criteria to compare the dynamic stability of the generated foam within the porous media.
The onset of foam generation—Stage II—and abrupt increase in pressure profile was different for all studied foaming solutions studied here (Figure 11). N85 foam had the weakest performance during flow through water-saturated sand pack. Stage III was not observed for N85 foam even after the injection of 9 PV. In addition, the large local pressure drop could be seen during its propagation, demonstrating the low stability of the foam. Although the addition of polymer could not accelerate the N85 foam generation/propagation, it increased its dynamic stability during N85 PEF injection. Pressure drop fluctuations were very low during N85 PEF propagation. Stage III was observed after ~7 PV of injection (Figure 11). These features of N85 PEF compared to that of N85 foam represent its high dynamic stability within the water-saturated porous media.
Mobility reduction factor (MRF) of foam and PEF has a direct relationship to its pressure drop in porous media. MRF here is defined as the ratio of pressure drop across the sand pack when foam is flowing over the pressure drop without foam (i.e., only water is flowing). Higher values of the MRF (or pressure drop) indicate the foam is more finely textured and stronger. If the foam is very strong, the MRF is higher; for weak foams, the MRF values are smaller [35]. Both foam and PEF showed much higher MRF/pressure drop than that for surfactant–polymer (SP) injection. The large pressure difference between SP solution and the corresponding PEF represents the excellent mobility control potential (by increasing apparent viscosity) of PEF for heavy oil recovery, especially in heterogeneous reservoirs by diverting the fluid toward low permeability zones or unswept zones due to unfavorable mobility contrast [36,37].
Figure 12 shows the sand pack images during N85 foam and N85 PEF injection in water-saturated media. Red color represents the liquid, while the white color is for CO2 foam or gas. Although injected foam quality was constant, higher saturation of red color during N85 PEF injection represented higher liquid content (i.e., lower foam quality) of PEF compared to that of N85 foam. During dynamic condition, PEF channeling (if any) was smaller and recovered fast. Nevertheless, during N85 foam injection, larger channeling representing the collapse of foam was evident and abundant, representing the lesser dynamic stability of foam compared to that of PEF. It is worth mentioning that, according to the injection rates of liquid and gas in this study, the generated foam in the porous media was wet foam with relatively high liquid content. Therefore, the behavior presented here is representative of wet foam (50% foam quality) performance in porous media.
3.4. Dynamic Performance of Foam and PEF in the Presence of Heavy Oil
In this section, foam and PEF flooding were conducted by alternate injection of foaming solution and CO2 gas in the heavy-oil-saturated porous media. Anionic AOS and nonionic N85 surfactants were selected for foam injection in dynamic experiments in the presence of heavy oil. All the flooding experiments were performed after reaching a water cut of ~98% during water flooding (residual oil saturation was 66 ± 1%), i.e., residual oil saturation condition to imitate the tertiary recovery process.
Figure 13 shows the pressure and apparent viscosity profiles of foam and PEF propagation in heavy-oil-saturated sand pack for different foaming solutions. The first peak in pressure profile was due to the development of the oil bank through porous media and then its production. The corresponding oil cut was at its highest value at this point. Heins et al. (2014) also made similar observations [38]. At the same experimental condition of permeability, core dimension, flow rate, and viscosities of oil and foaming solution, the observed pressure drop could have a direct relationship with the quality of the generated foam or PEF at this stage. Higher pressure drop represents higher apparent viscosity of foam or PEF within porous media. At the initial stage of foam injection, bubbles first entered larger pore channels with lower entrance capillary pressure and the foam texture was coarse. Then, the local pressure gradient increased because of the increased foam flow resistance, and therefore foam bubbles entered relatively small pore channels [39]. The foam flow repeated this process until the steady state was reached. The pressure increased, and the foam texture became finer as foam entered smaller pore channels because the porous media shaped the foam [40]. According to Figure 13, the strong foam was generated and started to propagate in the case of N85 PEF. This can be explained by high pressure at the early time of injection. However, this was not the case for N85 foam injection.
For detailed analysis, foam/PEF pressure drop, change of residual oil saturation, oil cut, and images of porous media at different injected pore volume are plotted in Figure 14.
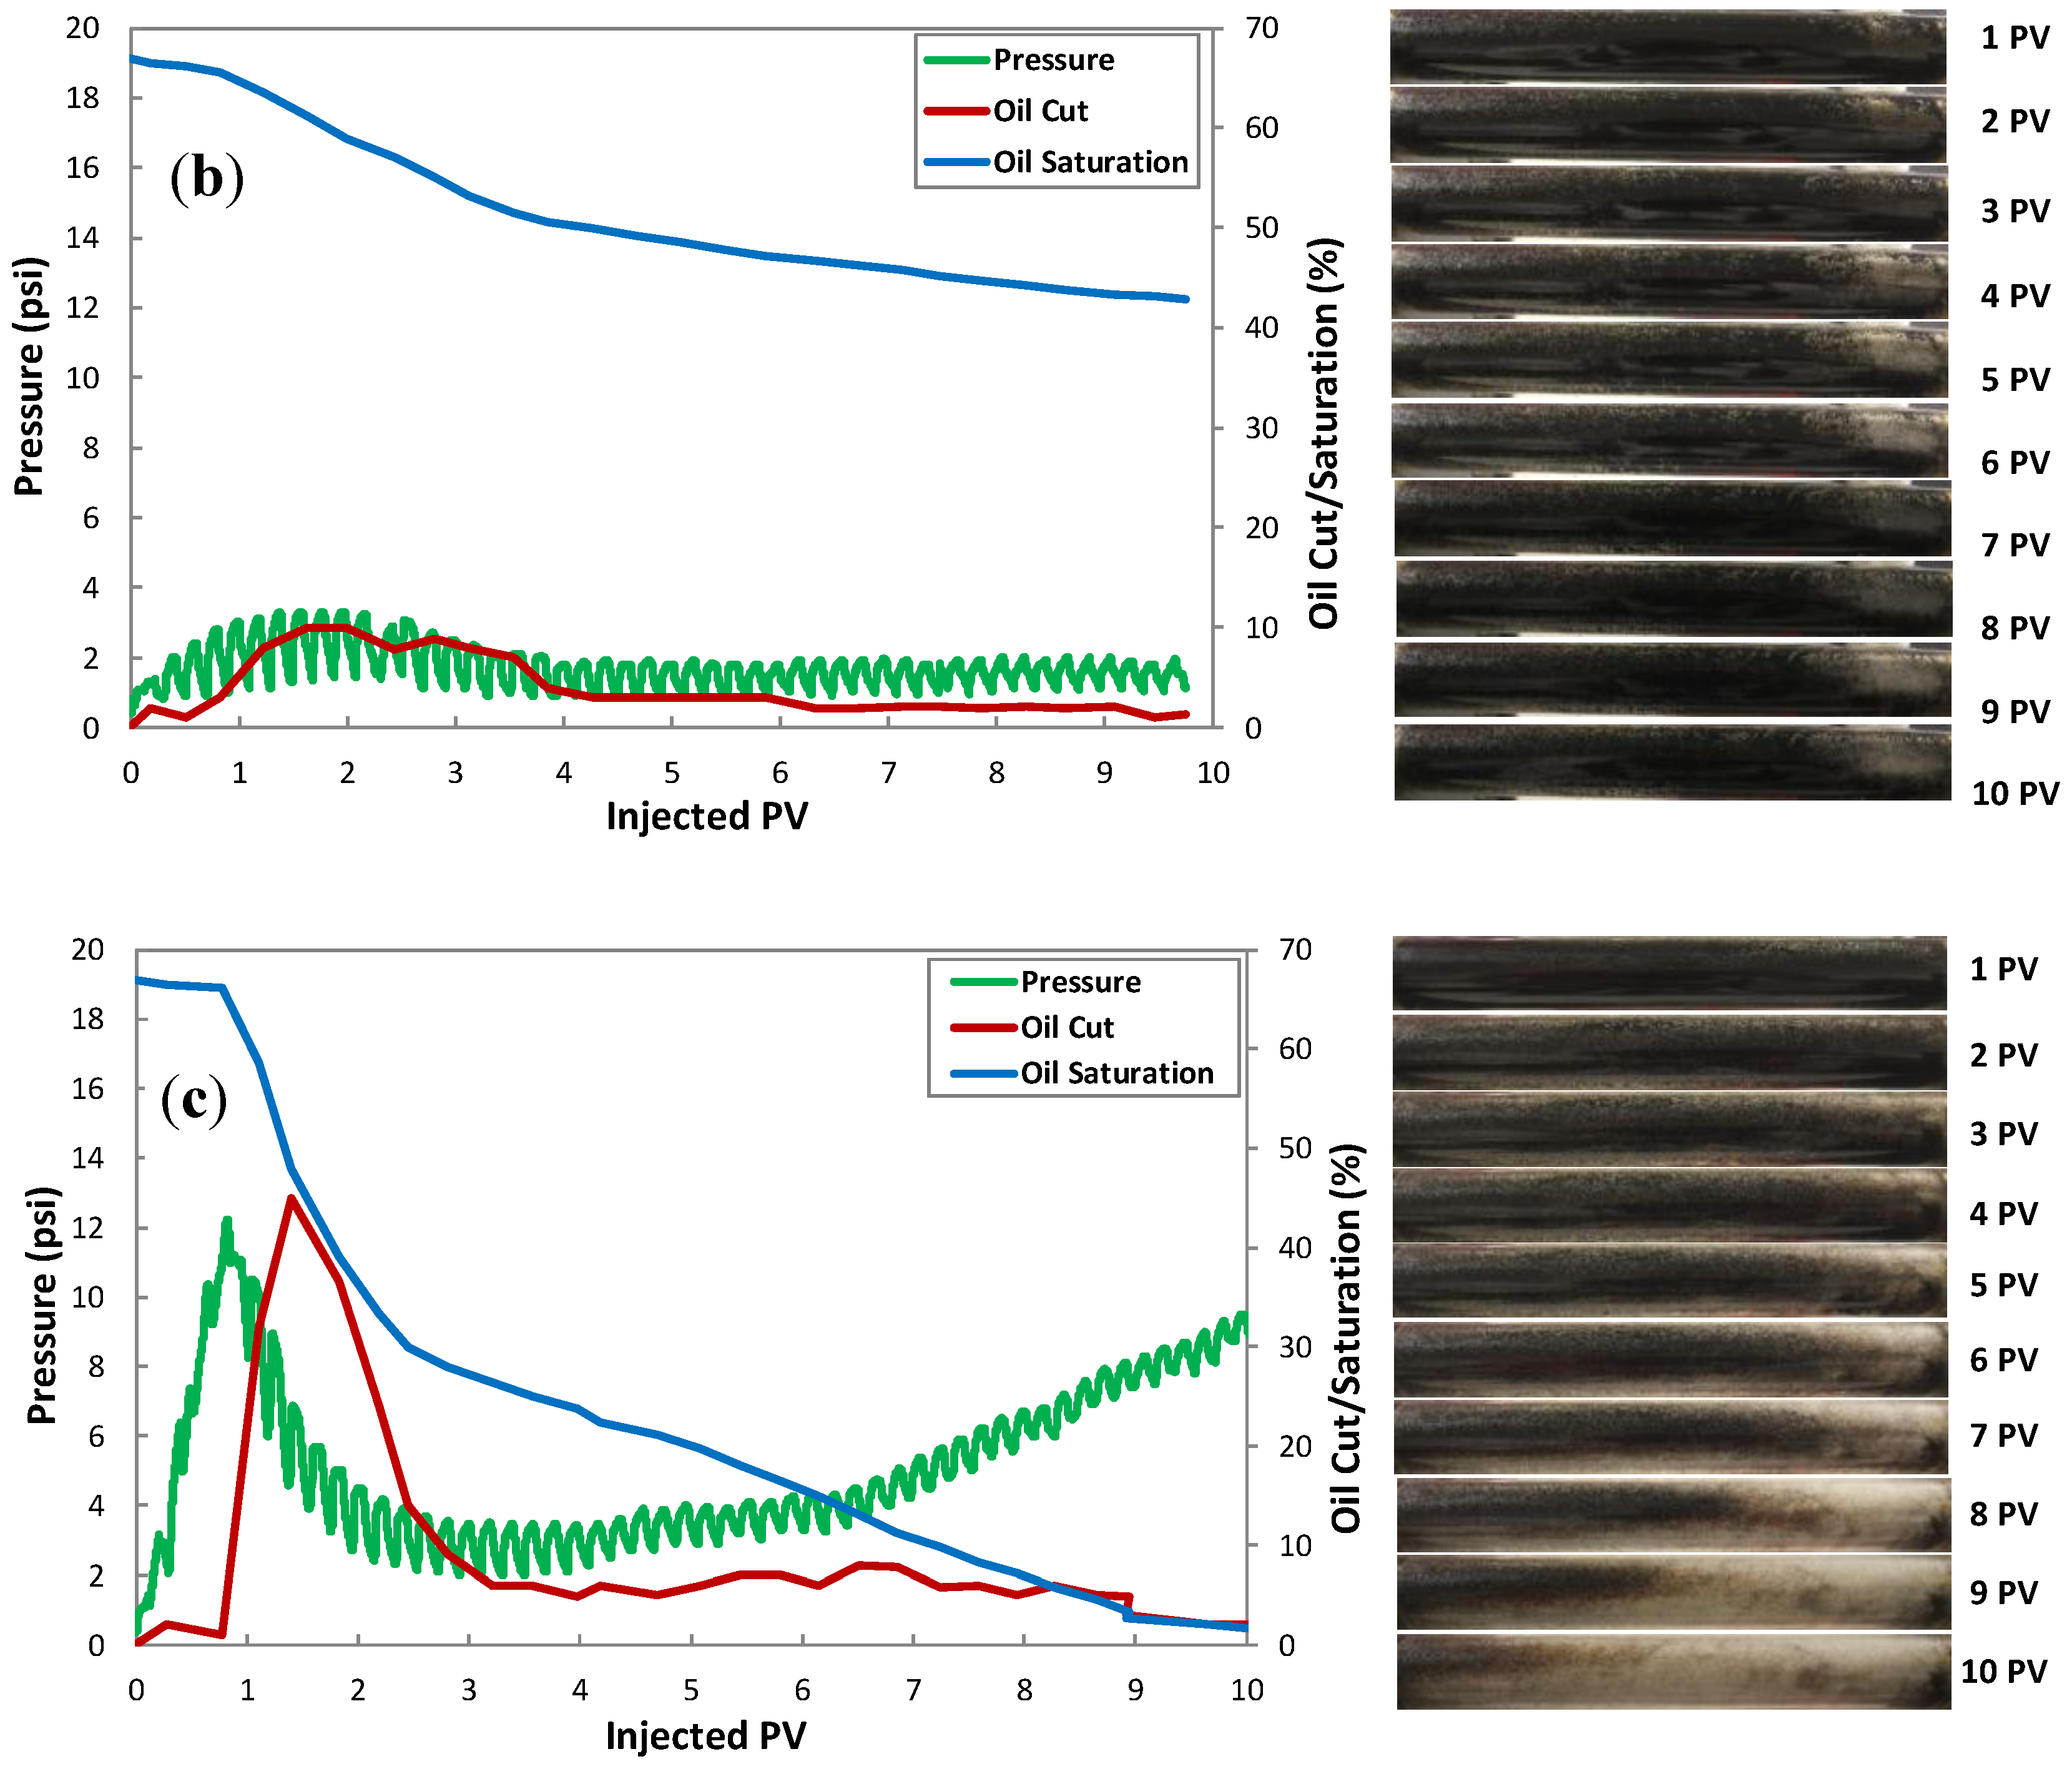
Change in oil saturation is represented as a percentage of the original oil in place. After water flooding, the remaining oil saturation in the sand pack was around 66%. As the water saturation also affects the performance of the foam/PEF, all the tertiary recovery (foam/PEF) was performed with similar water saturation [41]. The weak foaming solutions resulted in a lower apparent viscosity of foam within porous media. For N85 surfactant solution, foam generation was unsuccessful up to 10 PV of SAG injections. After oil bank production, the rate of foam collapse might have been much higher than that of foam generation that resulted in no pressure build up; therefore, stable foam did not propagate through porous media. The addition of polymer into N85 surfactant solution slightly increased the apparent viscosity and resulted in N85 PEF propagation. On the other hand, in the case of AOS foaming solution, foam could generate and propagate through porous media faster than N85 foam. This again shows the importance of selecting a proper foaming agent. The addition of polymer significantly improved the foam propagation through heavy-oil-saturated porous media. Considering the N85 PEF curve, PEF started to propagate (around 4 PV) slightly after oil bank production.
Visual observation of the sand pack (Figure 14) showed that oil appeared to move with the passage of gas bubbles, whereas it had very little movement during liquid injection. These observations are in accordance with Li et al. (2010) [34].
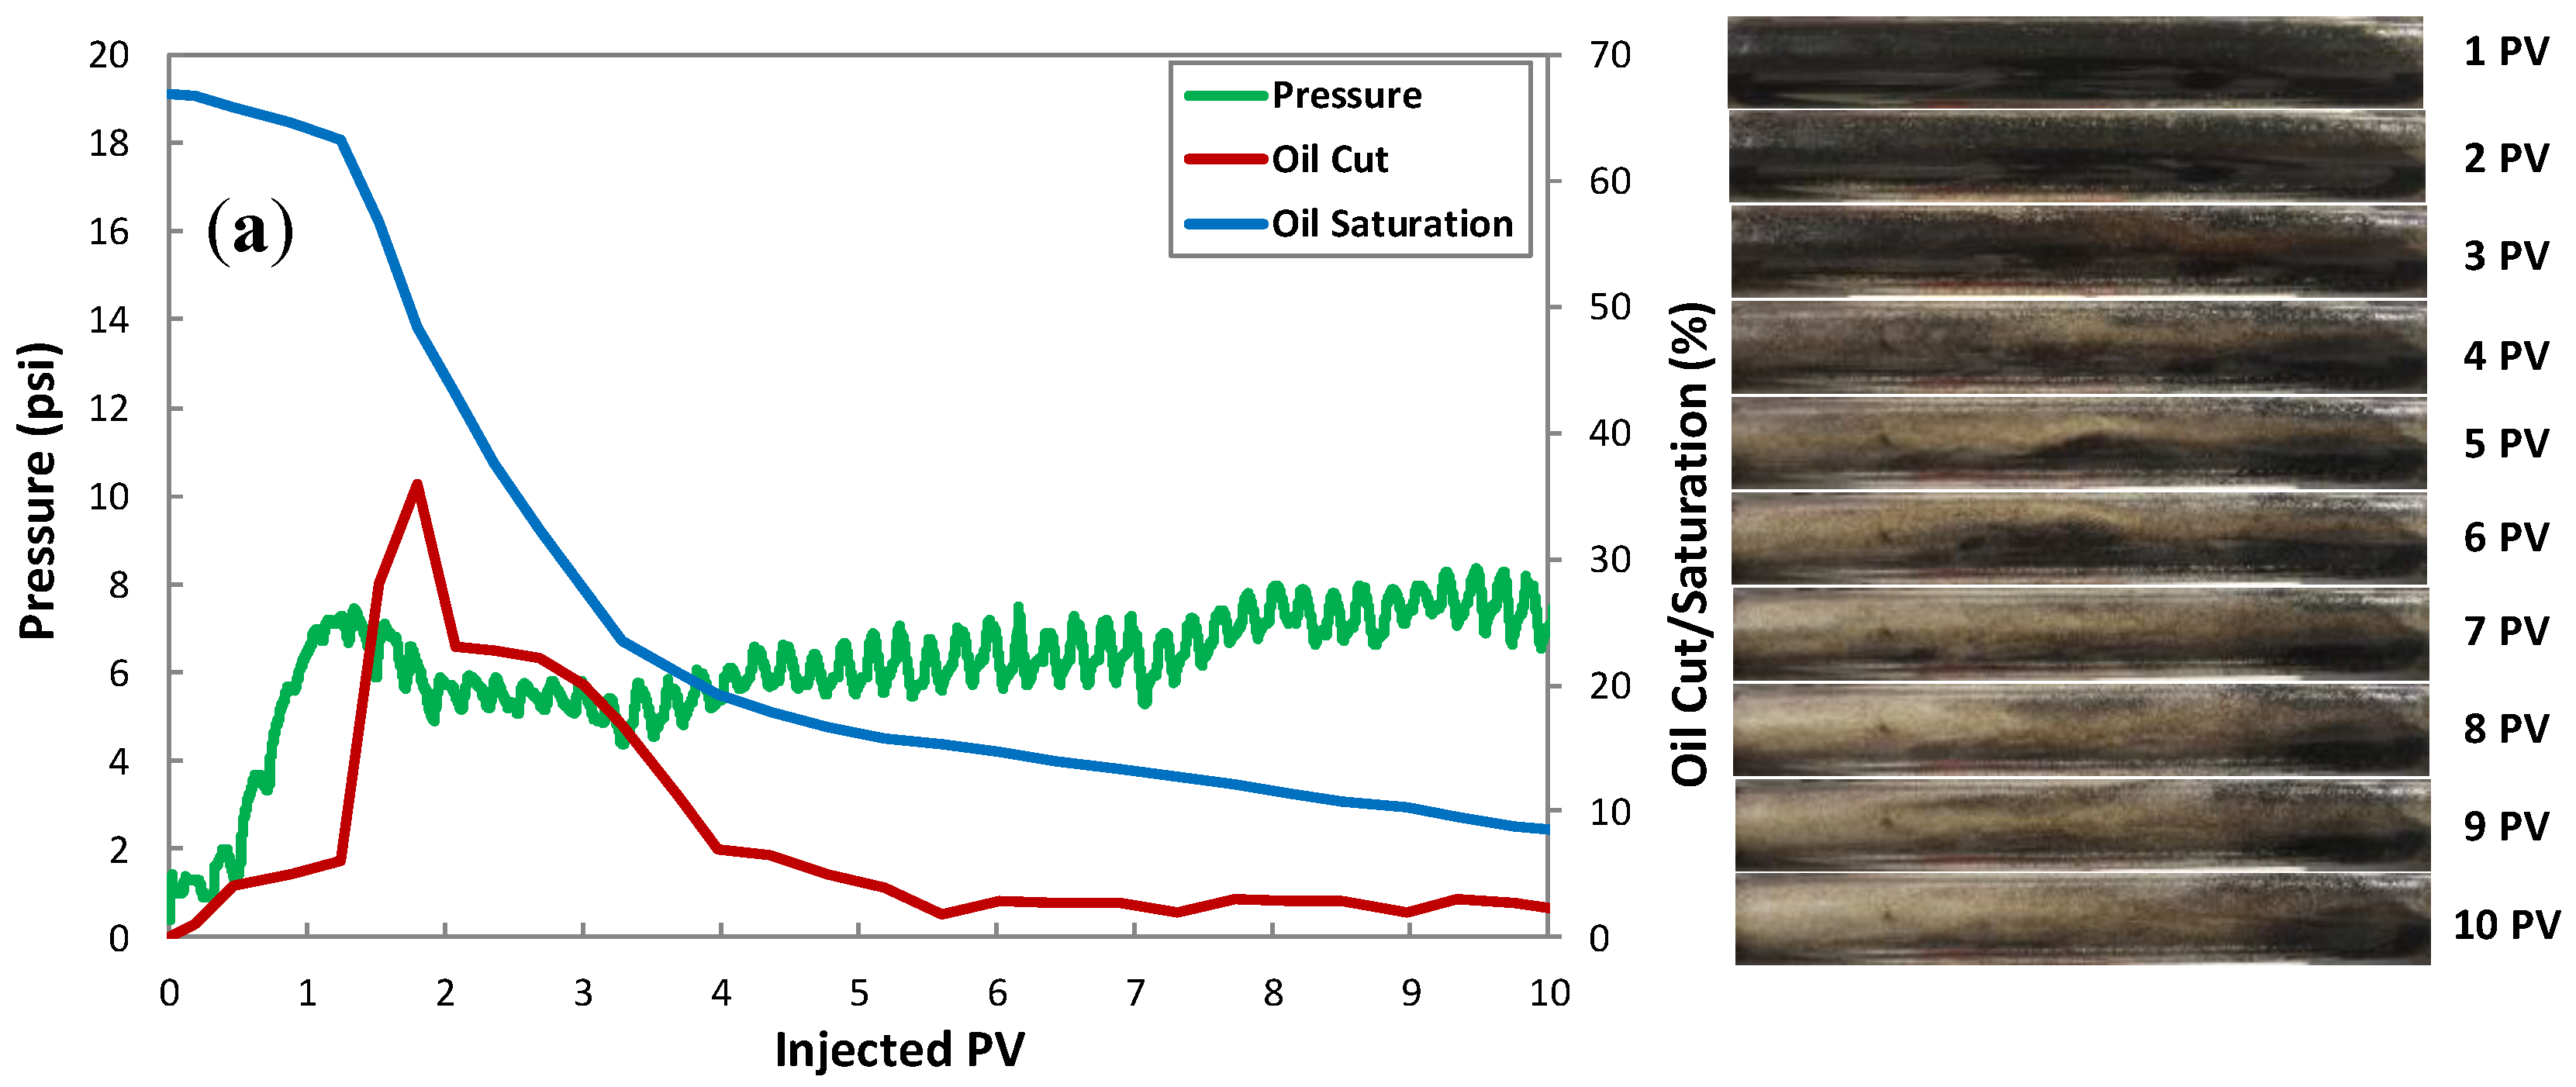
It is worth mentioning that foam generation in the heavy-oil-saturated porous media with residual oil saturation is not similar to that of the water-saturated one. The foam is generated in the areas with lower oil saturation and then propagates to the other area and eventually sweeps the porous media. At this point, the pressure decreases due to the oil bank production and again builds up because of the strong foam propagation. As a result, overall sweep efficiency is improved. Visual images of sand pack confirm this finding. Although ultimate oil recovery of the AOS foam and N85 PEF was similar, piston-like displacement was only observed during N85 PEF injection (Figure 14c). Pressure profile of N85 PEF agrees with the appearance of the porous medium (Figure 14c). After oil bank production around 2 PV, the pressure was almost constant between 2 PV to 5 PV, and there was no significant change in the appearance of the porous medium (change in color). However, after 7 PV, pressure started to increase, and strong foam propagation and piston-like displacement occurred and therefore swept most of the oil. AOS foam also produced a significant amount of residual oil; however, the unstable displacement front and channeling were observed as shown in Figure 14a.
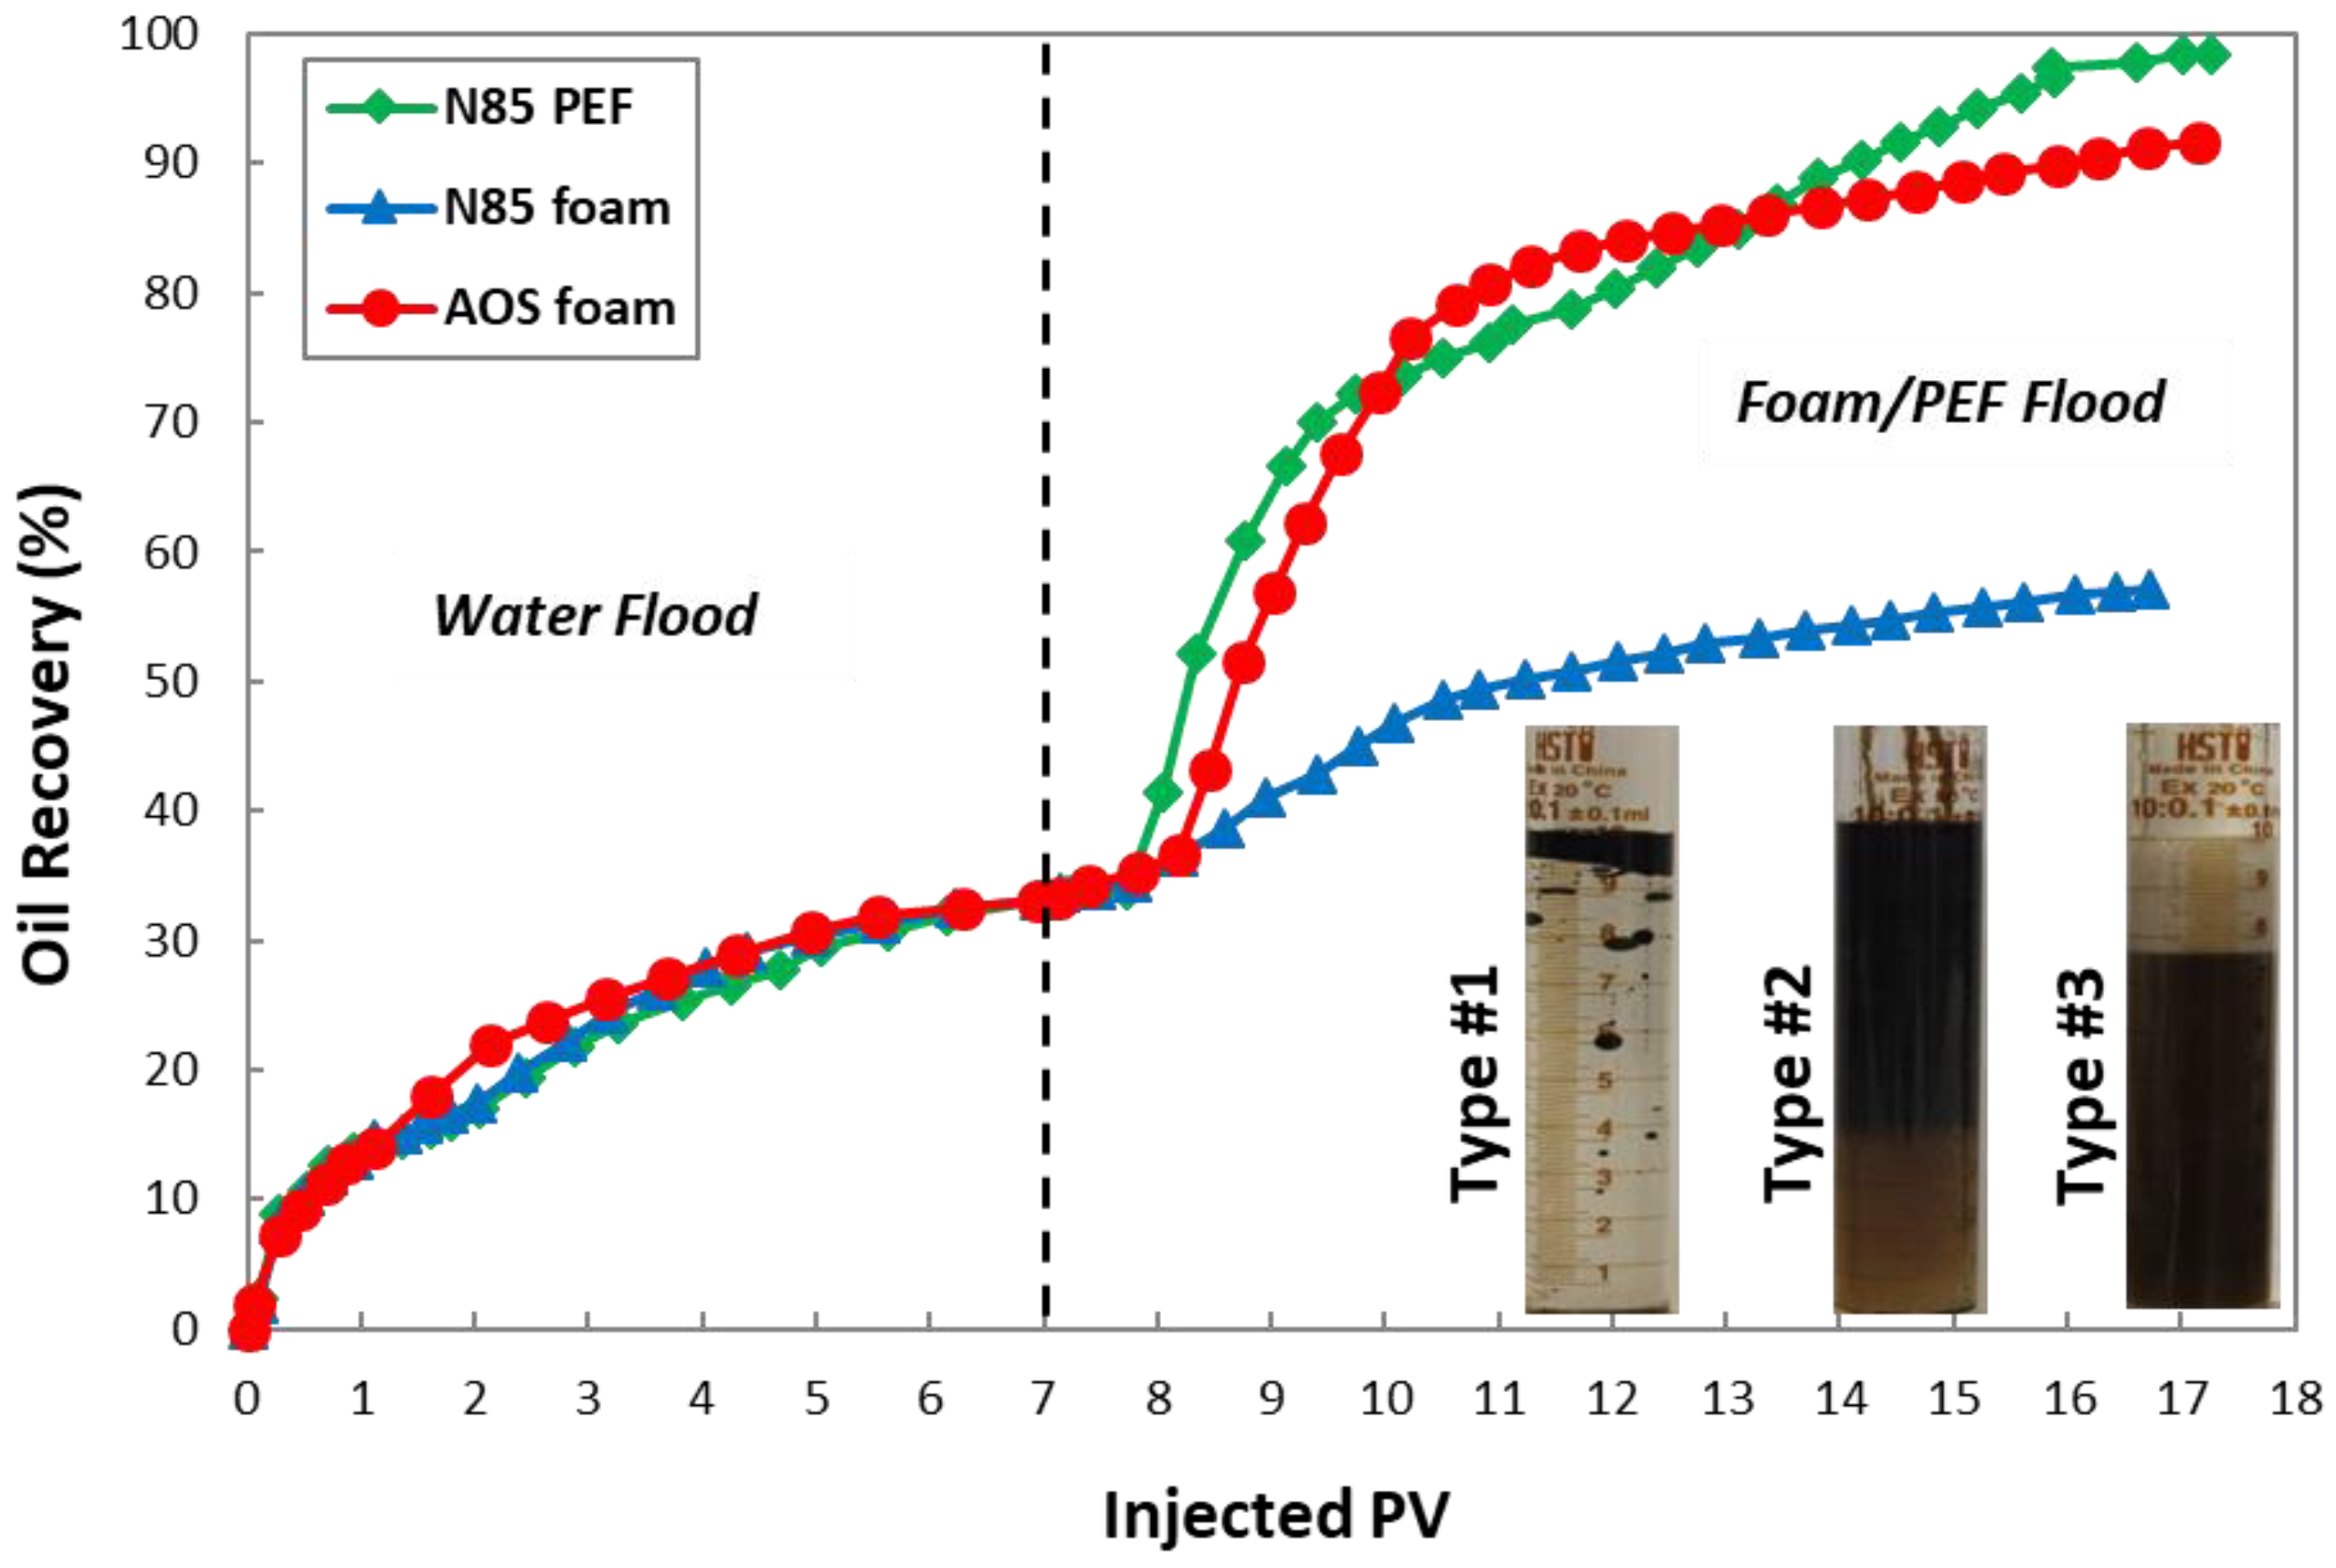
The total heavy oil recovery profiles in water, foam, and PEF flooding are shown in Figure 15. Initial water flood recovery was 33 ± 1% for all experiments at 98% water cut. The N85 PEF had the best performance during heavy oil recovery (total recovery factor of ~98%,) while N85 foam had the lowest recovery among all cases (~57%). The ultimate oil recovery of AOS foam (~91%) was slightly lower than N85 PEF (98%).
Images of typically produced oil samples from foam or PEF flooding are also shown in Figure 15. Emulsified oil was observed from the effluent. The earlier produced samples mainly contained water and some oil as a bulk phase. The produced oil at a later time (after gas breakthrough) was emulsified oil droplet. At end of stage I, when the developed oil bank was produced, the samples consisted of oil-in-water emulsions and free CO2 gas. After that, the oil was produced in the form of oil-in-water emulsions with gas bubbles. The produced foam during PEF injection demonstrated much higher stability compared to that of foam. In addition, it was observed that the produced foam was denser during PEF flooding. It should be mentioned that the amount of chemical (surfactant and/or polymer) can be further minimized by increasing the foam quality if the foam is stable in the presence of heavy crude oil.
It is worth mentioning that the main goal of this study was to analyze the static and dynamic stability of foam in the presence of heavy oil and also to observe the effect of polymer addition. Oil recovery/sweep efficiency showed an improvement in the 1D sand pack. However, further study needs to be done to understand effectiveness in heterogeneous/layered porous media in the presence of heavy oil [42].
4. Conclusions
The presented work investigated the potential of foam and PEF to increase heavy oil recovery. Static and dynamic experiments were designed and conducted to obtain a new insight into the performance of foam and PEF for heavy oil recovery. Although the physics of foam in bulk and porous media are rather different, the results from the detailed static analysis are essential to predict the performance of foaming solutions for heavy oil recovery. Following is a summary of the main conclusions:
The selection of foaming agent plays a key role in the performance of PEF for heavy oil recovery. However, the addition of polymer to a weak foaming agent (e.g., N85 surfactant in this study) may enhance the performance of foam in the presence of oil in dynamic experiments.
- Entering and spreading coefficient values are required for discussion of oil–foam interaction, but these may not be enough. Pseudoemulsion film stability should also be considered to support the results of foam stability. Some oils (e.g., mineral oil in this study) may increase the stability of a foam system, which is not expected from the entering and spreading coefficients.
- The porous media experiments have shown better performance of PEF in the presence of heavy oil compared to that of foam. The addition of polymer to the N85 foaming solution accelerates the foam generation and increases its stability in heavy-oil-saturated porous media. In our study, N85 PEF produced 98% of residual oil saturation, while this value was only about 57% for N85 foam.
- Overall, both static and dynamic performances of foam and PEF have shown their potential as displacing fluid for enhanced heavy oil recovery.
Author Contributions
Conceptualization, A.T. and J.J.T.; Methodology, A.T.; Formal Analysis, A.T.; Investigation, A.T. and J.J.T.; Resources, J.J.T.; Writing-Original Draft Preparation, A.T.; Supervision, J.J.T.
Funding
This research was funded by Carbon Management Canada (CMC), the Natural Sciences and Engineering Research Council of Canada (NSERC), and Alberta Innovates Technology Futures (AITF).
Acknowledgments
The authors are grateful to Carbon Management Canada (CMC), the Natural Sciences and Engineering Research Council of Canada (NSERC), Alberta Innovates Technology Futures (AITF), and the University of Alberta for supporting this study. As a part of the University of Alberta’s Future Energy Systems research initiative, this research was made possible in part thanks to funding from the Canada First Research Excellence Fund.
Conflicts of Interest
The authors declare no conflict of interest.
References
- Hirasaki, G.J. The Steam-Foam Process. J. Pet. Technol. 1989, 41, 449–456. [Google Scholar] [CrossRef]
- Zhou, Z.H.; Rossen, W.R. Applying Fractional-Flow Theory to Foam Processes at the Limiting Capillary Pressure. SPE Adv. Technol. 1995, 3, 154–162. [Google Scholar] [CrossRef]
- Smith, D.H. (Ed.) Surfactant-Based Mobility Control: Progress in Miscible-Flood Enhanced Oil Recovery; American Chemical Society Symposium Seri Number 373; American Chemical Society: Washington, DC, USA, 1988; p. 449. [Google Scholar]
- Lake, L.W. Enhanced Oil Recovery; Prentice Hall: Upper Saddle River, NJ, USA, 1989; p. 550. [Google Scholar]
- Zhang, Y.; Yue, X.; Dong, J.; Yu, L. New and Effective Foam Flooding To Recover Oil in Heterogeneous Reservoir. Presented at the SPE/DOE Improved Oil Recovery Symposium, Tulsa, OK, USA, 3–5 April 2000. [Google Scholar]
- Ransohoff, T.C.; Radke, C.J. Mechanisms of Foam Generation in Glass-Bead Packs. SPE Reserv. Eng. 1988, 3, 573–585. [Google Scholar] [CrossRef] [Green Version]
- Rossen, W.R.; Gauglitz, P.A. Percolation Theory of Creation and Mobilization of Foam in Porous Media. AIChE J. 1990, 36, 1176–1188. [Google Scholar] [CrossRef]
- Tanzil, D.; Hirasaki, G.J.; Miller, C.A. Conditions for Foam Generation in Homogeneous Porous Media. Presented at the SPE/DOE Symposium on Improved Oil Recovery, Tulsa, OK, USA, 13–17 April 2002. [Google Scholar]
- Gauglitz, P.A.; Friedmann, F.; Kam, S.I.; Rossen, W.R. Foam generation in homogeneous porous media. J. Chem. Eng. Sci. 2002, 57, 4037–4052. [Google Scholar] [CrossRef]
- Mattews, C.S. Carbon Dioxide Flooding, in Enhanced Oil Recovery II: Processes and Operations; Donaldson, E.C., Chilingarian, G.V., Yen, T.F., Eds.; Elsevier Scientific Publishing Company: New York, NY, USA, 1989; p. 603. [Google Scholar]
- Heller, J.P. CO2 Foams in Enhanced Oil Recovery, in Foams: Fundamentals and Applications in the Petroleum Industry; Schramm, L.L., Ed.; ACS Advances in Chemistry Series, 3, No. 242; American Chemical Society: Washington, DC, USA, 1994; p. 201. [Google Scholar]
- Vikingstad, A.K.; Skauge, A.; Hoiland, H.; Aarra, M.G. Foam-oil interactions analyzed by static foam tests. Colloids Surf. A Physiochem. Eng. Asp. 2005, 260, 189–198. [Google Scholar] [CrossRef]
- Andrianov, A.; Farajzadeh, R.; Mahmoodi Nick, M.; Talanana, M.; Zitha, P.L.J. Immiscible foam for enhancing oil recovery: Bulk and porous media experiments. Ind. Eng. Chem. Res. 2012, 51, 2214–2226. [Google Scholar] [CrossRef]
- Schramm, L.L.; Novosad, J.J. The destabilization of foams for improved oil recovery by crude oils: Effect of the nature of the oil. J. Pet. Sci. Eng. 1992, 7, 77–90. [Google Scholar] [CrossRef]
- Koczo, K.; Lobo, L.; Wasan, D.T. Effect of oil on foam stability: Aqueous film stabilized by emulsions. J. Colloid Interface Sci. 1992, 150, 492–506. [Google Scholar] [CrossRef]
- Farajzadeh, R.; Andrianov, A.; Zitha, P.L.J. Investigation of Immiscible and Miscible Foam for Enhancing Oil Recovery. Ind. Eng. Chem. Res. 2010, 49, 1910–1919. [Google Scholar] [CrossRef]
- Simjoo, M.; Rezaei, T.; Andrianov, A.; Zitha, P.L.J. Foam stability in the presence of oil: Effect of surfactant concentration and oil type. Colloids Surf. A Physiochem. Eng. Asp. 2013, 438, 148–158. [Google Scholar] [CrossRef]
- Nikolov, A.D.; Wasan, D.T.; Huang, D.W.; Edwards, D.A. The Effect of Oil on Foam Stability: Mechanisms and Implications for Oil Displacement by Foam in Porous Media. Presented at the SPE Annual Technical Conference and Exhibition, New Orleans, LA, USA, 5–8 October 1986. [Google Scholar]
- Yan, W.; Miller, C.A.; Hirasaki, G.J. Foam sweep in fractures for enhanced oil recovery. Colloids Surf. A Physicochem. Eng. Asp. 2006, 282–283, 348–359. [Google Scholar] [CrossRef]
- Flick, E.W. Industrial Surfactants, 2nd ed.; Noyes Publications: Park Ridge, NJ, USA, 1993; p. 547. [Google Scholar]
- Urban, D.G. How to Formulate and Compound Industrial Detergents; Book Surge Publishing: Charleston, CA, USA, 2003; p. 234. [Google Scholar]
- Rosen, M.J.; Kunjappu, J.T. Surfactants and Interfacial Phenomena, 4th ed.; John Wiley & Sons, Inc.: Hoboken, NJ, USA, 2012; p. 616. [Google Scholar]
- Verwey, E.J.W.; Overbeek, J.T.G. Theory of the Stability of Lyophobic Colloids; Elsvier: Amsterdam, The Netherlands, 1948; p. 216. [Google Scholar]
- Marinova, K.G.; Dimitrova, L.M.; Marinov, R.Y.; Denkov, N.D.; Kingma, A. Impact of the Surfactant Structure on the Foaming/Defoaming Performance of Nonionic Block Copolymers in Na Caseinate Solutions. Bulg. J. Phys. 2012, 39, 53–64. [Google Scholar]
- Israelachvili, J.N. Intermolecular & Surface Forces, 3rd ed.; Academic Press: San Diego, CA, USA, 2010; p. 710. [Google Scholar]
- Schramm, L.L.; Wassmuth, F. Foams: Basic Principles in Foams: Fundamentals and Application in the Petroleum Industry; Schramm, L.L., Ed.; American Chemical Society: Washington, DC, USA, 1994; p. 201. [Google Scholar]
- Denkov, N.D. Mechanisms of Foam Destruction by Oil-Based Antifoams. Langmuir 2004, 20, 9463–9505. [Google Scholar] [CrossRef] [PubMed]
- Rio, E.; Drenckhan, W.; Salonen, A.; Langevin, D. Unusually stable liquid foams. Adv. Colloid Interface Sci. 2014, 205, 74–86. [Google Scholar] [CrossRef] [PubMed]
- Salonen, A.; Lhermerout, R.; Rio, E.; Langevin, D.; Saint-Jalmes, A. Dual gas and oil dispersions in water: Production and stability of foamulsion. Soft Matter 2012, 8, 699–706. [Google Scholar] [CrossRef]
- Manlowe, D.J.; Radke, C.J. A Pore-Level Investigation of Foam/Oil Interactions in Porous Media. SPE Reserv. Eng. 1990, 5, 495–502. [Google Scholar] [CrossRef]
- Hadjiiski, A.; Denkov, N.D.; Tcholakova, S.; Ivanov, I.B. Role of entry barriers in the foam destruction by oil drops. In Adsorption and Aggregation of Surfactants in Solution; Mittal, K.L., Shah, D.O., Eds.; Marcel Dekker: New York, NY, USA, 2003; pp. 465–498. [Google Scholar]
- Ross, S.; Suzin, Y. Measurement of Dynamic Foam Stability. Langmuir 1985, 1, 145–149. [Google Scholar] [CrossRef]
- Martinez, A.C.; Rio, E.; Delon, G.; Saint-Jalmes, A.; Langevin, D.; Binks, B.P. On the origin of the remarkable stability of aqueous foams stabilised by nanoparticles: Link with microscopic surface properties. Soft Matter 2008, 4, 1531–1535. [Google Scholar] [CrossRef]
- Li, R.F.; Yan, W.; Liu, S.; Hirasaki, G.; Miller, C.A. Foam Mobility Control for Surfactant Enhanced Oil Recovery. SPE J. 2010, 15, 934–948. [Google Scholar] [CrossRef]
- Kovscek, A.R. Reservoir Simulation of Foam Displacement Processes. Presented at the 7th UNITAR International Conference on Heavy Crude and Tar Sands, Beijing, China, 27–31 October 1998. [Google Scholar]
- Telmadarreie, A.; Trivedi, J.J. Post-Surfactant CO2 Foam/Polymer-Enhanced Foam Flooding for Heavy Oil Recovery: Pore-Scale Visualization in Fractured Micromodel. Transp. Porous Media 2016, 113, 717–733. [Google Scholar] [CrossRef]
- Telmadarreie, A.; Trivedi, J.J. New Insight on Carbonate-Heavy-Oil Recovery: Pore-Scale Mechanisms of Post-Solvent Carbon Dioxide Foam/Polymer-Enhanced-Foam Flooding. SPE J. 2016, 21, 1655–1668. [Google Scholar] [CrossRef]
- Heins, R.; Simjoo, M.; Zitha, P.L.J.; Rossen, W.R. Oil Relative Permeability during Enhanced Oil Recovery by Foam Flooding. Presented at the SPE Annual Technical Conference and Exhibition, Amsterdam, The Netherlands, 27–29 October 2014. SPE 170810. [Google Scholar]
- Farshbaf Zinati, F.; Farajzadeh, R.; Zitha, P.L.J. Modeling and CT scan Study of the Effect of Core Heterogeneity on Foam Flow for Acid Diversion. Presented at the European Formation Damage Conference, Scheveningen, The Netherlands, 30 May–1 June 2007. SPE 107790. [Google Scholar]
- Ettinger, R.A.; Radke, C.J. Influence of Texture on Steady Foam Flow in Berea Sandstone. SPE Reserv. Eng. 1992, 7, 83–90. [Google Scholar] [CrossRef] [Green Version]
- Zanganeh, M.N.; Kam, S.I.; LaForce, T.; Rossen, W.R. The Method of Characteristics Applied to Oil Displacement by Foam. SPE J. 2011, 16, 8–23. [Google Scholar] [CrossRef]
- Kovscek, A.R.; Bertin, H.J. Foam Mobility in Heterogeneous Porous Media. Transp. Porous Media 2003, 52, 17–35. [Google Scholar] [CrossRef]
Figure 1.
Schematic of CO2 foam/polymer-enhanced foam (PEF) flooding system.

Figure 2.
(a) Foamability and half-life values for studied surfactants: anionic dodecylbenzenesulfonate (DDBS) and C14–C16 alpha olefin sulfonate (AOS), nonionic N85, and cationic cetyltrimethylammonium bromide (CTAB). Polymer increased foam stability but decreased the foamability of surfactants (numbers represent the quality of foam/PEF). (b) Liquid drainage profiles of the foam and PEF generated with the N85 surfactant.

Figure 3.
Effect of heavy oil and mineral oil on (a) foamability and (b) foam stability of studied foams and N85 PEF; (c) decay profile of N85 foam and PEF in the presence of heavy oil.
Figure 3.
Effect of heavy oil and mineral oil on (a) foamability and (b) foam stability of studied foams and N85 PEF; (c) decay profile of N85 foam and PEF in the presence of heavy oil.

Figure 4.
Foam decay profile for N85 (nonionic) and DDBS (anionic) surfactants considering the effect of (a) heavy oil and (b) mineral oil. Images correspond to DDBS foam (5× magnification).
Figure 4.
Foam decay profile for N85 (nonionic) and DDBS (anionic) surfactants considering the effect of (a) heavy oil and (b) mineral oil. Images correspond to DDBS foam (5× magnification).
Figure 5.
Air diffusion from the small bubbles toward the larger ones leads to the disappearance of the small bubbles and to the gradual accumulation of oil drops in the nodes and the Plateau borders during stage II (DDBS foam with heavy oil). Images (b) were captured seconds after images (a).
Figure 5.
Air diffusion from the small bubbles toward the larger ones leads to the disappearance of the small bubbles and to the gradual accumulation of oil drops in the nodes and the Plateau borders during stage II (DDBS foam with heavy oil). Images (b) were captured seconds after images (a).

Figure 6.
Oil droplets overcome the electrostatic interactions and break a foam lamella during stage III; DDBS foam with heavy oil (2×magnification). Lamella highlighted in image (a) breaks in image (b). Images (b) were captured seconds after images (a).
Figure 6.
Oil droplets overcome the electrostatic interactions and break a foam lamella during stage III; DDBS foam with heavy oil (2×magnification). Lamella highlighted in image (a) breaks in image (b). Images (b) were captured seconds after images (a).
Figure 7.
Images of foam generated with DDBS surfactant and heavy oil after (a) 3 min and (b) one hour; oil saturation increased within the lamella over time (foam top, 2× magnification).
Figure 7.
Images of foam generated with DDBS surfactant and heavy oil after (a) 3 min and (b) one hour; oil saturation increased within the lamella over time (foam top, 2× magnification).

Figure 8.
Flocculation and coalescence of oil droplets within the foam lamella resulting in the generation of oil lenses that eventually destabilize the foam (5× magnification).
Figure 8.
Flocculation and coalescence of oil droplets within the foam lamella resulting in the generation of oil lenses that eventually destabilize the foam (5× magnification).

Figure 9.
Microscopic image of foam–oil systems showing oil emulsion within the lamella (10× magnification); (a) heavy oil + N85 foam, (b) mineral oil + N85 foam. Images were taken immediately after foam generation.
Figure 9.
Microscopic image of foam–oil systems showing oil emulsion within the lamella (10× magnification); (a) heavy oil + N85 foam, (b) mineral oil + N85 foam. Images were taken immediately after foam generation.
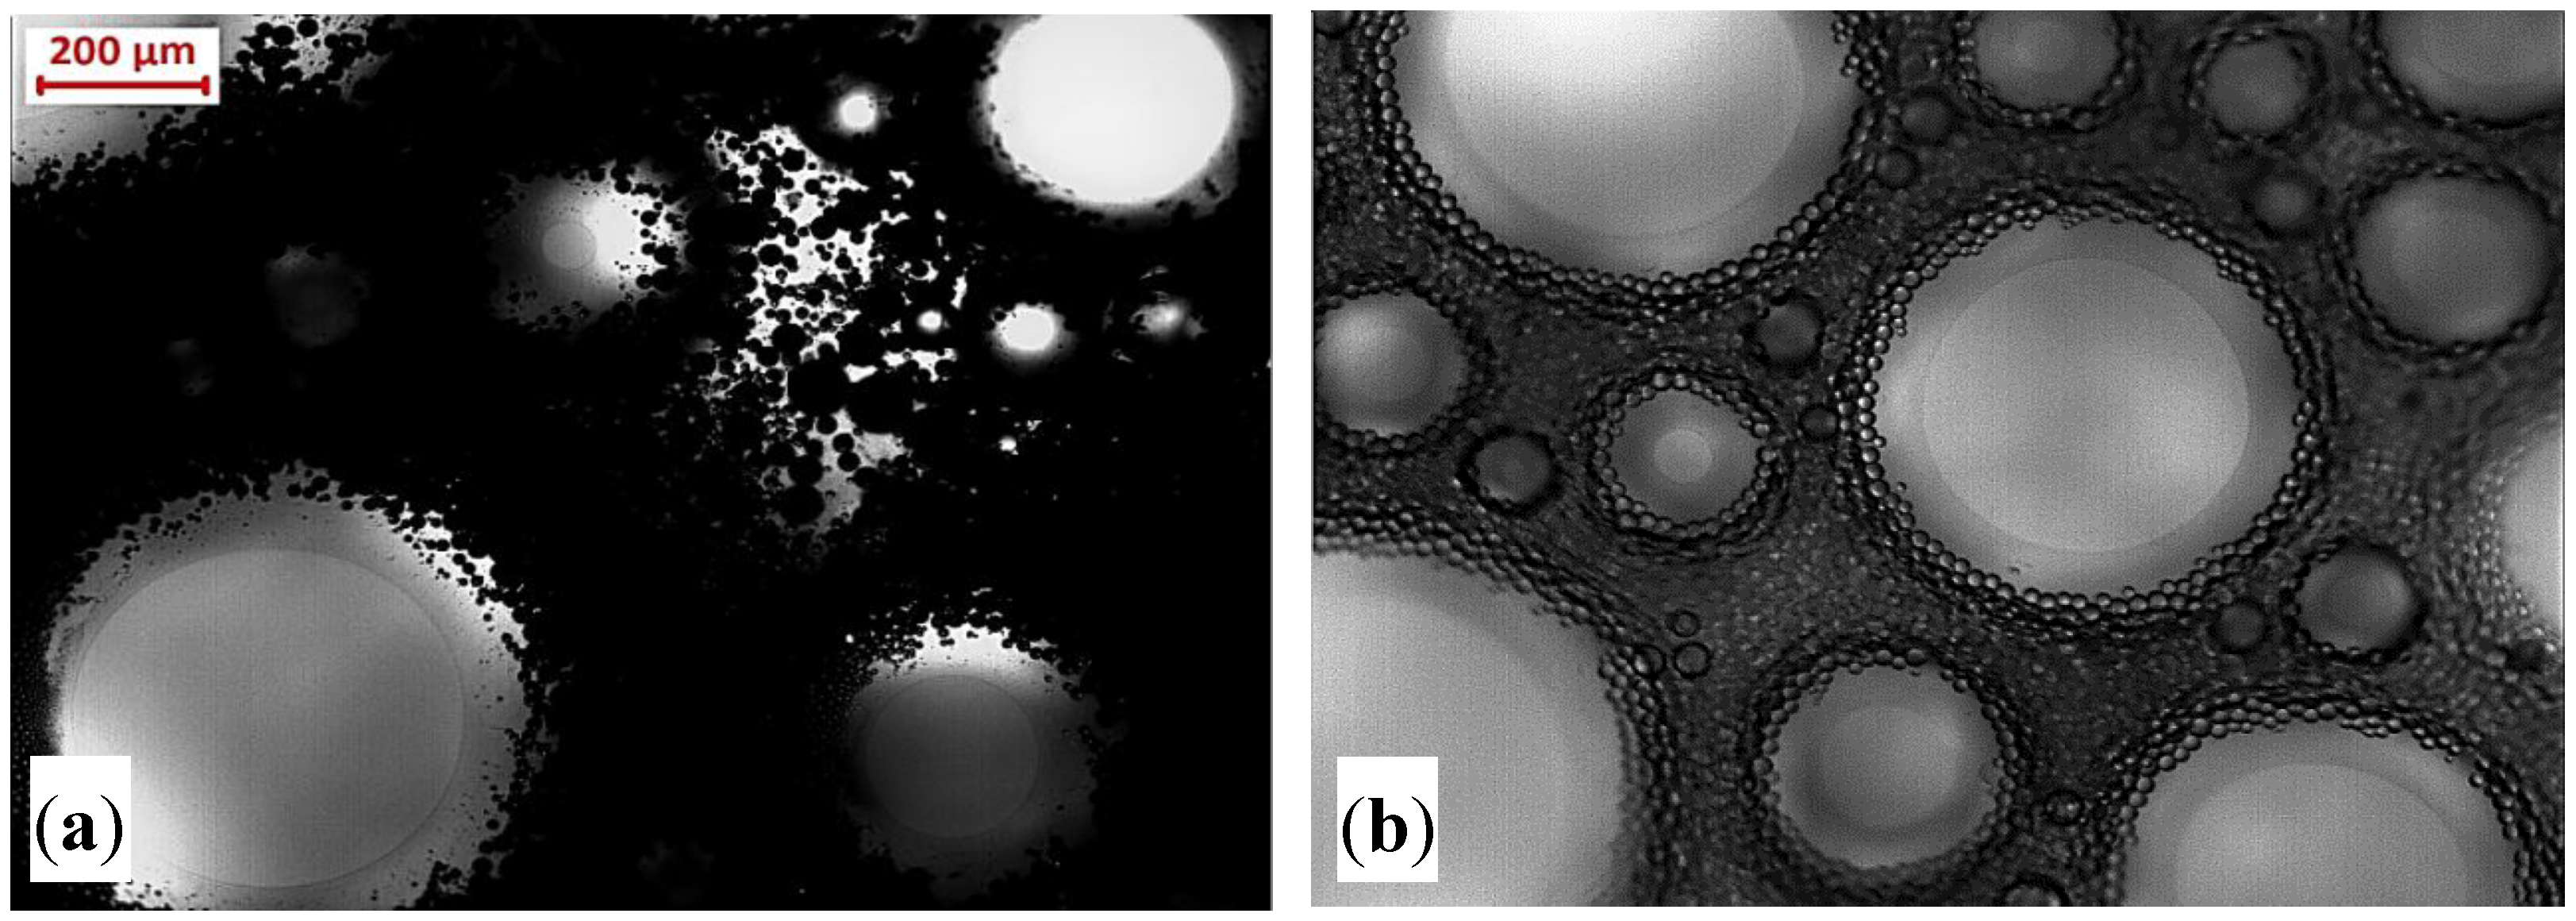
Figure 10.
The typical profile of pressure during surfactant alternating gas (SAG) injection in water-saturated porous media. Red and white colors show the existence of liquid and foam, respectively. Images on the right show the foam flow within a pore volume as highlighted in the figure.
Figure 10.
The typical profile of pressure during surfactant alternating gas (SAG) injection in water-saturated porous media. Red and white colors show the existence of liquid and foam, respectively. Images on the right show the foam flow within a pore volume as highlighted in the figure.

Figure 11.
Foam, PEF, and surfactant–polymer (SP) pressure/apparent viscosity profiles during flow through water-saturated sand pack.
Figure 11.
Foam, PEF, and surfactant–polymer (SP) pressure/apparent viscosity profiles during flow through water-saturated sand pack.

Figure 12.
(a) In situ foam quality and (b) foam dynamic stability of N85 foaming solution in a dynamic condition; PEF showed lower foam quality but higher dynamic stability (less channeling) than that of foam.
Figure 12.
(a) In situ foam quality and (b) foam dynamic stability of N85 foaming solution in a dynamic condition; PEF showed lower foam quality but higher dynamic stability (less channeling) than that of foam.

Figure 13.
Pressure profiles and apparent viscosity during foam and PEF flow through heavy-oil-saturated sand pack.
Figure 13.
Pressure profiles and apparent viscosity during foam and PEF flow through heavy-oil-saturated sand pack.

Figure 14.
Pressure, oil saturation, and oil cut profiles during heavy oil recovery by foam/PEF; (a) AOS foam, (b) N85 foam, and (c) N85 PEF.
Figure 14.
Pressure, oil saturation, and oil cut profiles during heavy oil recovery by foam/PEF; (a) AOS foam, (b) N85 foam, and (c) N85 PEF.


Figure 15.
Total heavy oil recovery profiles during water and foam/PEF flooding with different foaming solutions. The images show the foam/PEF flooding effluent samples; Type #1: bulk oil and water, Type #2: oil-in-water emulsion and free gas, and Type #3: oil-in-water emulsion and foam.
Figure 15.
Total heavy oil recovery profiles during water and foam/PEF flooding with different foaming solutions. The images show the foam/PEF flooding effluent samples; Type #1: bulk oil and water, Type #2: oil-in-water emulsion and free gas, and Type #3: oil-in-water emulsion and foam.


Table 1.
Summary of dynamic experiments performed on visual sand pack with and without the presence of heavy oil.
Table 1.
Summary of dynamic experiments performed on visual sand pack with and without the presence of heavy oil.
| Experiment | Porous Media Length (cm) | Ø (%) | K (D) | Soi (%) | WF-RF (%) | Total RF (%) |
|---|---|---|---|---|---|---|
| AOS Foam | 24.5 | 36.28 | 37.75 | NA | NA | NA |
| 24.3 | 36.85 | 37.42 | 92.5 | 33 | 91.6 | |
| N85 Foam | 24.5 | 36.67 | 37.88 | NA | NA | NA |
| 24.4 | 37.22 | 37.72 | 93.4 | 33.1 | 57 | |
| N85 PEF | 24.4 | 37.22 | 38.19 | NA | NA | NA |
| 24.4 | 36.82 | 37.91 | 92.3 | 33 | 98 |
Table 2.
Interfacial tension (IFT) value (at 25 °C), entering and spreading coefficients of studied surfactants in the presence of oils.
Table 2.
Interfacial tension (IFT) value (at 25 °C), entering and spreading coefficients of studied surfactants in the presence of oils.
| Surfactant Solution (0.29 wt%) | Mineral Oil | Heavy Oil | ||||
|---|---|---|---|---|---|---|
| IFT (mN/m) | E | S | IFT (mN/m) | E | S | |
| N85 | 0.51 | 7.21 | 6.19 | 0.58 | 10.08 | 8.92 |
| DDBS | 0.33 | 3.03 | 2.37 | 0.54 | 6.04 | 4.96 |
| AOS | 0.50 | 4.7 | 3.7 | 1.10 | 7.7 | 5.7 |
| CTAB | 0.16 | 9.56 | 9.24 | 0.90 | 12.9 | 11.1 |
© 2018 by the authors. Licensee MDPI, Basel, Switzerland. This article is an open access article distributed under the terms and conditions of the Creative Commons Attribution (CC BY) license (http://creativecommons.org/licenses/by/4.0/).
Share and Cite
MDPI and ACS Style
Telmadarreie, A.; Trivedi, J.J. Static and Dynamic Performance of Wet Foam and Polymer-Enhanced Foam in the Presence of Heavy Oil. Colloids Interfaces 2018, 2, 38. https://doi.org/10.3390/colloids2030038
AMA Style
Telmadarreie A, Trivedi JJ. Static and Dynamic Performance of Wet Foam and Polymer-Enhanced Foam in the Presence of Heavy Oil. Colloids and Interfaces. 2018; 2(3):38. https://doi.org/10.3390/colloids2030038
Chicago/Turabian StyleTelmadarreie, Ali, and Japan J. Trivedi. 2018. "Static and Dynamic Performance of Wet Foam and Polymer-Enhanced Foam in the Presence of Heavy Oil" Colloids and Interfaces 2, no. 3: 38. https://doi.org/10.3390/colloids2030038