1. Introduction
Concentrated colloidal particle suspensions are found in a wide range of daily products (e.g., milk, cosmetics) and industrial products/processes (e.g., mineral pulp, drug production). Precise understanding and manipulation of interactions within such a particle suspension and its resulting bulk behavior are thus of great interest and importance in both science and engineering. In this work, our primary interest is submicron to micron size particle aqueous suspensions relevant to the current and long-lasting challenges associated with colloidal particle processing/separation (e.g., [
1]) and their characterization methods (e.g., [
2,
3]).
The majority of characterization methods either requires some special sample preparation, or those suitable for direct characterization of particle behavior in a solution require a very small volume fraction of particles (e.g., 1 × 10
−5 vol % for dynamic light scattering [
4]) due to the strength of the interaction between light and the particle suspension [
5]. Furthermore, when the linkage between microscopic structure and bulk properties of a suspension is affected by an external field, such as a shear field, techniques which can probe structure in situ are highly desirable. A related difficulty is to precisely quantify the interactions in concentrated colloidal particle suspensions commonly prepared/processed in actual plant operations (e.g., [
6,
7]) from the extrapolation of dilute solution studies.
Small-angle neutron scattering (SANS) methods have the potential to probe bulk average structures in a concentrated colloidal particle suspension/dispersion and allow us to understand and quantify the particle–particle interactions [
8]. Scattering curves are interpreted in terms of the angular or
q-dependence of the scattered intensity [
9].
where
θ is the scattering angle and
λ is the wavelength of the scattered radiation.
However, at high solid/particle concentrations, multiple scattering may hinder extracting the desired structural information directly from the interpretation of SANS curves due to the consequential
q-dependent distortion of the measured scattered intensity [
10]. If multiple scattering occurs for a given particle/solvent system, it attenuates scattering of the incident beam that should be going in a given (forward) direction and, therefore, distorts the signal which would have been recorded in the limit of single scattering. It follows that the straightforward relationship between the differential cross section and the pair correlation function, i.e., between the structure of the material and the measured scattering signal, is lost [
11]. While a typical approach to reduce multiple scattering is either or both (a) reducing the particle concentration and/or (b) reducing the sample path length, they have obvious limitations in (i) using the behavior of less concentrated suspension to understand the more concentrated suspension; (ii) difficulty in proper feeding of a viscous suspension (in other words, heterogeneity as well as the impact of the sample cell geometry on the structure could affect the sample subjected to the beam and, thus, produce a misleading result); and (iii) the increasing volumetric effect of the surface perturbation of two cell faces on the decreasing bulk of thinner samples. On the other hand, for neutron scattering experiments, it is possible to optimize the scattering strength of a sample by decreasing the contrast between the two phases, particulate, and solvent (water) in a way that is analogous to the role of refractive index adjustment in light scattering [
12]. In this study, we adjusted the scattering length density of the solvent by varying the H
2O/D
2O composition, i.e., by contrast variation (e.g., [
13]). In other words, we utilized the difference between the neutron scattering length densities (SLD) of H
2O (−0.50 × 10
−6 Å
−2 [
14]) and D
2O (6.37 × 10
−6 Å
−2 [
14]) in order to adjust the scattering power of the sample, and thus to minimize the effects of multiple scattering. To the best of the authors’ knowledge, systematic and extensive study of this approach has been very limited. Apart from optimizing sample preparation, multiple scattering effects may also be corrected for during data processing. For that, a variety of procedures is available such as analytical approximations as discussed by, (e.g., [
15,
16,
17,
18,
19,
20,
21,
22,
23]). The multiple scattering of neutrons has also been studied using the technique of Monte Carlo simulation (e.g., [
24,
25,
26,
27]). Additionally, in the case of thick samples, a partial correction for the effect of multiple scattering can be done using an empirical approach (e.g., [
28,
29]), where various thicknesses of one sample are measured, the data fitted—possibly using the equation described by Vineyard (1954) [
15]—and multiple scattering from a sample of known thickness accordingly corrected for.
In this article, we report our investigation on using a H
2O/D
2O contrast variation in conjunction with ultra-small-angle neutron scattering (USANS) to limit the effects of coherent multiple scattering while maintaining strong enough scattering that can be utilized to understand the particle–particle interactions and particle dispersion/aggregation within highly concentrated colloidal suspensions. Multiple incoherent scattering is out of our concern in this study since it contributes only to the background and can be tolerated. Particle interactions and dispersions/aggregations will be separately reported in detail, and thus are outside the scope of this article. The experiments were performed first in a flat tumbling cell to ensure homogeneous particle dispersion without particle sedimentation. Then, similar measurements were performed in a rheo-USANS sample cell with a Couette geometry [
30]. The series of investigations showed that contrast variation was able to continuously vary the scattering power of a sample, allowing for an optimization between minimizing multiple scattering and maximizing the scattering power of the sample. This is particularly useful in the case where the sample thickness is fixed and cannot be adjusted—e.g., for rheo-USANS measurements. In this study, the existence and degree of multiple scattering effects in samples were determined via (a) the linearity of the square root of the scattered intensity as a function of H
2O vol % in H
2O/D
2O ratio, as well as (b) sample transmission,
TSAS. The
TSAS value will be defined and explained in the results and discussion section.
2. Materials and Methods
USANS experiments were performed on the Kookaburra beamline on the cold-neutron guide CG3 at the Australian Centre for Neutron Scattering, Australian Nuclear Science and Technology Organisation [
31,
32], with a monochromatic wavelength of 4.74 Å. Kookaburra is based on the Bonse–Hart method [
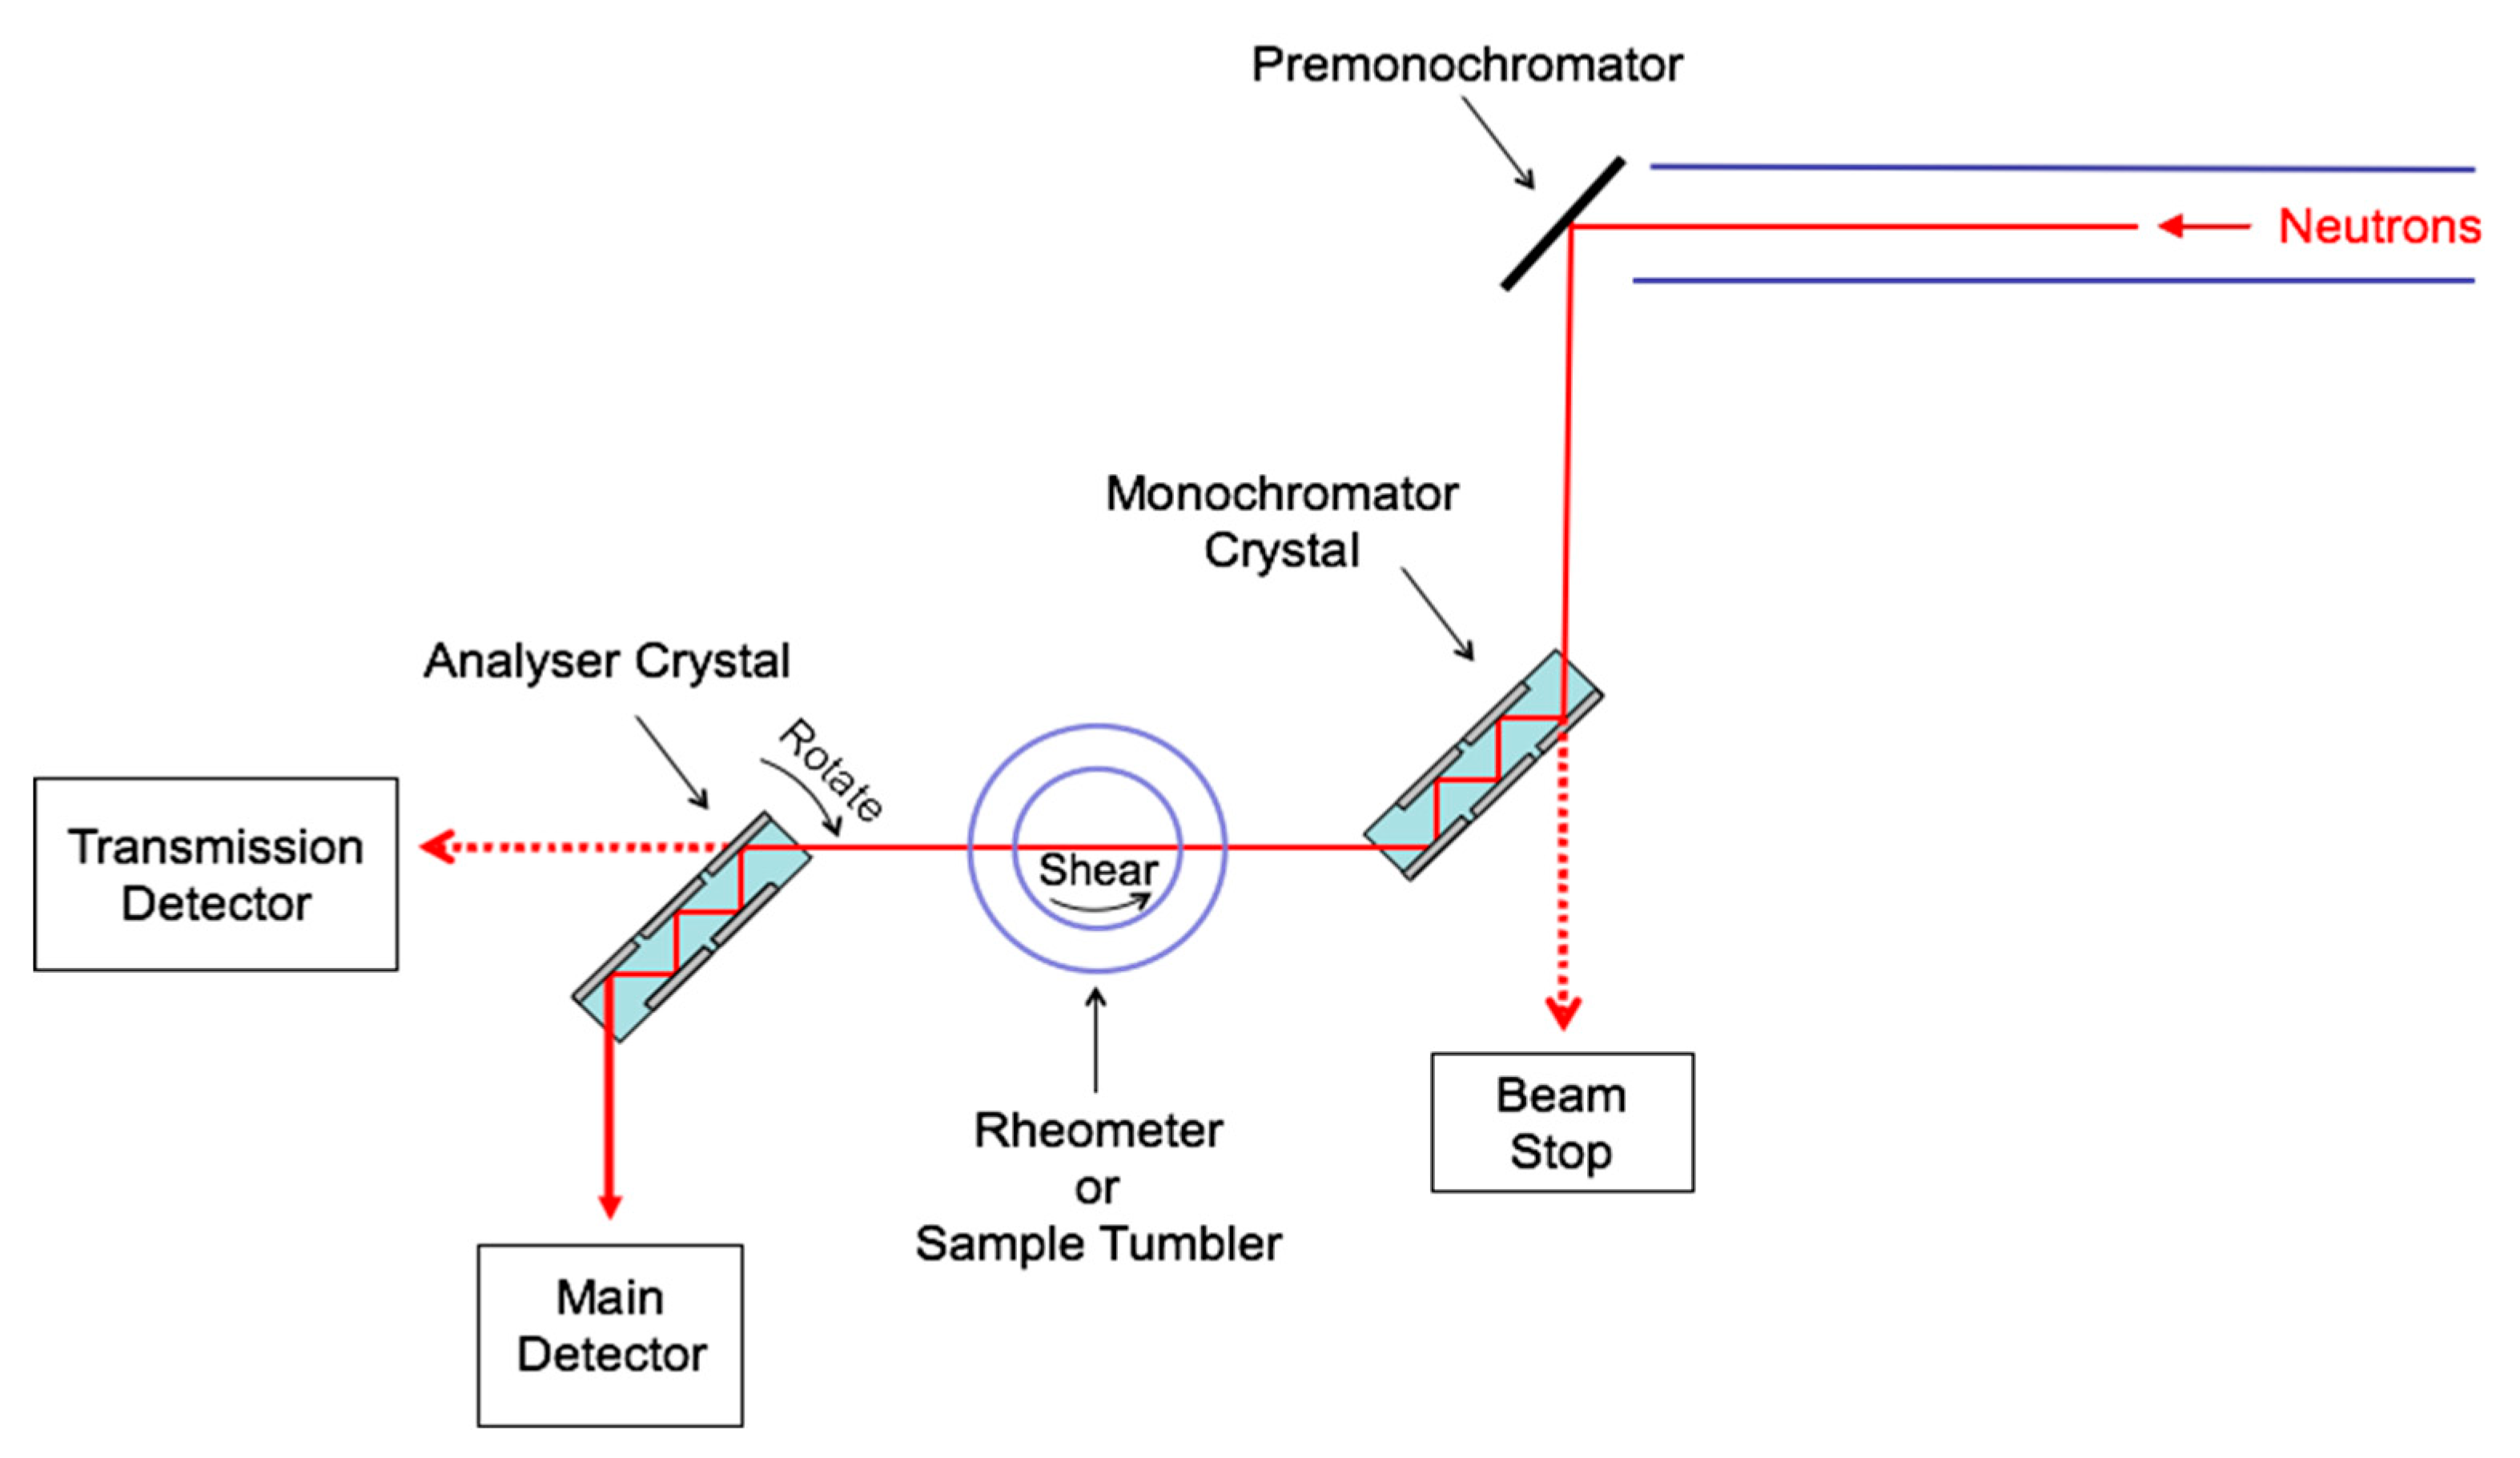
33] and utilizes two identical, multi-bounce, channel-cut, perfect Si single crystals labelled ‘monochromator’ and ‘analyzer’ (arranged in non-dispersive or parallel geometry) in Bragg reflection, see
Figure 1. When the monochromator and analyzer crystals are aligned (analyzer deviation angle
θ = 0°, i.e., the analyzer crystal is in the ‘peak position’), an incident neutron beam is totally reflected into the main detector. In addition to the main detector, a transmission detector is in use to monitor the intensity of the neutron beam transmitted through the sample, including all neutrons scattered to low angles apart from the
q-value that is reflected onto the main detector.
In a typical USANS experiment rocking curve profiles are measured by rotating the analyzer crystal across the peak position and measuring the neutron intensity as a function of the momentum transfer (or scattering vector) q at which data are collected at one value of q (or θ) at a time. q is related to the rotation or scattering angle θ via Equation (1).
Note that the Bonse–Hart USANS technique as applied on Kookaburra is only sensitive to scattering in one direction, while in the perpendicular direction the measurements are averaged over the possible wavevector transfers, i.e., Kookaburra measures scattered intensity from the sample with excellent angular resolution horizontally of a few arcseconds but with a large acceptance in the vertical direction of a few degrees, which is described as ‘slit smearing’. The high angular resolution required for USANS experiments is enhanced through multiple reflections of the neutron beam before and after the sample.
In this study, two different sample cell setups were used and a series of silica particle suspensions were measured. The first one is an aluminum cell with a neutron path length of 0.5 mm and quartz windows of 4 cm diameter, which was mounted onto a sample tumbler to avoid the effects of sample sedimentation, and the beam was shaped by a Gadolinium aperture of 30 mm diameter. The second one is a Couette quartz flow cell, outer diameter 54 mm, with the Anton-Paar MCR 500 rheometer accepting the neutron beam in the normal (perpendicular) direction (
Figure 1). A 25 mm circular Cd aperture was mounted directly in front of the curved Couette cell, and its effective path length was experimentally determined from a comparison of the scattering curves between the Couette and flat cells. The Couette cell has a nominal gap of 0.5 mm, leading to a total beam path of 1 mm theoretically (0.5 mm on each side). However, it should be noted that the effective path length can be slightly longer because the Couette cell is curved, which is particularly important for the large apertures as used here.
Silica particles purchased from Sigma-Aldrich (St. Louis, MO, USA) with a size distribution of 0.5–10 μm—with approximately 80% of particles between 1–5 μm—were used to create sample/aqueous suspensions. Their physical properties are:
D50 (average particle diameter measured by laser diffraction) is 2.4 μm, BET surface area is 5.2 m
2/g, and density is 2.6 g/cm
3. The literature value of the scattering length density of silica is 4.1 × 10
−6 Å
−2 [
14]. USANS measurements were conducted in the
q-range from 3.5 × 10
−5 to 0.01 Å
−1. Silica particle suspensions were prepared in an electrolyte solution of potassium nitrate (1 × 10
−2 M) consisting of milli-Q water and D
2O in different volume ratios. Solid concentrations were adjusted to between 5 and 40 vol % in order to investigate whether there is any influence on the optimization of the H
2O/D
2O ratio. Once a suspension was evenly mixed, its pH value was adjusted to 10 using 1M and/or 0.1 M KOH in D
2O. The suspension was then mixed by magnetic stirring for 30 min. The suspension was then transferred to a flat cell for USANS measurements or a cylindrical cell (Couette geometry) for rheo-USANS measurements. Experimental rocking curves were reduced and normalized to absolute intensity scale using the standard procedure [
34] adapted to Kookaburra using Python scripts on the Gumtree platform [
35].
3. Results and Discussion
Figure 2 and
Figure 3 show the results of contrast variation with 5 and 10 vol % SiO
2 at pH 10, respectively.
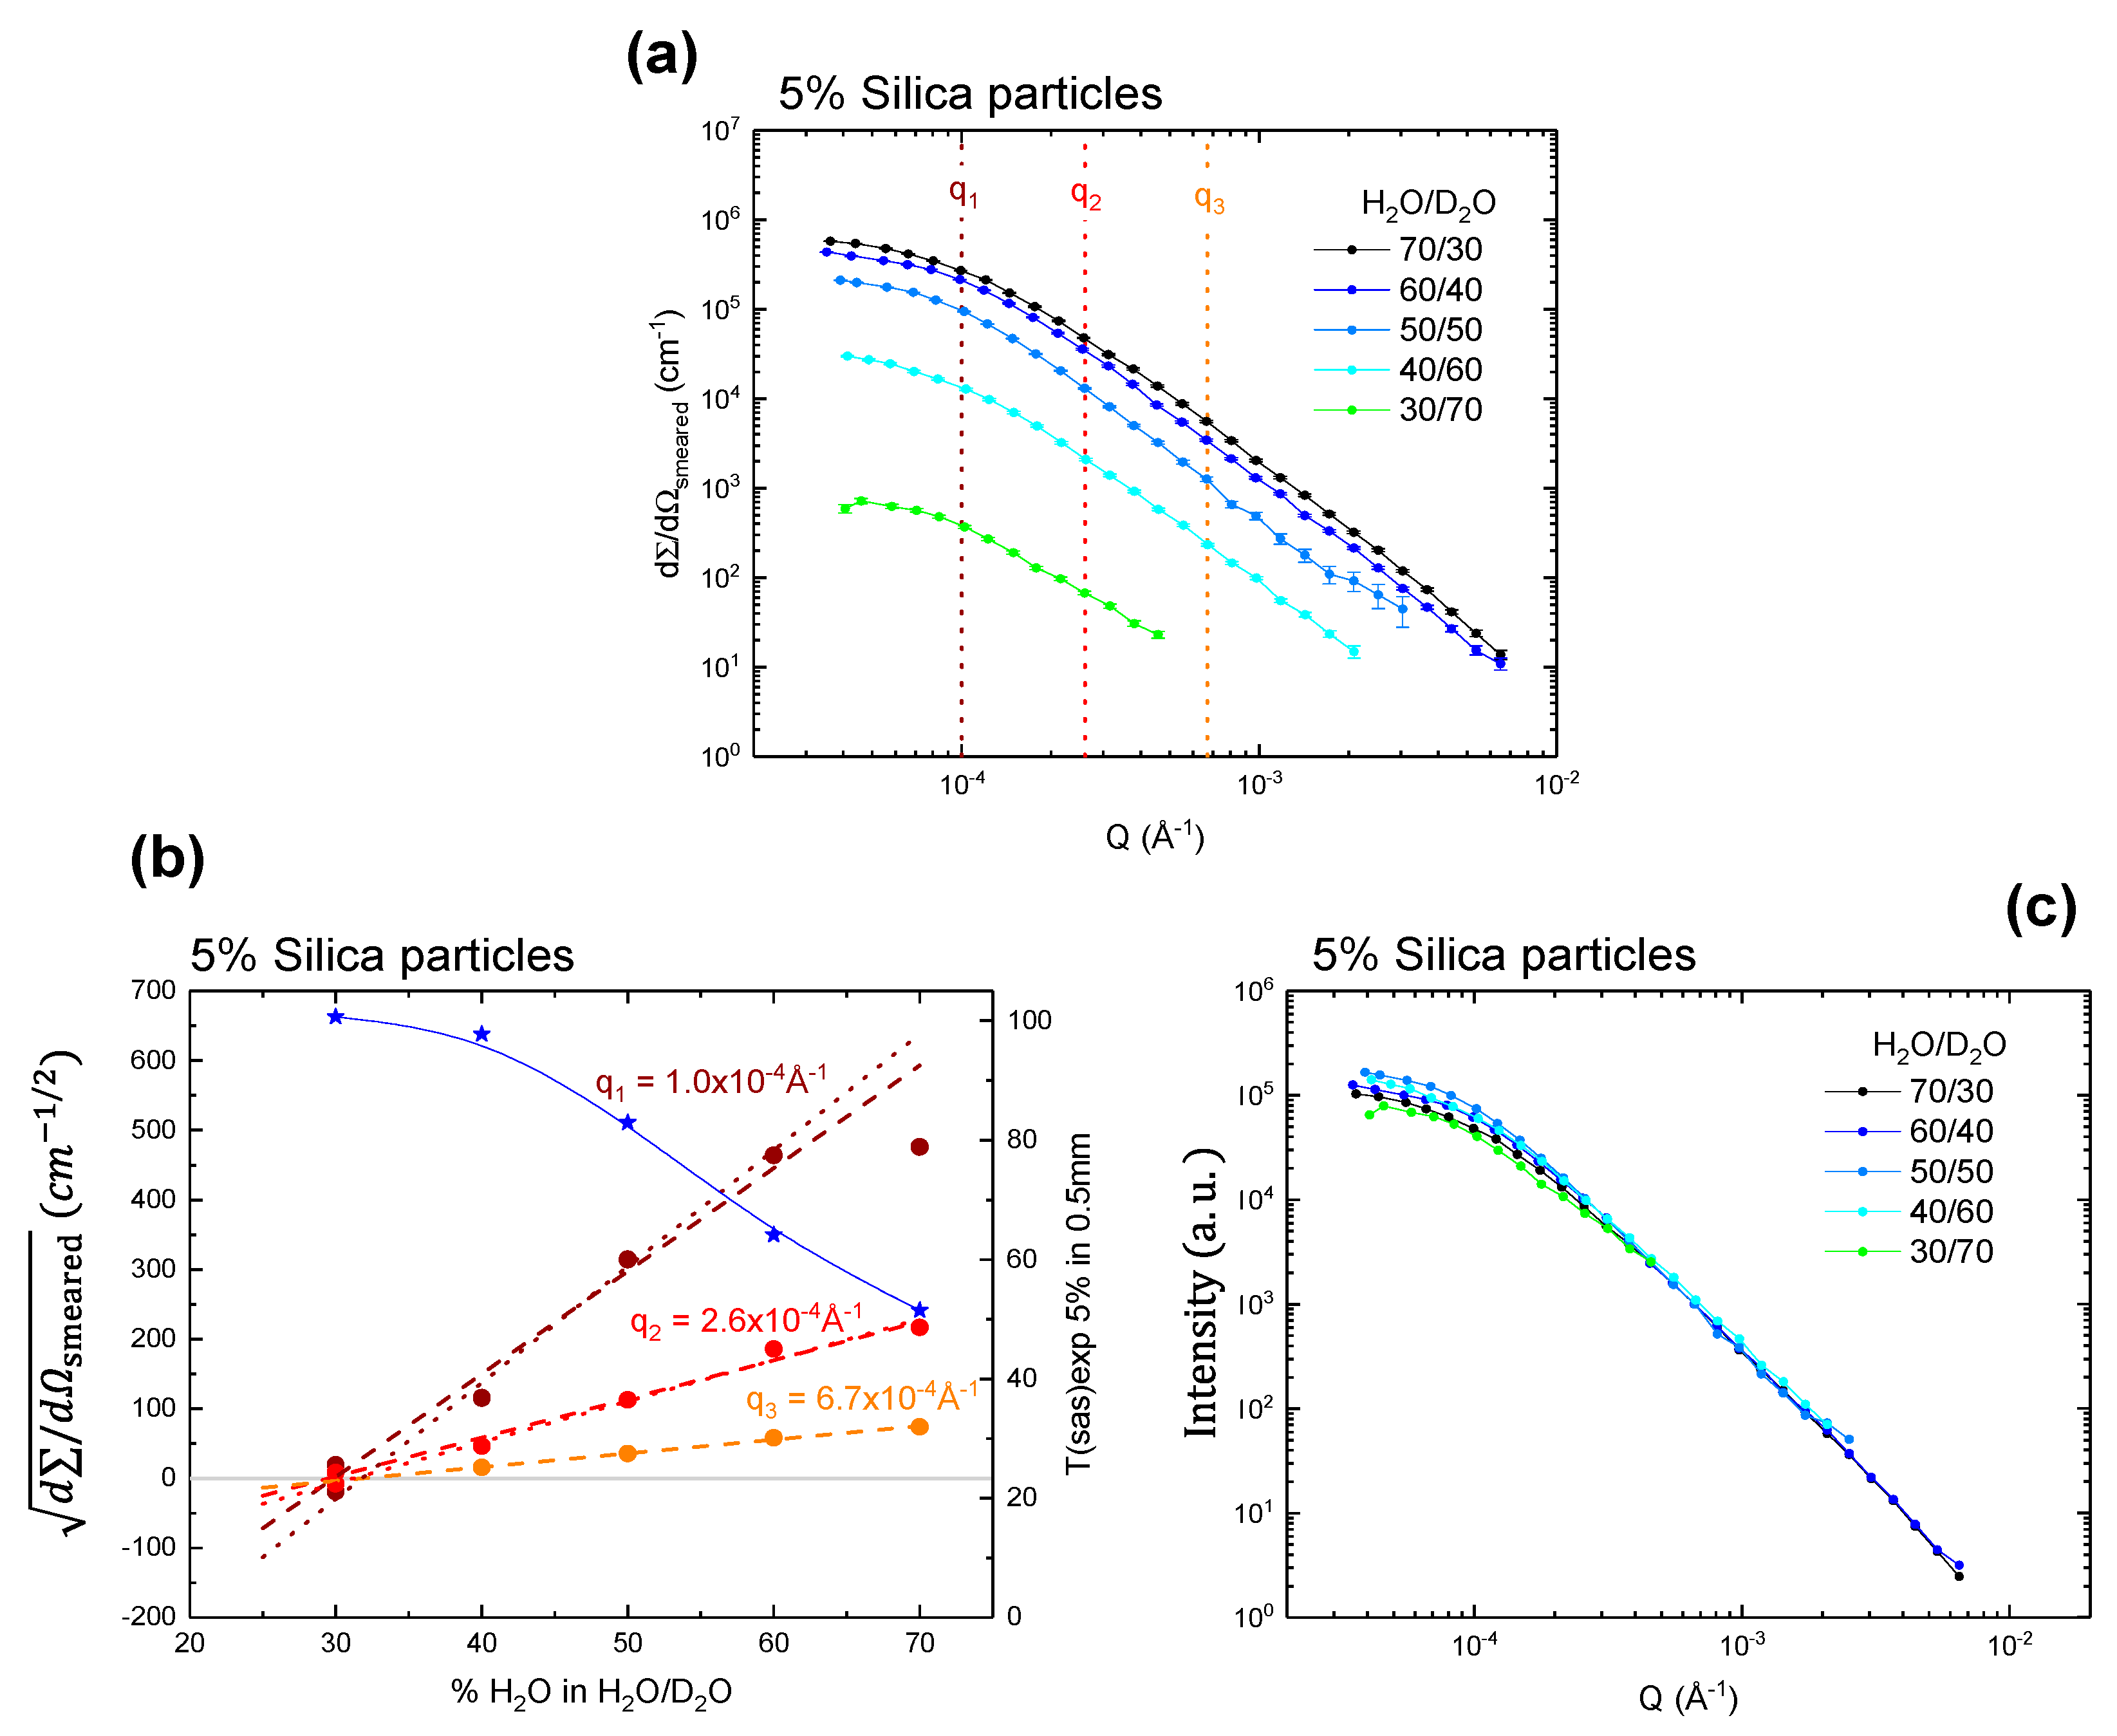
Figure 2a shows the absolutely scaled slit-smeared intensity for a H
2O/D
2O contrast variation series to investigate its effect on the scattering intensity and transmission of samples with 5 vol % silica. All the curves are fairly featureless which would be anticipated from the polydisperse silica samples. Starting from a 30/70 H
2O/D
2O mixture, the signal increases with increasing H
2O content, and therefore contrast. It should be noted that the error bars are given in all the figures in this article, but they are mostly smaller than experimental dot points.
The first step of this investigation was to determine
q-dependence of the match point, i.e., the contrast, H
2O/D
2O ratio, where the scattered intensity is equal to 0. To extract the potentially
q-dependent match point from the data, the intensities at three
q-values (1.0 × 10
−4, 2.6 × 10
−4, 6.7 × 10
−4 Å
−1) from each scattering pattern were plotted as a function of H
2O vol % in H
2O/D
2O ratio. As an approximation, the square root of the intensity is expected to give a linear relationship with the H
2O vol % [
36,
37], as plotted in
Figure 2b. For a group of identical, randomly oriented particles, the intensity of coherent, elastic scattering is dependent only on the magnitude of the scattering momentum transfer
q, and is defined as [
11]
N is the number of particles per unit volume,
V is the volume of the particles,
P(
q) is a form factor that depends on the shape of the particles,
S(
q) is a structure factor that dictates the inter-particle correlation structure, and
is the scattering density difference between the scattering particles and solvent. Thus, one can deduce the correlation between the scattering intensity and scattering density difference as
The sign of the square root of the intensity for the 30% H
2O sample may be positive or negative, and so both values are plotted. From the linear behavior of all plots, it can be concluded that the match point does not have any
q dependency. The value is consistently around 30 vol % H
2O. To obtain a more quantitative measure, we fitted a straight line to the data (
Figure 2b), excluding the deviation at high contrast (see discussion on multiple scattering that follows below). Match points,
= 0, were obtained at 30.4 ± 1.2 vol % H
2O and 31.6 ± 0.3 vol % H
2O in D
2O. The estimated SLD of the particles is 4.28 ± 0.18 × 10
−6 Å
−2 and 4.20 ± 0.18 × 10
−6 Å
−2, respectively. This is in good agreement with the expected match point of silica (literature value of SLD 4.1 × 10
−6 Å
−2), corresponding to 32.4 vol % H
2O. The same is true for a system with 10 vol % solid content, as shown in
Figure 3b, where the match point was determined with the estimated SLD of 4.28 ± 0.06 × 10
−6 Å
−2 or 4.26 ± 0.07 × 10
−6 Å
−2. The results also confirmed that up to 10 vol % SiO
2 there was no solid concentration dependency on the match point.
Ideally, there should be a linear relationship between
and H
2O vol % for a binary contrast system,
q-dependent deviations from this indicate multiple scattering effects. These effects are anticipated to increase with H
2O vol % (i.e., contrast between solvent and particles) and be more pronounced at low
q than at high
q. This effect is illustrated in
Figure 2b and
Figure 3b: at the higher
q-values (
q2 and
q3) there is a clear linear relationship. For the lower
q-values (
q1), the
curves flatten as they become increasingly affected by multiple scattering. At 5 vol % silica sample, multiple scattering is visible for
q1 at the highest contrast of 70 vol % H
2O (
Figure 2b), and for the 10% sample this is already visible for
q1 at 60 vol % H
2O (
Figure 3b). Scattering data normalized to the intensity at about
q2, a
q-region that does not appear to be affected by multiple scattering, are shown in
Figure 2c and
Figure 3c. It can be seen that for 5 vol % silica sample (
Figure 2c), the curves after normalization are very similar, and thus multiple scattering effects are not obvious. The curve at 40/60 appears to be slightly higher in intensity at low
q, and we attribute this to small variations in sample preparation. For 10 vol % silica sample, however, the low
q part shows a clear dependency on the contrast. Clearly the sample at the highest contrast (70 vol % H
2O) has lower intensity at low
q than those with less contrast (
Figure 2c), which is a typical sign of multiple scattering. Please also note that the samples at 30/70, which are very close to the match point, appear to be slightly lower at low
q. Since this cannot be a sign of multiple scattering, we suggest that this can be attributed to heterogeneities in the SLD of the particles, possibly due to density variations around their average value, which can cause an effect that is only visible very close to the match point.
Another measure that can be used as a guide to evaluate the probability of multiple scattering, is the so-called
TSAS value. This corresponds to the fraction of the beam that passes through the sample without being scattered [
38,
39]. The
TSAS value of a sample is experimentally determined as the ratio between the transmission of the direct beam (
TRock, as measured on the main detector) and the overall transmission of the direct beam and scattering pattern (
TWide, as measured on the transmission detector) and it can also be theoretically estimated. The definitions of these three values are given in the Equations (5)–(7). Equation (8) was used for the theoretical estimation where
Φ is the volume fraction of particles, (Δ
SLD) is the neutron contrast between the particles,
, and the liquid,
, whose definition is given in the Equations (9) and (10);
D is the diameter of the particle,
L is the sample thickness,
is the volume fraction of H
2O, and
is the volume fraction of D
2O. As a guide, the ideal value for
TSAS is above 0.9 (90%) [
39]. A
TSAS value well above 0.9 indicates that the scattering signal is rather weak for USANS with a reduced probability of multiple scattering, while a decrease in a
TSAS value below 0.9 indicates that there is an increased probability of multiple scattering. The
TSAS value can be a very useful tool as a guide to the expected degree of multiple scattering [
38,
39,
40]. Note however, that the effect of multiple scattering on scattering curves is
q-dependent (see discussion below), and a higher degree of multiple scattering can be tolerated if the scattering curves do not show sharp features even in the single scattering regime.
In this study, we also used
TSAS values to discuss the effect of multiple scattering in two different geometries (i.e., flat cell, flow cell), and consequentially different path-lengths, under different solid concentrations, and H
2O/D
2O ratios, coupling with changes in the scattering intensity.
Table 1 shows the
TSAS values with different H
2O/D
2O ratios for a system with 5 and 10 vol % solid content in the tumbling cell with a thickness of 0.5 mm.
Table 1 also shows the theoretically estimated
TSAS values for the same samples, based on Equation (8). The parameter in this Equation that is not precisely known is the effective particle size
D (it is a polydisperse system). This value was manually adjusted to 2.25 μm to give very good agreement for the
TSAS values at all investigated contrasts for both the 5 vol % and 10 vol % silica sample. This value was also in good agreement with the average particle size obtained for this sample from laser diffraction (2.4 μm). This good agreement gave us confidence to use this formula to estimate the optimal H
2O/D
2O ratio for the Couette cell (thickness = 1 mm) for rheo-SANS (see
Table 1). The nominal/path-length thickness of the flow cell is close to 1 mm, double of the tumbling cell thickness (0.5 mm).
The experimentally determined
Tsas values were also plotted in
Figure 2b and
Figure 3b (blue stars) in order to investigate their correlation with the scattering intensity as a function of vol % H
2O in H
2O/D
2O. It can be noticed that for the 5 vol % silica particle suspensions
Tsas values above 60% maintained good linearity on the square scattering intensity until 60 vol % H
2O in H
2O/D
2O ratio at the lowest
q range plotted (1 × 10
−4 A
−1), showing only a negligible effect of multiple scattering (
Figure 2b). At 10 vol % silica particle suspensions, above 70%
Tsas value maintained the linearity, up to 50 vol % H
2O/D
2O ratio (
Figure 3b). On the other hand, for the higher
q ranges (2.6 × 10
−4 A
−1, 6.7 × 10
−4 A
−1), there was no deviation from the linearity for the both 5 and 10 vol % silica particle suspension, indicating that the effect of multiple scattering present in those systems is minimal (if not absent) with these
q ranges.
Based on these results, 40 vol % H
2O was selected for the rheo-setup to reduce multiple scattering (
TSAS,est = 96% and 92.5% at 1 mm path length for the 5 vol % and 10 vol % sample, see
Table 1) while optimizing the scattered intensity.
Figure 4 shows the scattering curve comparison between the measurements using a flat cell with tumbling motion and the Couette geometry for rheo-USANS at a shear rate of 500 s
−1. This shear rate was selected as it is well above the minimum rate that ensured good particle dispersion during the measurement for comparison with the tumbling flat cell. The viscosity of the suspension was measured at increasing constant shear rates for a fixed period of time (peak hold test). The minimum shear rate to maintain a constant viscosity was determined and higher shear rate than the minimum was tested (500 s
−1).
It can be seen that there is a very good agreement, for the 5 vol % silica sample (
Figure 4a), between the shape of the scattering curves of the sample in the tumbling cell and in the rheo-cell at 500 s
−1, measured independently. The thickness of the rheo-cell during data reduction, which impacts on the overall intensity scale, was chosen to be 1 mm and the good agreement in the intensity to the data in tumbling mode imply that the curvature of the rheo-cell was not significant to increase the value of the effective sample thickness significantly. At 10 vol % (
Figure 4b), we observed that the scattering curves slightly deviate at low
q between these two scenarios. The experimental
TSAS values for the 5 vol % and 10 vol % silica sample,
Table 1, clearly show that both these samples should not be in a range, where multiple scattering is pronounced. We therefore conclude that this difference for the 10 vol % sample is a real structural change that is caused by the Couette shear. We suggest that Couette shear gives a better particle dispersion than simple tumbling motion. In other words, there were less aggregates present in the rheometer.
Table 2 shows the
TSAS values determined at different experimental conditions, such as solid/particle concentration, pH, and shear rate. Regardless of the experimental conditions varied,
TSAS values were generally high enough (>90%) to reduce multiple scattering effects. For higher silica concentration at 20 and 40 vol %, we anticipated even more multiple scattering than 5 and 10 vol % (if we do not apply contrast variation). Thus, we selected slightly less H
2O vol %—i.e., 37—compared with the value suggested (40 vol % H
2O) for less silica vol %. This yielded high
TSAS values in general, i.e., minimization of effects of multiple scattering.
There is a slight decrease in
Tsas values with increasing the shear rate. It indicates the presence of slightly more scattering that can be explained by the structural effects due to shear thickening behavior of concentrated silica suspensions forming particle clustering [
30]. Small degree of thickening (i.e., small increase in viscosity) observed during the shear tests can explain the small change in
Tsas value. Thus, samples showing significant thickening behavior could largely reduce the
Tsas value that should be experimentally evaluated. Studying the effects of changes in particle/aggregate structure on multiple scattering effects with the application of contrast variation can be a good future study topic in this field.
Anovitz and Cole 2015 [
11] reported that the thickness required for minimizing multiple scattering effects and having
TSAS value of higher than 90% is approximately below 0.15 mm without contrast variation. In comparison, our sample thicknesses were 0.5 mm in a flat cell and 1 mm in a rheo-cell that is up to the factor of 7 and still achieved minimizing multiple scattering effects, shown by
TSAS values higher than 90%.


