Abstract
The impact of nanomaterials on lung fluids, or on the plasma membrane of living cells, has prompted researchers to examine the interactions between nanoparticles and lipid vesicles. Recent studies have shown that nanoparticle-lipid interaction leads to a broad range of structures including supported lipid bilayers (SLB), particles adsorbed at the surface or internalized inside vesicles, and mixed aggregates. Currently, there is a need to have simple protocols that can readily evaluate the structures made from particles and vesicles. Here we apply the method of continuous variation for measuring Job scattering plots and provide analytical expressions for the scattering intensity in various scenarios. The result that emerges from the comparison between experiments and modeling is that electrostatics play a key role in the association, but it is not sufficient to induce the formation of supported lipid bilayers.
1. Introduction
The emission of fine and ultrafine particulate matter in the environment is responsible for the increase of mortality and morbidity from cardiorespiratory diseases worldwide [1,2]. In the context of environmental pollution, engineered nanoparticles, which are less than 100 nm in size, have attracted much attention and have been identified as potentially harmful. When inhaled, these particles are able to reach the respiratory zone in the lungs and come into contact with the acinar region, which is composed of hundreds of millions of alveoli [3,4]. Several scenarios of nanoparticles passing from the alveolar spaces towards the blood circulation have been examined, and in some studies the crossing of the air–blood barrier has been demonstrated [4]. It is found that in the alveolar spaces, the nanoparticles first come into contact with the pulmonary surfactant, a fluid composed of lipids (90%) and proteins (10%) which provides important functions in the lung physiology [5,6]. This scenario prompted researchers to actively study the interactions between nanoparticles and lipid vesicles, typically with vesicular structures in the size range of 100 nm to 1 μm [7,8,9,10].
Another example where particles interact directly with biological membranes is the process of endocytosis [11]. Endocytosis is the biological process by which nano-objects of different nature and sizes, including pathogens, bacteria, viruses, nanoparticles, etc., are internalized inside living cells. For particles larger than 1 µm, the process is referred to as micropinocytosis, whereas for 100 nm nanoparticles the passage through the membrane can be passive or active, the latter being mediated by caveolin or clathrin proteins [12]. When nanoparticles are close to a cell membrane, the interactions generate forces of different origins (e.g., van der Waals, electrostatic), leading to the membrane wrapping around the particles and cellular uptake [13,14,15].
To evaluate the interplay of nanomaterials with biological membranes, recent experimental, theoretical, and simulation studies have focused on the interaction of nanoparticles with vesicles [9,16,17,18,19,20,21,22,23]. Most experiments reported, until recently, were performed using synthetic lipids of the phosphatidylcholine class, such as 1,2-dipalmitoylphosphatidylcholine (DPPC), 1,2-dimyristoyl-sn-glycero-3-phosphocholine (DMPC), or 1,2-dioleoyl-sn-glycero-3-phosphocholine (DOPC). From their structures, the phosphatidylcholine vesicles are similar to those found in pulmonary surfactants [5,17,24,25,26]. Strategies based on the use of more biological models and substitutes have also been proposed [17,27,28,29]. Depending on the particle size, charge, and hydrophobicity, several mechanisms have been suggested, leading to a wide variety of hybrid structures. Figure 1 displays a library of nanoparticle-membrane structures observed using cryogenic transmission electron microscopy (cryo-TEM). They include nanoparticles coated with a single bilayer (called nano-SLB herein, Figure 1a) [17,28], particles embedded with the lipid membrane or adsorbed at the surface (Figure 1b,c, respectively) [30,31], particles internalized inside the lipid compartment (Figure 1d) [32], and mixed nanoparticle-vesicle aggregates (Figure 1e) [18]. In the case of particle internalization, the fluid membrane invaginates and envelops one or several particles, like in cellular endocytosis [11]. Despite many efforts, the mechanisms of particles interacting with the synthetic or biological membranes are not fully understood.
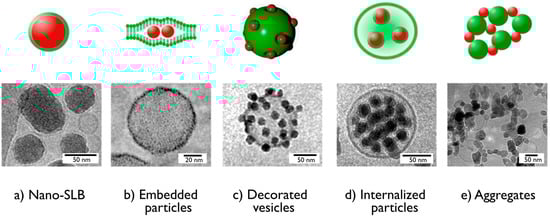
Figure 1.
Cryogenic transmission electron microscopy images obtained from nanoparticle-vesicle association. (a) Silica nanoparticles coated with a supported lipid bilayer [17]; (b) gold particles embedded within the lipid membrane of a vesicle [31]; (c) silica particles adsorbed at the surface of a vesicle [30]; (d) silica particles internalized inside the lipid compartment [32]; (e) aggregates of ZnO nanoparticles and vesicles [18]. The upper panels provide an illustration for the different structures.
A broad range of experiments were used to study particle-membrane interaction. These experiments include light scattering [17,33], leakage assays [18], quartz crystal microbalance [34], electron and fluorescence microscopy [17,24,25,30,31,32]. Cryogenic transmission electron microscopy is probably one of the best methods to visualize the nanoparticle-membrane structures, as illustrated in Figure 1 [35]. It has the required resolution (~1 nm) and electronic contrast to identify both the nanoparticles and the lipid membranes. Cryo-TEM images however lack statistics as only a few objects are usually displayed. In this context, there is need to develop simple protocols that can rapidly assess the nature of the structures obtained from particles and vesicles. Here we provide examples of light-scattering-based analytical models that are able to discriminate among the different association scenarios illustrated in Figure 1. The approach is developed for static light scattering, but could also be extended to small-angle neutron and X-ray scattering or UV-visible spectroscopy. To this aim, we use the method of continuous variation developed by Paul Job, leading to what we describe as Job scattering plots [36,37,38,39,40,41]. Here we provide analytical expressions for the Rayleigh ratio, obtained from mixed nanoparticle-vesicle aggregates and particles coated with a single bilayer, respectively. Quantitative comparisons with experimental data are also discussed.
2. Experimental
Nanoparticles: The aluminum oxide nanoparticles, from Disperal® (SASOL, Hamburg Germany), had the shape of irregular platelets, with sizes of 40 nm in length and 10 nm in thickness [33]. To obtain homogeneous dispersions, the alumina powder was dissolved in a nitric acid solution (0.4 wt % in deionized water) at the concentration of 10 g L−1, and sonicated for an hour. The particles had a hydrodynamic diameter ( = 64 nm). The positively charged silica particles were synthetized using the Stöber synthesis. Following the synthesis, the silica was functionalized by amine groups, resulting in a positive coating [17,23,42]. Aminated silica particles were synthesized at 40 g L−1 and diluted with deionized (DI) water with a pH of 5. The hydrodynamic and geometric diameters were determined at = 60 nm and = 41.2 nm. Negative silica particles (trade name CLX®) were purchased from Sigma Aldrich at the concentration of 450 g L−1. The batch was diluted down to 50 g L−1 and dialyzed against DI water at a pH of 9 for two days. The diameters were measured at = 34 nm and = 20 nm [23]. The particle surface charge densities were determined using the polyelectrolyte assisted charge titration spectrometry [39], leading densities of +7.3e, +0.62e, and −0.31e nm−2, respectively. In the following, the particles are abbreviated Alumina (+), Silica (+), and Silica (−).
Phospholipids: Dipalmitoylphosphatidylcholine (DPPC), l-α-Phosphatidyl-dl-glycerol sodium salt from egg yolk lecithin (PG, Sigma-Aldrich, St. Louis, MO, USA, MDL number: MFCD00213550), and 2-Oleoyl-1-palmitoyl-sn-glycero-3-phospho-rac-(1-glycerol) (POPG) were purchased from Sigma-Aldrich. The phospholipids DPPC, PG, and POPG were dissolved in methanol, at 10, 10, and 20 g L−1, respectively, and then mixed in proper amounts for a final weight concentration of 80%, 10%, and 10% of DPPC, PG, and POPG, respectively. The solvent was evaporated under low pressure at 60 °C for 30 min. The lipid film formed on the bottom of the flask was then rehydrated with the addition of DI water at 60 °C, and agitated at atmospheric pressure for another 30 min. DI water was added again to obtain a final solution of 1 g L−1 (note that “DI water” was defined earlier in the text) The lipid vesicles were characterized by a hydrodynamic diameter of = 120 nm and a zeta potential of = −32 mV. Nanoparticle-vesicle interactions were investigated using a mixing protocol known as the continuous variation method [36,39,41]. Surfactant and particle batches were prepared in the same conditions of pH and concentration, and the stock solutions were mixed at different volumetric ratios, , where and are the vesicle and nanoparticle concentrations. For Alumina (+), the pH of the stock dispersions was adjusted to a pH of 5 to ensure that the particles did not aggregate as a result of the pH changes. Silica (+) and Silica (−) were studied at a physiological pH.
Static and dynamic light scattering: The scattered intensity () and the hydrodynamic diameter () were obtained from the NanoZS Zetasizer spectrometer (Malvern Instruments). Analytical expressions in the following will be given in terms of the Rayleigh ratio (), which is basically proportional to in the case considered here. The second-order autocorrelation function was analyzed using the cumulant and CONTIN algorithms to determine the average diffusion coefficient () of the scatterers. was calculated according to the Stokes–Einstein relation () where is the Boltzmann constant, the temperature, and the solvent viscosity. The hydrodynamic diameters provided here are the second coefficients in the cumulant analysis described as . Measurements were performed in triplicate, at 25 °C and 37 °C, after an equilibration time of 120 s, yielding experimental uncertainties better than 10% in both intensity and diameter.
Electrophoretic mobility and zeta potential: Laser Doppler velocimetry, using the phase analysis light scattering mode and detection at an angle of 16°, was used to carry out the electrokinetic measurements of electrophoretic mobility and zeta potential, with the Zetasizer Nano ZS equipment (Malvern Instruments, Malvern, UK). Zeta potential was measured after a 120 s equilibration at 25 °C.
3. Results and Discussion
3.1. Job Scattering Plots
In 1928, Paul Job developed the method of continuous variation to determine the stoichiometry of binding macromolecular species in solutions, providing information about the equilibrium complexes. We adapted this technique to study interactions in soft condensed matter using small-angle scattering techniques. In the cases of coacervation or microphase separation, the Job scattering technique allows the ability to screen large domains of phase diagrams and to detect phase boundaries [43]. In the case of protein corona formation, of polymer or lipid adsorption, on nanoparticles, the method is quantitative and provides some key features of the association, such as, the stoichiometry, the layer thickness, and the density [41,44]. In this work, emphasis is put on static light scattering and the modeling of attractive interaction between nanoparticles and lipids. This approach leads to analytical expressions for the scattering intensity during aggregate or SLB formation.
More specifically, we were concerned with ternary phase diagrams, for which the total active concentration was constant and the ratio between the two concentrations was varying continuously according to , where and are the nanoparticle and vesicle concentrations, respectively. In practice, was held in the range 0.01–10 g L−1 and = 10−3–103. This technique has several advantages, one of them being that the solutions are in the dilute regime and that the Debye–Gans theory applies to all solutions [45]. The approach also relies on the fact that, to a first approximation, the scattering intensity arising from different species is additive, leading to:
where the index refers to the different types of scatterers. In this work, four types of scatterers were considered: Engineered nanoparticles, lipid vesicles, hybrid aggregates, and supported lipid bilayers. In Equation (1), is the scattering contrast coefficient, is the weight-averaged molecular weight, is the radius of gyration, and is the second virial coefficient. In the following, the form factor and the interaction contribution () were neglected for the sake of simplicity, which led to the Rayleigh ratio as an expression of the form:
3.2. Non-Interacting Species
For the trivial case, where nanoparticles and vesicles did not interact, the scattering intensity was the sum of the = 0 and = intensities, weighted by their actual concentrations and , leading to:
Equation (2) is a slowly varying function of , ranging between the Rayleigh ratio of the nanoparticles ( = 0) and that of the vesicles ( = ). Examples of behavior are shown in Figure 2 for 40 nm nanoparticles and 100 and 200 nm vesicles (continuous lines in grey). More details about these calculations are provided in the next section.
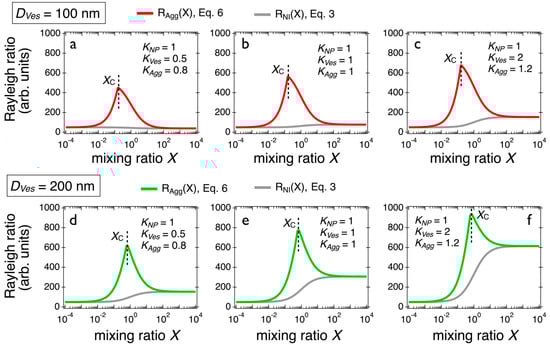
Figure 2.
(a–c) Scattering intensity obtained for mixed solutions containing 40 nm silica nanoparticles and 100 nm lipid vesicles, in the case of aggregate formation, using three different sets of contrasts, () = (1, 0.5, 0.8), (1, 1, 1), and (1, 2, 1.2), respectively. The curves in red refer to ( = 10, = 1)-aggregates (Equation (6)), whereas those in grey arise from non-interacting species (Equation (3)). The and denote the number of particles and vesicles in the aggregates, respectively. (d–f) Scattering intensity obtained for mixed solutions containing 40 nm silica nanoparticles and 200 nm lipid vesicles, with the same set of contrasts as above.
3.3. Nanoparticle-Vesicle Hybrid Aggregates
Here we considered the particle-vesicle interaction to be attractive, which led to the formation of mixed aggregates. The model was general and did not specify the interaction type. As the scattering varied linearly with the weight-averaged molecular weight of the scatterers, the presence of aggregates would lead to an excess scattering compared to the non-interacting case (Equation (3)) (we confirm the use of the word “scatterers”). For sake of simplicity, it was assumed that -aggregates were formed and composed of nanoparticles and vesicles. The aggregate molecular weight thus reads . This latter equation has an important consequence: At the critical ratio , all particles and vesicles present in the solution would be forming aggregates, leading to the relationships:
In the following, we define the aggregate stoichiometry as the number of particles per vesicle . The above results also suggested that the overall mixing diagram can be decomposed in two regions: For < , nanoparticles were in excess and all added vesicles were consumed in the aggregate formation; and for > , the vesicles were the main component and coexist with hybrid aggregates in solutions. In the first regime, the hybrid aggregates were in equilibrium with free nanoparticles, and in the second with free vesicles. Counting the different species as a function of leads to the following expressions [38,46]:
The previous equations predict the scattering intensity in the case of aggregate formation. They have been estimated for different sets of parameters, as shown in Figure 2. Tests were performed using two values of vesicular diameter, 100 and 200 nm, and three scattering contrast conditions, () = (1, 0.5, 0.8), (1, 1, 1), and (1, 2, 1.2). The -values were selected to encompass a broad range of refractive index properties ( is indeed proportional to the square of the refractive index increment ) [45]. For these calculations, the stoichiometry was assumed to be 10 particles per vesicle. The results shown in Figure 2 all display a marked maximum centered on = 0.16 ( = 100 nm) and 0.64 ( = 200 nm). For the two sizes, the scattering peaks increased with the contrast in lipid vesicles (checked). Changing the number of particles and vesicles in the -aggregates modified the peak position and amplitude (the Rayleigh ratio at the maximum is proportional to ). The non-interacting predictions obtained from Equation (3) are also shown in the panels. Note that these calculations could be easily extended to other types of assemblies such as particles embedded in the membrane, vesicles decorated with nanoparticles, or particles internalized inside the membrane compartment. In these latter cases, the molecular weight () and the stoichiometry should be adjusted to consider the modeled structure.
3.4. Nano-Supported Lipid Bilayer (Nano-SLB)
For nano-SLB, there also existed a critical mixing ratio , at which all the particles were covered with a single lipid bilayer and formed a supported lipid bilayer (Figure 1a). At , the nanoparticle and vesicle surface area concentrations were equal, so:
where and denote the specific surface areas for nanoparticles and vesicles, respectively. For particles of diameter and mass density , one has . For vesicles, the specific surface area reads , where is the area per polar head, is the Avogadro number, and is the lipid number-average molecular weight. In the following simulation, we discuss the case of 40 nm silica particles (density = 2200 kg m−3) and of DPPC lipids of area per polar head = 0.6 nm−2 (molecular weight = 734 g mol−1). With this assumption, one gets = 6.8 105 cm2 g−1 and = 2.4 106 cm2 g−1, and a value of = 0.28 that does not depend on the vesicle size. The total scattering cross section arises from the sum of the coated and uncoated particle contributions. The scattering intensity then reads [23]:
where and is the scattering contrast for the SLB-coated particles. Note the similarities of the -dependences in Equations (6) and (8). However, differences can be found in the determination of , in the contrast coefficients, and in the molecular weights. In Figure 3, the continuous lines in red (in green, respectively) were obtained from 40 nm particles and 100 nm (200 nm, respectively) vesicles using the scattering contrast conditions of Figure 2, () = (1, 0.5, 0.8), (1, 1, 1), and (1, 2, 1.2). In all the examples considered, the nano-SLB scattering lies below that of the non-interacting species, which is indicated as continuous lines in grey in each figure. There, the growth rate of the scattered intensity found with increasing was smaller for the case of membranes wrapping particles than for the case where the vesicles remained intact. The effect was amplified for large vesicles or for vesicles with strong scattering contrast. Note that under certain conditions (e.g., in Figure 3b), the difference between the two curves was modest and would probably not be experimentally detectable. From this, it can be concluded that for 40 nm particles and 100 and 200 nm vesicles, the Job scattering plots display different features for aggregate and nano-SLB formation. An interaction strength parameter ( can be defined from the integral beneath the Rayleigh ratio scattering curve () relative to that of the non-interacting model, such as [23]:
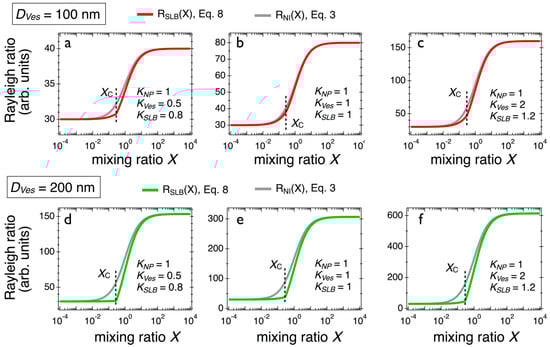
Figure 3.
(a–c) Scattering intensity obtained for 40 nm silica nanoparticles and 100 nm lipid vesicles, forming supported lipid bilayers, using different contrasts, () = (1, 0.5, 0.8), (1, 1, 1), and (1, 2, 1.2), respectively. The curves in red refer to nano-supported lipid bilayer (nano-SLB) (Equation (8)), whereas the curves in grey arise from the non-interacting model (Equation (3)). (d–f) Same as above, but for 200 nm vesicles. Note that for the different conditions, the scattering intensity for the supported lipid bilayer (SLB) formation remains below that of the non-interacting species.
To allow comparison between different particulate systems, the integral was normalized with respect to the nanoparticle intensity and to concentration. According to Equation (9), the aggregate and SLB formations were characterized by and respectively, whereas the non-interacting systems gave , a result that should also help in identifying the nature of the association [23].
3.5. Comparison with Experiments
In this part we study the interactions between nanoparticles and vesicles, and compare Job scattering plots obtained experimentally with the above predictions. For the experimental studies, we used vesicles made from a mixture of DPPC, PG, and POPG lipids in a ratio of 80:10:10, respectively, synthesized via the evaporation–rehydration technique. For the particles, we used aluminum and silicon oxide particles of sizes around 40 nm. The data shown in Figure 4 revealed that the scattering intensities () were characterized by strong maxima, indicating the formation of aggregated structures. These peaks correlated well with the hydrodynamic diameters (), which passed through a maximum at . The scattering intensity for the Alumina (+) was successfully adjusted using Equation (6), leading to a stoichiometry of two particles per vesicle at the two temperatures investigated. For Silica (+), the scattering maxima were less prominent and shifted to lower X ( = 0.2), leading to a stoichiometry of 10 particles per vesicle. For Alumina (+) and Silica (+), the aggregate stoichiometry was determined from Equation (4). For Silica (−), the scattering intensity varied monotonously as a function of , in agreement with the non-interacting prediction from Equation (3). The results from Figure 4 suggested that the nanoparticle-vesicle aggregate formation was driven by electrostatic interaction. For same charge systems, aggregation was not observed. Finally, none of the nanoparticles tested here displayed light scattering signatures characteristic of SLBs.
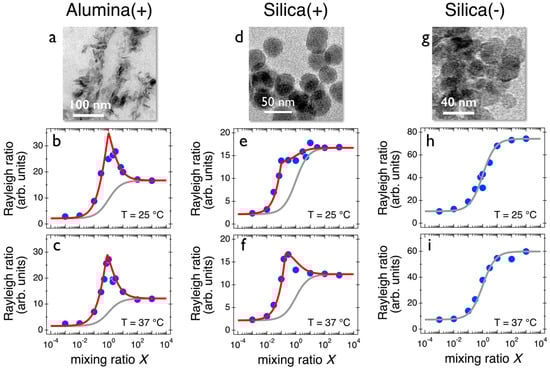
Figure 4.
(a,d,e) Transmission electron microscopy images of alumina and silica (positive and negative) particles used in this study. The particles are dubbed Alumina (+), Silica (+), and Silica (−), respectively. (b,c) Rayleigh ratio of alumina-vesicle dispersions as a function of the mixing ratio at T = 25 °C and T = 37 °C, respectively. The continuous lines in red are from Equation (6), indicating the formation of mixed aggregates, and those in grey from Equation (3). (e,f) Same as in Figure 4b,c for Silica (+) particles. (h,i) Rayleigh ratio of negatively charged silica-vesicle dispersions as a function of the mixing ratio at T = 25 °C and T = 37 °C, respectively. The continuous lines in grey are from Equation (3), indicating no interaction.
4. Conclusions
In this work we studied the interaction of engineered nanoparticles with lipid vesicles, and searched for prominent features pertaining to their scattering properties. The first goal was to provide tools to characterize the different types of structures resulting from synthetic and biological membranes and nanomaterials, an issue that is relevant in many biophysical applications. The second objective consisted of writing down equations for the scattering of dilute solutions, containing either nanoparticle-vesicle aggregates or supported lipid bilayers. The expressions for the scattering cross-sections were simple and analytical and they show the importance of the Job scattering plot approach. They also allow the ability to discriminate between different association scenarios. It was found, for instance, that for 40 nm particles and 100 and 200 nm vesicles, the nano-SLB scattering lies below that of the non-interacting species. This effect was actually amplified for large vesicles or for vesicles with strong scattering contrast. On the other hand, the aggregate formation was associated with a strong increase in light scattering, well above the predictions of the non-interacting model. The models proposed are also implementable because the form factor, the dispersity, or the interaction of the particles and vesicles can be taken into account in the equations. The result that emerges from the experiments on alumina and silica particles is that electrostatics plays an important role in the association, but is not sufficient to induce the formation, of supported lipid bilayers.
Author Contributions
F.M. and J.-F.B. designed and conceived the experiments. F.M., E.K.O., V.B. and S.M. contributed to the particle synthesis and characterization, and to the development of the method of continuous variation for Job scattering plots. F.M. performed the light scattering experiments J.-F.B. analyzed the data, designed the model and wrote the paper.
Funding
ANR (Agence Nationale de la Recherche) and CGI (Commissariat à l’Investissement d’Avenir) are gratefully acknowledged for their financial support of this work through Labex SEAM (Science and Engineering for Advanced Materials and devices) ANR 11 LABX 086, ANR 11 IDEX 05 02. This research was supported in part by the Agence Nationale de la Recherche under the contracts: ANR-13-BS08-0015 (PANORAMA), ANR-12-CHEX-0011 (PULMONANO) and ANR-15-CE18-0024-01 (ICONS) and by Solvay.
Acknowledgments
We thank Armelle Baeza-Squiban, Mostafa Mokhtari, Chloé Puisney for fruitful discussions. Annie Vacher and Marc Airiau from the Solvay Research & Innovation Centre Paris (Aubervilliers, France) are acknowledged for carrying out the electron microscopy experiments.
Conflicts of Interest
The authors declare no conflict of interest.
References
- Brook, R.D.; Rajagopalan, S.; Pope, C.A.; Brook, J.R.; Bhatnagar, A.; Diez-Roux, A.V.; Holguin, F.; Hong, Y.L.; Luepker, R.V.; Mittleman, M.A.; et al. Particulate matter air pollution and cardiovascular disease: An update to the scientific statement from the American Heart Association. Circulation 2010, 121, 2331–2378. [Google Scholar] [CrossRef] [PubMed]
- Xia, T.; Zhu, Y.F.; Mu, L.N.; Zhang, Z.F.; Liu, S.J. Pulmonary diseases induced by ambient ultrafine and engineered nanoparticles in twenty-first century. Natl. Sci. Rev. 2016, 3, 416–429. [Google Scholar] [CrossRef] [PubMed]
- Bajaj, P.; Harris, J.F.; Huang, J.H.; Nath, P.; Iyer, R. Advances and Challenges in Recapitulating Human Pulmonary Systems: At the Cusp of Biology and Materials. ACS Biomater. Sci. Eng. 2016, 2, 473–488. [Google Scholar] [CrossRef]
- Puisney, C.; Baeza-Squiban, A.; Boland, S. Mechanisms of uptake and translocation of nanomaterials in the lung. In Cellular and Molecular Toxicology of Nanoparticles; Saquib, Q., Faisal, M., Al-Khedhairy, A.A., Alatar, A.A., Eds.; Springer: Cham, Switzerland, 2018; pp. 21–36. [Google Scholar]
- Lopez-Rodriguez, E.; Perez-Gil, J. Structure-function relationships in pulmonary surfactant membranes: From biophysics to therapy. Biochim. Biophys. Acta Biomembr. 2014, 1838, 1568–1585. [Google Scholar] [CrossRef] [PubMed]
- Wustneck, R.; Perez-Gil, J.; Wustneck, N.; Cruz, A.; Fainerman, V.B.; Pison, U. Interfacial properties of pulmonary surfactant layers. Adv. Colloids Interface Sci. 2005, 117, 33–58. [Google Scholar] [CrossRef] [PubMed]
- Rascol, E.; Devoisselle, J.M.; Chopineau, J. The relevance of membrane models to understand nanoparticles-cell membrane interactions. Nanoscale 2016, 8, 4780–4798. [Google Scholar] [CrossRef] [PubMed]
- Michel, R.; Gradzielski, M. Experimental Aspects of Colloidal Interactions in Mixed Systems of Liposome and Inorganic Nanoparticle and Their Applications. Int. J. Mol. Sci. 2012, 13, 11610–11642. [Google Scholar] [CrossRef] [PubMed]
- Froehlich, E. The role of surface charge in cellular uptake and cytotoxicity of medical nanoparticles. Int. J. Nanomed. 2012, 7, 5577–5591. [Google Scholar] [CrossRef] [PubMed]
- Troutier, A.-L.; Ladaviere, C. An overview of lipid membrane supported by colloidal particles. Adv. Colloids Interface Sci. 2007, 133, 1–21. [Google Scholar] [CrossRef] [PubMed]
- Zhang, S.L.; Gao, H.J.; Bao, G. Physical Principles of Nanoparticle Cellular Endocytosis. ACS Nano 2015, 9, 8655–8671. [Google Scholar] [CrossRef] [PubMed]
- Conner, S.D.; Schmid, S.L. Regulated portals of entry into the cell. Nature 2003, 422, 37–44. [Google Scholar] [CrossRef] [PubMed]
- Bahrami, A.H.; Raatz, M.; Agudo-Canalejo, J.; Michel, R.; Curtis, E.M.; Hall, C.K.; Gradzielski, M.; Lipowsky, R.; Weikl, T.R. Wrapping of nanoparticles by membranes. Adv. Colloids Interface Sci. 2014, 208, 214–224. [Google Scholar] [CrossRef] [PubMed]
- Dasgupta, S.; Auth, T.; Gompper, G. Shape and Orientation Matter for the Cellular Uptake of Nonspherical Particles. Nano Lett. 2014, 14, 687–693. [Google Scholar] [CrossRef] [PubMed]
- Deserno, M.; Gelbart, W.M. Adhesion and wrapping in colloid-vesicle complexes. J. Phys. Chem. B 2002, 106, 5543–5552. [Google Scholar] [CrossRef]
- Mornet, S.; Lambert, O.; Duguet, E.; Brisson, A. The formation of supported lipid bilayers on silica nanoparticles revealed by cryoelectron microscopy. Nano Lett. 2005, 5, 281–285. [Google Scholar] [CrossRef] [PubMed]
- Mousseau, F.; Puisney, C.; Mornet, S.; Le Borgne, R.; Vacher, A.; Airiau, M.; Baeza-Squiban, A.; Berret, J.F. Supported pulmonary surfactant bilayers on silica nanoparticles: Formulation, stability and impact on lung epithelial cells. Nanoscale 2017, 9, 14967–14978. [Google Scholar] [CrossRef] [PubMed]
- Liu, J.W. Interfacing Zwitterionic Liposomes with Inorganic Nanomaterials: Surface Forces, Membrane Integrity, and Applications. Langmuir 2016, 32, 4393–4404. [Google Scholar] [CrossRef] [PubMed]
- Sachan, A.K.; Harishchandra, R.K.; Bantz, C.; Maskos, M.; Reichelt, R.; Galla, H.J. High-Resolution Investigation of Nanoparticle Interaction with a Model Pulmonary Surfactant Monolayer. ACS Nano 2012, 6, 1677–1687. [Google Scholar] [CrossRef] [PubMed]
- Pera, H.; Nolte, T.M.; Leermakers, F.A.M.; Kleijn, J.M. Coverage and Disruption of Phospholipid Membranes by Oxide Nanoparticles. Langmuir 2014, 30, 14581–14590. [Google Scholar] [CrossRef] [PubMed]
- Savarala, S.; Ahmed, S.; Ilies, M.A.; Wunder, S.L. Formation and Colloidal Stability of DMPC Supported Lipid Bilayers on SiO2 Nanobeads. Langmuir 2010, 26, 12081–12088. [Google Scholar] [CrossRef] [PubMed]
- Le Bihan, O.; Bonnafous, P.; Marak, L.; Bickel, T.; Trepout, S.; Mornet, S.; De Haas, F.; Talbot, H.; Taveau, J.C.; Lambert, O. Cryo-electron tomography of nanoparticle transmigration into liposome. J. Struct. Biol. 2009, 168, 419–425. [Google Scholar] [CrossRef] [PubMed]
- Mousseau, F.; Berret, J.F. The role of surface charge in the interaction of nanoparticles with model pulmonary surfactants. Soft Matter 2018, 14, 5764–5774. [Google Scholar] [CrossRef] [PubMed]
- Waisman, D.; Danino, D.; Weintraub, Z.; Schmidt, J.; Talmon, Y. Nanostructure of the aqueous form of lung surfactant of different species visualized by cryo-transmission electron microscopy. Clin. Physiol. Funct. Imaging 2007, 27, 375–380. [Google Scholar] [CrossRef] [PubMed]
- Schleh, C.; Muhlfeld, C.; Pulskamp, K.; Schmiedl, A.; Nassimi, M.; Lauenstein, H.D.; Braun, A.; Krug, N.; Erpenbeck, V.J.; Hohlfeld, J.M. The effect of titanium dioxide nanoparticles on pulmonary surfactant function and ultrastructure. Respir. Res. 2009, 10, 90. [Google Scholar] [CrossRef] [PubMed]
- Bernardino de la Serna, J.; Vargas, R.; Picardi, V.; Cruz, A.; Arranz, R.; Valpuesta, J.M.; Mateu, L.; Perez-Gil, J. Segregated ordered lipid phases and protein-promoted membrane cohesivity are required for pulmonary surfactant films to stabilize and protect the respiratory surface. Faraday Discuss. 2013, 161, 535–548. [Google Scholar] [CrossRef] [PubMed]
- Curstedt, T.; Halliday, H.L.; Speer, C.P. A Unique Story in Neonatal Research: The Development of a Porcine Surfactant. Neonatology 2015, 107, 321–329. [Google Scholar] [CrossRef] [PubMed]
- De Backer, L.; Braeckmans, K.; Stuart, M.C.A.; Demeester, J.; De Smedt, S.C.; Raemdonck, K. Bio-inspired pulmonary surfactant-modified nanogels: A promising siRNA delivery system. J. Control. Release 2015, 206, 177–186. [Google Scholar] [CrossRef] [PubMed]
- Wohlleben, W.; Driessen, M.D.; Raesch, S.; Schaefer, U.F.; Schulze, C.; von Vacano, B.; Vennemann, A.; Wiemann, M.; Ruge, C.A.; Platsch, H.; et al. Influence of agglomeration and specific lung lining lipid/protein interaction on short-term inhalation toxicity. Nanotoxicology 2016, 10, 970–980. [Google Scholar] [CrossRef] [PubMed]
- Michel, R.; Plostica, T.; Abezgauz, L.; Danino, D.; Gradzielski, M. Control of the stability and structure of liposomes by means of nanoparticles. Soft Matter 2013, 9, 4167–4177. [Google Scholar] [CrossRef]
- Rasch, M.R.; Rossinyol, E.; Hueso, J.L.; Goodfellow, B.W.; Arbiol, J.; Korgel, B.A. Hydrophobic Gold Nanoparticle Self-Assembly with Phosphatidylcholine Lipid: Membrane-Loaded and Janus Vesicles. Nano Lett. 2010, 10, 3733–3739. [Google Scholar] [CrossRef] [PubMed]
- Michel, R.; Kesselman, E.; Plostica, T.; Danino, D.; Gradzielski, M. Internalization of Silica Nanoparticles into Fluid Liposomes: Formation of Interesting Hybrid Colloids. Angew. Chem. Int. Ed. 2014, 53, 12441–12445. [Google Scholar] [CrossRef]
- Mousseau, F.; Le Borgne, R.; Seyrek, E.; Berret, J.-F. Biophysicochemical Interaction of a Clinical Pulmonary Surfactant with Nanoalumina. Langmuir 2015, 31, 7346–7354. [Google Scholar] [CrossRef] [PubMed]
- Reviakine, I.; Johannsmann, D.; Richter, R.P. Hearing what you cannot see and visualizing what you hear: Interpreting quartz crystal microbalance data from solvated interfaces. Anal. Chem. 2011, 83, 8838–8848. [Google Scholar] [CrossRef] [PubMed]
- Dubochet, J. On the Development of Electron Cryo-Microscopy (Nobel Lecture). Angew. Chem. Int. Ed. 2018. [Google Scholar] [CrossRef] [PubMed]
- Job, P. Studies on the formation of complex minerals in solution and on their stability. Ann. Chim. France 1928, 9, 113–203. [Google Scholar]
- Renny, J.S.; Tomasevich, L.L.; Tallmadge, E.H.; Collum, D.B. Method of Continuous Variations: Applications of Job Plots to the Study of Molecular Associations in Organometallic Chemistry. Angew. Chem. Int. Ed. 2013, 52, 11998–12013. [Google Scholar] [CrossRef] [PubMed]
- Fresnais, J.; Lavelle, C.; Berret, J.-F. Nanoparticle Aggregation Controlled by Desalting Kinetics. J. Phys. Chem. C 2009, 113, 16371–16379. [Google Scholar] [CrossRef]
- Mousseau, F.; Vitorazi, L.; Herrmann, L.; Mornet, S.; Berret, J.F. Polyelectrolyte assisted charge titration spectrometry: Applications to latex and oxide nanoparticles. J. Colloid Interface Sci. 2016, 475, 36–45. [Google Scholar] [CrossRef] [PubMed]
- Oikonomou, E.K.; Mousseau, F.; Christov, N.; Cristobal, G.; Vacher, A.; Airiau, M.; Bourgaux, C.; Heux, L.; Berret, J.F. Fabric Softener–Cellulose Nanocrystal Interaction: A Model for Assessing Surfactant Deposition on Cotton. J. Phys. Chem. B 2017, 121, 2299–2307. [Google Scholar] [CrossRef] [PubMed]
- Torrisi, V.; Graillot, A.; Vitorazi, L.; Crouzet, Q.; Marletta, G.; Loubat, C.; Berret, J.-F. Preventing Corona Effects: Multiphosphonic Acid Poly(ethylene glycol) Copolymers for Stable Stealth Iron Oxide Nanoparticles. Biomacromolecules 2014, 15, 3171–3179. [Google Scholar] [CrossRef] [PubMed]
- Reinhardt, N.; Adumeau, L.; Lambert, O.; Ravaine, S.; Mornet, S. Quaternary Ammonium Groups Exposed at the Surface of Silica Nanoparticles Suitable for DNA Complexation in the Presence of Cationic Lipids. J. Phys. Chem. B 2015, 119, 6401–6411. [Google Scholar] [CrossRef] [PubMed]
- Vitorazi, L.; Ould-Moussa, N.; Sekar, S.; Fresnais, J.; Loh, W.; Chapel, J.P.; Berret, J.-F. Evidence of a two-step process and pathway dependency in the thermodynamics of poly(diallyldimethylammonium chloride)/poly(sodium acrylate) complexation. Soft Matter 2014, 10, 9496–9505. [Google Scholar] [CrossRef] [PubMed]
- Giamblanco, N.; Marletta, G.; Graillot, A.; Bia, N.; Loubat, C.; Berret, J.-F. Serum Protein-Resistant Behavior of Multisite-Bound Poly(ethylene glycol) Chains on Iron Oxide Surfaces. ACS Omega 2017, 2, 1309–1320. [Google Scholar] [CrossRef]
- Lindner, P.; Zemb, T. Neutrons, X-Rays and Light: Scattering Methods Applied to Soft Condensed Matter; Elsevier: Amsterdam, The Netherlands, 2002. [Google Scholar]
- Berret, J.-F. Stoichiometry of electrostatic complexes determined by light scattering. Macromolecules 2007, 40, 4260–4266. [Google Scholar] [CrossRef]
© 2018 by the authors. Licensee MDPI, Basel, Switzerland. This article is an open access article distributed under the terms and conditions of the Creative Commons Attribution (CC BY) license (http://creativecommons.org/licenses/by/4.0/).