Abstract
A series of Eu3+ doped CaSiO3/SiO2 nano-phosphor powder of controlled grain size, crystalline structure, and chemical composition were synthesized using the microemulsion technique. The morphology, size, and shape of the synthesized nanophosphorous powder were investigated using transmission electron microscopy and X-ray diffraction (XRD) analysis. XRD profiles of samples sintered over 600 °C, suggested phase shift from amorphous powder grain to more ordered polycrystalline powder of triclinic type wollastonite, CaSiO3, with preferred crystal phase orientation of (112) and tetragonal type cristobalites of SiO2. The grain size, crystallinity, and chemical composition of the host matrix, activator and sensitizer strongly affected both the absorption and emission bands of these samples. The amplitude of both the orange and red emission bands significantly increased with sintering temperature. The emission band is red-shifted with decreasing grain sizes. These bands displayed good sensitivity to ionic concentration of the Si4+, Ca2+, and Eu3+. With increasing Ca2+ ion concentration both the intensity of the red photoluminescence (PL) band increased and a concentration quenching observed. Increase in Si4+ ion concentration led to quenching in PL intensity of both the orange and red bands, whereas the amplitude of the blue-band slightly increased. With increasing Eu3+ ion concentration the red-band initially increased whereas it started decreasing at higher sample concentration. In the presence of Ca2+ ion as a sensitizer, the sample showed a remarkable PL property-including–about 100% photon conversion efficiency and a two-fold increase in excitation and emission photons.
1. Introduction
Eu3+ doped phosphors are employed in lighting and display technologies such as electroluminescence cells, plasma display panels, high-efficiency fluorescent lamps, light emitting diodes, and waveguides as they show remarkable photoluminescence (PL) properties [1,2,3,4,5]. In pure form, Eu3+ ions show emission lines extending from visible to near infra-red domain of the electromagnetic spectrum. These ions usually absorb photons in the ultraviolet (UV) region (200 to 270 nm) and emit orange and red lines in the visible region. A phosphor that absorbs photons in this domain is suitable for making display panels, fluorescent lamps, and sensors [6,7]. However, absorption of Eu3+ in the UV region is weak, and such phosphorous are not suitable in making light emitting diodes (LED). By adding Eu3+ as a dopant into a host matrix such as SiO3 and in the presence of rare earth ions as sensitizers, the luminescence property of this phosphor can, however, enhance substantially. When used as a dopant in a glass matrix, the Eu3+ ions, however, show absorption and emission bands instead of absorption and emission lines. The peak positions and intensities of these bands bear a strong relationship with the size distribution of the crystal grain, their chemical composition, and morphology. Earlier reports have shown that crystal grain size, their distribution, resistance to particle agglomeration, and spherical morphology are the most critical factors for a phosphor to have good luminescent characteristics [8,9,10].
In the past, techniques such as solid-state chemistry [8] and ion implantation [9] have been the sole means of synthesizing phosphor material (PM). Today these techniques are becoming unpopular for several considerations. These include high production cost and poor product quality as identified by weak PL efficiency and poor non-linear optical effects. The problem is that these methods are energy intensive as the mixing of activator and sensitizer ions with the host are carried out at and around the melting temperature of the host matrix. It means the viscous nature of the melt does not allow having a homogenous mixing of the activator ion, and the glass matrix is impossible to achieve.
Another inherent problem is that phosphor particles and crystallite grains tend to precipitate upon cooling, and this process accompanies agglomeration of particles that is induced by inter-ionic interaction. The result is the production of low quality; the poorly homogenized phosphor is not suitable for the most optoelectronic applications. These, in turn, suggest that the possibilities of improving the quality of PM are a cumbersome job when robust state methods are employed, whereas the new developments in display and other technologies such as light amplifiers and wave-guides require drastic improvement in PL efficiency and non-linear optical properties [11]. Therefore, there is a need to reduce production cost.
The solutions to these problems have been addressed using rather simple solution-based synthesis techniques such as sol-gel and micro-emulsion, and these techniques are gaining widespread popularity for the past few decades [12,13,14]. Also, these techniques make use of simple room temperature hydrolysis and polycondensation reaction [15,16] of the starting material such as tetraethylorthosilicate (TEOS), yielding glasses and oxide powders of high purity and homogeneity and to some degree with tailored grain size, morphology, and dispersity index.
A large number of reports suggest that the PL properties of the phosphor strongly depend on the composition of the glass matrix, crystal structure and grain size of the crystallites [17,18]. For example, the reduction in grain size often leads to significant improvement in luminescence efficiency and non-linear optical effects [19]. Interestingly, the increase in luminescence efficiency is reported to be accompanied by a decrease in absorption intensity and redshift in both the absorption and emission bands. For these reasons, for the past decade, the exploration of size-dependent properties of the phosphor has been a subject of scrutiny. This work reports on how the photoluminescence property of Eu3+ doped nanophosphor is affected by factors such as the composition of glass matrix, dopant concentration, the average size of crystals and sintering temperature as well as on how particle size of the powder can be controlled and tailored using emulsion technique.
The excitation and emission bands of Eu3+ ion are broad due to the transition of electrons between the 4F7 ground state and the crystal field component of the 4F6→5D7 excited state configuration [20]. Luminescence band is observed either from excitonic emission, also referred to as recombination of an electron-hole pair, or from the radiative relaxation of the trap states [21]. While excitonic emission is characterized by narrow, near absorption edge luminescence, the trap-state emission is characterized by broad, strong red-shifted luminescence that sometimes exhibits multiple bands, also referred to as band splitting. The electron-hole pair results from the absorption of a photon.
The problem is that with the decrease in size, the photoluminescence may show an increasing number of defect sites as the surface-to-volume ratio increases with decreasing particle size. The rising defects result in rapid trapping of either the electron or the hole and lead to localization of charged site at the surface [22,23].
In literature, a wide variety of sensitizers have been used to enhance the photoluminescence efficiency of the silica-based phosphor. However, the problem is that the energy transfer from the sensitizer to Eu3+ has been minimal. This work utilizes Ca2+ as a sensitizer since the energy transfer from Ca2+ to Eu3+ is accompanied by endothermic charge transfer reaction, leading to dramatic enhancement in photoluminescence property of the nano-phosphor - including a two-fold increase in photon absorption and emission and 100% quantum efficiency for a down-conversion phosphor.
2. Materials and Methods
Reagent grade cyclohexane of 99.5% purity was used as an oil phase. Ca(NO3)2 was used as sources of Ca2+ ions, and these were of 99% purity. The anionic surfactant used was Triton X-45, and it was of analytical grade. It usually comes as a poly-dispersed preparation of tetra-methyl-butyl-phenyl-poly-oxyethylene with an average of 5 oxyethylene groups per molecule. The source of silica glass precursor was TEOS (tetra ethoxy silicate). All these were purchased from Fluka (Mexico City, Mexico). The dopant used was Eu(NO3)3 of 99.9% purity, and it was purchased from Sigma-Aldrich Chemicals Company (Oakville, ON, Canada). Ammonium hydroxide (solution of 25% NH3) was used as a hydrolytic agent, and it was of reagent grade. Absolute ethanol, 99.8% purity (HmbG GmbH, Hamburg, Germany) was employed to clean the glassware used in this work. The deionized water used was from Millipore Sigma (Etobicoke, ON, Canada) with an ionic conductivity of 18 µS/cm.
The morphology, size, and shape of the synthesized phosphor powder were analyzed using a Philips CM12 transmission electron microscope (TEM). The particle size of the sample was also measured using Coulter counter N4 plus photo correlation spectroscopy. The crystal structure and their phase composition were analyzed using Rigaku RINT-1400 X-ray diffraction (Rigaku, Tokyo, Japan) system. This system is supplied with a Cu Kα radiation source of 40 kV and 100 mA. Both the PL and photoluminescence excitation spectra were scanned using a PERKIN ELMER LS 50B luminescence spectrometer (PERKIN ELMER LS 50B, Buckinghamshire, UK). Thermal analysis was carried out using Mettler Toledo made thermos gravity metric analyzer (TGA). As far as curing is concerned, the sol-gel reaction was carried from 100 °C to 1000 °C under neutral gas atmosphere with a heating rate of 10 °C/min, whereas the gas flow rate was maintained at 120 cm3/min.
As described above, the Eu3+ ion doped CaSiO3 phosphor powder were prepared using the microemulsion technique, whereby TEOS is used as the glass precursor. Two types of water-in-oil (w/o) micro-emulsion systems were prepared separately. These can be referred to as w/o system 1 and w/o system 2. Both systems contained three common components, viz., the surfactant, TEOS, and cyclohexane as the continuous phase. Both systems contained 15 wt % surfactant, 82.46 wt % of cyclohexane, 1.54 wt % of TEOS and 1.0 wt % of the aqueous solution. The only difference between system 1 and 2 was that system 1 contained 3.0 M calcium nitrate with varying concentration of europium nitrate, whereas system 2 included a solution of 0.5 M ammonium hydroxide.
The water-to-surfactant molar ratio is also denoted as R0 from now on. By varying total water concentration, the R0 value of samples was varied. In this case, the R0 value of emulsions was changed from 0.12 to 0.3 as the average grain size of the crystallite, which is obtained because of hydrolysis and condensation reaction of TEOS, appears to depend mainly on R0 value of the emulsion system from which they are prepared. Further explanation of this is given elsewhere [12,13,14], and it will not be discussed here. Note, in any case, while varying the value of R0 the overall concentration ratios of ethanol, surfactant and TEOS is kept constant. Next, equal amounts of system 1 and 2 were mixed in a third container, which in its turn under-went continuous stirring for 24 h. At the end of 24 h, this would give Eu3+ ion doped dispersion of CaSiO3 and SiO3 phosphor. This procedure naturally yields PM with nanometer-sized grains, whereby the grain size is primarily defined by the R0 value of the emulsion used during synthesis.
Next, for removing the oil phase (cyclohexene in this case) and surfactant, the dispersed phosphor is then washed five times with ethanol. These particles are then collected and dried at 200 °C for two hours followed by sintering at 400 °C to 800 °C for 3 hours. Note, the heat treatment is designed to remove any residue of surfactant, water, and oil from the sample. The given samples were calcinated at a temperature ranging from 400 °C to 800 °C, as the grain size of the phosphor is also affected by curing conditions.
3. Results and Discussions
3.1. Morphological and Microstructure Analysis
Particle sizes play a crucial role in photoluminescent study. In this work, we investigate the morphology and microstructure properties of nanophosphorous powder using transmission electron microscopy (TEM) and X-ray diffraction (XRD) analysis. The morphological properties studied using TEM for the as-synthesized nanophosphor powders with R0 varied from 0.12 to 0.3 are depicted in Figure 1. The TEM images indicate that grain size of the phosphor depended strongly on R0 value of the micro-emulsion of which they were synthesized: The grain size of the phosphor powder, increased with the increase in R0 and vice versa. As can be seen in these TEM images, the phosphor samples under investigation were mono-dispersed regarding grain size distribution and were spherical irrespective of R0 values. These images further suggest that by controlling the size of droplets of the microemulsion, the grain size of the phosphor powder can be controlled with a high degree of accuracy.
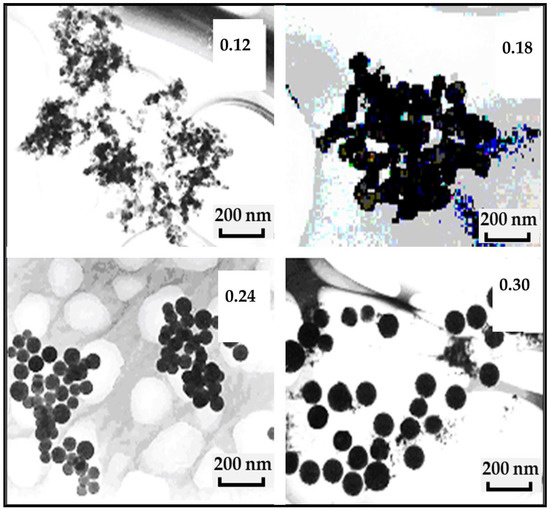
Figure 1.
TEM images of Eu3+ doped CaSiO3 nanophosphor powder as a function of water-to-surfacant raito, R0 value (0.12, 0.18, 0.24, and 0.30) of micro-emulsions for sample sintered at 800 °C. R0 is the water-to-surfactant molar ratio.
Light scattering technique was also employed to measure the grain size of the phosphor powder. In this case, Coulter Counter N4 Plus was used. R0 value dependent grain size of the phosphor powder is given in Figure 2a. As in the case of TEM images, the average grain size and size distribution of the phosphor increased with increasing R0. Figure 2b shows the effect of sintering on grain size. As shown in the figure, the grain size increased with increasing sintering temperature.
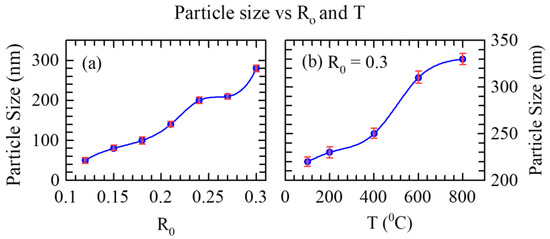
Figure 2.
(a)The plot of R0 value dependent average particle size of Eu3+ doped CaSiO3 nanophosphor powder sintered at 800 °C (b) Sintering temperature (T) dependence of grain size distribution of Eu3+ doped CaSiO3 nanophosphor powder at R0 = 0.30. The data were analyzed using a quadratic regression analysis, by utilizing the method of least squares, and fitted with the models generated from the available data, thus ensuring best fits with minimum errors.
The effect of Eu3+ concentration (varied from 1 to 5 mol%), sintering temperature, Si4+ concentration on the XRD spectra of the nanophosphor was also studied (For these details, see, a supplementary file). Below we study the effect of the sintering temperature and Ca2+ ion concentration on the microstructure/crystallinity of the nanophosphors powder.
Sintering temperature (T) seems to play an important role in defining the grain size of the synthesized nanophosphor. Figure 3 shows the effect of sintering temperature on the XRD profiles of the nanophosphor. As shown in the figure, no sharp peaks occur at T < 600 °C suggesting that the nano-powder is amorphous at these temperatures.
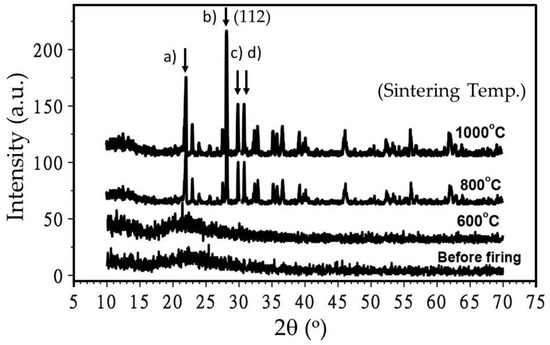
Figure 3.
Effect of sintering temperature on XDR spectra (Intensity vs. 2θ°) of Eu3+ doped CaSiO3/SiO2 nanophosphor powder. Samples were prepared using a R0 value of 0.30 and by keeping the concentration of Ca2+ in constant. XRD peaks. 2θ = (a) 22.0° (101), (b) 28.1° (111), (c) 30.0° and (d) 31.0° (102), become more intense (shown by the vertical black arrows) with the increasing sintering temperature.
At T ≥ 600 °C, XRD peaks at 2θ = 22.0°, 28.1°, 30.0°, and 31.0° get more defined and more calcinated suggesting that a distinct, crystalline phase develops at this temperature. The observed peaks match to that of compound (JCPDS # 27-28). Except small trace of Ca2SiO4 phase, the observed profile shows triclinic CaSiO3 phase [24]. Since there is no change in peak positions at T > 800 °C, the results suggest that these samples can be sintered well at T = 800 °C.
Next, we studied the effect of Ca2+ ion on the crystallinity of the Eu3+ doped CaSiO3/SiO2 nanophosphor powder, sintered at 800 °C (see, Figure 4). The observed peaks match similarly to that of compound (JCPDS # 27-28), however the diffraction peaks get stronger with the increase of Ca2+ ion concentration suggesting that Ca2+ ion concentration plays a significant role in imparting crystal structure. The preferred crystal orientation is (112) in this case.
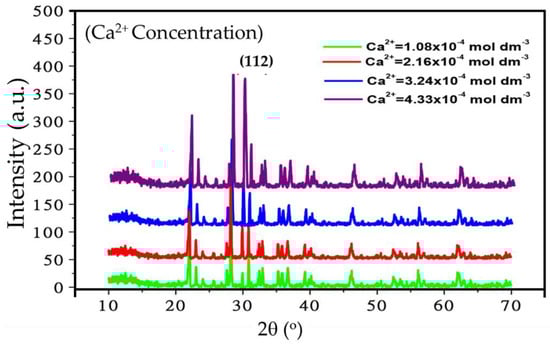
Figure 4.
Effect of Ca2+ ion concentration on XRD spectra (Intensity vs. 2θ°) of Eu3+ doped CaSiO3 nanophosphor powder. The samples were prepared in identical condition using a R0 value of 0.30 and sintered at 800 °C.
3.2. Photoluminescence Spectra Analysis
The excitation and emission spectra of the Eu3+ doped CaSiO3/SiO2 nanopowder is shown in Figure 5. Figure in the left shows two excitation spectra shown in the left (ultra-violet region), resolved at 220 nm and 223 nm. The excitation spectra of Eu3+ doped phosphor is complicated to interpret as it depends largely on phase symmetry around the ion. In the present case, the excitation at around 220 and 223 nm is due to the Eu3+-O2 band charge transfer and is closely related to the degree of covalency of the Eu3+-ligand bond, as explained by considering Eu3+-O2−-Ca2+ bonding structure. Since the Ca2+ ion is a cation with a smaller radius and larger electronegativity compared to Eu3+ ion, the electron density clouding around O2− ion decreases when it is bonded to Ca2+ ion. In addition to the prominent excitation peaks, several weak shoulders are also observed due to the excitation from 5D0 to 7FJ transitions (J = 1, 2, 3...) here [22]. The curve shows very small excitation near the λ = 395 nm.
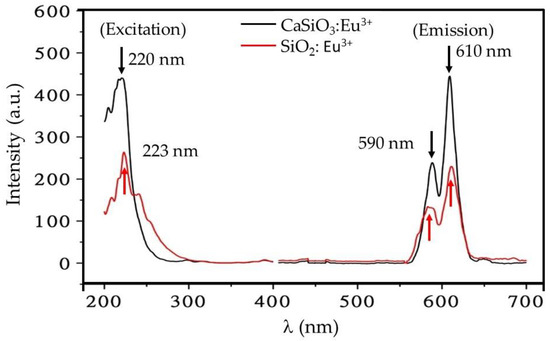
Figure 5.
Excitation (left) and emission (right) spectra of Eu3+ doped CaSiO3/SiO2 nanopowder, denoted by a red line for Eu3+ doped SiO2 and a black line for Eu3+ doped CaSiO3 (5 mol. % Eu3+). Samples were prepared using a R0 value of 0.30 and sintered at 800 °C.
Figure 5 in the right shows two emission spectra (visible region) at λ = 590 and 610 nm, corresponding to the 5D0→7F1 (symmetry sites) and 5D0→7F2 ((hypersensitive to local symmetry), transitions, respectively. The amplitude of the 610 nm is almost twice larger than the amplitude of 590 nm line. The emission around 650 nm. In addition, the emission spectra excited at 220 nm is sharper as compared to the emission spectra excited at 223 nm. Both of the prominent emission peaks excited at 220 nm and 223 nm are observed at around the same wavelengths of 590 and 610 nm, respectively. Based on our calculation carried out similarly to de Boer et al., the quantum efficiency —the ratio between number of photons created and the number of photons absorbed is estimated to be close to 100% [25].
Since the maximum emission output was obtained for 220 nm (Figure 5), excitation λ = 220 nm is chosen instead of 223 nm to excite the Eu3+ doped CaSiO3 using a R0 = 0.12 (instead of 0.30 in Figure 5) and sintered at 800 °C. A typical spectrum consisting of various excitation bands is displayed in Figure 6. The broadband resolved at ≈220 nm is thought to be due to the excitation of the host lattice. Its immediate implication is that the excited host lattice in its turn can transfer the energy to its neighboring activator ion through lattice vibration. The activator ion in its turn absorbs this quantum of energy, because of which it shows two broad excitation bands, peaking at 240 nm and 255 nm, whereas a blue color emission rising at 390 nm accompanies these processes. A small excitation peak is also observed near 212 nm.
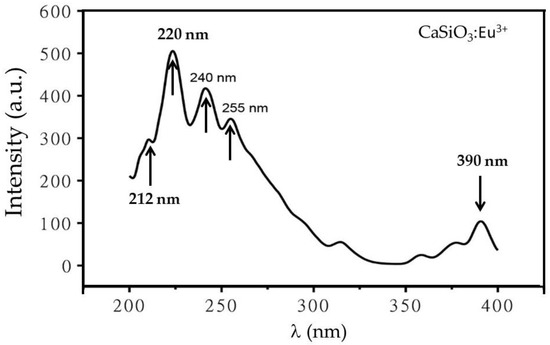
Figure 6.
The excitation spectra of Eu3+ doped CaSiO3 nanophosphor powder showing a weak blue excitation near 390 nm. The sample was prepared using a R0 = 0.12 and sintered at 800 °C.
The broad adsorption band resolved at 220 nm is usually assigned to electronic shift involving the transfer of charge from O2− ions to ligand to rare earth ion, whereas the excitation band at 390 nm is thought to be due to intra-ionic 4F6→5D1 transition. Note these transitions are assigned based on lanthanide spectra of refs [20,26,27,28].
The photoluminescent spectrum of the Eu3+ doped CaSiO3/SiO2 nanophosphor at the excitation wavelength of 220 nm is given in Figure 7. Under these conditions, the given phosphor showed a small emission peak centered at ≈445 nm, whereas two sharp emission peaks are centered at ≈600 nm and 610 nm. Note the emission peaks at 590 nm and 610 nm are ascribed to transition of Eu3+ from 5Do to the 7F1 and from 5Do to the 7F2, respectively.
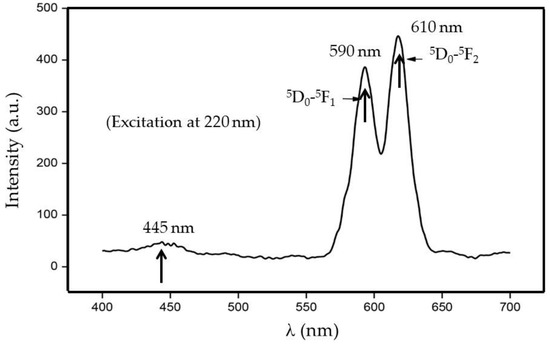
Figure 7.
Photoluminescence spectrum of Eu3+ doped CaSiO3/SiO2 nanophosphor powder at an excitation energy of 220 nm. The sample was prepared using a R0 value of 0.12 and sintered at 800 °C.
Eu3+ ion is characterized by a 7F ground state electronic manifold, whereas its lowest excited state shows 5Do character with the 5Do state emitting red light typical of Eu3+ activated phosphor. Also, it is a well-accepted fact that above the 5Do states, closely spaced F orbitals are present, and these are responsible for charge transfer states. Through the absorption of UV radiation, the Eu3+ ion gets excited into the charge transfer state, which subsequently relaxes into 5D0 level, emitting red light at 590 nm and 610 nm [29].
It is believed that the main emission peak at 610 nm is due to the electric dipole transition (EDT) of 5Do→7F2, whereas the emission peak at 590 nm is thought to be due to magnetic dipole transition (MDT) of 5Do→7F1. It is widely known that the 5Do→7F2 transition is hypersensitive and it depends strongly on local symmetry, whereas the 5Do→7F1 transition is usually insensitivities to site symmetry. These latter two types of developments generally originate from the presence of impurity ion as it cannot occupy the space along the center of symmetry of the crystal lattice, giving both MDT and EDTs [30]. It is also thought that only MDTs are allowed when a rare-earth impurity ion is located at the center of symmetry of a crystal lattice.
Interestingly, as shown in this figure, both the MDT (5D0→7F1) and EDT (5Do→7F2) spectra are observed in this case. For example, the EDT, at ≈610 nm probably arises because of lack of inversion symmetry at the Eu3+ site. The reason 5Do→7F2 transition is much stronger than 5Do→7F1 transition in that it is usually produced because of the crystal-field splitting of the 7F2 level. On the other hand, the MDT, 5Do→7F1, is insensitive to the site symmetry, and the reason why it has appeared here can be due to the lack of center of symmetry in CaSiO3 crystals [31].
The emission spectra at 445 nm is considered to be due to the presence of triclinic-CaSiO3 structure [32]. It is supposed that this band is related to a variety of factors acting independently or together. These may include multiple luminescent sites, a high degree of inhomogeneity in the sample, strong electron-phonon coupling, re-absorption of the emitted light by other sites. For further discussion, we refer interested readers to the paper by Kumar et al. [15] and Dhole et al. [24].
Next, we investigate the effect of dopant ion concentration on PL spectra of the phosphorous particles. As shown in Figure 8, the amplitude of PL of the measured spectra of the nanophosphor particles are directly affected by dopant ion concentration, in which the concentration of activator ion was varied whereas the composition of host matrix, synthesis procedure, and sintering temperature were kept constant. The PL intensity increases almost linearly up to 6 mol % of Eu3+ and decreases afterwards.
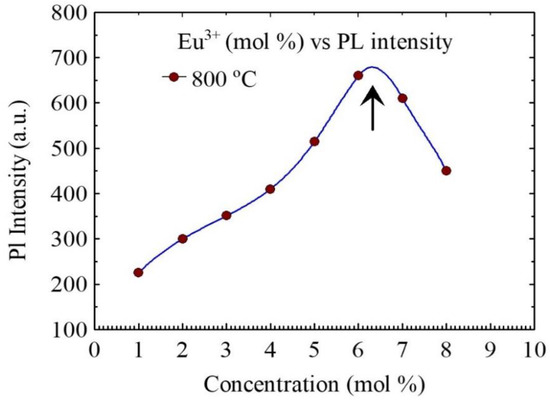
Figure 8.
Eu3+ ion concentration (mol %) dependence measured photoluminescence intensity of the CaSiO3/SiO2 nanophosphor powder excited at λ = 220 nm. All the samples were prepared using a R0 = 0.12 and sintered at 800 °C. Note the intensity transition at around 6 mol % of Eu3+.
The PL intensity of the transition strongly depends on the detail of the crystal size and lattice packing and the interionic distance. Higher intensities are always ascribed to the more ordered crystalline structure, which is believed to give rise to larger linear terms in the crystal field potential. This result suggests that when the dopant ion concentration increases beyond a specific threshold concentration, the luminescence intensity starts to decrease. Such a decrease in emission intensity as a function of dopant concentration is explained through the so-called quenching effect. Since the ionic radii of Ca2+ (0.106 nm) is smaller than the ionic radius of Eu3+ (0.113 nm), CaSiO3 host could accommodate only a small percentage of impurity ions. Due to the doping of Eu3+, there is charge imbalance in the host lattice. As a result, at the at the concentration > 6 mol%, it is highly likely that Eu3+ ions go to the interstitial sites. As a result, these atoms possibly trap the emitted light, leading to a reduction in emission intensity.
Next, we investigate how the PL spectra of these nanophosphor powders are influenced by sintering temperature as the λ varied from 400 to 700 nm. As shown in Figure 9, samples sintered at 400 °C gave the lowest emission intensity probably due to its amorphous nature. However, the intensity of the emission bands increased with increasing sintering temperature. This result suggests that emission bands at 610 nm and 580 nm are strongly related to the sintering temperature and suggesting the fact that more defined crystal structures evolve in these samples as a function of sintering temperature. As higher sintering temperature, the red emission bands, 610 nm, becomes stronger with no apparent splitting as in 590 nm band. The relative intensity of the peak at 590 nm is also increasing with higher sintering temperatures.
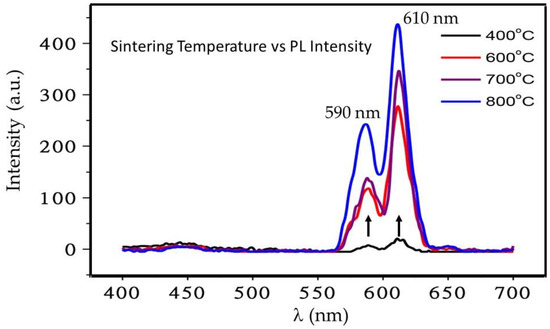
Figure 9.
Sintering temperature dependence excitation spectra of Eu3+ doped (5 mol %) CaSiO3/SiO2 nanophosphor powder using a R0 value of 0.12.
In Figure 10, we show the effect of silica concentration on the PL intensity while the concentrations of activator and alkali earth ions, R0 value and firing temperature were kept constant. The emission peak intensity at both wavelengths (590 and 610 nm) significantly increased whereas it decreased at 440 nm with increasing silica concentration. The result suggests that the activation energy of Eu3+ ion reduces with increasing silica concentration, which is further related to the crystallinity. The degree of crystallinity is linked to the silica concentration.
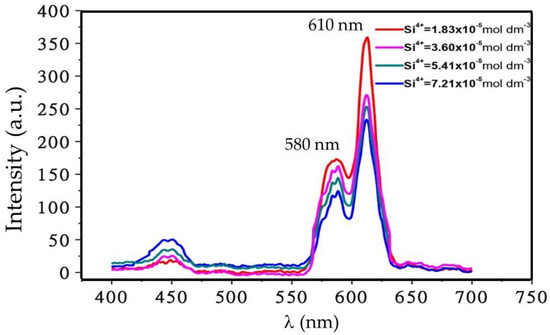
Figure 10.
Effect of silica concentration on PL spectra of Eu3+ doped CaSiO3/SiO2 nanophosphor powder, prepared using R0 = 0.12, with a Eu3+ ion concentration of 5 mol % and sintered at 800 °C.
Effect of Ca2+ ion concentration on emission spectra of Eu3+ doped CaSiO3 nanophosphor is shown in Figure 11. As the figure shows, the intensity of the red emission band increased with increasing Ca2+ concentration up to 4.33 × 10⁻⁴ mol·dm−3, after that it decreased significantly.
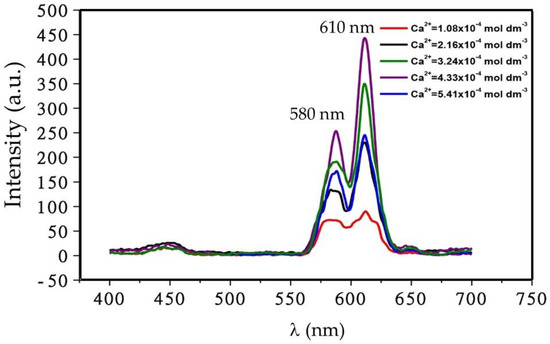
Figure 11.
Effect of activator ion, Ca2+ ion, concentration on the emission spectrum of Eu3+ doped CaSiO3/SiO2 nanophosphor powder. Samples were prepared using R0 = 0.12 and with a dopant concentration of 5 mol % and sintered temperature of 800 °C.
It seems that at low concentration vacant sites are abundant for both Ca2+ ions sites and oxygen ion sites in the conduction plane where charge transfer takes place. These vacancies can capture electrons, as electron centers at large oxide gaps usually create UV-color centers. In addition, these color centers provide absorption sites for UV photons and thus compete with activator ions. On the other hand, at higher Ca2+ ion concentration (above a certain threshold) it is evident that Ca2+ ions are in excess in lattice sites. As a result, Eu3+ ions can no longer be able to occupy most cation sites. This situation, in which the crystal lattice contains an excess of Ca2+ ion, naturally causes a decrease in emission intensity of bands at 580 nm and 610 nm, due mainly to the loss of sufficient excitation centers and thus excitation energy.
Also, at low doping concentration, the transition 5Do→7Fo level does not exhibit single sharp peak, and instead shows splitting of a peak into two components, justifying that the Eu ion is distributed between both the Ca and Si sites.
A series of nanophosphor powders with varying average particle size were synthesized by changing R0 value of the emulsion, whereas the concentration of reactants, fabrication procedure, and sintering temperature were kept constant that offers the possibility of exploring particle size dependent PL property of the given phosphor.
In Figure 12, we studied the effect of nanophosphors particle size on the PL emission intensity. As shown, the PL intensity almost monotonously decreases with increasing particle size, clearly suggesting that the emission efficiency of in Eu3+ ion doped CaSiO3 can be enhanced by reducing average particle sizes, which in turn can be controlled by R0 value of the emulsion during synthesis.
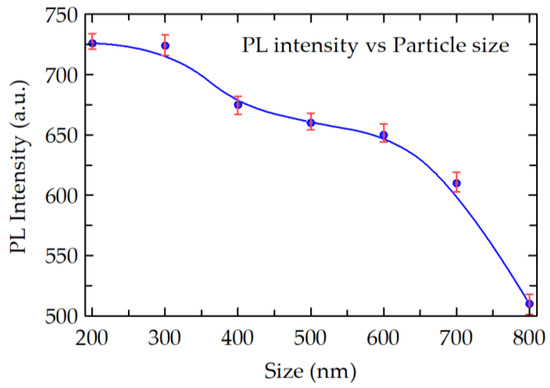
Figure 12.
Effect of particle size on the amplitude of emission spectra of Eu3+ doped CaSiO3/SiO2 nanophosphor, prepared with a dopant concentration = 5 mol % and sintering temperature of 800 °C. The average particle size was varied by varying R0 value of the emulsion system during the preparation. The curve was fitted with the B-Spline fit (Open parametric B-Spline curve with data as control points).
4. Conclusions
We successfully synthesized a series of Eu3+ doped CaSiO3/SiO2 nanophosphor powder using the microemulsion technique and investigated the effect of composition and sintering temperature on the morphology, microstructure and photoluminescence intensity. The crystal structure is found to be strongly affected by the sintering temperature and waters to surfactant ratio (R0) of the emulsion system. By increasing sintering temperature from 400 °C to 800 °C a substantial increase in particle size and better-ordered crystal phase was achieved. The amorphous state of CaSiO3/SiO2 nanophosphor powders is changed to more ordered triclinic type wollastonite, CaSiO3, with preferred crystal phase orientation of (112) and tetragonal type cristobalites of SiO2 as the sintering temperature is increased from 600 °C to 800 °C. With increasing Eu3+ ion concentration the red emission band initially increased significantly but showed concentration quenching at higher concentration. In the presence of Ca2+ ion as a sensitizer, Si+4 ion concentration has also found to be a substantial impact on both the blue and red emission bands. The increasing silica concentration significantly decreased the emission peaks at 590 and 610 nm.
With increasing Ca2+ activator ion, the intensity of the red PL band increased significantly. However, a higher concentration of Ca2+ showed concentration quenching effect. The PL intensity always increased with decreasing grain sizes of the crystalline powder. Eu3+ doped CaSiO3/SiO2 nanophosphor showed remarkable photoluminescence, PL property-including-100% photon conversion efficiency and a two-fold increase in some excitation and emission photons. These highly ordered nanophosphor powders when functionalized with biomaterials show potential for application in biomedicine, bio-sensing, and related industries.
Supplementary Materials
The following are available online at http://www.mdpi.com/2504-5377/2/4/52/s1, Figure S1: XRD spectrum (Intensity vs. 2θ°) of Eu3+ doped CaSiO3/SiO3 nanophosphor powder and its crystallinity. Samples were prepared using a R0 value of 0.30 and were sintered at 800 °C, Figure S2: Effect of Eu3+ ion concentration on XRD spectrum (Intensity vs. 2θ°) of Eu3+ doped CaSiO3/SiO2 nanophosphor powder and its crystallinity. Samples were prepared using a R0 value of 0.30 and sintered at 800 °C, Figure S3: Effect of Si4+ concentration on XRD spectra (Intensity vs. 2θ°) of Eu3+ doped CaSiO3/SiO2 nanophosphor powder. Samples were prepared in an identical reaction condition using a R0 value of 0.30 and sintered at 800 °C, Figure S4: The energy level of Eu3+ doped showing luminescence process and transition states.
Author Contributions
B.B.N. prepared samples, conducted experiment analysis. B.B.N. and C.R. analyzed the results and wrote the article. C.R. read and approved the article.
Funding
This research received no external funding.
Acknowledgments
First author acknowledges Deepak Sainju, Professor in Residence, Department of Physics University of Connecticut, USA for reading and providing feedback on an early draft.
Conflicts of Interest
Authors declare no conflicts of interest.
References
- Sunitha, D.; Nagabhushana, H.; Singh, F.; Nagabhushana, B.; Sharma, S.; Chakradhar, R. Thermo, Iono and photoluminescence properties of 100MeV Si7+ ions bombarded CaSiO3: Eu3+ nanophosphor. J. Luminescence 2012, 132, 2065–2071. [Google Scholar] [CrossRef]
- Nagabhushana, H.; Nagabhushana, B.; Kumar, M.M.; Murthy, K.; Shivakumara, C.; Chakradhar, R. Synthesis, characterization and photoluminescence properties of CaSiO3: Eu3+ red phosphor. Spectrochim. Acta Part A Mol. Biomol. Spectr. 2011, 78, 64–69. [Google Scholar] [CrossRef] [PubMed]
- Zhang, X.; Marathe, A.; Sohal, S.; Holtz, M.; Davis, M.; Hope-Weeks, L.J.; Chaudhuri, J. Synthesis and photoluminescence properties of hierarchical architectures of YBO3: Eu3+. J. Mater. Chem. 2012, 22, 6485–6490. [Google Scholar] [CrossRef]
- Sohal, S.; Nazari, M.; Zhang, X.; Hassanzadeh, E.; Kuryatkov, V.; Chaudhuri, J.; Hope-Weeks, L.; Huang, J.; Holtz, M. Effect of Tb3+ concentration on the optical and vibrational properties of YBO3 tri-doped with Eu3+, Ce3+, and Tb3+. J. Appl. Phys. 2014, 115, 183505. [Google Scholar] [CrossRef]
- Sohal, S.; Zhang, X.; Kuryatkov, V.; Chaudhuri, J.; Holtz, M. Correlation of photoluminescence and structural order in YBO3: Eu3+ micro and nano structures. Mater. Lett. 2013, 106, 381–384. [Google Scholar] [CrossRef]
- Guo-Bo, X. Luminescence and energy transfer in europium and bismuth codoped trisodium yttrium silicates. Chin. Phys. Lett. 2013, 30, 087802. [Google Scholar]
- Wang, L.; Zhang, H.; Zhou, X.; Liu, Y.; Lei, B. Preparation and characterization of a luminescent carbon dots grafted CaSiO3: Eu3+ phosphor for ratiometric fluorescent oxygen sensing. RSC Adv. 2016, 6, 98554–98562. [Google Scholar] [CrossRef]
- Cable, M.; Uhlmann, D.R.; Kreidl, N.J. Glass: Science and Technology; Academic Press Inc.: Cambridge, MA, USA, 1984. [Google Scholar]
- Hryciw, A.; Meldrum, A.; Buchanan, K.S.; White, C.W. Effects of particle size and excitation spectrum on the photoluminescence of silicon nanocrystals formed by ion implantation. Nucl. Instr. Methods Phys. Res. Sect. B Beam Interact. Mater. Atoms 2004, 222, 469–476. [Google Scholar] [CrossRef]
- Singh, D.; Sheoran, S.; Tanwar, V. Europium doped silicate phosphors: Synthetic and characterization techniques. Adv. Mater. Lett 2017, 8, 656–672. [Google Scholar] [CrossRef]
- Hazarika, S.; Rai, S. Characteristics of Nd3+ ions in sol-gel derived silicate glass in presence of Al(NO3)3 and the 4F3/2–4I11/2 transition. Opt. Mater. 2007, 30, 462–467. [Google Scholar] [CrossRef]
- Dhoble, S.J.; Dhoble, N.S.; Pode, R.B. Preparation and characterization of Eu3+ activated CaSiO3, (CaA)SiO3 [A = Ba or Sr] phosphors. Bull. Mater. Sci. 2003, 26, 377–382. [Google Scholar] [CrossRef]
- Terraschke, H.; Wickleder, C. UV, Blue, Green, Yellow, Red, and Small: Newest Developments on Eu2+-Doped Nanophosphors. Chem. Rev. 2015, 115, 11352–11378. [Google Scholar] [CrossRef] [PubMed]
- Kimura, I.; Kase, T.; Taguchi, Y.; Tanaka, M. Preparation of titania/silica composite microspheres by sol–gel process in reverse suspension. Mater. Res. Bull. 2003, 38, 585–597. [Google Scholar] [CrossRef]
- Kumar, M.M.; Krishna, R.H.; Nagabhushana, B.M.; Shivakumara, C. Synthesis, characterization and photoluminescence properties of Bi3+ co-doped CaSiO3: Eu3+ nanophosphor. Spectrochim. Acta Part A Mol. and Biomol. Spect. 2015, 139, 124–129. [Google Scholar] [CrossRef] [PubMed]
- Yamane, M.; Asahara, Y. Glasses for Photonics; Cambridge University Press: Cambridge, UK, 2000. [Google Scholar]
- Barry, T.L. Equilibria and Eu2+ Luminescence of Subsolidus Phases Bounded by Ba3MgSi2O8, Sr3MgSi2O8, and Ca3MgSi2O8. J. Electrochem. Soc. 1968, 115, 733–738. [Google Scholar] [CrossRef]
- Kim, Y.-I.; Kim, K.-B.; Jung, M.-J.; Hong, J.-S. Combined Rietveld refinement of BaMgAl10O17: Eu2+ using X-ray and neutron powder diffraction data. J. Luminescence 2002, 99, 91–100. [Google Scholar] [CrossRef]
- Schmechel, R.; Kennedy, M.; Von Seggern, H.; Winkler, H.; Kolbe, M.; Fischer, R.A.; Xaomao, L.; Benker, A.; Winterer, M.; Hahn, H. Luminescence properties of nanocrystalline Y2O3: Eu3+ in different host materials. J. Appl. Phys. 2001, 89, 1679–1686. [Google Scholar] [CrossRef]
- Poort, S.H.M.; Reijnhoudt, H.M.; Van der Kuip, H.O.T.; Blasse, G. Luminescence of Eu2+ in silicate host lattices with alkaline earth ions in a row. J. Alloys Comp. 1996, 241, 75–81. [Google Scholar] [CrossRef]
- Blasse, G.; Grabmaier, B.C. Energy Transfer. In Luminescent Materials; Springer: Berlin, Germany, 1994; pp. 91–107. [Google Scholar]
- Logunov, S.; Green, T.; Marguet, S.; El-Sayed, M.A. Interfacial carriers dynamics of CdS nanoparticles. J. Phys. Chem. A 1998, 102, 5652–5658. [Google Scholar] [CrossRef]
- Su, Q.; Lin, J.; Li, B. A study on the luminescence properties of Eu3+ and Dy3+ in M2RE8(SiO4)6O2 (M = Mg, Ca; RE = Y, Gd, La). J. Alloys Comp. 1995, 225, 120–123. [Google Scholar] [CrossRef]
- Dhoble, S.; Dhoble, N.; Pode, R. Preparation and characterization of Eu3+ activated CaSiO3, (CaA)SiO3 [A = Ba or Sr] phosphors. Bull. Mater. Sci. 2003, 26, 377–382. [Google Scholar] [CrossRef]
- De Boer, W.; McGonigle, C.; Gregorkiewicz, T.; Fujiwara, Y.; Tanabe, S.; Stallinga, P. Optical excitation and external photoluminescence quantum efficiency of Eu3+ in GaN. Sci. Rep. 2014, 4, 5235. [Google Scholar] [CrossRef] [PubMed]
- Dieke, G.H.; Crosswhite, H.M.; Crosswhite, H. Spectra and Energy Levels of Rare Earth Ions in Crystals; Interscience Publishers: New York, NY, USA, 1968. [Google Scholar]
- Carnall, W.T.; Fields, P.R.; Rajnak, K. Electronic energy levels in the trivalent lanthanide aquo ions. I. Pr3+, Nd3+, Pm3+, Sm3+, Dy3+, Ho3+, Er3+, and Tm3+. J. Chem. Phys. 1968, 49, 4424–4442. [Google Scholar] [CrossRef]
- Lin, Y.; Zhang, Z.; Zhang, F.; Tang, Z.; Chen, Q. Preparation of the ultrafine SrAl2O4: Eu, Dy needle-like phosphor and its optical properties. Mater. Chem. Phys. 2000, 65, 103–106. [Google Scholar] [CrossRef]
- Tallant, D.R.; Seager, C.H.; Simpson, R.L. Mechanisms affecting emission in rare-earth-activated phosphors. In Proceedings of the Material Reserach Symposium (MRS), San Fransico, CA, USA, 24–28 April 2000. [Google Scholar] [CrossRef]
- Oomen, E.; Van Dongen, A.-M.A. Europium (III) in oxide glasses: dependence of the emission spectrum upon glass composition. J. Non-Crystalline Solids 1989, 111, 205–213. [Google Scholar] [CrossRef]
- Shionoya, S. Photoluminescence. In Luminescence of Solids; Plenum Press: New York, NY, USA, 1998; pp. 95–133. [Google Scholar]
- Leverenz, H.W.; Urbach, F. Introduction to the Luminescence of Solids. Phys. Today 2009, 3, 32–33. [Google Scholar] [CrossRef]
© 2018 by the authors. Licensee MDPI, Basel, Switzerland. This article is an open access article distributed under the terms and conditions of the Creative Commons Attribution (CC BY) license (http://creativecommons.org/licenses/by/4.0/).