Dynamic Properties of Mixed Cationic/Nonionic Adsorbed Layers at the N-Hexane/Water Interface: Capillary Pressure Experiments Under Low Gravity Conditions

 , ,
, ,  ,
,
Abstract
:1. Introduction
2. Experimental Technique and Procedure
2.1. Materials
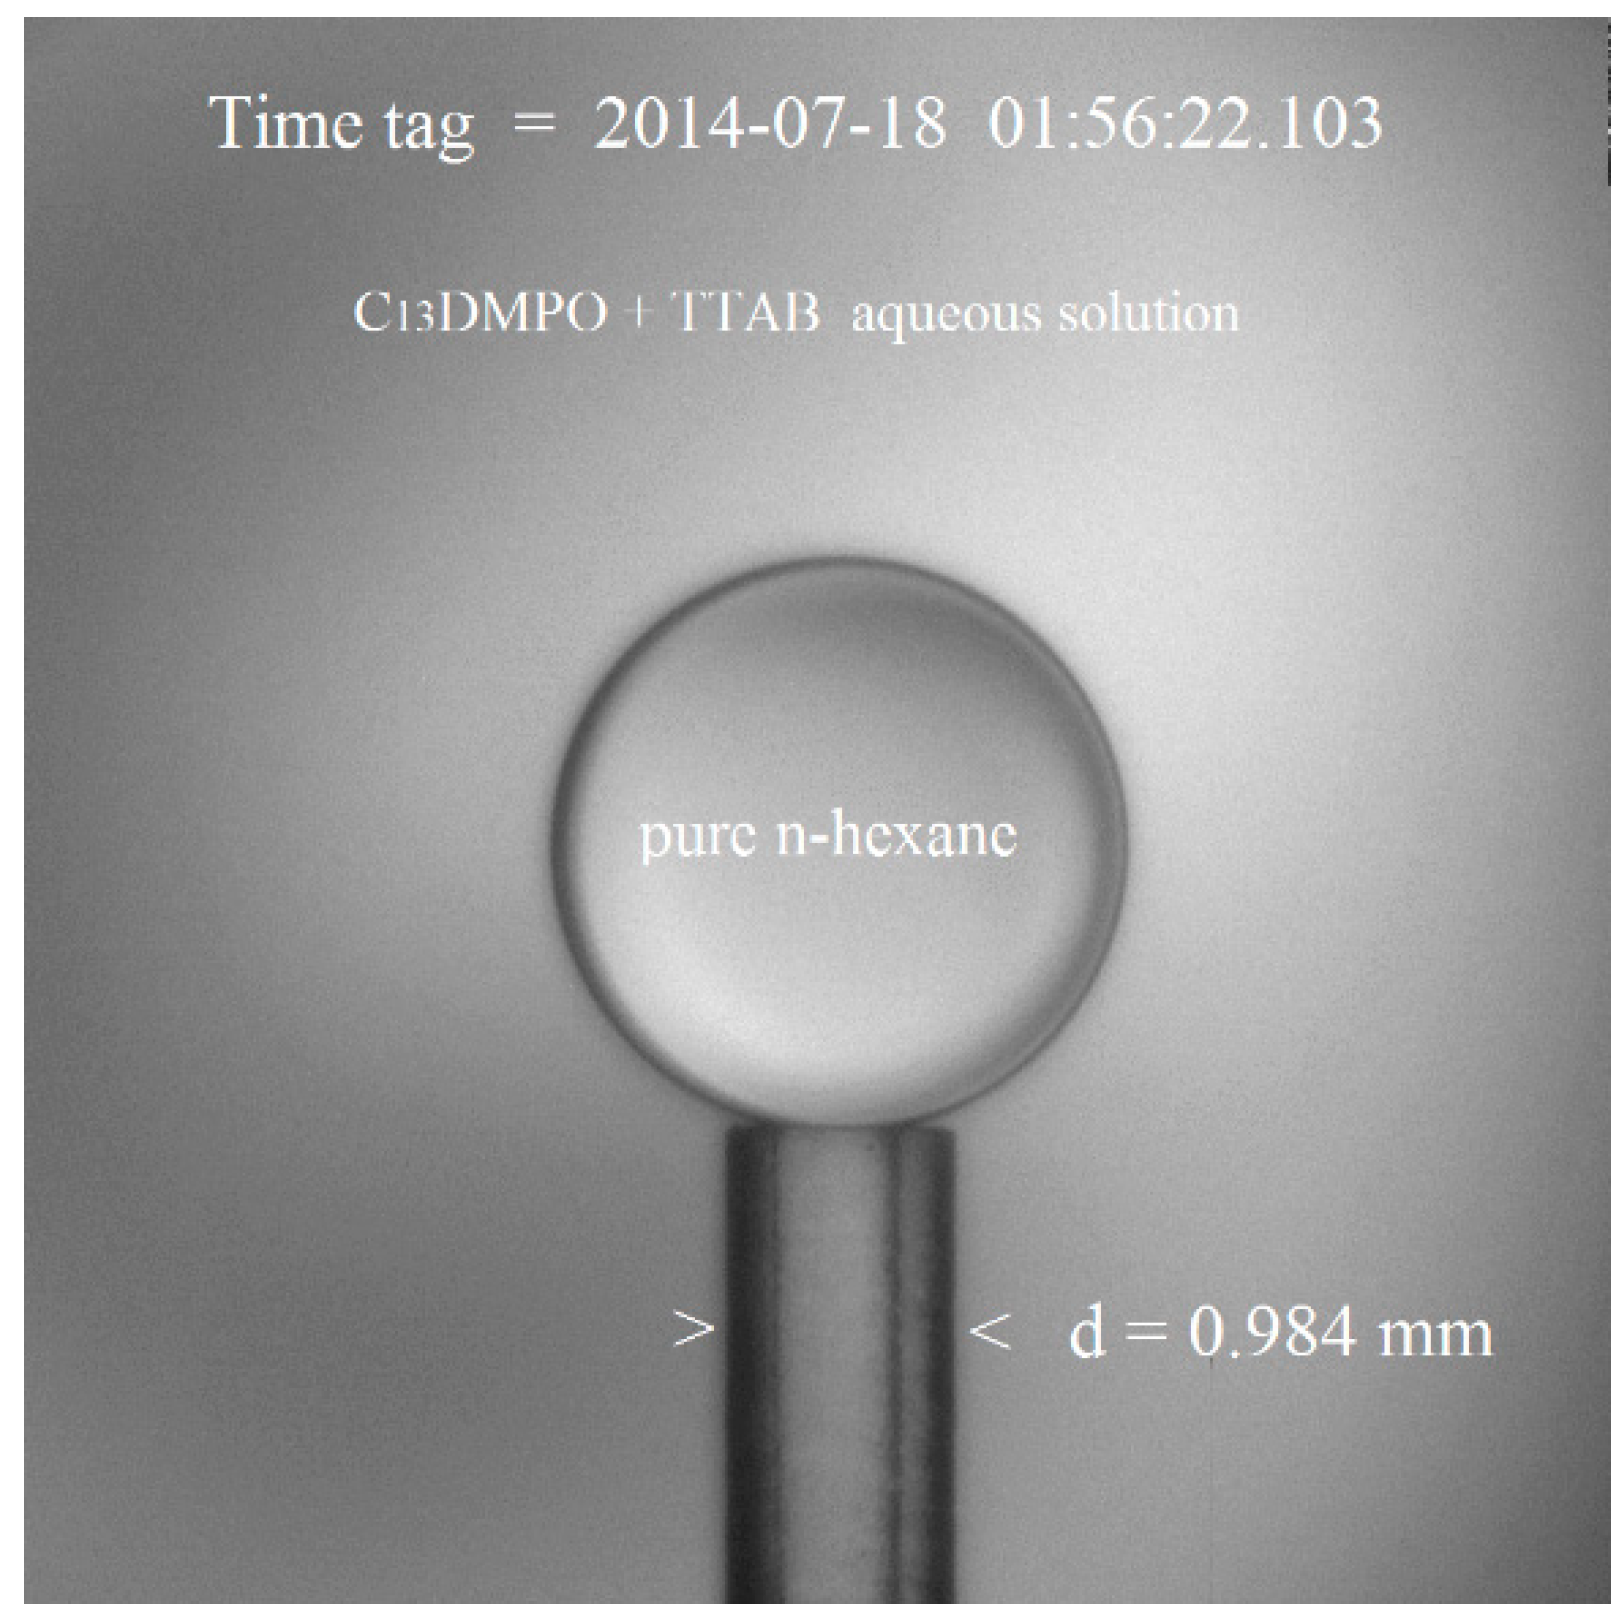
2.2. Measurement Cell
2.3. Measurement Sequence
2.4. Data Acquisition, Transmission and Pre-Processing
- (a)
- noise filtering,
- (b)
- data misalignment check inside the telemetered digital-unit packets and, in case required, synchronization of pressure data with optical data,
- (c)
- selection of oscillation sequences, for each concentration sample, at each amplitude and at each temperature,
- (d)
- in flight check of calibration parameters and, in case required, calibration adjustment.
2.4.1. Optical Calibration In-Flight Check
2.4.2. Adjustment of Pressure Sensor Calibration
3. Theory
3.1. Dilational Viscoelasticity of Mixed Adsorption Layers
3.2. Equilibrium Equation of State and Adsorption Isotherms of the Mixed Adsorption Layer
3.3. Dilational Viscoelasticity of Curved Interfaces
4. Results and Discussion
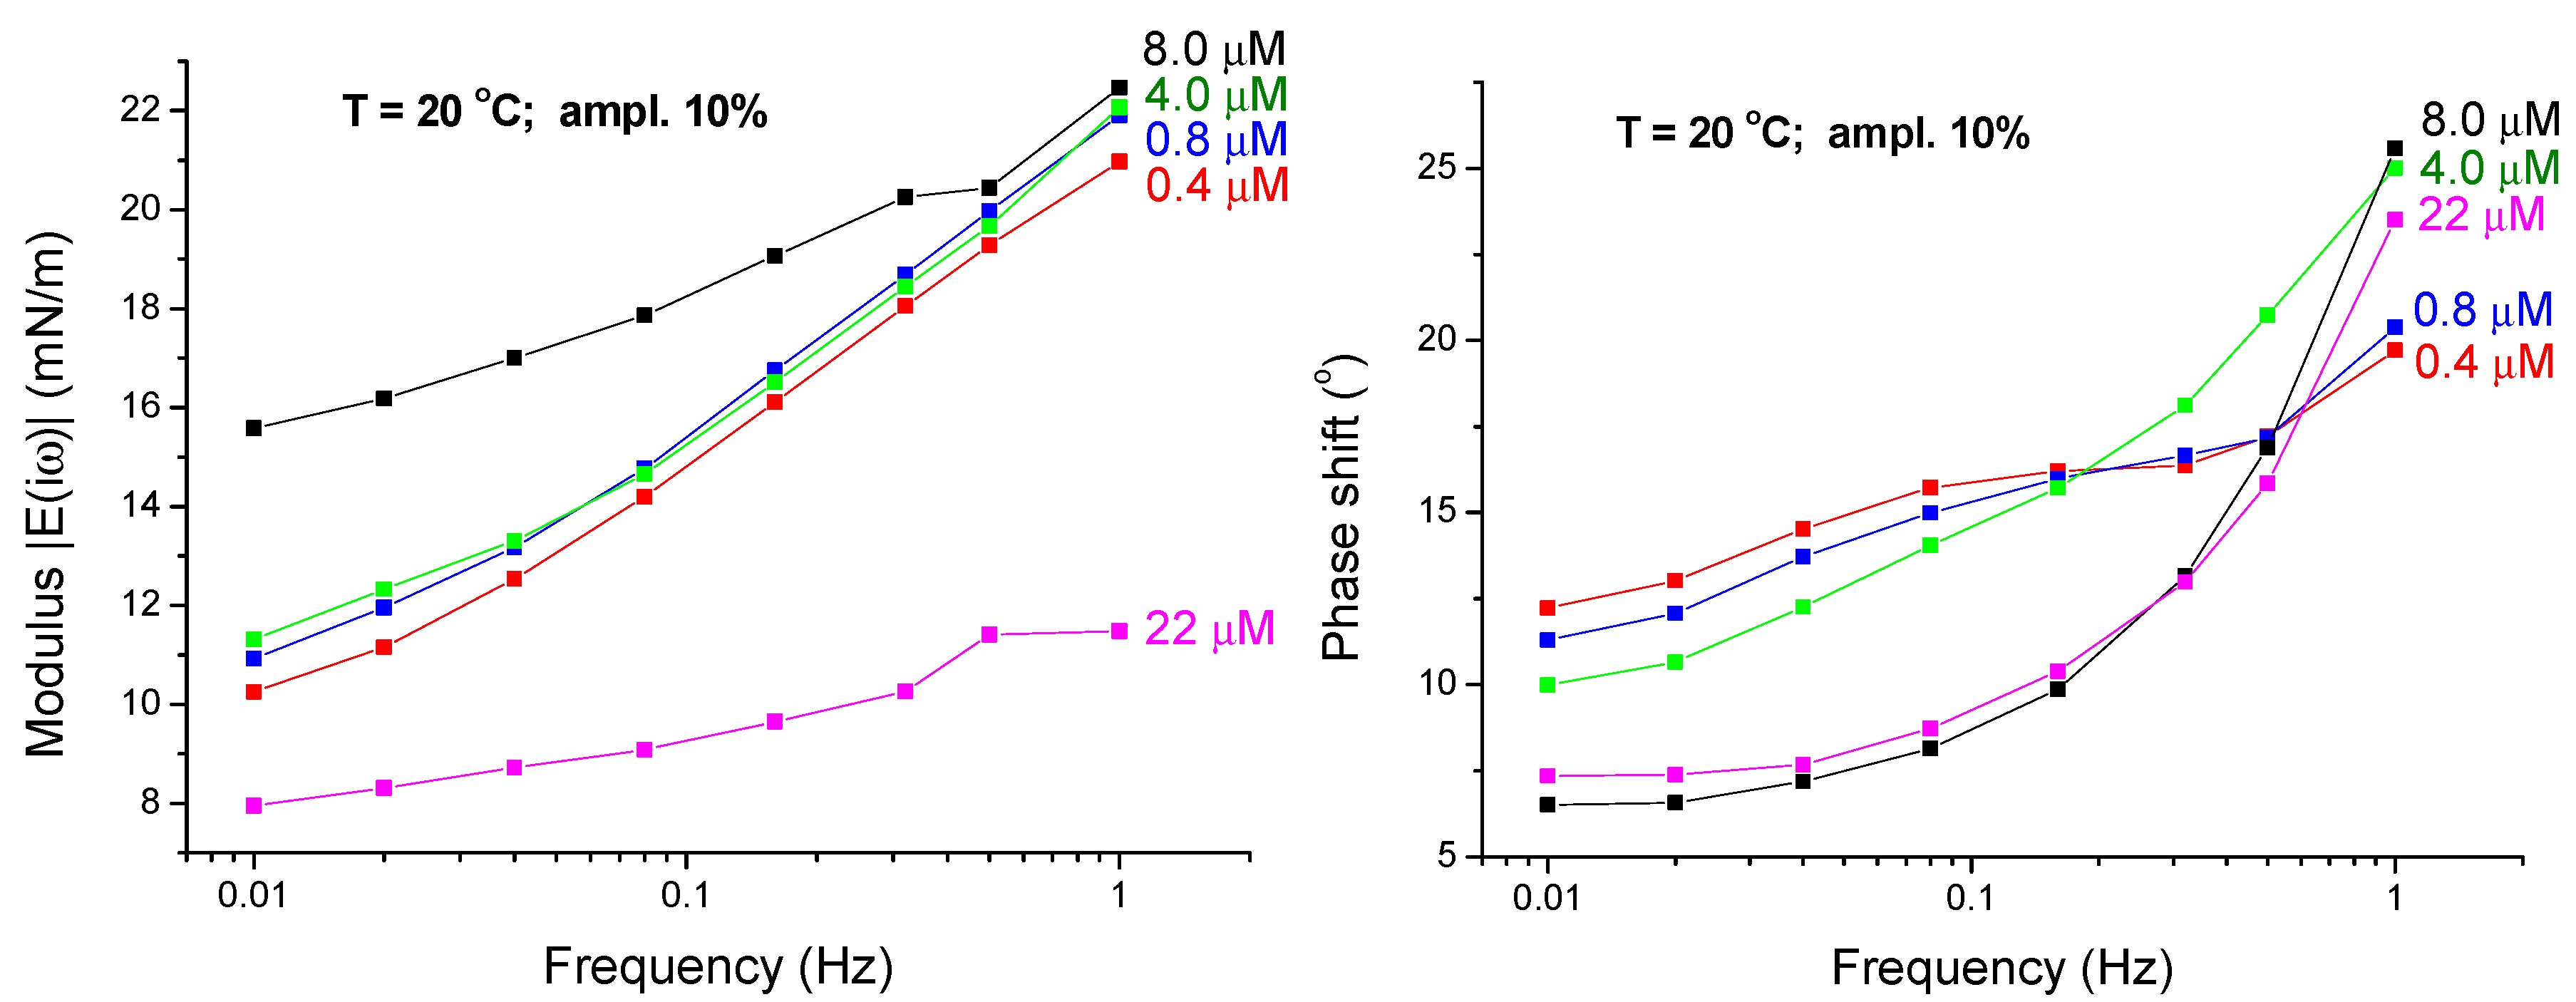
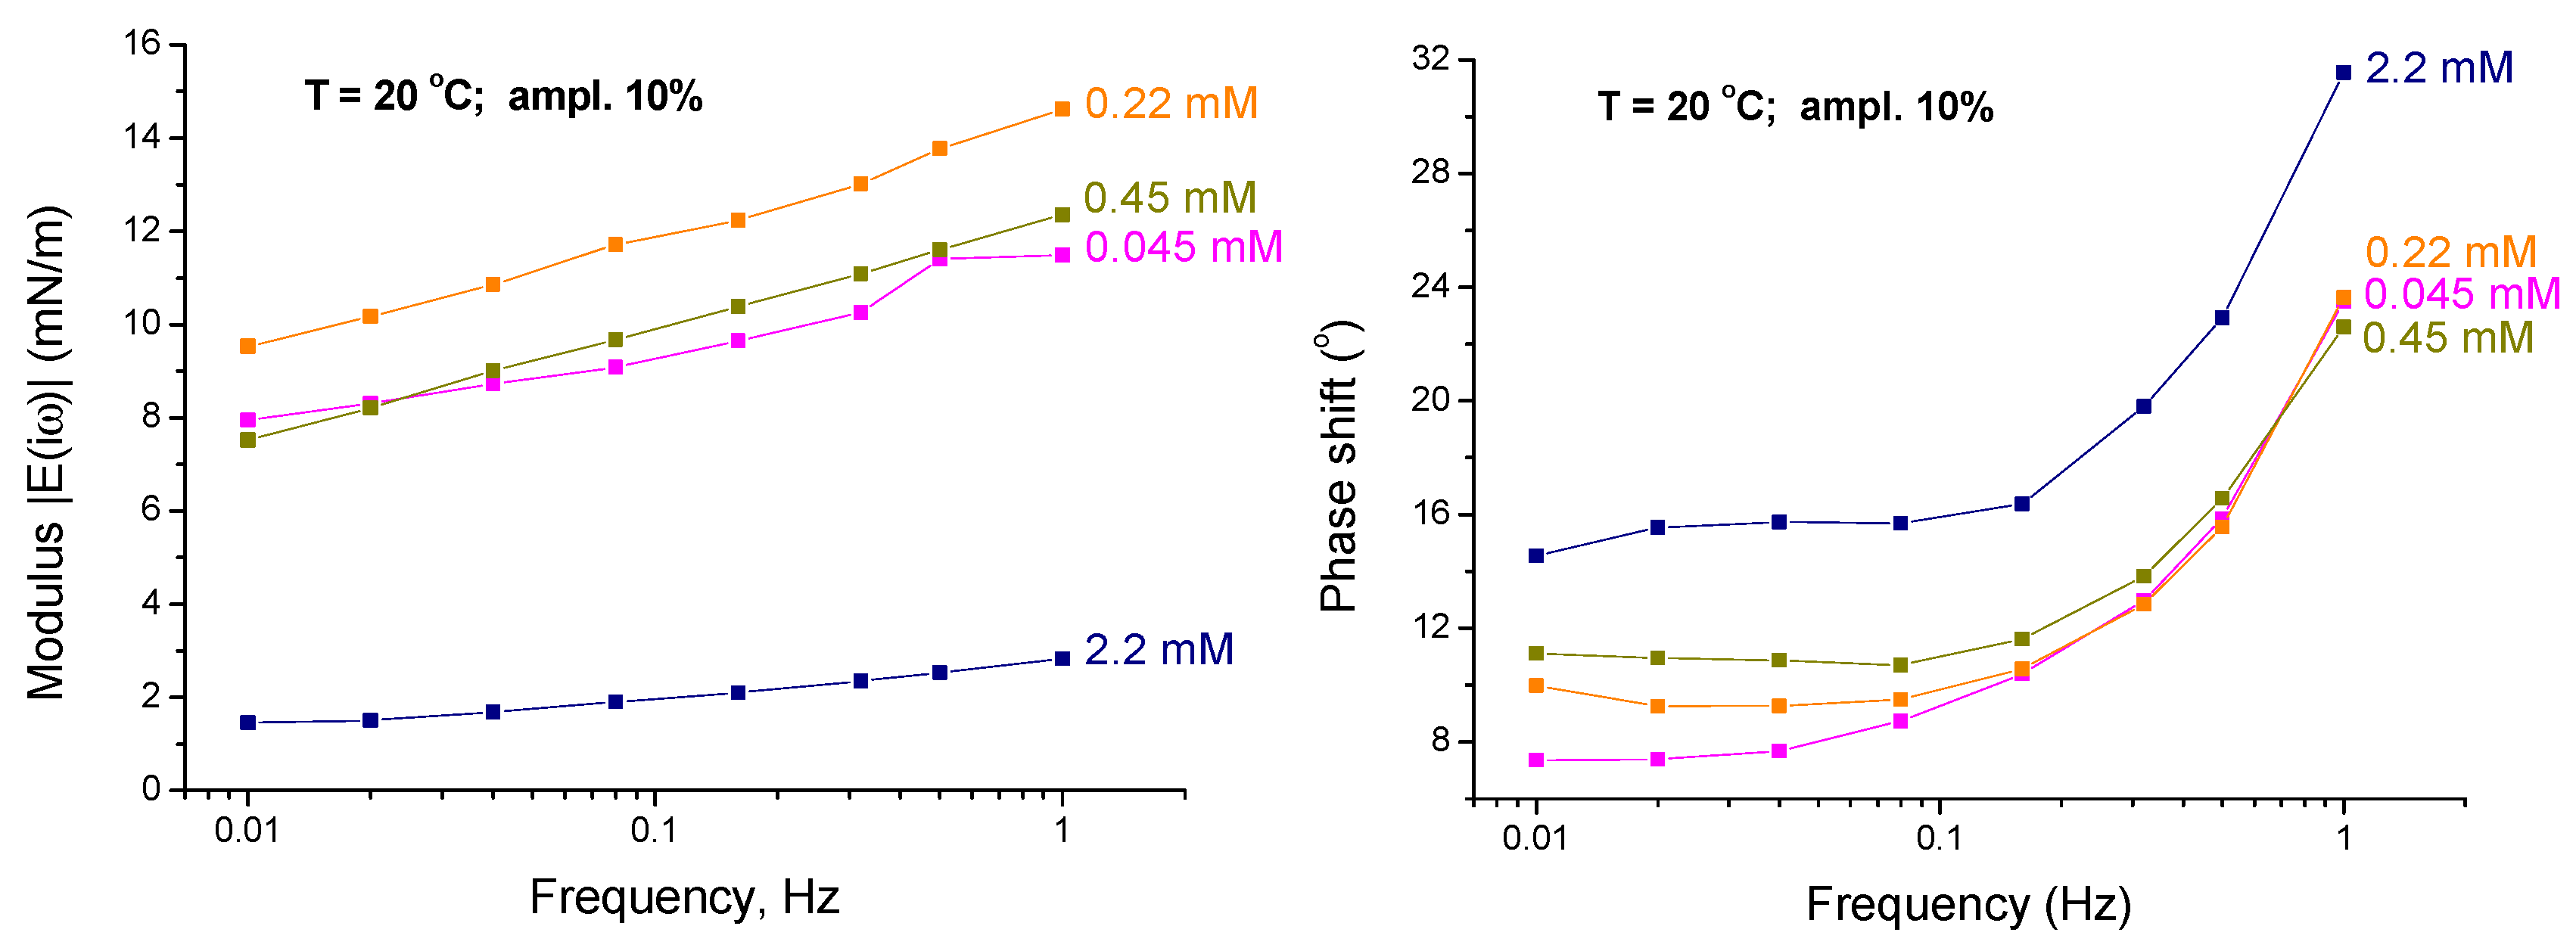
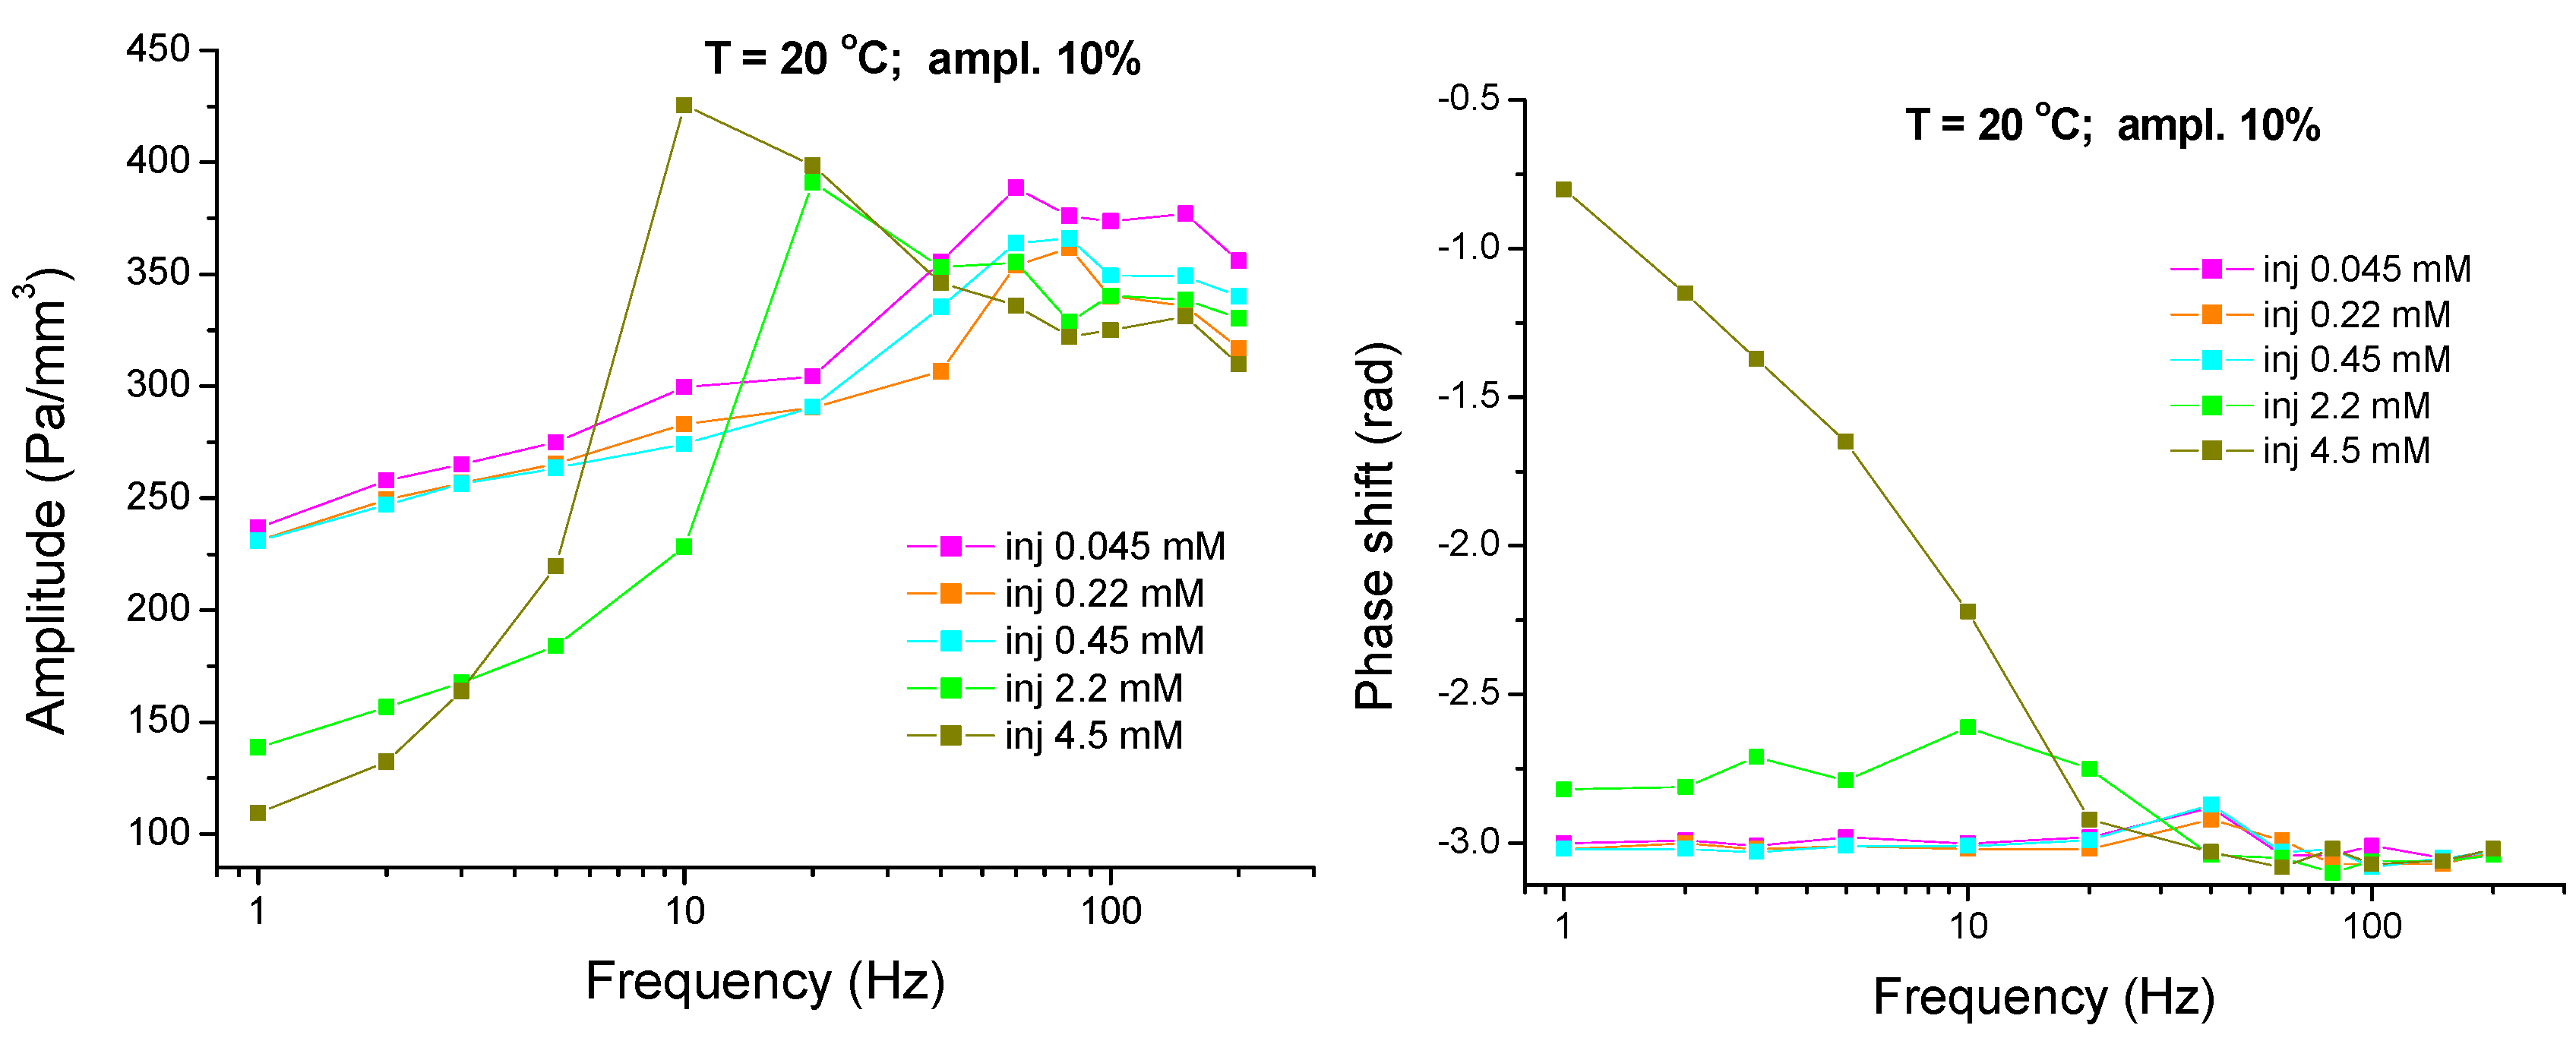
4.1. Experimental Results—Low Frequency Range
4.2. Comparison with Model Calculations
4.2.1. Parameter Sets of the Model
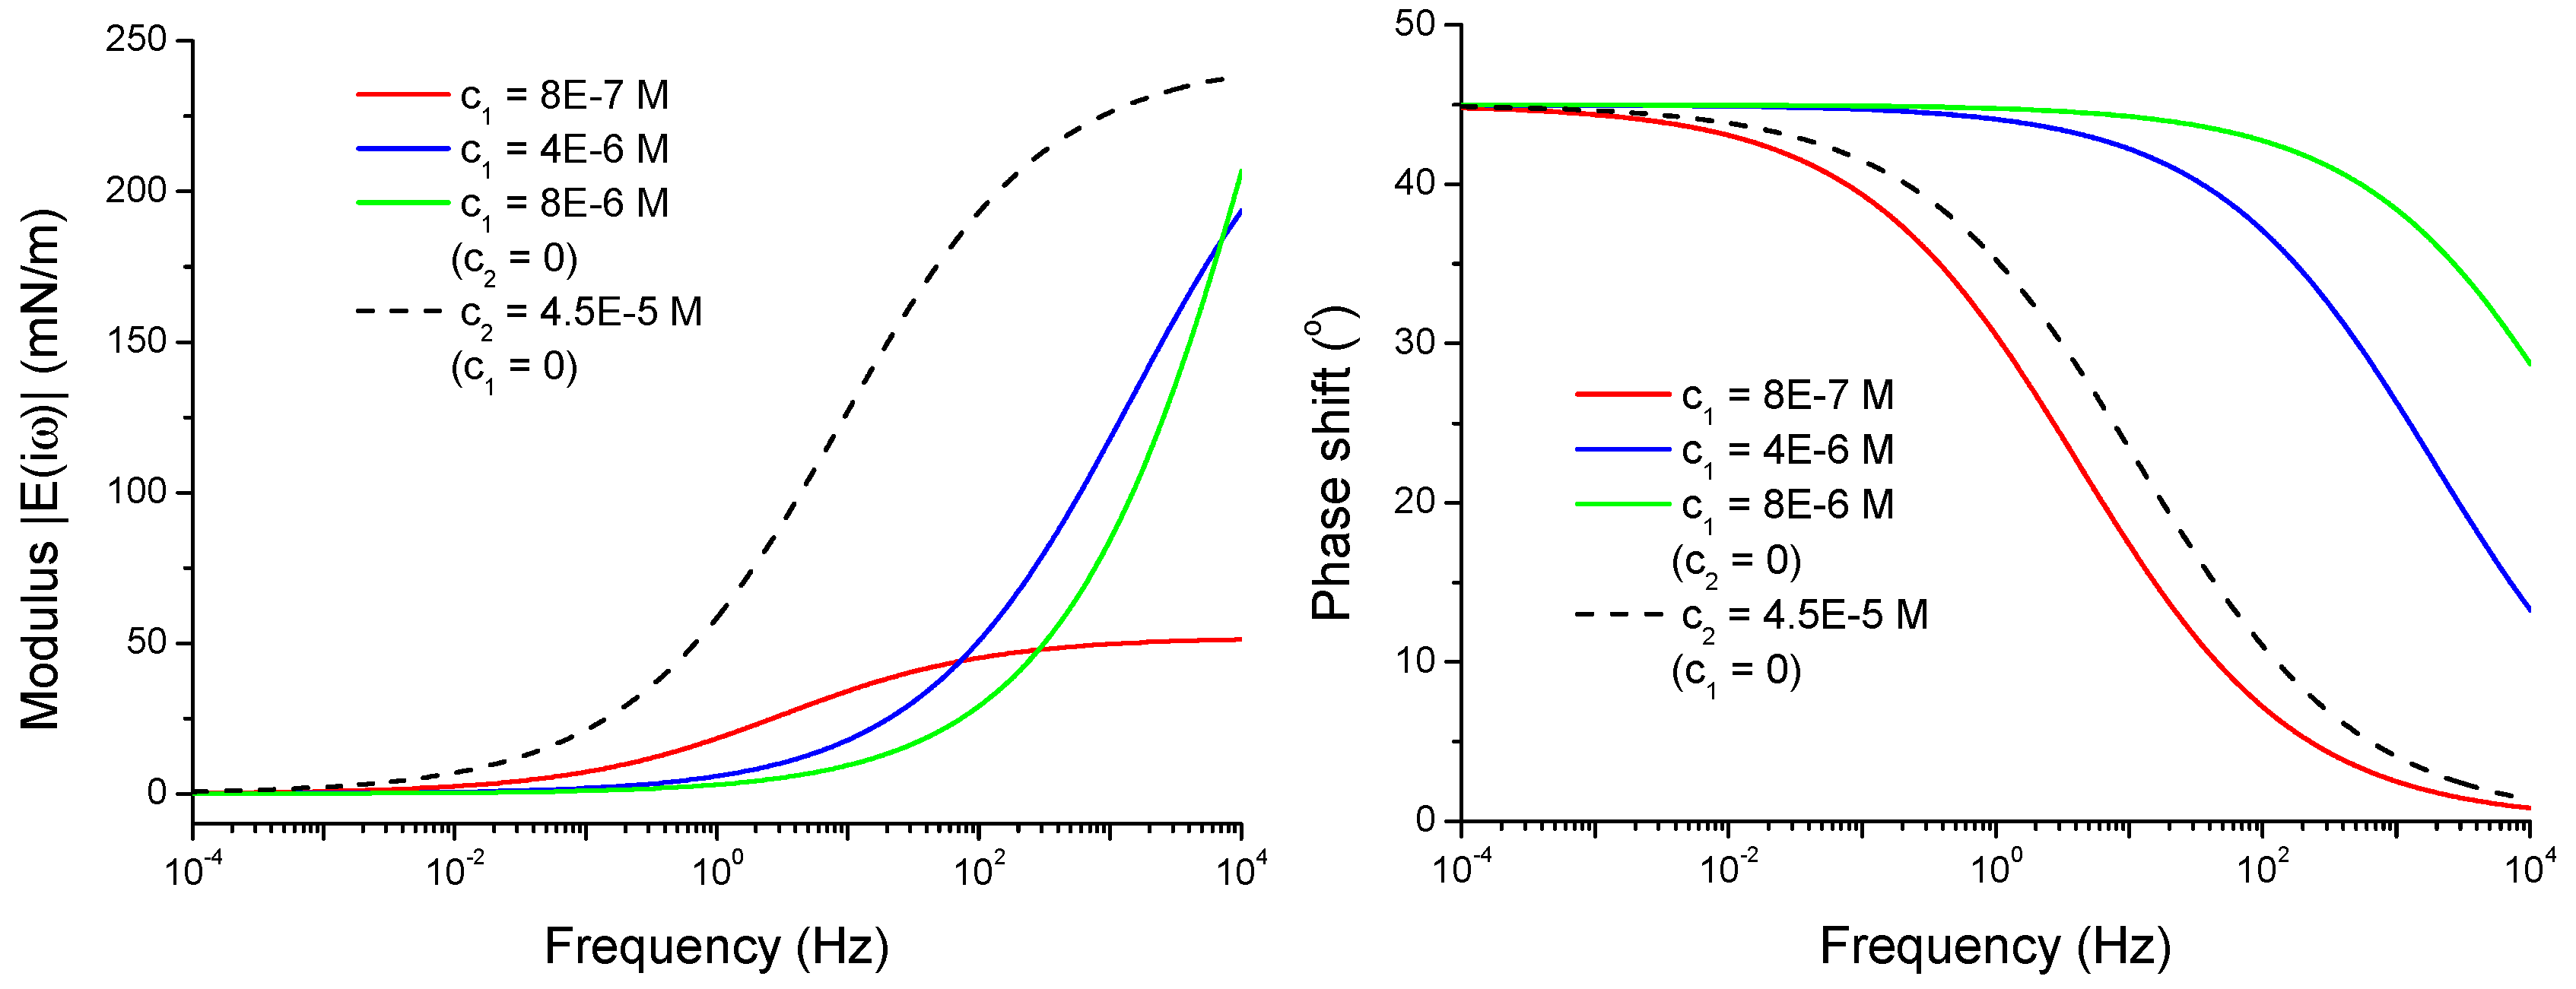
4.2.2. Viscoelasticity Modeling for Mixed and Individual Solutions
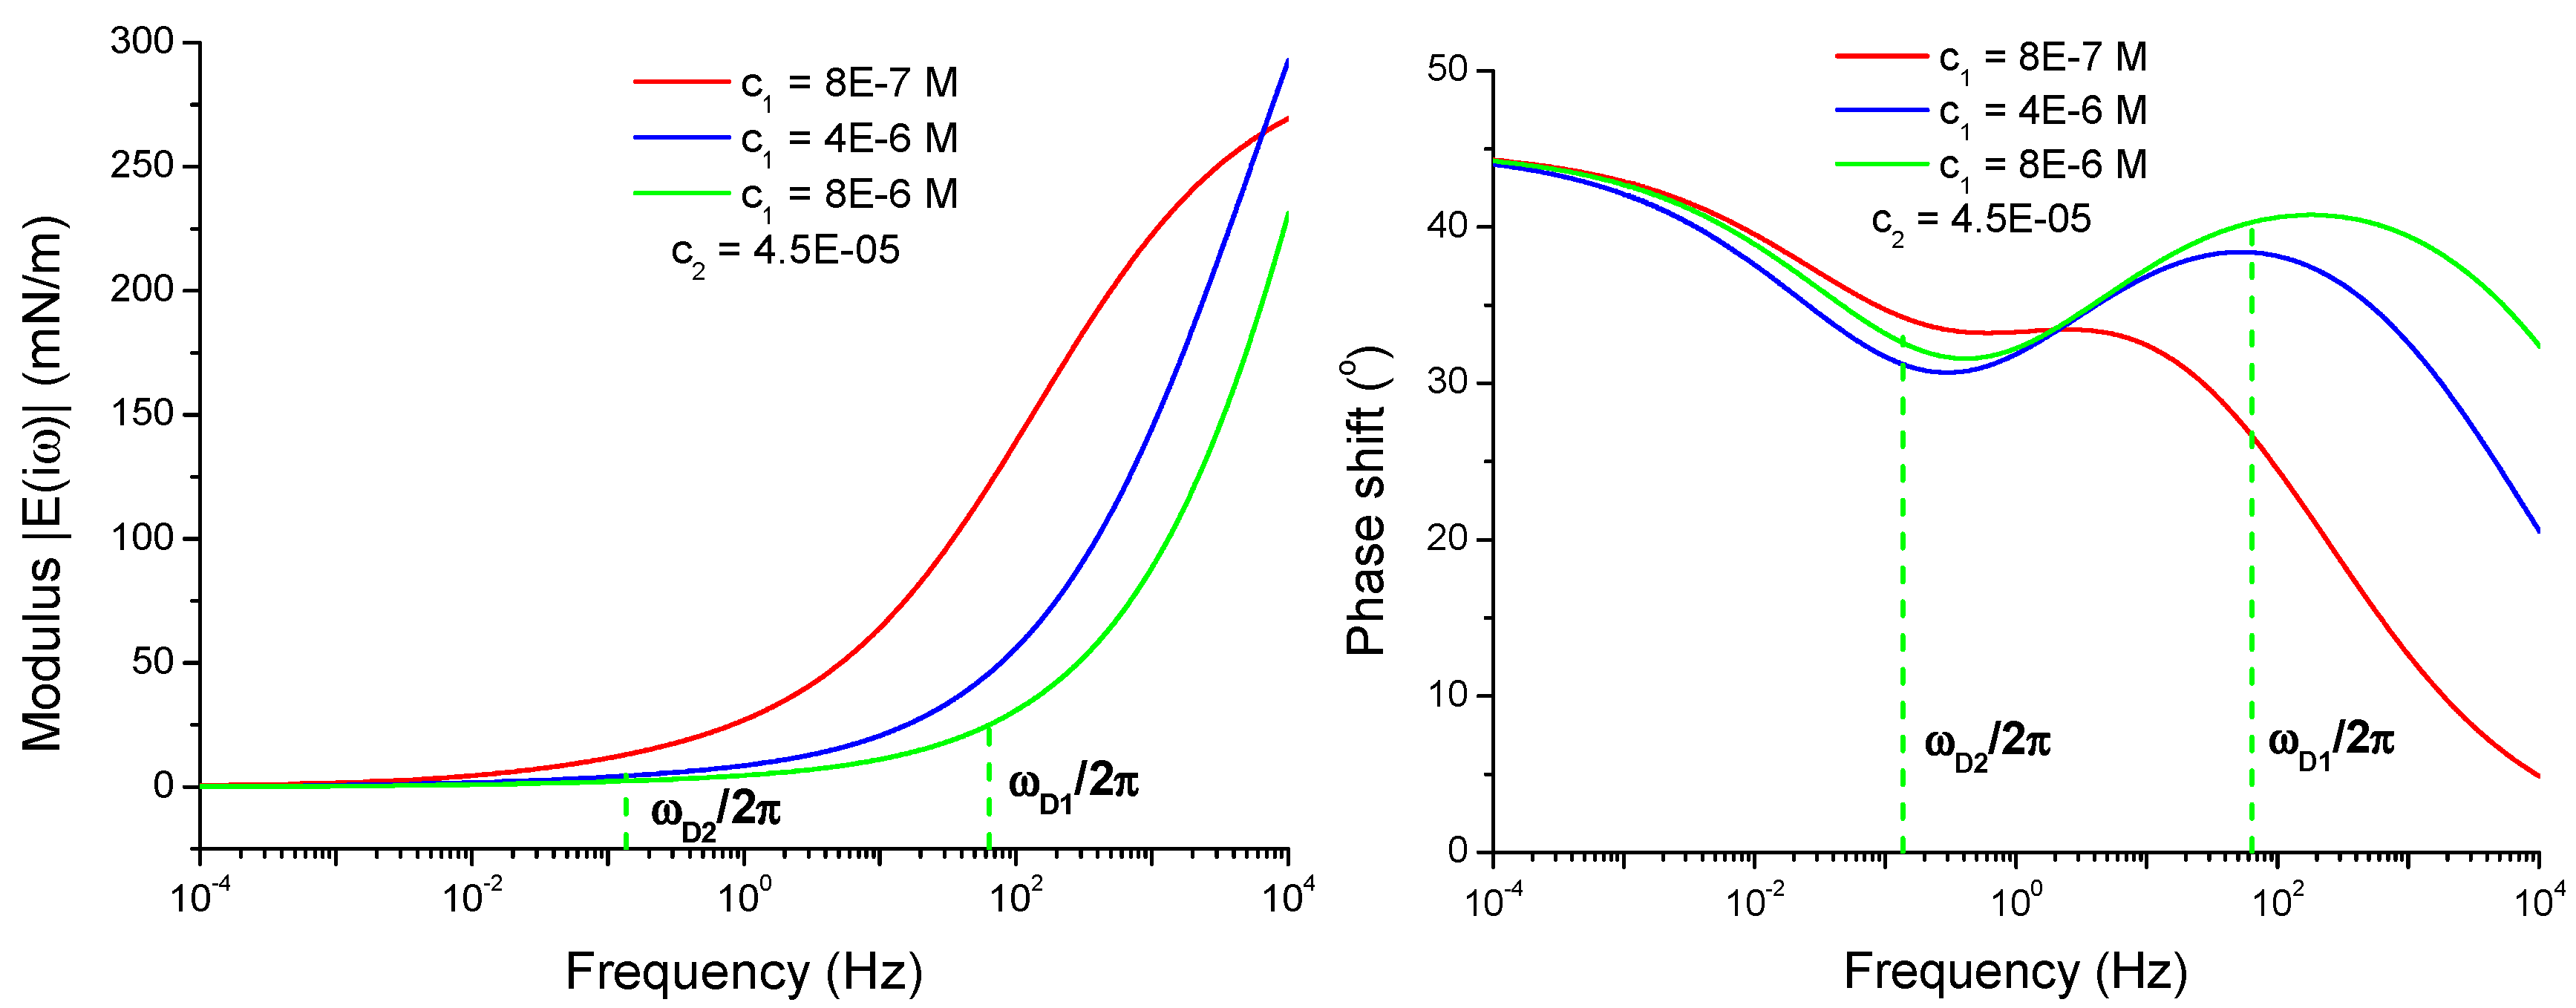
4.2.3. Effect of the Isotherm Parameters
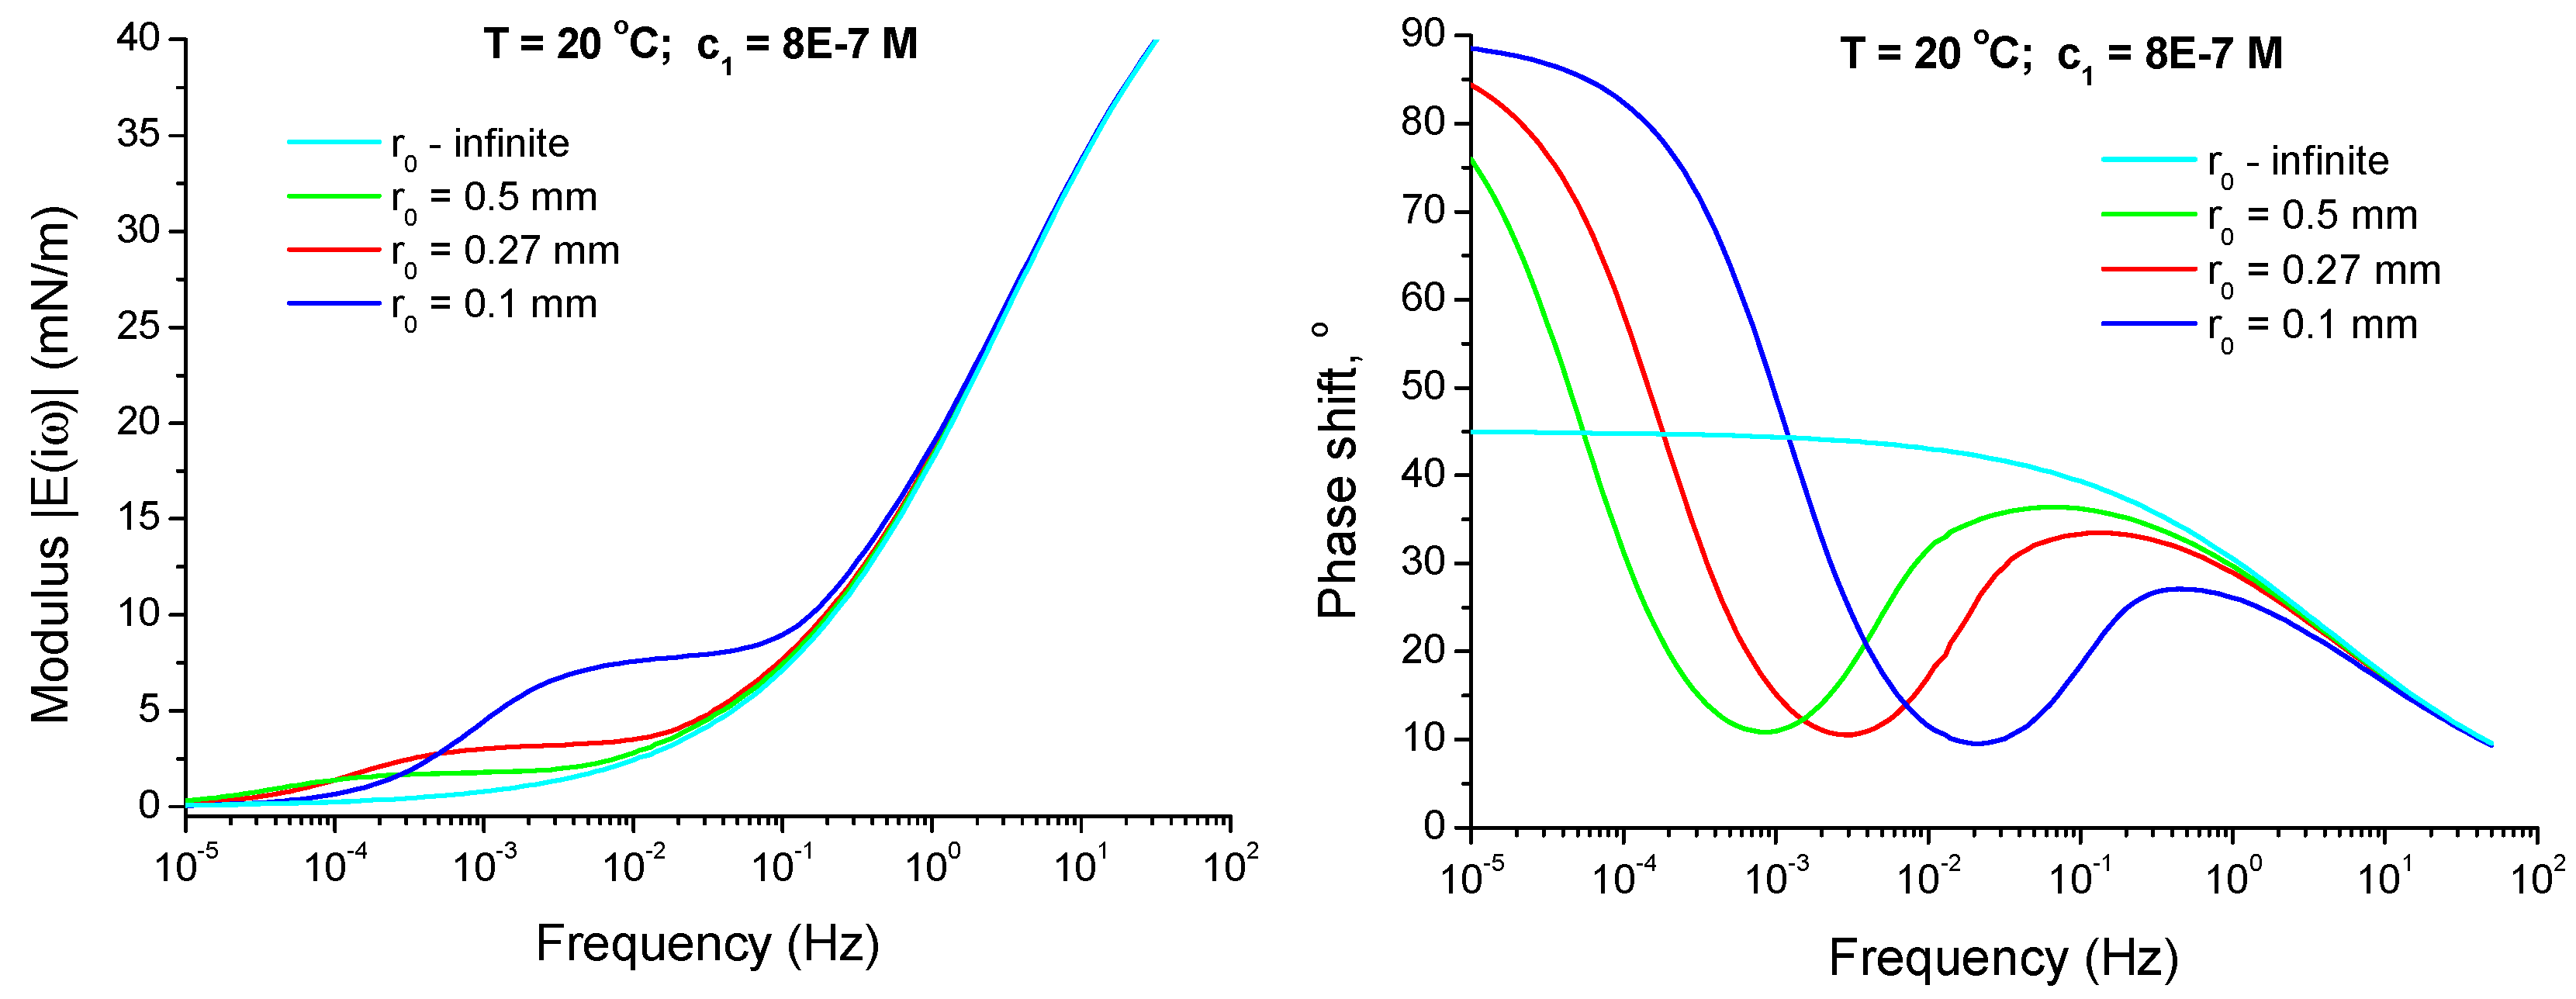
4.2.4. Effect of Curvature of the Drop Interface
4.3. Experimental Results and Analysis—High Frequency Range
5. Conclusions
Supplementary Materials
Author Contributions
Funding
Acknowledgments
Conflicts of Interest
References
- Schramm, L.L. Surfactants: Fundamentals and Applications in the Petroleum Industry; Cambridge University Press: Cambridge, UK, 2010. [Google Scholar]
- Sjöblom, J. Encyclopedic Handbook of Emulsion Technology; Marcel Dekker, Inc.: New York, NY, USA, 2001. [Google Scholar]
- McClements, D.J. Food Emulsions: Principles, Practices, and Techniques, 2nd ed.; CRC Press: Boca Raton, FL, USA, 2004. [Google Scholar]
- Murray, B.S. Interfacial rheology of food emulsifiers and proteins. Curr. Opin. Colloid Interface Sci. 2002, 7, 426–431. [Google Scholar] [CrossRef]
- Dickinson, E. Milk protein interfacial layers and the relationship to emulsion stability and rheology. Colloids Surf. B 2001, 20, 197–210. [Google Scholar] [CrossRef]
- Lin, J. Manufacturing Cosmetic Emulsions Pragmatic Troubleshooting and Energy Conservation; Allured Pub Corp.: Carol Stream, IL, USA, 2009. [Google Scholar]
- Powell, K.C.; Damitz, R.; Chauhan, A. Relating emulsion stability to interfacial properties for pharmaceutical emulsions stabilized by Pluronic F68 surfactant. Int. J. Pharm. 2017, 521, 8–18. [Google Scholar] [CrossRef] [PubMed]
- Rosen, M.J.; Kunjappu, J.T. Surfactants and Interfacial Phenomena, 4th ed.; Wiley: Hoboken, NJ, USA, 2012. [Google Scholar]
- Böttchera, S.; Keppler, J.K.; Drusch, S. Mixtures of Quillaja saponin and beta-lactoglobulin at the oil/water-interface: Adsorption, interfacial rheology and emulsion properties. Colloids Surf. A 2017, 518, 46–56. [Google Scholar] [CrossRef]
- Cao, C.; Lei, J.; Zhang, L.; Du, F.-P. Equilibrium and Dynamic Interfacial Properties of Protein/Ionic-Liquid-Type Surfactant Solutions at the Decane/Water Interface. Langmuir 2014, 30, 13744–13753. [Google Scholar] [CrossRef] [PubMed]
- Dicharry, C.; Arla, D.; Sinquin, A.; Graciaa, A.; Bouriat, P. Stability of water/crude oil emulsions based on interfacial dilatational rheology. J. Colloid Interface Sci. 2006, 297, 785–791. [Google Scholar] [CrossRef] [PubMed]
- Arla, D.; Flesisnki, L.; Bouriat, P.; Dicharry, C. Influence of Alkaline pH on the Rheology of Water/Acidic Crude Oil Interface. Energy Fuels 2011, 25, 1118–1126. [Google Scholar] [CrossRef]
- Sun, H.-Q.; Zhang, L.; Li, Z.-Q.; Zhang, L.; Luo, L.; Zhao, S. Interfacial dilational rheology related to enhance oil recovery. Soft Matter 2011, 7, 7601–7611. [Google Scholar] [CrossRef]
- Benmekhbi, M.; Simon, S.; Sjöblom, J. Dynamic and Rheological Properties of Span-80 at Liquid–Liquid Interfaces. J. Dispers. Sci. Technol. 2014, 35, 765–776. [Google Scholar] [CrossRef]
- Angle, C.W.; Hua, Y. Dilational Interfacial Rheology for Increasingly Deasphalted Bitumens and n-C5 Asphaltenes in Toluene/NaHCO3 Solution. Energy Fuels 2012, 26, 6228–6239. [Google Scholar] [CrossRef]
- Zhou, H.; Luo, Q.; Gonga, Q.-T.; Liu, Z.-Y.; Liu, M.; Zhang, L.; Zhang, L.; Zhao, S. Interfacial dilational properties of di-substituted alkyl benzenesulfonates at kerosene/water and crude oil/water interfaces. Colloids Surf. A 2017, 520, 561–569. [Google Scholar] [CrossRef]
- Zhou, H.; Cao, X.-L.; Guo, L.-L.; Guo, Z.-Y.; Liu, M.; Zhang, L.; Zhang, L.; Zhao, S. Studies on the interfacial dilational rheology of films containing heavy oil fractions as related to emulsifying properties. Colloids Surf. A 2018, 541, 117–127. [Google Scholar] [CrossRef]
- Loglio, G.; Pandolfini, P.; Miller, R.; Makievski, A.V.; Krägel, J.; Ravera, F.; Liggieri, L. STS-107 OV-102 Mission FAST experiment: Slow surface relaxation at the solution-air interface. Microgravity Sci. Technol. J. 2005, 16, 205–209. [Google Scholar] [CrossRef]
- Passerone, A.; Liggieri, L.; Rando, N.; Ravera, F.; Ricci, E. A new experimental method for the measurement of the interfacial tension between immiscible fluids at zero bond number. J. Colloid Interface Sci. 1991, 146, 152–162. [Google Scholar] [CrossRef]
- Ferrari, M.; Liggieri, L.; Ravera, F.; Amodio, C.; Miller, R. Adsorption kinetics of alkyl phosphine oxides at the water/hexane interface 1. Pendant drop experiments. J. Colloid Interface Sci. 1997, 186, 40–45. [Google Scholar] [CrossRef] [PubMed]
- Pradines, V.; Fainerman, V.B.; Aksenenko, E.V.; Krägel, J.; Mucic, N.; Miller, R. Alkyltrimethylammonium bromides adsorption at liquid/fluid interfaces. Colloids Surf. A 2010, 371, 22–28. [Google Scholar] [CrossRef]
- Lyttle, D.J.; Lu, J.R.; Su, T.J.; Thomas, R.K.; Penfold, J. Structure of a Dodecyltrimethylammonium Bromide Layer at the Air/Water Interface Determined by Neutron Reflection: Comparison of the Monolayer Structure of Cationic Surfactants with Different Chain Lengths. Langmuir 1995, 11, 1001–1008. [Google Scholar] [CrossRef]
- Aksenenko, E.V.; Fainerman, V.B.; Petkov, J.T.; Miller, R. Dynamic surface tension of mixed oxyethylated surfactant solutions. Colloids Surf. A 2010, 365, 210–214. [Google Scholar] [CrossRef]
- Phan, C.M.; Nguyen, C.V.; Yusa, S.-I.; Yamada, N.L. Synergistic Adsorption of MIBC/CTAB Mixture at the Air/Water Interface and Applicability of Gibbs Adsorption Equation. Langmuir 2014, 30, 5790–5796. [Google Scholar] [CrossRef] [PubMed]
- Chen, T.; Zhang, G.; Jiang, P.; Ge, J. Dilational Rheology at Air/Water Interface and Molecular Dynamics Simulation Research of Hydroxyl Sulfobetaine Surfactant. J. Dispers. Sci. Technol. 2014, 35, 448–455. [Google Scholar] [CrossRef]
- Negm, N.A.; Tawfik, S.M. Studies of Monolayer and Mixed Micelle Formation of Anionic and Nonionic Surfactants in the Presence of Adenosine-5-monophosphate. J. Solut. Chem. 2012, 41, 335–350. [Google Scholar] [CrossRef]
- Liggieri, L.; Ravera, F.; Ferrari, M.; Passerone, A.; Miller, R. Adsorption Kinetics of alkyl phosphine oxides at water/hexane interface 2. Theory of the adsorption with transport across the interface in finite systems. J. Colloid Interface Sci. 1997, 186, 46–52. [Google Scholar] [CrossRef] [PubMed]
- Pandolfini, P.; Loglio, G.; Ravera, F.; Liggieri, L.; Kovalchuk, V.I.; Javadi, A.; Karbaschi, M.; Krägel, J.; Miller, R.; Noskov, B.A.; et al. Dynamic properties of Span-80 adsorbed layers at paraffin-oil/water interface: Capillary pressure experiments under low gravity conditions. Colloids Surf. A Physicochem. Eng. Asp. 2017, 532, 228–243. [Google Scholar] [CrossRef]
- Loglio, G.; Pandolfini, P.; Liggieri, L.; Makievski, A.V.; Ravera, F. Determination of interfacial properties by the pendant drop tensiometry: Optimization of experimental and calculation procedures. In Bubble and Drop Interfaces; Progress in Colloid and Interface Science Series; Liggieri, L., Miller, R., Eds.; Brill: Leiden, The Netherlands, 2011; Volume 2, Chapter 2; pp. 7–38. [Google Scholar]
- Lucassen, J.; van den Tempel, M. Dynamic Measurements of Dilational Properties of a Liquid Interface. Chem. Eng. Sci. 1972, 27, 1283–1291. [Google Scholar] [CrossRef]
- Lucassen, J.; van den Tempel, M. Longitudinal waves on visco-elastic surfaces. J. Colloid Interface Sci. 1972, 41, 491–498. [Google Scholar] [CrossRef]
- Jiang, Q.; Valentini, J.E.; Chiew, Y.C. Theoretical models for dynamic dilational surface properties of binary surfactant mixtures. J. Colloid Interface Sci. 1995, 174, 268–271. [Google Scholar] [CrossRef]
- Joos, P. Dynamic Surface Phenomena; VSP: Dordrecht, The Netherlands, 1999. [Google Scholar]
- Aksenenko, E.V.; Kovalchuk, V.I.; Fainerman, V.B.; Miller, R. Surface dilational rheology of mixed adsorption layers at liquid interfaces. Adv. Colloid Interface Sci. 2006, 122, 57–66. [Google Scholar] [CrossRef] [PubMed]
- Aksenenko, E.V.; Kovalchuk, V.I.; Fainerman, V.B.; Miller, R. Surface dilational rheology of mixed surfactants layers at liquid interface. J. Phys. Chem. C 2007, 111, 14713–14719. [Google Scholar] [CrossRef]
- Miller, R.; Loglio, G.; Tesei, U. Exchange of matter at the interface between two liquid phases. Colloid Polym. Sci. 1992, 270, 501–598. [Google Scholar] [CrossRef]
- Ravera, F.; Ferrari, M.; Liggieri, L. Adsorption and partitioning of surfactants in liquid-liquid systems. Adv. Colloid Interface Sci. 2000, 88, 129–177. [Google Scholar] [CrossRef]
- Mucic, N.; Kovalchuk, N.M.; Pradines, V.; Javadi, A.; Aksenenko, E.V.; Krägel, J.; Miller, R. Dynamic properties of CnTAB adsorption layers at the water/oil interface. Colloids Surf. A 2014, 441, 825–830. [Google Scholar] [CrossRef]
- Kovalchuk, V.I.; Aksenenko, E.V.; Makievski, A.V.; Fainerman, V.B.; Miller, R. Dilational interfacial rheology of tridecyl dimethyl phosphine oxide adsorption layers at the water/hexane interface. 2018. under preparation. [Google Scholar]
- Bergeron, V. Disjoining Pressures and Film Stability of Alkyltrimethylammonium Bromide Foam Films. Langmuir 1997, 13, 3474–3482. [Google Scholar] [CrossRef]
- Noskov, B.A. Dynamic surface properties of solutions of colloidal surfactants. Fluid Dyn. 1989, 24, 251–260. [Google Scholar] [CrossRef]
- Fainerman, V.B.; Sharipova, A.A.; Aidarova, S.B.; Kovalchuk, V.I.; Aksenenko, E.V.; Makievski, A.V.; Miller, R. Direct determination of the distribution coefficient of tridecyl dimethyl phosphine oxide between water and hexane. Colloids Interfaces 2018, 2, 28. [Google Scholar] [CrossRef]
- Ravera, F.; Ferrari, M.; Santini, E.; Liggieri, L. Influence of surface processes on the dilational visco-elasticity of surfactant solutions. Adv. Colloid Interface Sci. 2005, 117, 75–100. [Google Scholar] [CrossRef] [PubMed]
- Fainerman, V.B.; Kovalchuk, V.I.; Aksenenko, E.V.; Michel, M.; Leser, M.E.; Miller, R. Models of two-dimensional solution assuming the internal compressibility of adsorbed molecules: A comparative analysis. J. Phys. Chem. B 2004, 108, 13700–13705. [Google Scholar] [CrossRef]
- Fainerman, V.B.; Kovalchuk, V.I.; Aksenenko, E.V.; Miller, R. Dilational Viscoelasticity of Adsorption Layers Measured by Drop and Bubble Profile Analysis: Reason for Different Results. Langmuir 2016, 32, 5500–5509. [Google Scholar] [CrossRef] [PubMed]
- Kovalchuk, V.I.; Krägel, J.; Makievski, A.V.; Loglio, G.; Ravera, F.; Liggieri, L.; Miller, R. Frequency Characteristics of Amplitude and Phase of Oscillating Bubble Systems in a Closed Measuring Cell. J. Colloid Interface Sci. 2002, 252, 433–442. [Google Scholar] [CrossRef] [PubMed]


| Date DOY 2014 | Injection n # | Injection C13DMPO Syringe #1 (mm3) | Concentration C13DMPO (mol/dm3), in Matrix Cell | Injection TTAB Syringe #2 (mm3) | Concentration TTAB (mol/dm3), in Matrix Cell | TTAB/C13DMPO Concentration Ratio |
|---|---|---|---|---|---|---|
| 183–184 | 0-0 | - | 0 (*) | - | 0 (*) | - |
| 184 | 1-0 | 7 | 2.0 × 10⁻⁷ (*) | - | 0 (*) | - |
| 184–188 | 1-1 | 2.0 × 10⁻⁷ | 7 | 4.5 × 10⁻⁵ | 225.00 | |
| 188–190 | 2-1 | 7 | 4.0 × 10⁻⁷ | - | 4.5 × 10⁻⁵ | 112.50 |
| 191–194 | 3-1 | 14 | 8.0 × 10⁻⁷ | - | 4.5 × 10⁻⁵ | 56.25 |
| 195–200 | 4-1 | 112 | 4.0 × 10⁻⁶ | - | 4.5 × 10⁻⁵ | 11.25 |
| 200–202 | 5-1 | 140 | 8.0 × 10⁻⁶ | - | 4.5 × 10⁻⁵ | 5.625 |
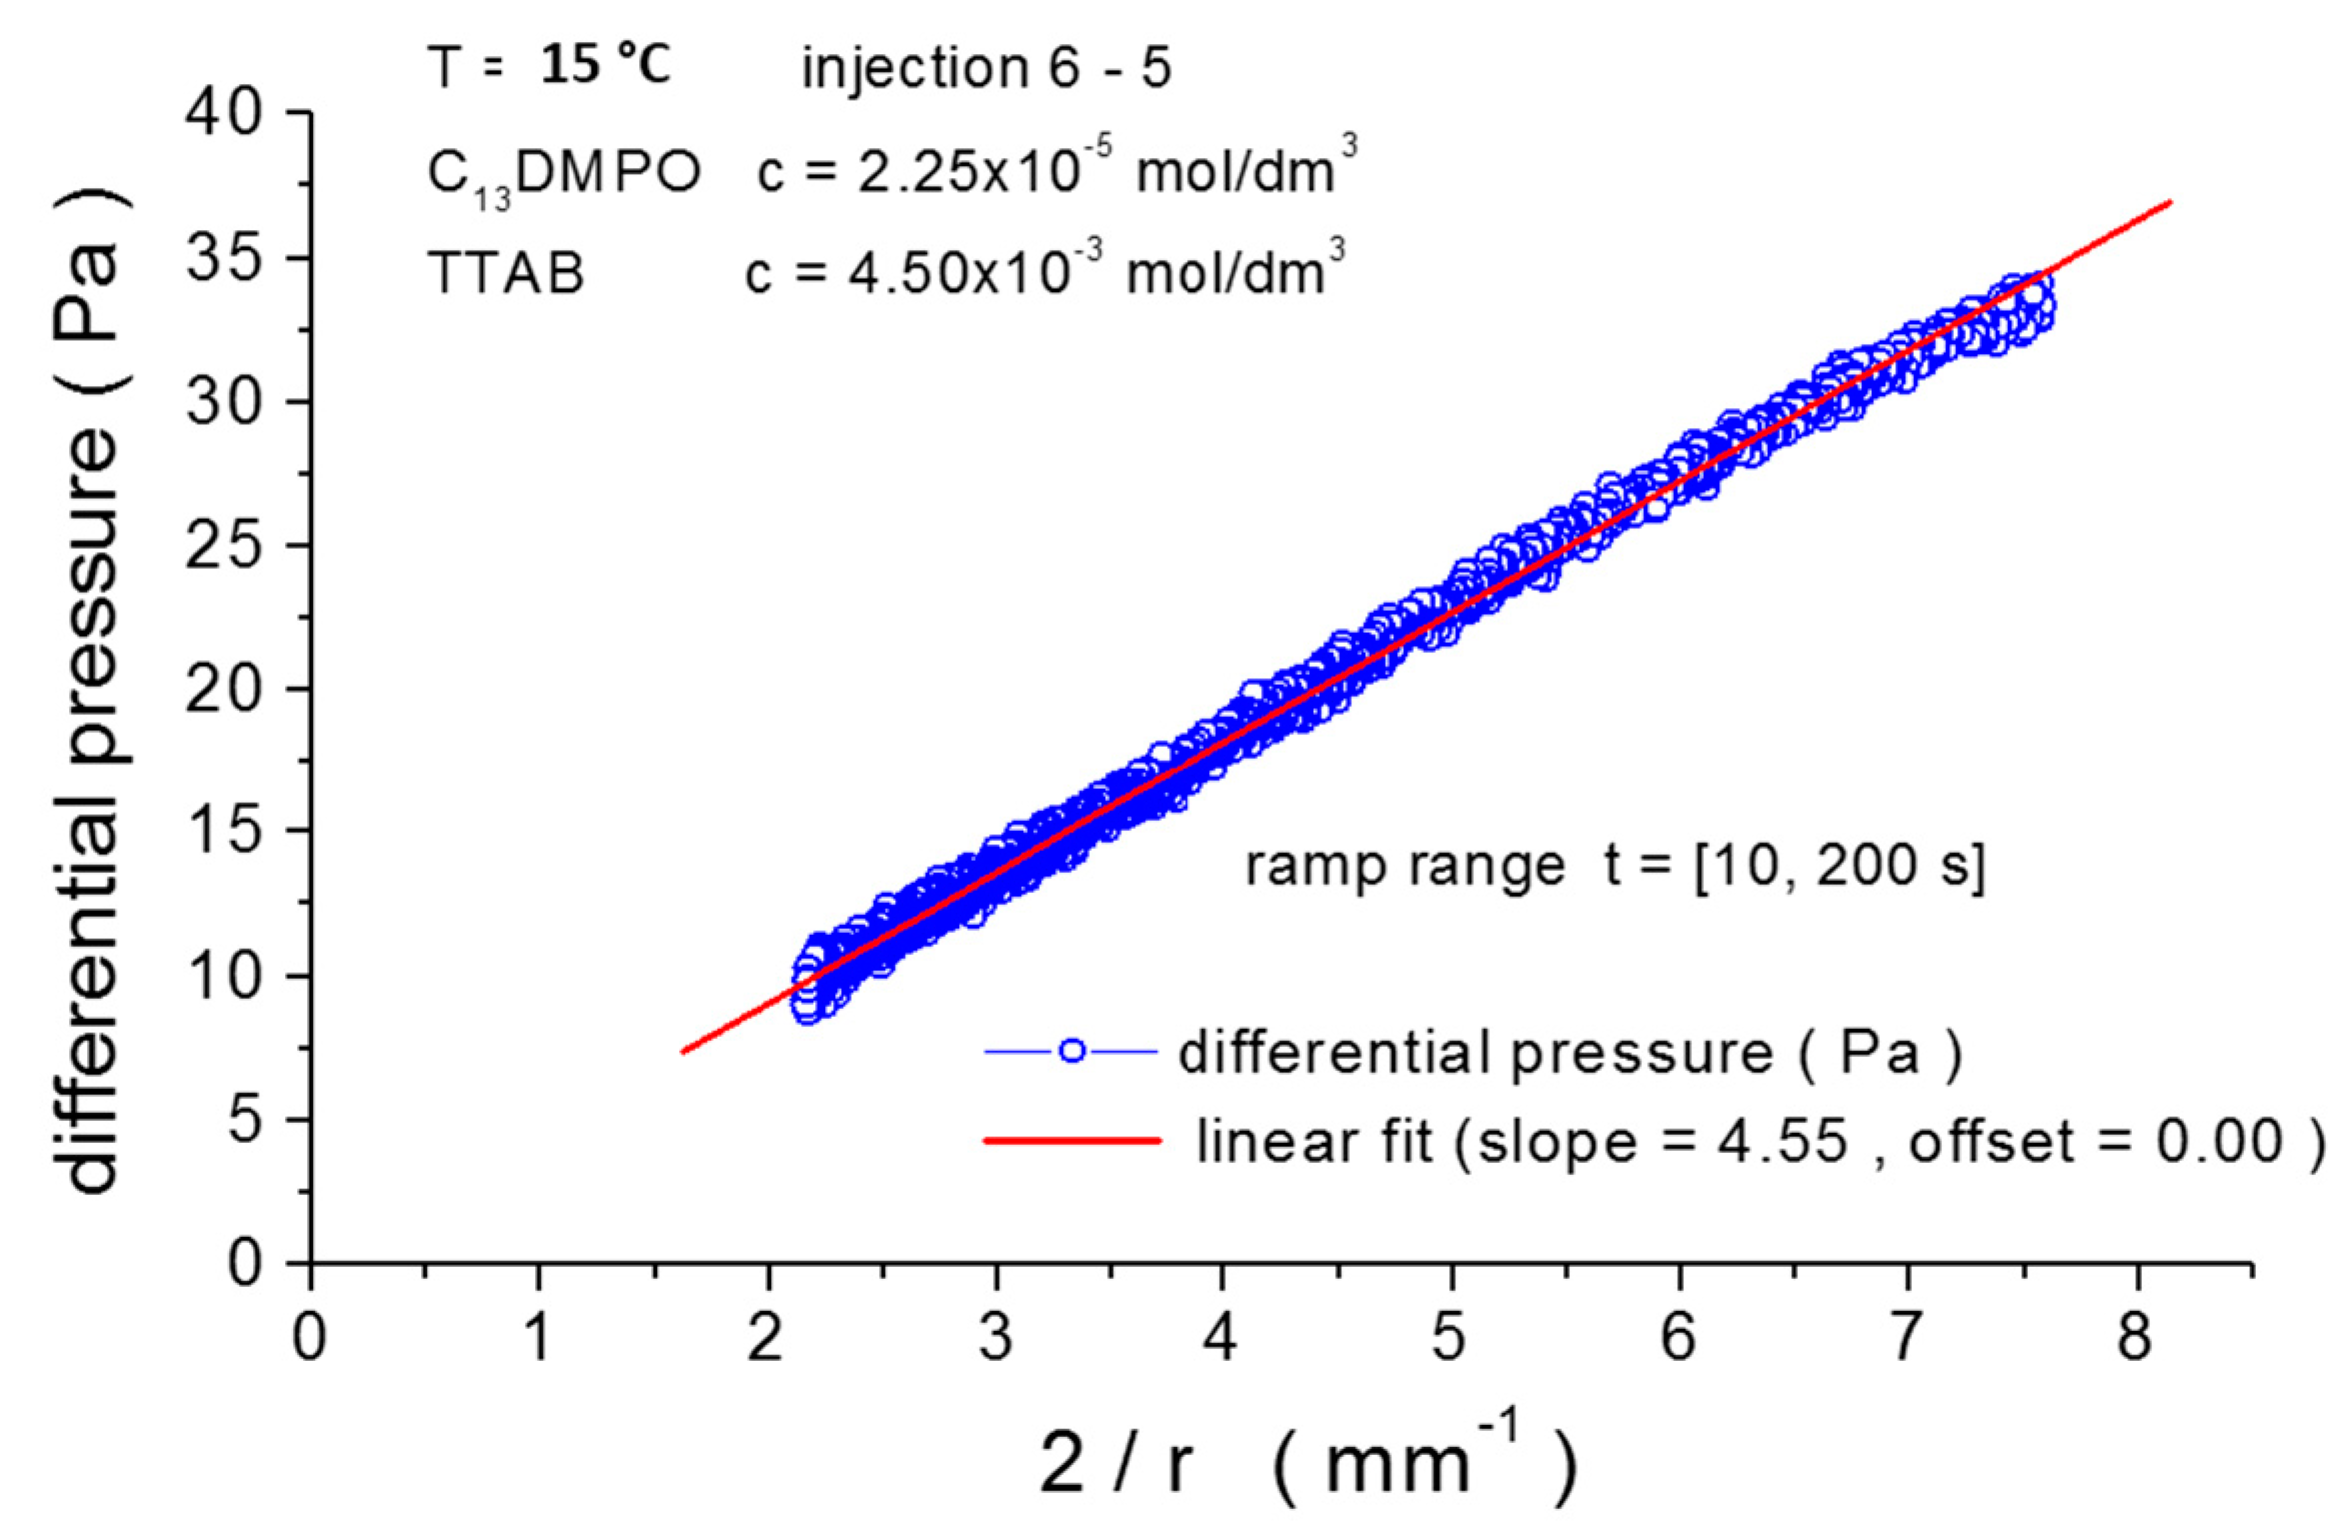
| 202–206 | 6-1 | 507.5 | 2.2 × 10⁻⁵ | - | 4.5 × 10⁻⁵ | 2.00 |
| 206–209 | 6-2 | - | 2.2 × 10⁻⁵ | 28 | 2.2 × 10⁻⁴ | 10.00 |
| 209–210 | 6-3 | - | 2.2 × 10⁻⁵ | 35 | 4.5 × 10⁻⁴ | 20.00 |
| 211–216 | 6-4 | - | 2.2 × 10⁻⁵ | 280 | 2.2 × 10⁻³ | 100.00 |
| 216–219 | 6-5 | - | 2.2 × 10⁻⁵ | 350 | 4.5 × 10⁻³ | 200.00 |
| Total injection | 787.5 | 700 |
© 2018 by the authors. Licensee MDPI, Basel, Switzerland. This article is an open access article distributed under the terms and conditions of the Creative Commons Attribution (CC BY) license (http://creativecommons.org/licenses/by/4.0/).
Share and Cite
Loglio, G.; Kovalchuk, V.I.; Bykov, A.G.; Ferrari, M.; Krägel, J.; Liggieri, L.; Miller, R.; Noskov, B.A.; Pandolfini, P.; Ravera, F.; et al. Dynamic Properties of Mixed Cationic/Nonionic Adsorbed Layers at the N-Hexane/Water Interface: Capillary Pressure Experiments Under Low Gravity Conditions. Colloids Interfaces 2018, 2, 53. https://doi.org/10.3390/colloids2040053
Loglio G, Kovalchuk VI, Bykov AG, Ferrari M, Krägel J, Liggieri L, Miller R, Noskov BA, Pandolfini P, Ravera F, et al. Dynamic Properties of Mixed Cationic/Nonionic Adsorbed Layers at the N-Hexane/Water Interface: Capillary Pressure Experiments Under Low Gravity Conditions. Colloids and Interfaces. 2018; 2(4):53. https://doi.org/10.3390/colloids2040053
Chicago/Turabian StyleLoglio, Giuseppe, Volodymyr I. Kovalchuk, Alexey G. Bykov, Michele Ferrari, Jürgen Krägel, Libero Liggieri, Reinhard Miller, Boris A. Noskov, Piero Pandolfini, Francesca Ravera, and et al. 2018. "Dynamic Properties of Mixed Cationic/Nonionic Adsorbed Layers at the N-Hexane/Water Interface: Capillary Pressure Experiments Under Low Gravity Conditions" Colloids and Interfaces 2, no. 4: 53. https://doi.org/10.3390/colloids2040053