Rubber Surface Change and Static Charging under Periodic Stress
by
 , , , and
Leandra P. Santos
1 ,
,
Yan A. S. Campo
2,
Douglas S. Da Silva
1,
Thiago A. L. Burgo
2 and
Fernando Galembeck
1,* 1
Institute of Chemistry, University of Campinas, Campinas, SP 13083-970, Brazil
2
Department of Physics and Department of Chemistry, Federal University of Santa Maria, Santa Maria, RS 97105-900, Brazil
*
Author to whom correspondence should be addressed.
Colloids Interfaces 2018, 2(4), 55; https://doi.org/10.3390/colloids2040055
Submission received: 28 September 2018
/
Revised: 27 October 2018
/
Accepted: 2 November 2018
/
Published: 6 November 2018
(This article belongs to the Special Issue Selected Papers from the 16th Conference of the International Association of Colloid and Interface Scientists (IACIS 2018))
Abstract
:Rubber materials play an important role in robotics, due to their sensing and actuating abilities, that are exploited in soft smart materials endowed with shape-adaptive and electroadhesive properties. The application of an electric field produces non-linear deformation that has been extensively modelled, but is not understood at the molecular level. The symmetric effect (the production of an electric field due to rubber deformation) was recently discovered and explained as follows: rubber surface chemical composition and adsorptive properties change during rubber deformation, allowing the surface to exchange charge with the atmosphere. The present work describes the complex surface morphology and microchemistry of tubing made from vulcanized natural rubber, showing that it is rough and made from two domain types: stiffer elevations containing Br or Al (depending on the sample used) and O, that rise above an elastic base that is exempt of elements other than C and H. The surface area fraction occupied by the elastic base is higher in the strained rubber than when it is relaxed. Electrostatic potential on rubber surfaces was measured as a function of the stretching frequency, using Kelvin electrodes and showing frequency-dependent potential variation. This is explained considering charge exchange between the atmosphere and rubber surface, mediated by water vapor adsorbed in the stretched rubber and trapped when it relaxes.
1. Introduction
Rubber materials are usually subject to periodic mechanical and electrical forces, e.g., in tires and insulators. Interest in the shape changes induced by electric fields [1,2,3,4] has grown recently, driven by different applications. For instance, dielectric elastomer actuators (DEAs) [5] display intriguing attributes similar to biological muscles, including self-sensing abilities [6,7] and improving the intelligence of gripping technologies [8]. Capacitors fitted with dielectric elastomers display energy-scavenging properties, with a performance comparable to other types of devices. Other recent findings refer to electric memory effects in styrene-butadiene rubber [9], magnetoelectricity [10], rubber deformation under combined mechanical and electrical forces, and tuning polymer resonant frequency, that can be done by applying a bias voltage to change the electrical stiffness of a polymer membrane [11].
Analysis of random response of a dielectric elastomer balloon disturbed by electrical or mechanical fluctuation [12], and constitutive models [13], are strategies to model and to do quantitative prediction of rubber performance in many important situations, but this does not benefit from knowledge on the molecular mechanisms of the observed phenomena.
Recent work from this group described a new finding on the electrostatic behavior of elastomers: in short, rubber tube stretching, followed by relaxation, provokes the appearance of transient excess charge that is more pronounced under higher relative humidity [14]. This effect is not related to any existing electrostatic charging phenomenon (piezoelectricity, flexoelectricity, triboelectricity, and contact charging) and a new mechanism was then proposed to explain charge pick-up and dissipation by stretched elastomers, as the result of water adsorption and the partition of water ions (H+ and OH−) in the rubber–air interface, due to periodic rubber surface modification.
Other unexpected findings on electrostatic phenomena in dielectrics have been described recently, leading to a revision of widespread ideas on electrostatic charging and its mechanisms [15]. Important aspects of electrostatic phenomena are not well understood [16,17,18], but tribo- and piezoelectricity are important sources of the electrostatic potentials detected in anthropic environments, often reaching many-thousand volts. They are currently used in nanotribogenerators, with great success. This is creating new opportunities for energy scavenging [19,20,21], and it is probably relevant to the prevention of harmful electrostatic discharge.
Knowledge of the electrostatic behavior of elastomers is more limited than in the case of semicrystalline or glassy thermoplastics. Vulcanized or thermoplastic elastomers seldom appear in triboelectric series, opposite to other synthetic polymers that have been examined in greater detail. Recent intriguing results on the contact charging of latex rubber balloons with polytetrafluoroethylene (PTFE) sheets showed that material strain can have a dominating effect on contact electrification [22]. Earlier work showed the effect of electric charges formed during repeated deformations on the fatigue resistance of vulcanized rubber [23], but the literature on rubber fatigue is usually silent on electrostatic phenomena [24,25,26,27,28]. Electrostatic charging features are even less understood for rubber than for other dielectric materials.
Electrostatic charging is usually dependent on the materials surface properties, and rubber surfaces show great variation and complexity [29] that is further increased by various surface treatments, exudates [30], oxidation [31] thermal damage [32], and aging. Rubber surfaces may change rapidly in response to changes in the outer environment, due to fast molecular motion at polymer surfaces above the glass transition temperature [33]. The present work describes morphology and chemical composition modification of the surfaces of strained vulcanized natural rubber, relating the surface changes to the observed potential variations.
2. Materials and Methods
Natural rubber samples were cut from two natural rubber tubes acquired from Sigma Aldrich (Z255785, Sigma-Aldrich Co., Saint Louis, MO, USA/Sigma-Aldrich Chemie Gmbh, Steinheim, Germany) (sample S) and from a local supplier (Merse, Campinas, Brazil) (sample L). Information on tubing dimensions, IR spectra (Cary-630, Agilent, Santa Clara, CA, USA), TGA (2950, TA Instruments, New Castle, DE, USA) and DSC curves (Q100, TA Instruments, New Castle, DE, USA), and swelling coefficients (Marte AM-220, Denver Instrument Company, Arvada, CO, USA and HG63, Meter Toledo, Greifensee, Switzerland), are given for both samples in the Supplementary Information.
Cyclic stretching–relaxation experiments were done using a homemade instrument that is schematically shown in Figure 1.
Rubber tubing was handled with antistatic gloves and a grounding wrist band, and mounted on aluminum holders lined with a PTFE sheet, on a reciprocating machine powered by an AC motor with a variable frequency drive. Rubber was stretched by a variable frequency drive, changing the holder distance between 12 cm and 22 cm. Prior to each run, latex tubing was mounted and equilibrated to reach potential within ±10 V. The stretching drive was turned on at the desired frequency for 20 min, and then turned off for 10 min, holding the rubber at the relaxed position. This was done in triplicate, for each stretching frequency. The electrostatic potential measurements were made with a Kelvin electrode (6000B-7C, aperture size of 1.32 mm diameter, Trek Incorporated, Medina, NY, USA) positioned 2 mm above the center of the relaxed tubing surface and connected to a Trek 347 voltmeter (Trek Incorporated, Medina, NY, USA) that measures static potential in the ±3300 V range. The voltmeter output was connected to a Keithley 6514 electrometer (Keithley Instruments, Inc., Cleveland, OH, USA), using an USB-to-GPIB interface (Keithley KUSB-488b). Experiments were done under 20−25 °C and 50−60% relative humidity.
Characterization of Natural Rubber Surfaces
Rubber surface topography and chemical composition data were obtained using a JEOL JSM-6360 LV scanning electron microscope (JEOL Ltd., Tokyo, Japan) equipped with a Noran System SIX microanalysis system (Thermo Electron Corporation, Middleton, WI, USA). The acceleration voltage used was 15 kV.
Relaxed and strained surfaces were from rectangular pieces cut from rubber tubing, coated with a thin iridium or carbon conductive layer, within a MED 020 (Bal-Tec) apparatus (Bal-Tec, Balzers, Liechtenstein) and mounted on brass holders using conductive tape.
3. Results
3.1. Electrostatic Potential Measurements during Rubber Stretching
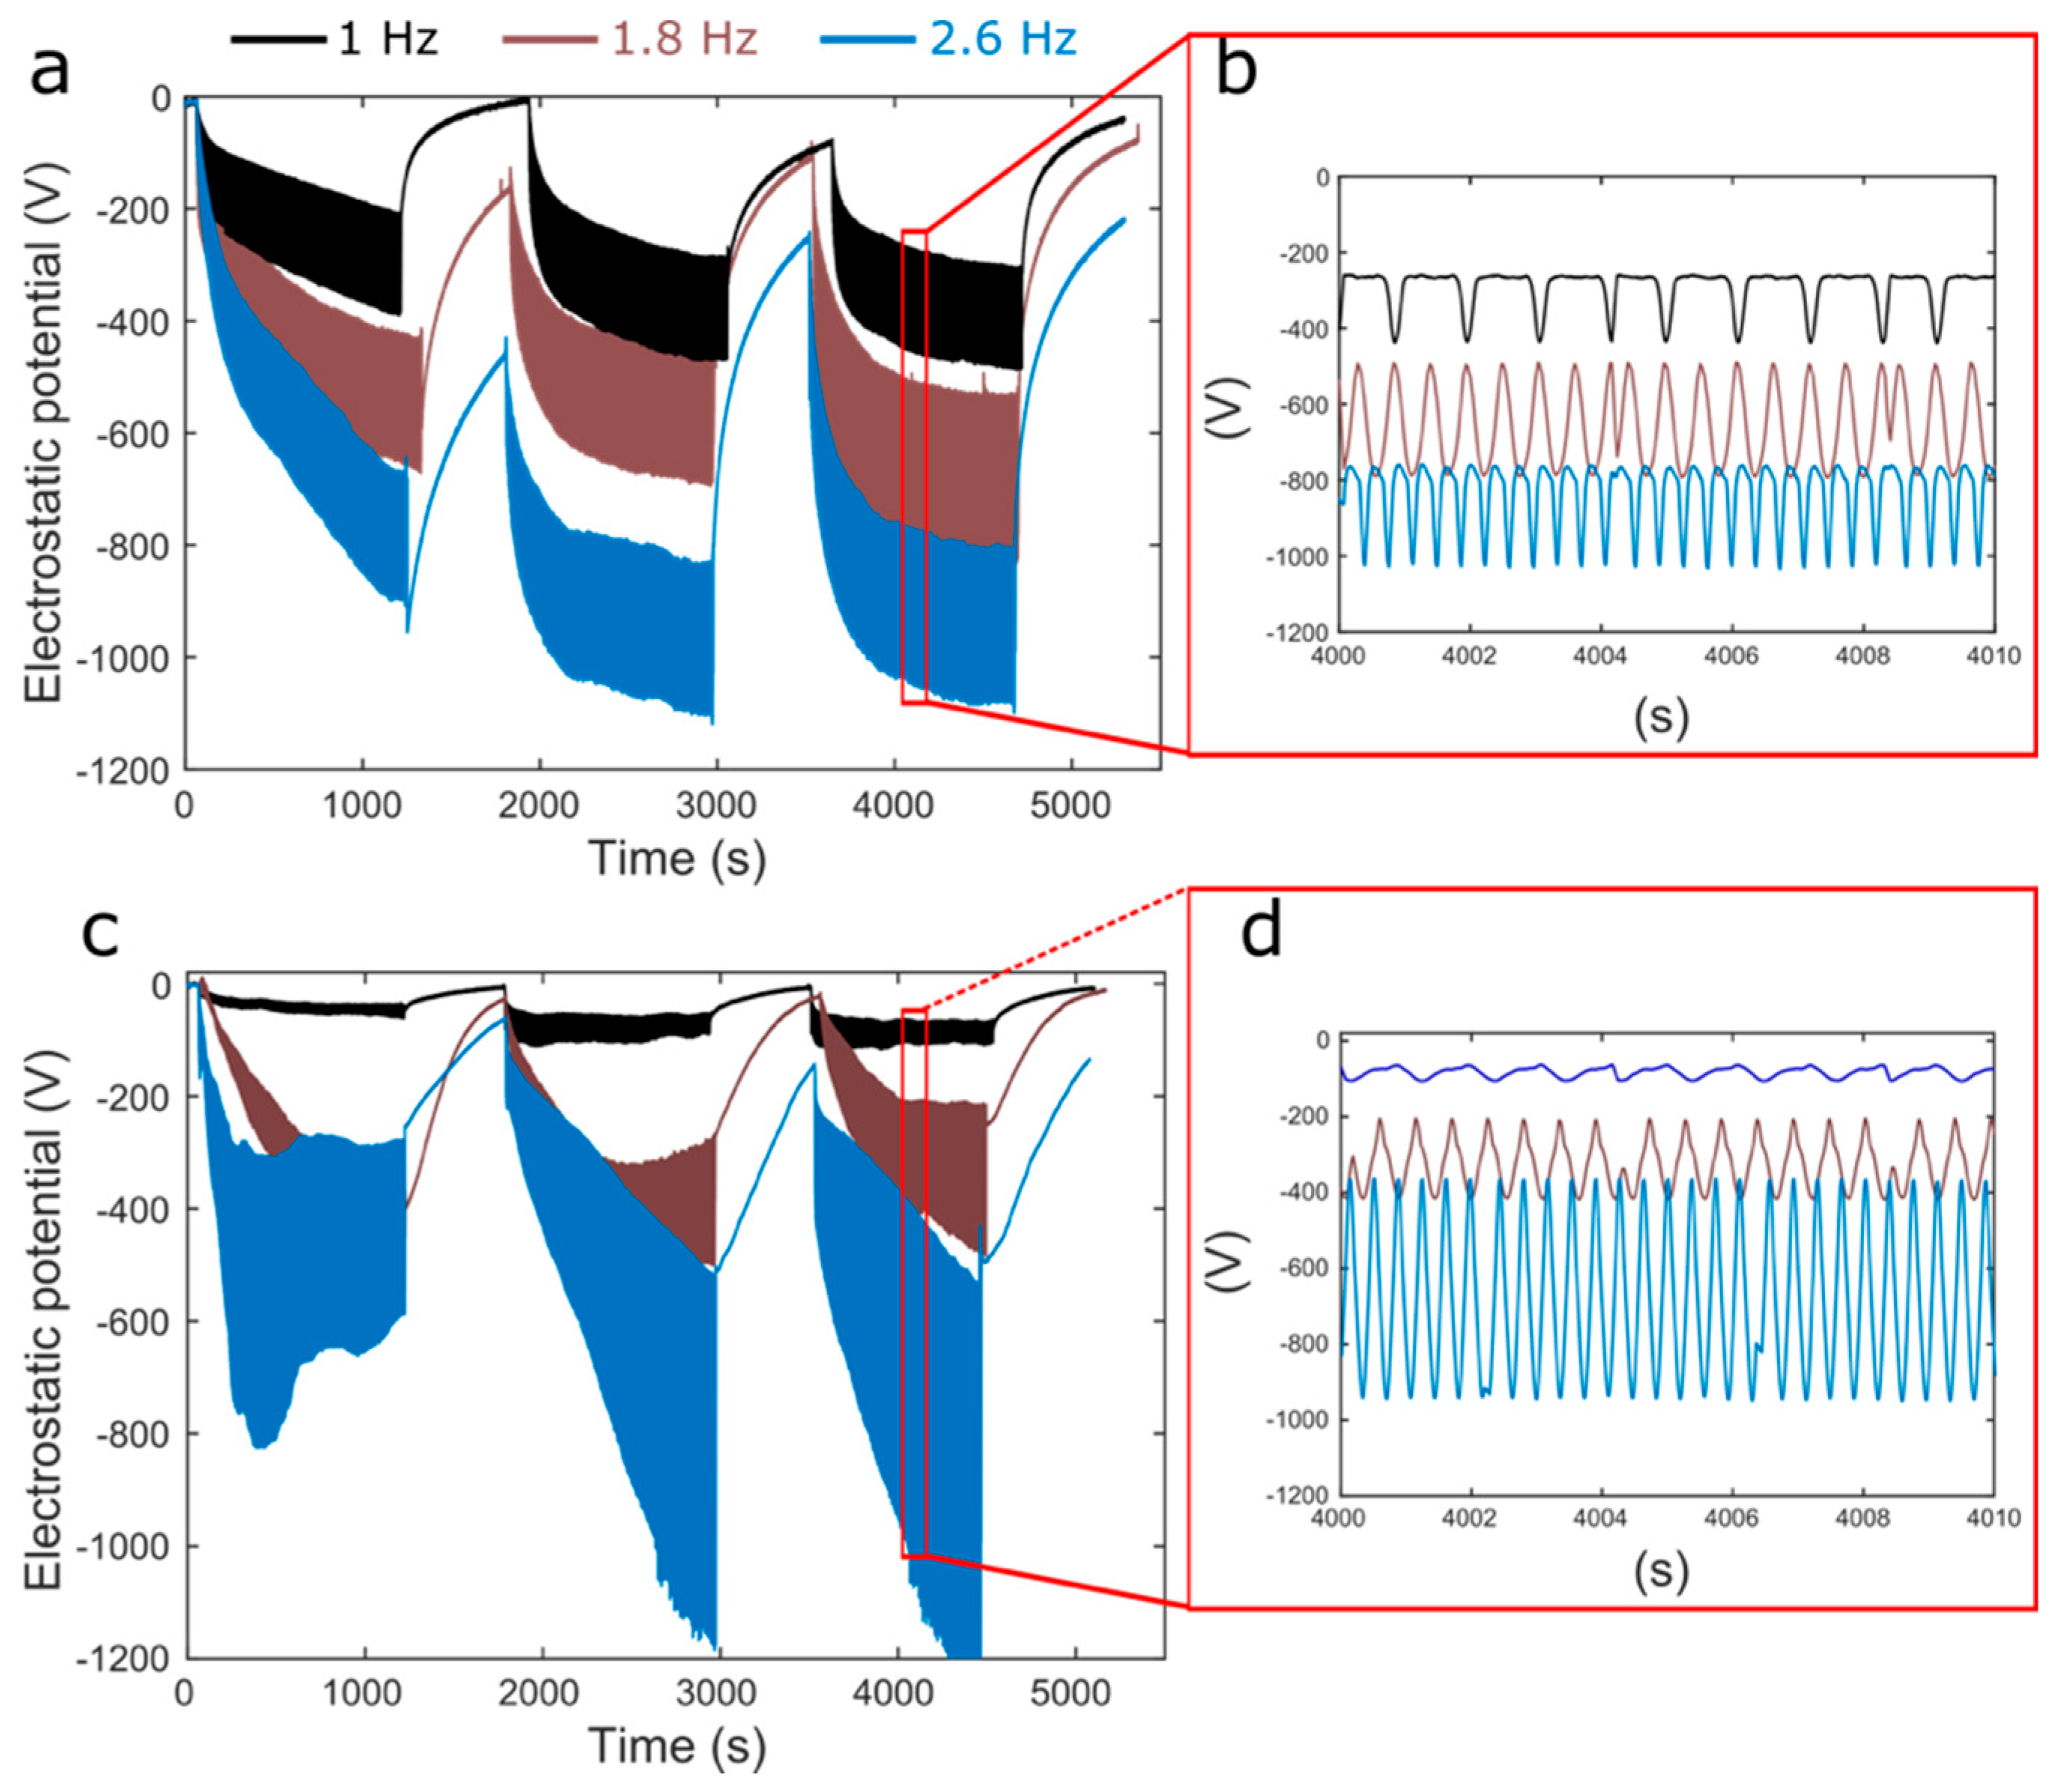
Rubber electrostatic potential changes in periodically stretched rubber, as shown in Figure 2.
Negative potential is measured when rubber relaxes after being stretched. The amplitude of potential variation increases with the stretching frequency and with time, the baselines of the oscillating potential plots drift to negative values, but they slowly go back to zero, in the relaxed rubber under rest. The patterns of potential variation with time are similar for the two samples used, but with important quantitative differences.
3.2. SEM Imaging of Natural Rubber Surfaces
SEM micrographs of relaxed and strained surfaces of natural rubber are in Figure 3.
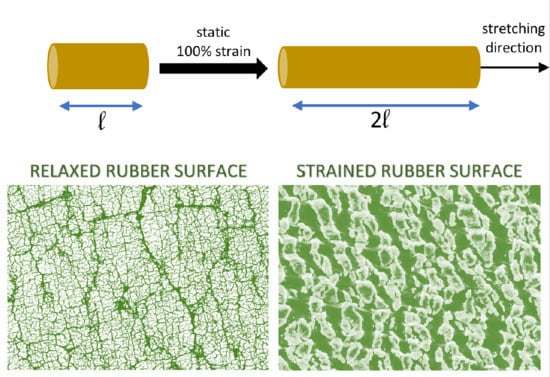
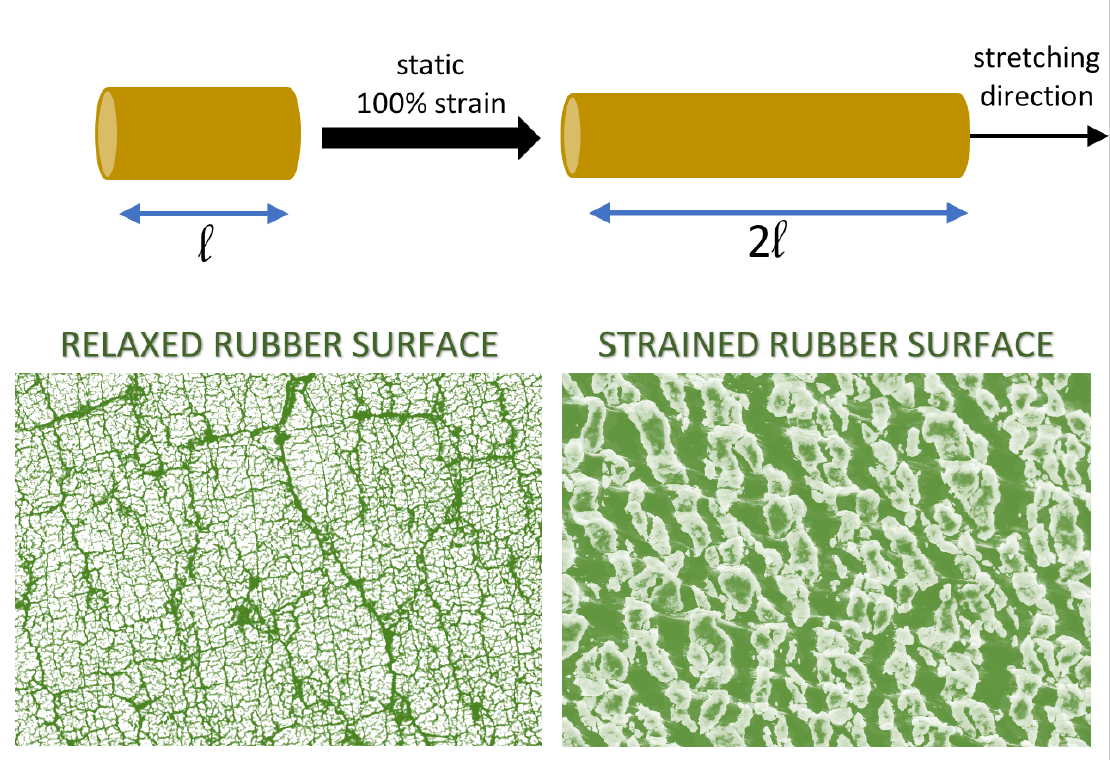
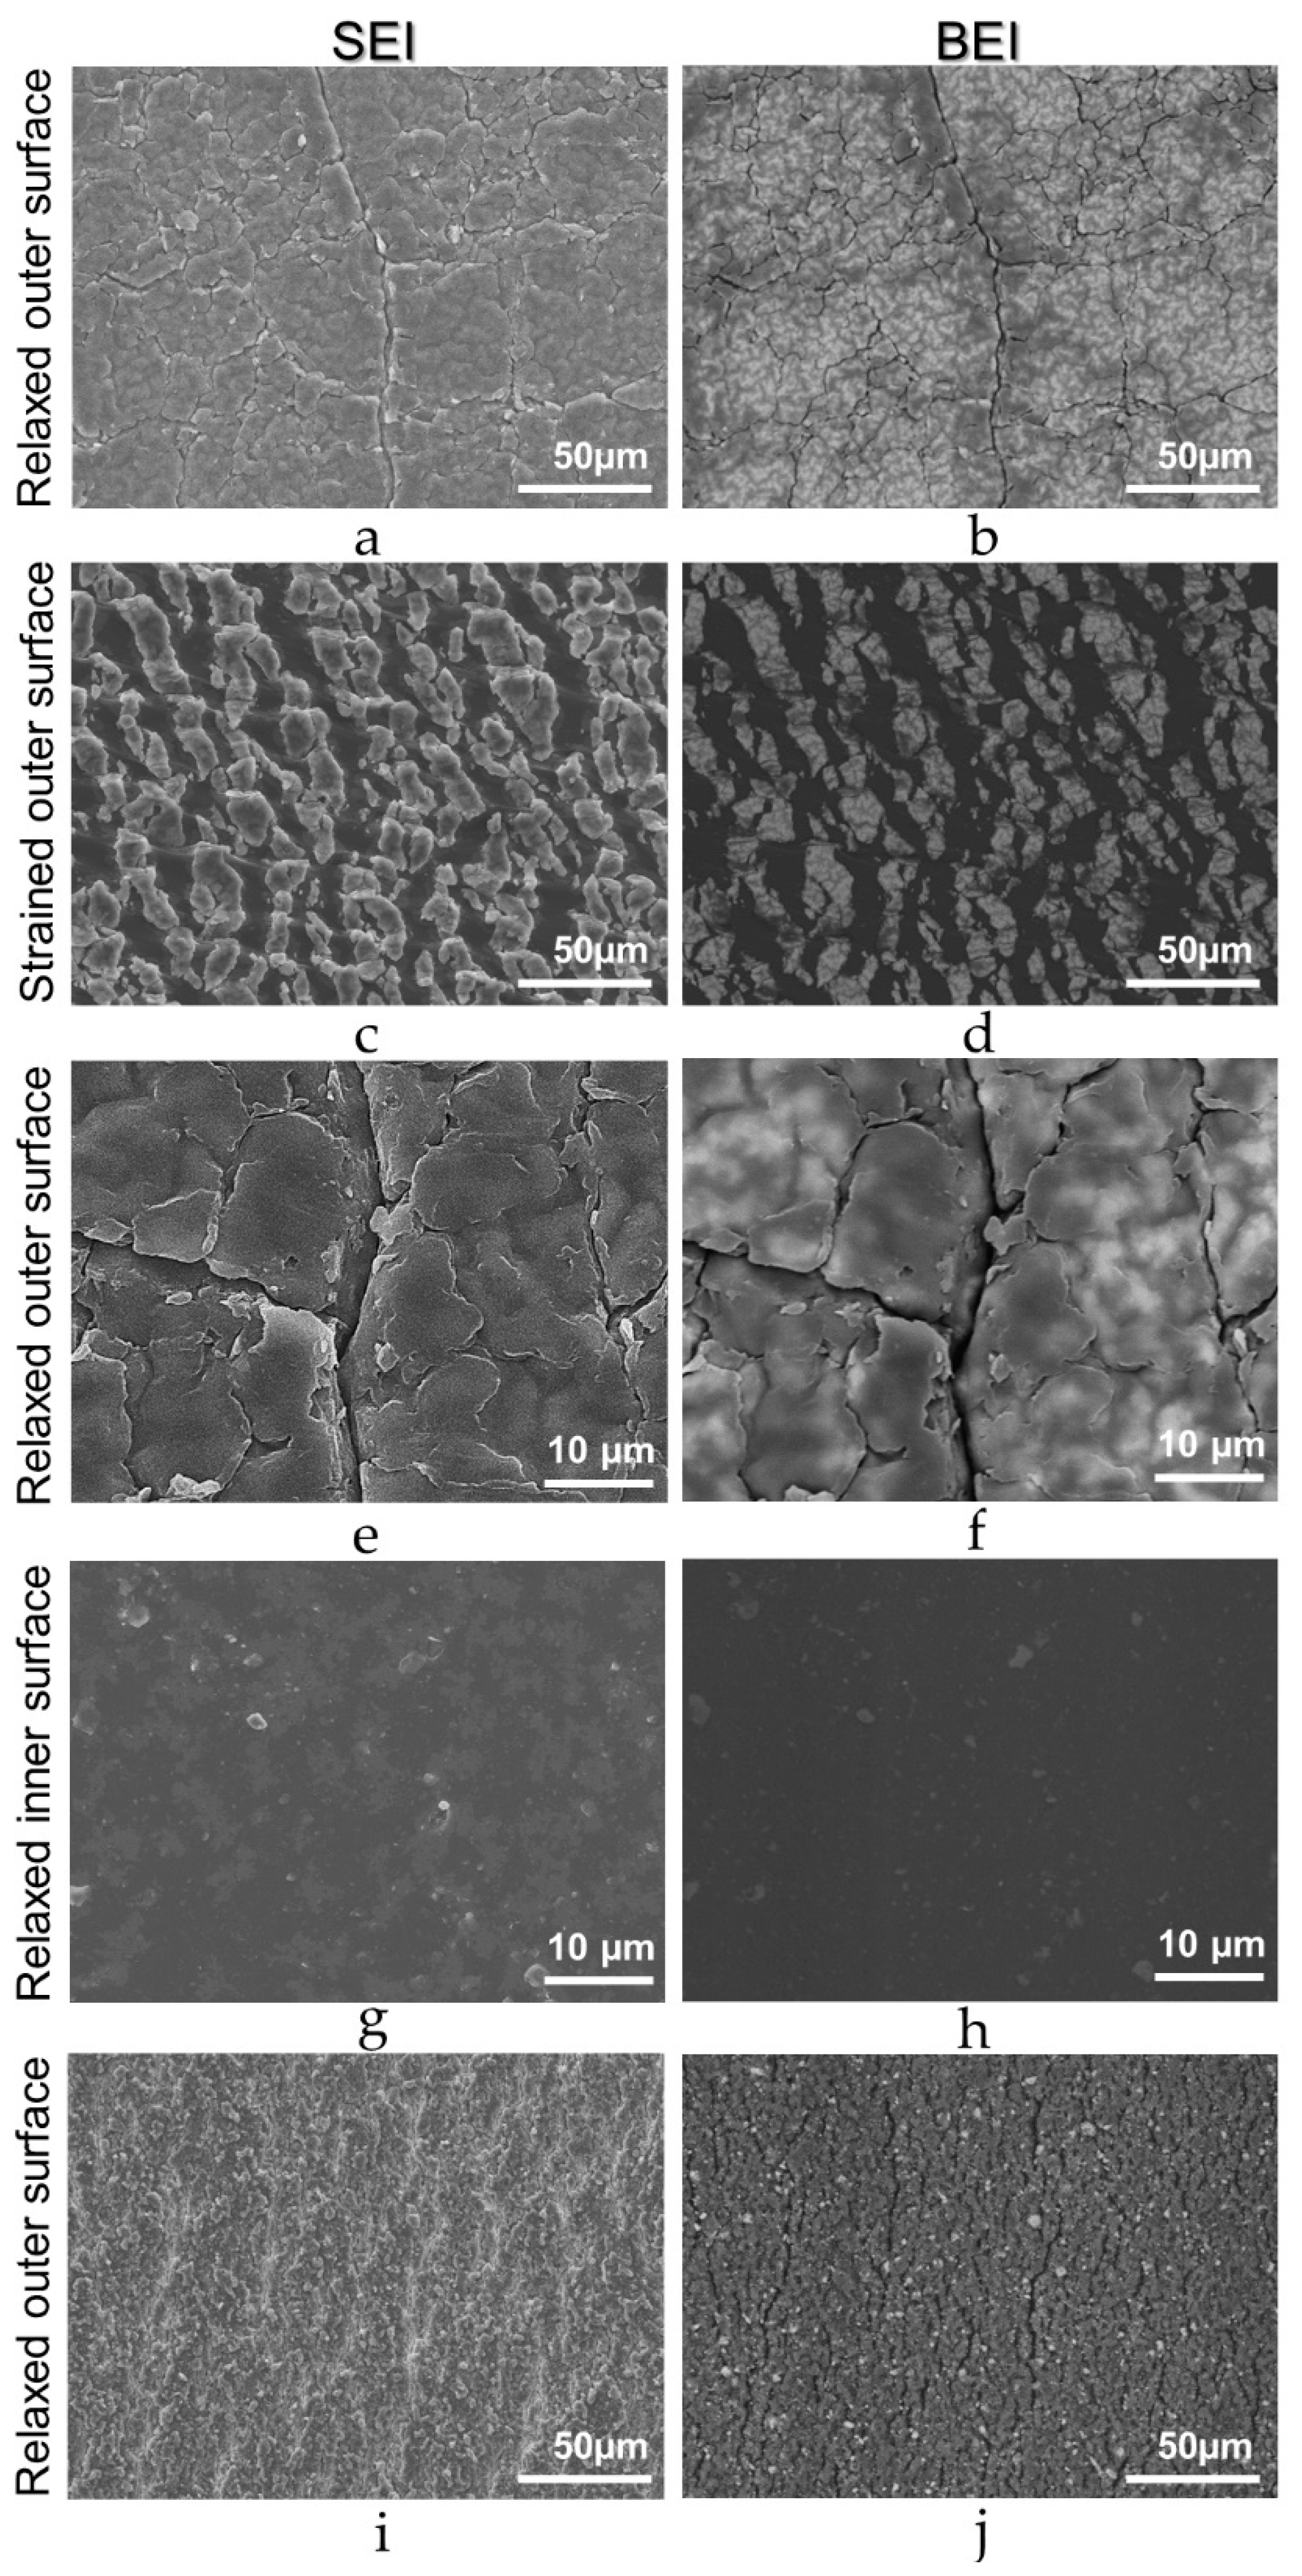
The outer rubber surface appears neither uniform nor smooth, even at the lowest magnification used (50 µm bar). Under higher magnification, the surface appears rough and divided into irregular roughly polyhedral blocks. Contrast is also detected within each block, especially in the BEI images, showing brighter rounded features scattered in a gray matrix. This shows that the surface is not only rough, but also chemically non-uniform, since contrast in the BEI images depends on the average atom weight in each pixel: brighter spots contain heavier elements. The images of stretched rubber are quite different, showing blocks of material with sharp features and higher average atom weight than the supporting matrix. Moreover, each block is further subdivided in smaller pieces, clearly shown in the BEI image. These observations show that the rubber surface is formed by high-average atom weight domains dispersed in an adherent matrix. These domains do not expand significantly when the rubber is stretched, and they occupy only a fraction of the surface area in the stretched rubber, much smaller than in the pristine rubber. The inner surface is much smoother and chemically uniform than the outer surface, according to Figure 3i,j, ruling out exudation as the source of rubber surface heterogeneity. As a further check, pieces of S sample were extensively washed with xylene, dried, and examined in the SEM, to verify morphology changes, indicating the extraction of exudate components, like paraffin. The micrographs do not show any significant change in surface morphology.
3.2.1. Rubber Surface Heterogeneity
Another information from SEM imaging is the heterogeneity of rubber surface, along the sample. Figure 4c–e show significant morphological difference between three adjacent areas. There are important differences in the aspect of different strained areas from the same sample, revealing a surface heterogeneity that already perceived in the unstrained rubber surface (Figure 4a,b).
The stretched surface shows elliptical zones separated by ligaments aligned with the stretching direction (Figure 4f). This morphology is similar to the structures formed at the crack tip of rubber under moderate fatigue loading conditions [34], and it is associated with crack growth and propagation. It is also observed under severe loading conditions [35,36], but concentrated in zones next to the crack initiation, which evolves to triangular and lamellar striation with increased stress concentration. However, the size of the elliptical zones described in these papers is at least one order of magnitude larger [15,16] than those observed in the present work, where the rubber remains statically stretched, and does not show any macroscopic cracks. This is a confirmation that shallow unevenly distributed microscopic cracks exist, even on a rubber surface that was never fatigued before. Mechanical stress is highly localized at these points [37], which may expand producing permanent macroscopic damage under fatigue.
Other studies concerning rubber fatigue resistance have shown increased crystallization at the ruptured site [38,39]. In these works, the analyzed cracks are always macroscopic, but the microscopic ligaments shown in Figure 4f are like others that are a consequence of rubber chain alignment and crystallization [40], and were also observed at microscopic scale.
3.2.2. Rubber Surface Microanalysis
EDX microanalysis was used to investigate the elements responsible for chemical contrast observed in the backscattered electron images. Elemental maps for a statically stretched rubber sample were obtained, and the elemental distribution is shown in Figure 5. Carbon is concentrated at the exposed rubber matrix. On the other hand, bromine is accumulated at the blocks dispersed above the rubber matrix, and O distribution is more uniform. Sulphur and zinc were also found in the sample, as expected for a sulfur-based cure system [41], but they show a less pronounced contrast compared to the other elements (not shown). Nitrogen, that is ever present in latex due to protein content [42], was not detected in the sample, which means that this rubber was deproteinized, and the presence of bromine suggests that it was brominated to reduce friction [43].
3.2.3. Chemical Differences between Rubber Surface and Bulk
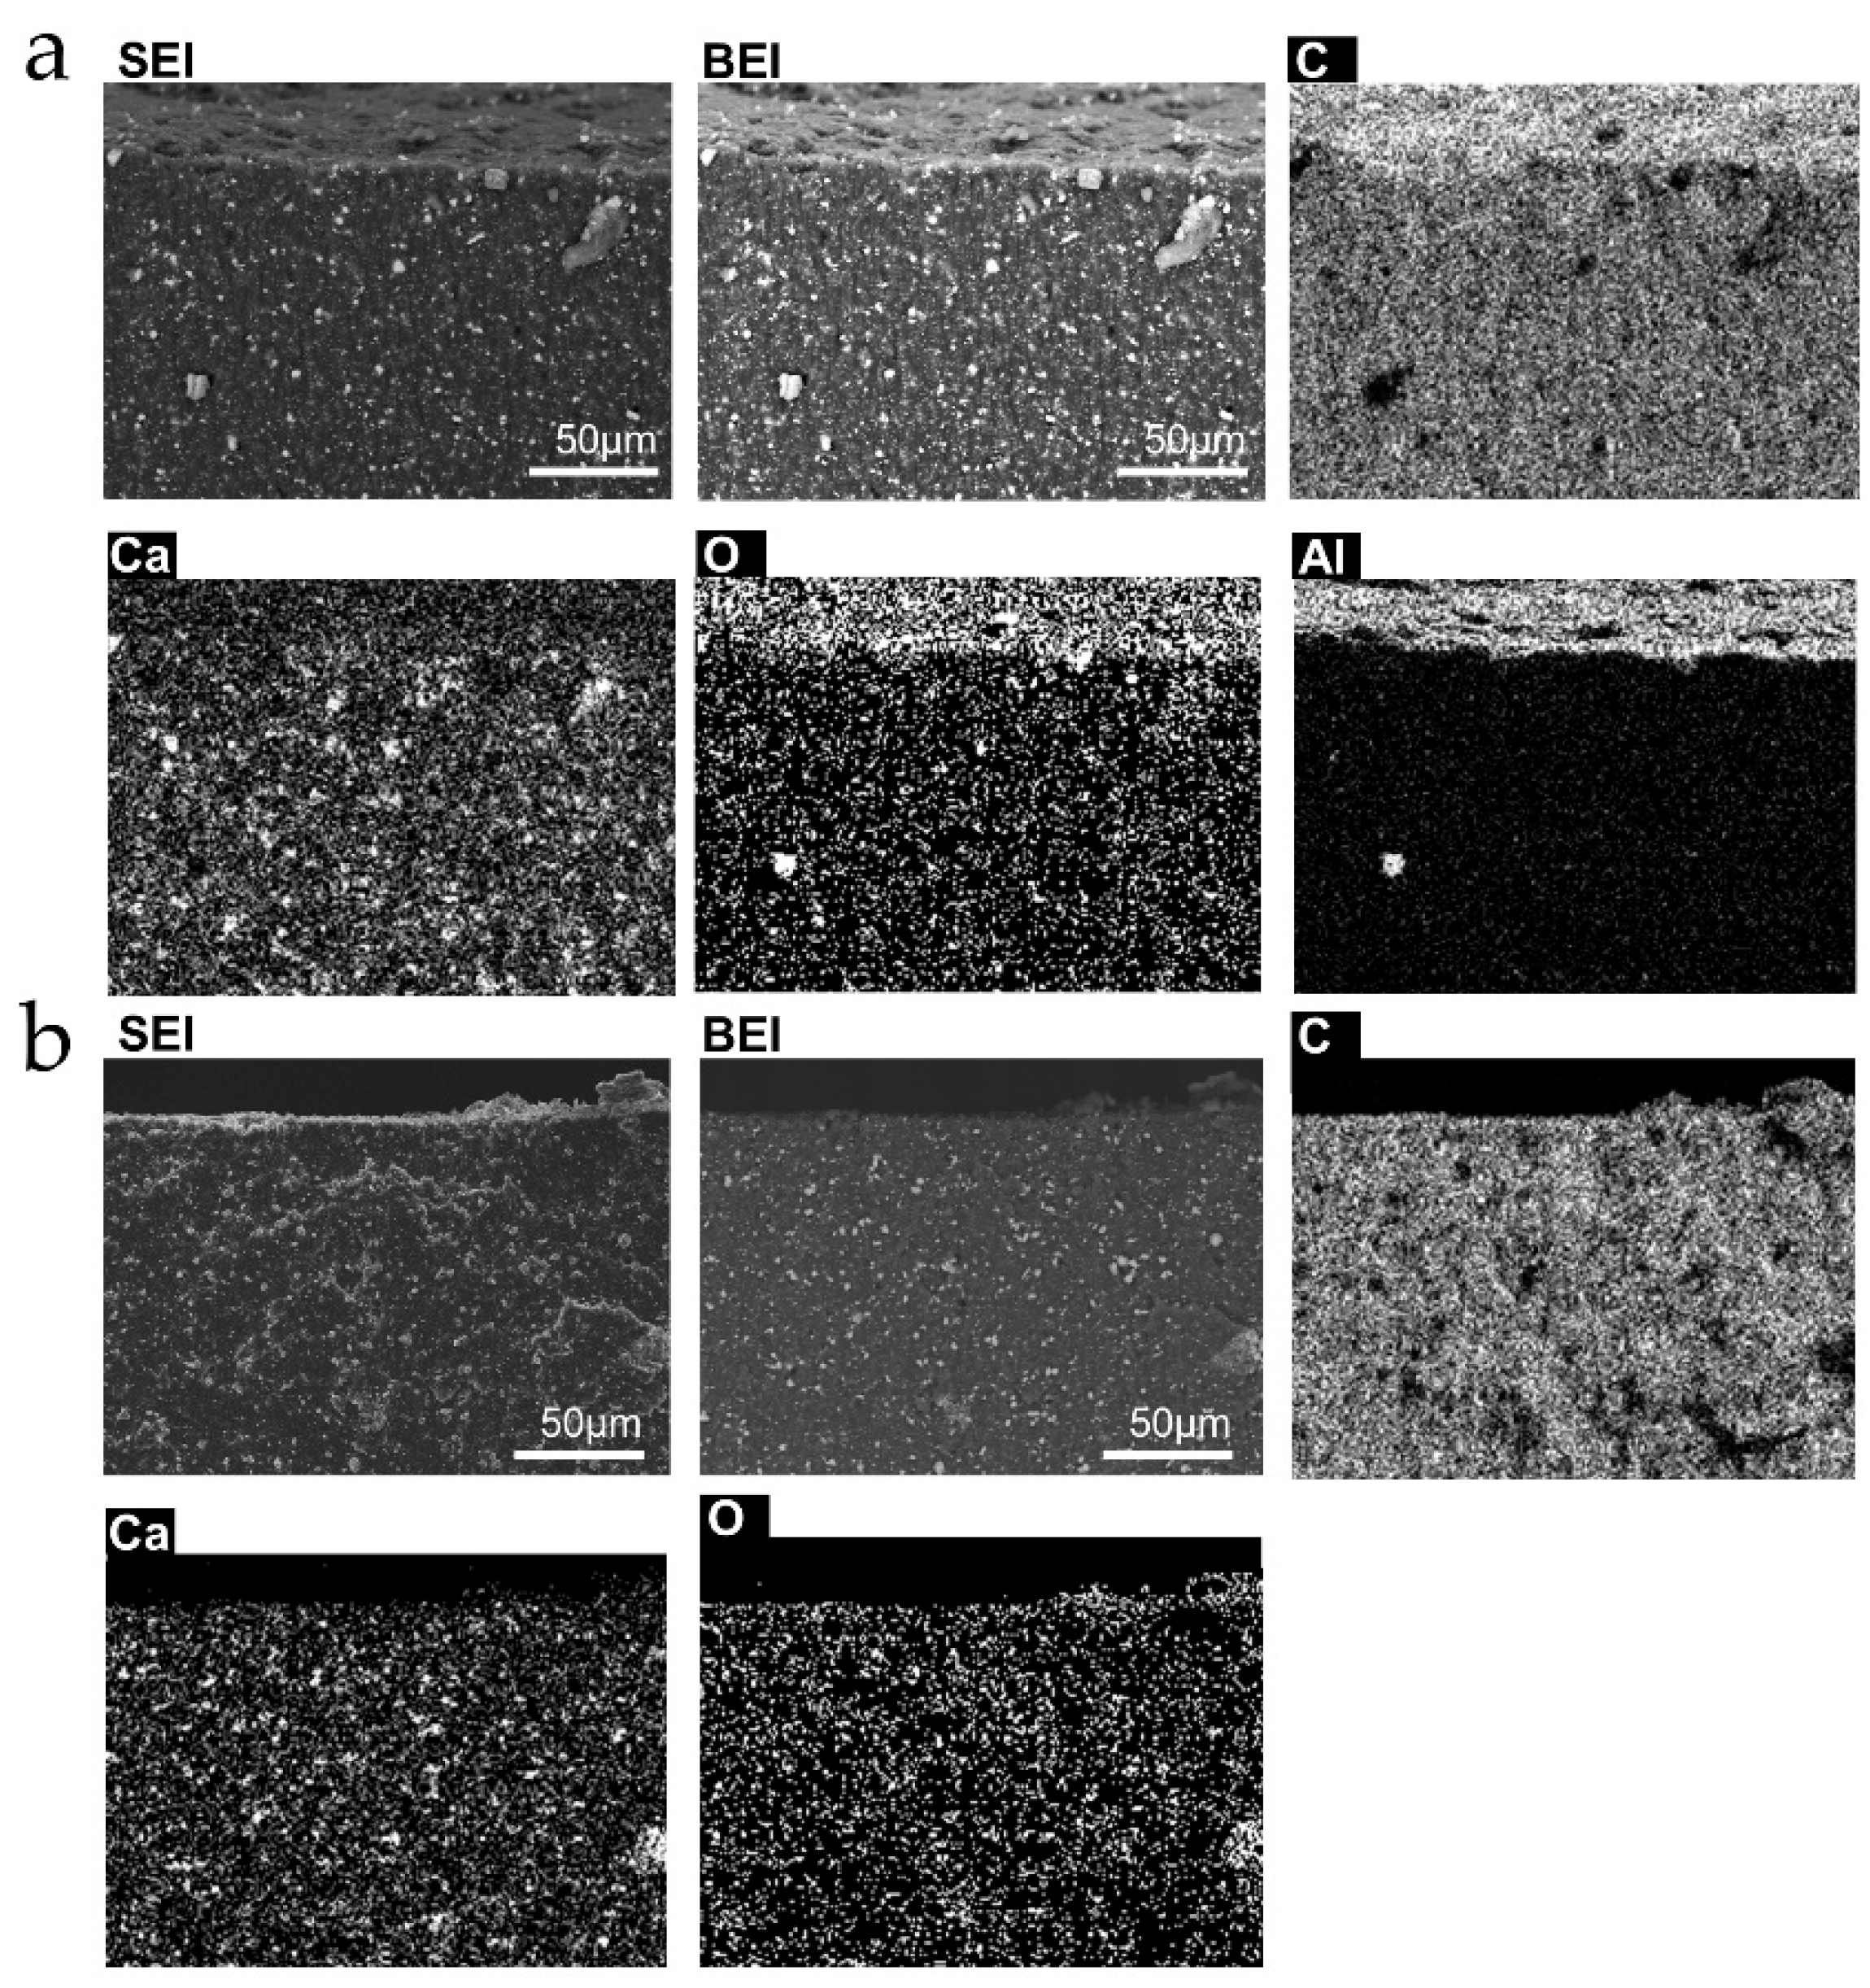
Assessment of the difference in rubber tubing bulk and surfaces was done by EDX analysis and elemental mapping, shown in Figure 6 and Figure 7, for the two types of samples used. The rubber surfaces are richer in elements other than carbon than the bulk, and there are important differences between the inner and outer surfaces’ chemical composition.
Sample S contains bromine at the outer surface only, while sample L contains Al at the outer surface, much more than in the bulk. Ca is found in discrete spots as well as throughout the L sample. Based on previous experience of this group with natural rubber latex, S rubber was made using “skim” [42] latex, while L sample was made from whole or “cream” rubber. The outer surface contains O in both samples. This is probably due to oxidation during the fabrication process, or coupled to mechanical tension, since the inner surfaces, that are less accessible to the atmosphere and are also kept under compression, are not oxidized.
3.2.4. Weight Gain in Stretched Rubber
In previous work, the rubber potential change was assigned to water uptake from the atmosphere, coupled to water ion partition. To test this hypothesis, S rubber samples were weighted before and after they were repeatedly stretched in the experiments shown in Figure 2. Nine samples were tested under different frequencies, and the sample weight averaged 3.18 ± 0.21 g and the average weight gain was 0.28 ± 0.03 g under 60% RH, much higher than the water swelling coefficients shown in the Supplementary Information. However, weight gain was independent of the stretching frequency, although this had a strong effect on the electrostatic potential. This will be further investigated, in future work.
4. Discussion
The rubber potential change under repeated stretching can be separated in two distinguishable events: one is periodic and reversible oscillation in phase with rubber length, the other is a slow baseline deviation that is evidence of the accumulation of negative charge, in rubber. Both rubber tubing samples used in this work showed the same charging pattern, but with important quantitative differences. For instance, the potential oscillation amplitude increases with frequency, but more pronouncedly in the S sample.
The current working hypothesis used to explain this effect uses two arguments: first, rubber surface composition changes when rubber is stretched, due to the change in surface area, and this is at least partly reversible, but strongly dependent on stretching frequency. Since the two samples have different surface composition but similar bulk composition, the subsurface groups exposed during stretching are the same.
Further, increasing the surface area while changing the surface composition increases the ability of rubber to adsorb water vapor that is trapped when rubber relaxes, and is accompanied by water ion partition [44], contributing negative charges from OH− ions to the rubber surface layers.
Indeed, microscopy and microanalysis results show that stretching rubber exposes subsurface rubber with a chemical composition different from the composition of the outer layer. Subsurface rubber components occupy a significant fraction of surface area when rubber is stretched, as evidenced in the electron micrographs.
Gravimetric data shows weight gain from the atmosphere, strongly dependent on the relative humidity, supporting the hypothesis of water uptake. Weight gain is much higher than the weight of bare OH− ions required to reach the measured potentials: excess ion concentration to produce 1 kV is equal to 1.67 × 10⁻⁸ coulomb/cm2, calculated using the Poisson equation. This corresponds to 2.94 × 10⁻¹² g, only. Thus, ions are highly dilute in the trapped water, e.g., 1.05 × 10⁻¹¹ grams of ions per gram of water, or 0.01 parts per billion. This low concentration of excess OH− ions is not detectable, even using sensitive analytical techniques, but the corresponding net charge and potential are easily detected by standard instruments used in electrostatics. This suggests that electrostatic measurements can play an important role in analytical work at the solid–air interface.
The pronounced increase in potential amplitude with time is evidence that the rubber surface undergoes significant change when it is stretched successively. This is probably due to mechanochemical reactions that also take place during these experiments: straining networks of entangled chains breaks them, and this may further provoke the formation of macroions, as in previous reports from this group [45,46]. However, lifetimes of mechanochemical macroions are long, and their formation is not reversible. Thus, they cannot account for the fast and reversible potential change in phase with rubber strain discussed in this work, but they can account for some part of the baseline drift in the potential vs time plots. Ongoing work in this group is addressing this problem through the examination of rubber change in prolonged runs, as in fatigue testing.
The effect described in this work could have been predicted (but it was not) as the inverse effect of previously described rubber deformation under an electric field [47], within the framework of linear irreversible thermodynamics. In the present case, the electric field is the result of mechanical action while, in the dielectric membranes used in robotics, the electric field is the agent producing mechanical effects.
5. Conclusions
Natural rubber surface has a complex morphology added to patterned domains with different chemical compositions. When the rubber is stretched, subsurface rubber chains are exposed, and adsorb water that is partly trapped when the rubber relaxes, carrying excess negative ions that account for the fast and reversible charging behavior of stretched rubber, providing a mechanistic basis for understanding rubber electrostatic behavior under periodic effort. This will probably contribute to establishing the molecular basis for a number of interesting phenomena displayed by rubber under electrical and mechanical strain, contributing to the design of energy-harvesting devices and self-sensing actuators for robotics.
Supplementary Materials
Rubber sample characterization are available online at https://www.mdpi.com/2504-5377/2/4/55/s1.
Author Contributions
L.P.S. and T.A.L.B contributed with experimental work, data treatment, the discussion of results and paper writing. Y.A.S.C. contributed with the construction of the experimental apparatus and performed stretching rubber experiments. D.S.d.S. did part of the microscopy analysis and discussion. F.G. participated in experimental design and some experiments, discussion, interpretation and writing.
Funding
This work was supported by Brazilian agencies MCTIC/CNPq (465452/2014-0) and FAPESP (2014/50906-9) through INCT/INOMAT (National Institute for Complex Functional Materials).
Conflicts of Interest
The authors declare no conflict of interest.
References
- Fu, Y.; Dorfmann, L.; Xie, Y. Localized necking of a dielectric membrane. Extrem. Mech. Lett. 2018, 21, 44–48. [Google Scholar] [CrossRef]
- An, L.; Wang, F.; Cheng, S.; Lu, T.; Wang, T.J. Experimental investigation of the electromechanical phase transition in a dielectric elastomer tube. Smart Mater. Struct. 2015, 24, 035006. [Google Scholar] [CrossRef]
- Jiménez, S.M.A.; McMeeking, R.M. A constitutive law for dielectric elastomers subject to high levels of stretch during combined electrostatic and mechanical loading: Elastomer stiffening and deformation dependent dielectric permittivity. Int. J. Non-Linear Mech. 2016, 87, 125–136. [Google Scholar] [CrossRef]
- Dorfmann, L.; Ogden, R.W. Nonlinear electroelasticity: Material properties, continuum theory and applications. Proc. Math. Phys. Eng. Sci. 2017, 473, 20170311. [Google Scholar] [CrossRef] [PubMed]
- Berselli, G.; Mammano, G.S.; Dragoni, E. Design of a dielectric elastomer cylindrical actuator with quasi-constant available thrust: Modeling procedure and experimental validation. J. Mech. Des. 2014, 136, 125001. [Google Scholar] [CrossRef]
- Cao, J.; Liang, W.; Zhu, J.; Ren, Q. Control of a muscle-like soft actuator via a bioinspired approach. Bioinspir. Biomim. 2018, 13, 066005. [Google Scholar] [CrossRef] [PubMed]
- Gisby, T.A.; O’Brien, B.M.; Anderson, I.A. Self sensing feedback for dielectric elastomer actuators. Appl. Phys. Lett. 2013, 102, 193703. [Google Scholar] [CrossRef]
- Guo, J.; Xiang, C.; Rossiter, J. A soft and shape-adaptive electroadhesive composite gripper with proprioceptive and exteroceptive capabilities. Mater. Des. 2018, 156, 586–587. [Google Scholar] [CrossRef]
- Mocellini, R.R.; Bonifacich, F.G.; Lambri, F.D.; Lambri, M.A.; Zelada, G.I.; Lambri, O.A. Electric memory effects in styrene-butadiene rubber, containing electric inclusions of highly aromatic oil. J. Adv. Dielectr. 2018, 8, 1850018. [Google Scholar] [CrossRef]
- Alameh, Z.; Yang, S.; Deng, Q.; Sharma, P. Emergent magnetoelectricity in soft materials, instability, and wireless energy harvesting. Soft Matter 2018, 14, 5856–5868. [Google Scholar] [CrossRef] [PubMed]
- Dong, L.; Grissom, M.D.; Safwat, T.; Prasad, M.G.; Fisher, F.T. Resonant frequency tuning of electroactive polymer membranes via an applied bias voltage. Smart Mater. Struct. 2018, 27, 114005. [Google Scholar] [CrossRef] [Green Version]
- Jin, X.; Huang, Z. Random response of dielectric elastomer balloon to electrical or mechanical perturbation. J. Intell. Mater. Syst. Struct. 2016, 28, 195–203. [Google Scholar] [CrossRef]
- Helal, A.; Doumit, M.; Shaheen, R. Biaxial experimental and analytical characterization of a dielectric elastomer. Appl. Phys. A Mater. Sci. Process. 2018, 124, 2. [Google Scholar] [CrossRef]
- Burgo, T.A.L.; Batista, B.C.; Galembeck, F. Electricity on rubber surfaces: A new energy conversion effect. ACS Omega 2017, 2, 8940–8947. [Google Scholar] [CrossRef]
- Galembeck, F.; Burgo, T.A.L. Chemical Electrostatics; Springer International Publishing AG: Cham, Switzerland, 2017; ISBN 978-3-319-52374-3. [Google Scholar]
- Schein, L.B. Recent progress and continuing puzzles in electrostatics. Science 2007, 316, 1572–1573. [Google Scholar] [CrossRef] [PubMed]
- Castle, G.S.P. Contact charging between insulators. J. Electrostat. 1987, 40–41, 13–20. [Google Scholar] [CrossRef]
- Bailey, A.G. The charging of insulator surfaces. J. Electrostat. 2001, 51–52, 82–90. [Google Scholar] [CrossRef]
- Harb, A. Energy harvesting: State-of-the-art. Renew. Energy 2011, 36, 2641–2654. [Google Scholar] [CrossRef]
- Mitcheson, P.D.; Yeatman, E.M.; Rao, G.K.; Holmes, A.S.; Green, T.C. Energy harvesting from human and machine motion for wireless electronic devices. Proc. IEEE 2008, 96, 1457–1486. [Google Scholar] [CrossRef] [Green Version]
- Zhu, G.; Peng, B.; Chen, J.; Jing, Q.; Wang, Z.L. Triboelectric nanogenerators as a new energy technology: From fundamentals, devices, to applications. Nano Energy 2015, 14, 126–138. [Google Scholar] [CrossRef] [Green Version]
- Sow, M.; Widenor, R.; Kumar, A.; Lee, S.W.; Lacks, D.J.; Sankaran, R.M. Strain-induced reversal of charge transfer in contact electrification. Angew. Chem. Int. Ed. 2012, 51, 2695–2697. [Google Scholar] [CrossRef] [PubMed]
- Dogadkin, B.A.; Gul, V.E.; Morozova, N.A. The effect of electric charges formed during repeated deformations on the fatigue resistance of vulcanizates. Rubber Chem. Technol. 1960, 33, 970. [Google Scholar] [CrossRef]
- Mars, W.V.; Fatemi, A. Factors that affect the fatigue life of rubber: A literature survey. Rubber Chem. Technol. 2004, 77, 391–412. [Google Scholar] [CrossRef]
- Lake, G.J. Fatigue and fracture of elastomers. Rubber Chem. Technol. 1995, 68, 435–460. [Google Scholar] [CrossRef]
- Zhao, J.; Ghebremeskel, G.N. A review of some of the factors affecting fracture and fatigue in SBR and BR vulcanizates. Rubber Chem. Technol. 2001, 74, 409–427. [Google Scholar] [CrossRef]
- Mars, W.V.; Fatemi, A. A literature survey on fatigue analysis approaches for rubber. Int. J. Fatigue 2002, 24, 949–961. [Google Scholar] [CrossRef]
- Tee, Y.L.; Loo, M.S.; Andriyana, A. Recent advances on fatigue of rubber after the literature survey by Mars and Fatemi in 2002 and 2004. Int. J. Fatigue 2018, 110, 115–129. [Google Scholar] [CrossRef]
- Torregrosa-Coque, R.; Álvarez-García, S.; Martín-Martinez, J.M. Migration of Paraffin Wax to Sulfur Vulcanized Styrene–Butadiene Rubber (SBR) Surface: Effect of Temperature. J. Adhes. Sci. Technol. 2012, 26, 813–826. [Google Scholar] [CrossRef]
- Moyano, M.A.; Martín-Martínez, J.M. Surface treatment with UV-ozone to improve adhesion of vulcanized rubber formulated with an excess of processing oil. Int. J. Adhes. Adhes. 2014, 55, 106–113. [Google Scholar] [CrossRef] [Green Version]
- Costa, R.A.; Coltro, L.; Galembeck, F. A Staining Procedure for the Detection of Oxidized Sites in Polyolefins. Angew. Makromol. Chem. 1990, 180, 85–94. [Google Scholar] [CrossRef]
- Nunes, S.P.; Costa, R.A.; Barbosa, S.P.; Almeida, G.R.; Galembeck, F. Tracking Degradation and Pyrolysis of EPDM Insulators. IEEE Trans. Dielectr. Electr. Insul. 1989, 24, 99–105. [Google Scholar] [CrossRef]
- Baszkin, A.; Ter-Minassian-Saraga, L. Chemical structures of surface-oxidized and grafted polyethylene: Adsorption and wetting studies. J. Polym. Sci. Part C Polym. Symp. 1971, 34, 243–252. [Google Scholar] [CrossRef]
- Le Cam, J.-B.; Huneau, B.; Verron, E.; Gornet, L. Mechanism of fatigue crack growth in carbon black filled natural rubber. Macromolecules 2004, 37, 5011–5017. [Google Scholar] [CrossRef]
- Le Cam, J.-B.; Toussaint, E. The mechanism of fatigue crack growth in rubbers under severe loading: The effect of stress-induced crystallization. Macromolecules 2010, 43, 4708–4714. [Google Scholar] [CrossRef] [Green Version]
- Munoz, L.; Vanel, L.; Sanseau, O.; Sotta, P.; Long, D.; Odoni, L.; Guy, L. Fatigue crack growth dynamics in filled natural rubber. Plast. Rubber Compos. 2012, 41, 273–276. [Google Scholar] [CrossRef]
- Griffith, A.A. VI. The phenomena of rupture and flow in solids. Philos. Trans. R. Soc. 1920, 221, 163–198. [Google Scholar] [CrossRef]
- Zhou, W.; Li, X.; Lu, J.; Huang, N.; Chen, L.; Qi, Z.; Li, L.; Liang, H. Toughening mystery of natural rubber deciphered by double network incorporating hierarchical structures. Sci. Rep. 2014, 4, 7502. [Google Scholar] [CrossRef] [PubMed] [Green Version]
- Samaca Martinez, J.R.; Balandraud, X.; Toussaint, E.; Le Cam, J.-B.; Berghezan, D. Thermomechanical analysis of the crack tip zone in stretched crystallizable natural rubber by using infrared thermography and digital image correlation. Polymer 2014, 55, 6345–6353. [Google Scholar] [CrossRef]
- Trabelsi, S.; Albouy, P.-A.; Rault, J. Stress-induced crystallization around a crack tip in natural rubber. Macromolecules 2002, 35, 10054–10061. [Google Scholar] [CrossRef]
- Ciullo, P.A.; Hewitt, N. The Rubber Formulary; Noyes Publications/William Andrew Publishing: New York, NY, USA, 1999; pp. 4–49. ISBN 9780815519294. [Google Scholar]
- Rippel, M.M.; Lee, L.-T.; Leite, C.A.P.; Galembeck, F. Skim and cream natural rubber particles: Colloidal properties, coalescence and film formation. J. Colloid Interface Sci. 2003, 268, 330–340. [Google Scholar] [CrossRef] [PubMed]
- Roberts, A.D.; Brackley, C.A. Surface treatment of rubber to reduce friction. J. Nat. Rubber Res. 1989, 4, 1–21. [Google Scholar]
- Burgo, T.A.L.; Rezende, C.A.; Bertazzo, S.; Galembeck, A.; Galembeck, F. Electric potential decay on polyethylene: Role of atmospheric water on electric charge build-up and dissipation. J. Electrost. 2011, 69, 401–409. [Google Scholar] [CrossRef]
- Burgo, T.A.L.; Ducati, T.R.D.; Francisco, K.R.; Clinckspoor, K.J.; Galembeck, F.; Galembeck, S.E. Triboelectricity: Macroscopic charge patterns formed by self-arraying ions on polymer surfaces. Langmuir 2012, 28, 7407–7416. [Google Scholar] [CrossRef] [PubMed]
- Balestrin, L.B.S.; Duque, D.D.; Silva, D.S.; Galembeck, F. Triboelectricity in insulating polymers: Evidence for a mechanochemical mechanism. Faraday Discuss. 2014, 170, 369–383. [Google Scholar] [CrossRef] [PubMed]
- Bortot, E. Nonlinear dynamic response of soft thick-walled electro-active tubes. Smart Mater. Struct. 2018, 27, 105025. [Google Scholar] [CrossRef]
Figure 1.
Schematic description of the apparatus used to measure electric potential on periodically stretched natural rubber.
Figure 1.
Schematic description of the apparatus used to measure electric potential on periodically stretched natural rubber.

Figure 2.
Potential variation in periodically stretched natural rubber tubing. (a,b): sample L tubing. (c,d) sample S. Plots (b,d) are zoomed views from rectangles in a and c.
Figure 2.
Potential variation in periodically stretched natural rubber tubing. (a,b): sample L tubing. (c,d) sample S. Plots (b,d) are zoomed views from rectangles in a and c.

Figure 3.
SEI (left side) and BEI (right side) micrographs acquired from S tubing outer surface, either relaxed (a,b,e,f) or strained (c,d). Relaxed inner S tubing micrographs are (g) (SEI) and (h) (BEI). Micrographs of the unstrained L sample outer surface are (i) (SEI) and (j) (BEI).
Figure 3.
SEI (left side) and BEI (right side) micrographs acquired from S tubing outer surface, either relaxed (a,b,e,f) or strained (c,d). Relaxed inner S tubing micrographs are (g) (SEI) and (h) (BEI). Micrographs of the unstrained L sample outer surface are (i) (SEI) and (j) (BEI).

Figure 4.
SEM micrographs obtained from different spots of the same rubber sample. In images (a,b), the rubber is not strained, while in (c–f), the rubber is elongated to twice its original length.
Figure 4.
SEM micrographs obtained from different spots of the same rubber sample. In images (a,b), the rubber is not strained, while in (c–f), the rubber is elongated to twice its original length.

Figure 5.
Backscattered electron micrograph and EDX elemental distribution maps obtained from an elongated surface area. The scale bar is in the upper left picture (BEI).
Figure 5.
Backscattered electron micrograph and EDX elemental distribution maps obtained from an elongated surface area. The scale bar is in the upper left picture (BEI).

Figure 6.
Micrographs and elemental distribution maps of cut surfaces normal to the tubing length. (a) outer surface; (b) inner surface from sample L. Sample S. The scale bars in the SEI and BEI micrographs apply to the other images from the same area.
Figure 6.
Micrographs and elemental distribution maps of cut surfaces normal to the tubing length. (a) outer surface; (b) inner surface from sample L. Sample S. The scale bars in the SEI and BEI micrographs apply to the other images from the same area.

Figure 7.
Micrographs and elemental distribution maps of cut surfaces normal to the tubing length. (a) outer surface; (b) inner surface from sample L. The scale bars in the SEI and BEI micrographs apply to the other images from the same area.
Figure 7.
Micrographs and elemental distribution maps of cut surfaces normal to the tubing length. (a) outer surface; (b) inner surface from sample L. The scale bars in the SEI and BEI micrographs apply to the other images from the same area.

© 2018 by the authors. Licensee MDPI, Basel, Switzerland. This article is an open access article distributed under the terms and conditions of the Creative Commons Attribution (CC BY) license (http://creativecommons.org/licenses/by/4.0/).
Share and Cite
MDPI and ACS Style
Santos, L.P.; Campo, Y.A.S.; Da Silva, D.S.; Burgo, T.A.L.; Galembeck, F. Rubber Surface Change and Static Charging under Periodic Stress. Colloids Interfaces 2018, 2, 55. https://doi.org/10.3390/colloids2040055
AMA Style
Santos LP, Campo YAS, Da Silva DS, Burgo TAL, Galembeck F. Rubber Surface Change and Static Charging under Periodic Stress. Colloids and Interfaces. 2018; 2(4):55. https://doi.org/10.3390/colloids2040055
Chicago/Turabian StyleSantos, Leandra P., Yan A. S. Campo, Douglas S. Da Silva, Thiago A. L. Burgo, and Fernando Galembeck. 2018. "Rubber Surface Change and Static Charging under Periodic Stress" Colloids and Interfaces 2, no. 4: 55. https://doi.org/10.3390/colloids2040055