Article

Vegetation Dynamics and Megaherbivore Presence of MIS 3 Stadials and Interstadials 10–8 Obtained from a Sediment Core from Auel Infilled Maar, Eifel, Germany

1
Department of Isotope Geochemistry, Max Planck Institute for Chemistry, 55128 Mainz, Germany
2
Department of Geosciences, Johannes Gutenberg University Mainz, 55128 Mainz, Germany
*
Author to whom correspondence should be addressed.
Quaternary 2023, 6(3), 44; https://doi.org/10.3390/quat6030044
Submission received: 6 July 2023 / Revised: 31 July 2023 / Accepted: 1 August 2023 / Published: 7 August 2023

Abstract

:
We present a record of pollen and spores of coprophilous fungi from a sediment core from Auel infilled maar, Eifel, Germany, covering the period from 42,000 to 36,000 yr b2k. We can show that vegetation cover was dominated by a boreal forest with components of steppe and cold-temperate wood taxa. The proportion of wood taxa was higher during interstadials, whereas steppe-vegetation became more prominent during stadials. During Heinrich stadial 4, temperate taxa are mostly absent. Spores of coprophilous fungi show that megaherbivores were continuously present, albeit in a larger number during stadials when steppe environment with abundant steppe herbs expanded. With the onset of Greenland stadial 9, forests became more open, allowing for steppe-environment to evolve. The shift in vegetation cover coincides with the highest values of herbivore biomass at the time that Neanderthal humans demised and Anatomically Modern Humans most probably arrived in Central and Western Europe. Megaherbivore biomass was a direct consequence of vegetation cover/availability of food resources and thus an indirect consequence of a changing climate. Herds of large herbivores following suitable (steppe) habitats may have been one cause of the migration of AMH into Europe, going along with their prey to productive hunting grounds.

1. Introduction

During the last 60,000 years, European climate underwent rapid shifts between cold-arid stadial periods and warm-humid interstadial periods. These oscillations were first identified in Greenland ice [1] but can also be found in Eurasian terrestrial [2,3,4,5,6] and in marine [7,8] sedimentary records (Figure 1). The maars in the Eifel mountains, Rhineland-Palatinate, Germany are a unique archive representative for central European climate of the past 500,000 years [9] (Figure 1). Organic carbon records from Pleistocene Auel infilled maar that erupted about 60,000 years ago show shifts that reflect changes in paleobioproductivity in the lake, which is a function of temperature and thus climate fluctuations [3]. The analysis of pollen and spores of coprophilous fungi (SCF) indicates that vegetation patterns and the herbivorous megafauna biomass also followed these climate shifts during the past 60,000 years [2] (Figure 2): During the early Marine Isotope Stage (MIS) 3 (60,000–49,000 yr b2k), mixed forests dominated by Picea and Carpinus were present in the Eifel. With climatic deterioration during Mid and Late MIS3 towards the Last Glacial Maximum (23,000–19,000 yr b2k), a cold temperate mixed forest developed (48,086 to 35,553 yr b2k), and subsequently a forest-steppe (35,553–28,825 yr b2k) and forest-tundra (28,825–24,209 yr b2k). During MIS2, a polar desert with very low Poaceae pollen values, single finds of Pinus and Betula, and moss remains dominated, followed by a succession of boreal forest and warm temperate forest during the Pleniglacial and the Holocene (24,209 yr b2k–present).
The widespread boreal forests that covered the Eifel landscape during the early MIS3 [4] developed into an open landscape of forest-grass-steppe-type between Greenland Stadial (GS) 11 and Greenland Interstadial (GI) 8, which coincides with highest abundance of megaherbivores [2,11]. In this article, we studied pollen and SCF from the Auel infilled maar to gain a more detailed picture of the time from 42,000 to 36,000 yr b2k. The vegetation turnover caused intensified immigration of large herbivores belonging to the Mammuthus-Coelodonta faunal complex [12]. Animals such as woolly mammoth and woolly rhinoceros were continuously present in Central Europe from GS11 to GI8, with maximum expansion during GI8 [11], when steppe-environments expanded throughout Europe [2,13]. The megafauna biomass, however, declined during forested phases [12]. Climate affected not only the number of animals [14] but also the species changed according to their preferred habitats [14,15].
Our record covers the above-mentioned changes in climate, environment, and megaherbivore presence in the Eifel. The interval from 38,500 to 37,800 yr b2k was analyzed in a 1-cm-resolution, allowing for an in-depth-discussion of changes in vegetation and herbivorous fauna at the onset of GI8. A synthesis of our results with archeological data allows for a reconstruction of the landscape and environment in the Eifel at the time Neanderthals demised and Aurignacian people expanded throughout Europe [16]. The oldest finds of Neanderthal remains from the Eifel is of MIS6 age [17], the youngest are 70,000 to 50,000 years old [18]. Attributes assigned to the Aurignacian in the Eifel come from caves near Gerolstein and the Kartstein cave [19]. The aim of our study is to shed some light not only on the attraction the region had on animals and humans but also on the challenges for humans living in the Eifel from GS11 to GI8.

2. Materials and Methods
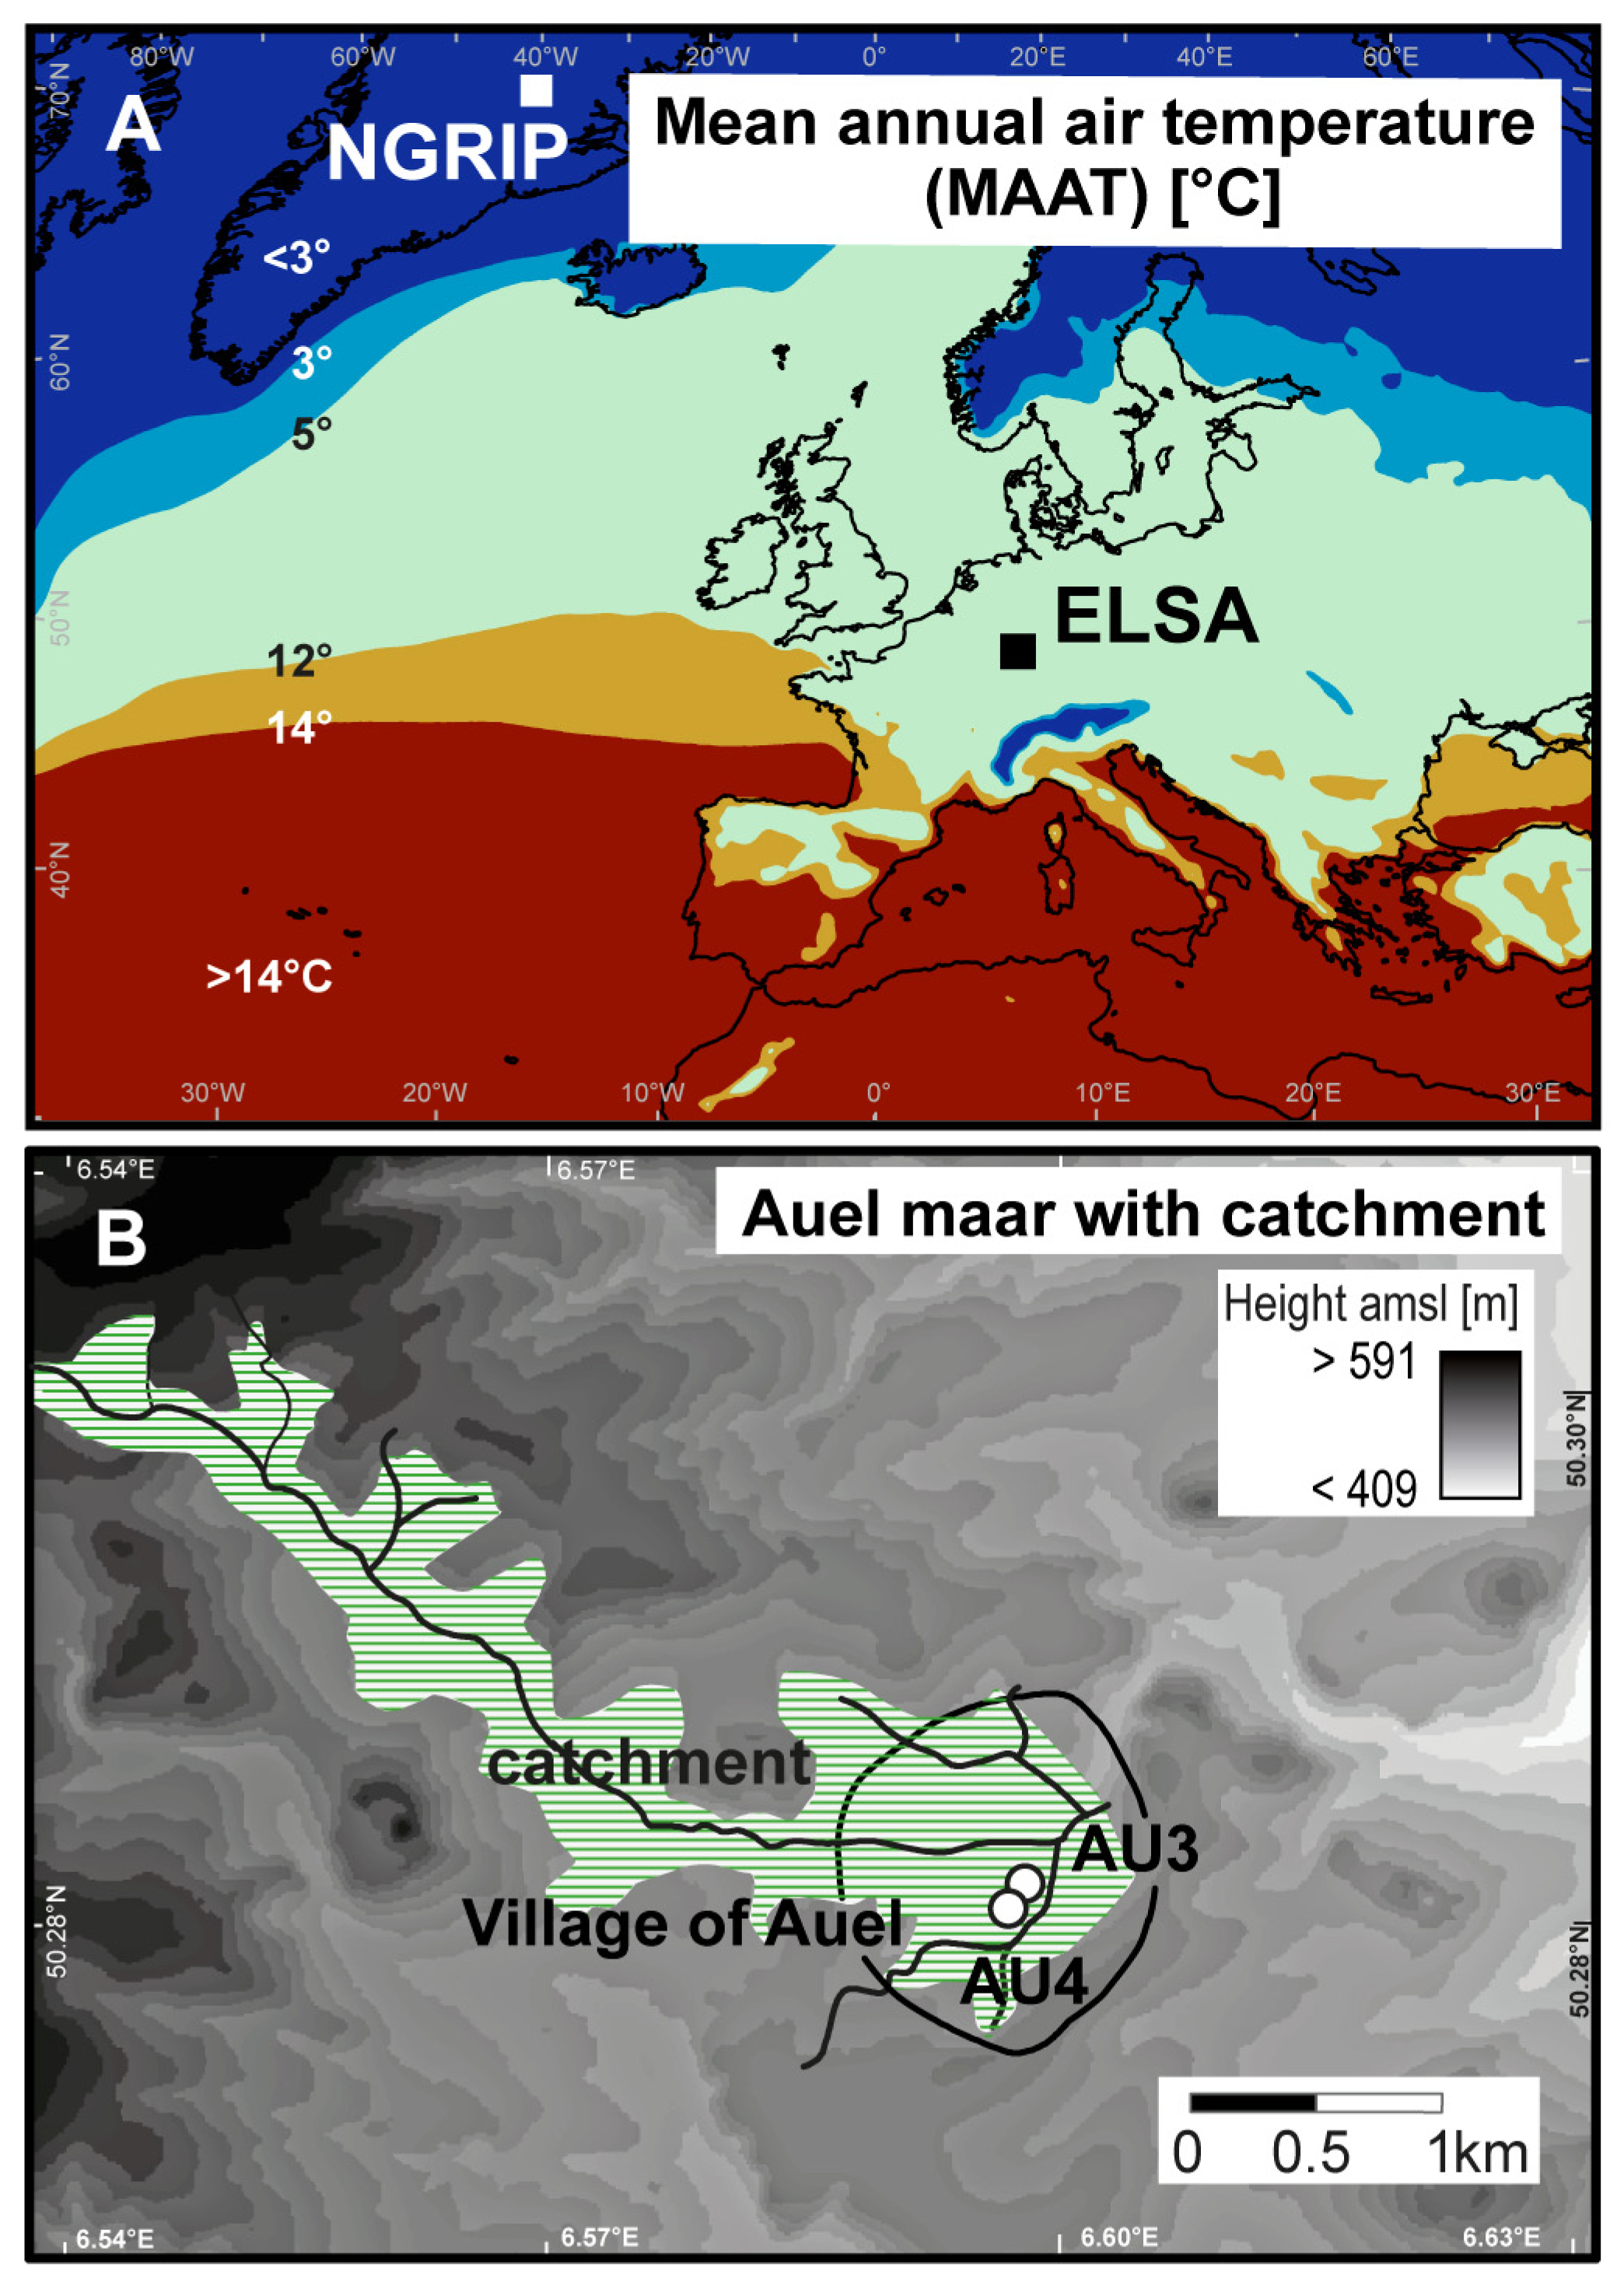
2.1. Coring Site

This study used pollen and spores from a composite drill core from Pleistocene Auel infilled maar that lies in the Eifel area, Germany. The maar phreatomagmatic eruption occurred about 59,100 yr b2k [20]. Its sediments build an exceptional archive for climate proxies since its eruption [3]. The maar has a diameter of 1325 m. A creek named Tieferbach crosses its center and contributed to the high average sedimentation rates of 2 mm/yr. The Tieferbach’s catchment has a length of about 7 km and an area of 12,187 km2. The fluvial input favors proxies from the surrounding area to enter the lake and subsequently the sediment at the depocenter of the lake. Today, the area is used as agricultural land. We used sediment cores AU3 (WGS84 coordinates 50.282771518, 6.595057816) and AU4 (WGS84 coordinates 50.28211298, 6.594933478) for analysis, with respective lengths of 102 m and 104.5 m. The cores were recovered with a Seilkern coring device and an offset of 0.5 m to reduce gaps from drilling disturbances or core losses.

2.2. Organic Carbon, µ-XRF

Cores AU3 and AU4 (Figure 3) were recently studied with respect to organic carbon concentration (Corg) [3]. Methodology followed the ISRS670 in situ reflectance spectroscopy by Rein and Sirocko [20] that detects chlorophyll α derivates (chlorins) mainly from phytoplankton (diatoms, chrysophytes) in the lake. The results from this analysis give the organic carbon concentration based on chlorins, thus named Corg(chlorins). The Corg(chlorins) pattern from Auel infilled maar was previously shown to be a good proxy for paleobioproductivity in maar lakes; it could be directly correlated to temperature changes recorded from Greenland ice cores [1,3].
Corg(chlorins) records from cores AU3 and AU4 have the same pattern (Figure 4) and were correlated with a Dynamic Time Warp performed on the organic carbon concentration that was measured in subannual resolution on both cores. The gaps in the AU4 record were then filled with the respective AU3 segments [3]. The resulting record was age tuned to the NGRIP ice core δ18O record (Figure 2) using a Bayesian age model [3]. The final stratigraphy is drawn on the AU4 age-depth model as part of the ELSA-20 stratigraphy [3].
Additionally, nondestructive µ-XRF analysis was done on the Auel sediment cores with an Avaatech XRF core scanner (Avaatech XRF Technology, Dodewaard, The Netherlands (http://www.avaatech.com, accessed on 5 July 2023)) at Max Planck Institute for Chemistry Mainz. Data are given in counts per second with a resolution of 0.5 mm. Silicon and calcium may both derive from primary producers such as diatoms or coccolithophorids as well as from terrestrial input such as quartz or carbonates. Both elements are therefore normalized by elements of lithogenic origin, aluminum and titanium. The ratio of Si/Al, in fact, shows the same pattern as the Corg(chlorins) curve. In order to gain a pure lithogenic signal, we calculated the ratio of (Si/Al)/Corg, which represents the dust portion of silicon data, i.e., excess-Si. Results from organic carbon analysis and µ-XRF were previously published [2,3] but are also included here, as they are crucial for the interpretation of our data.

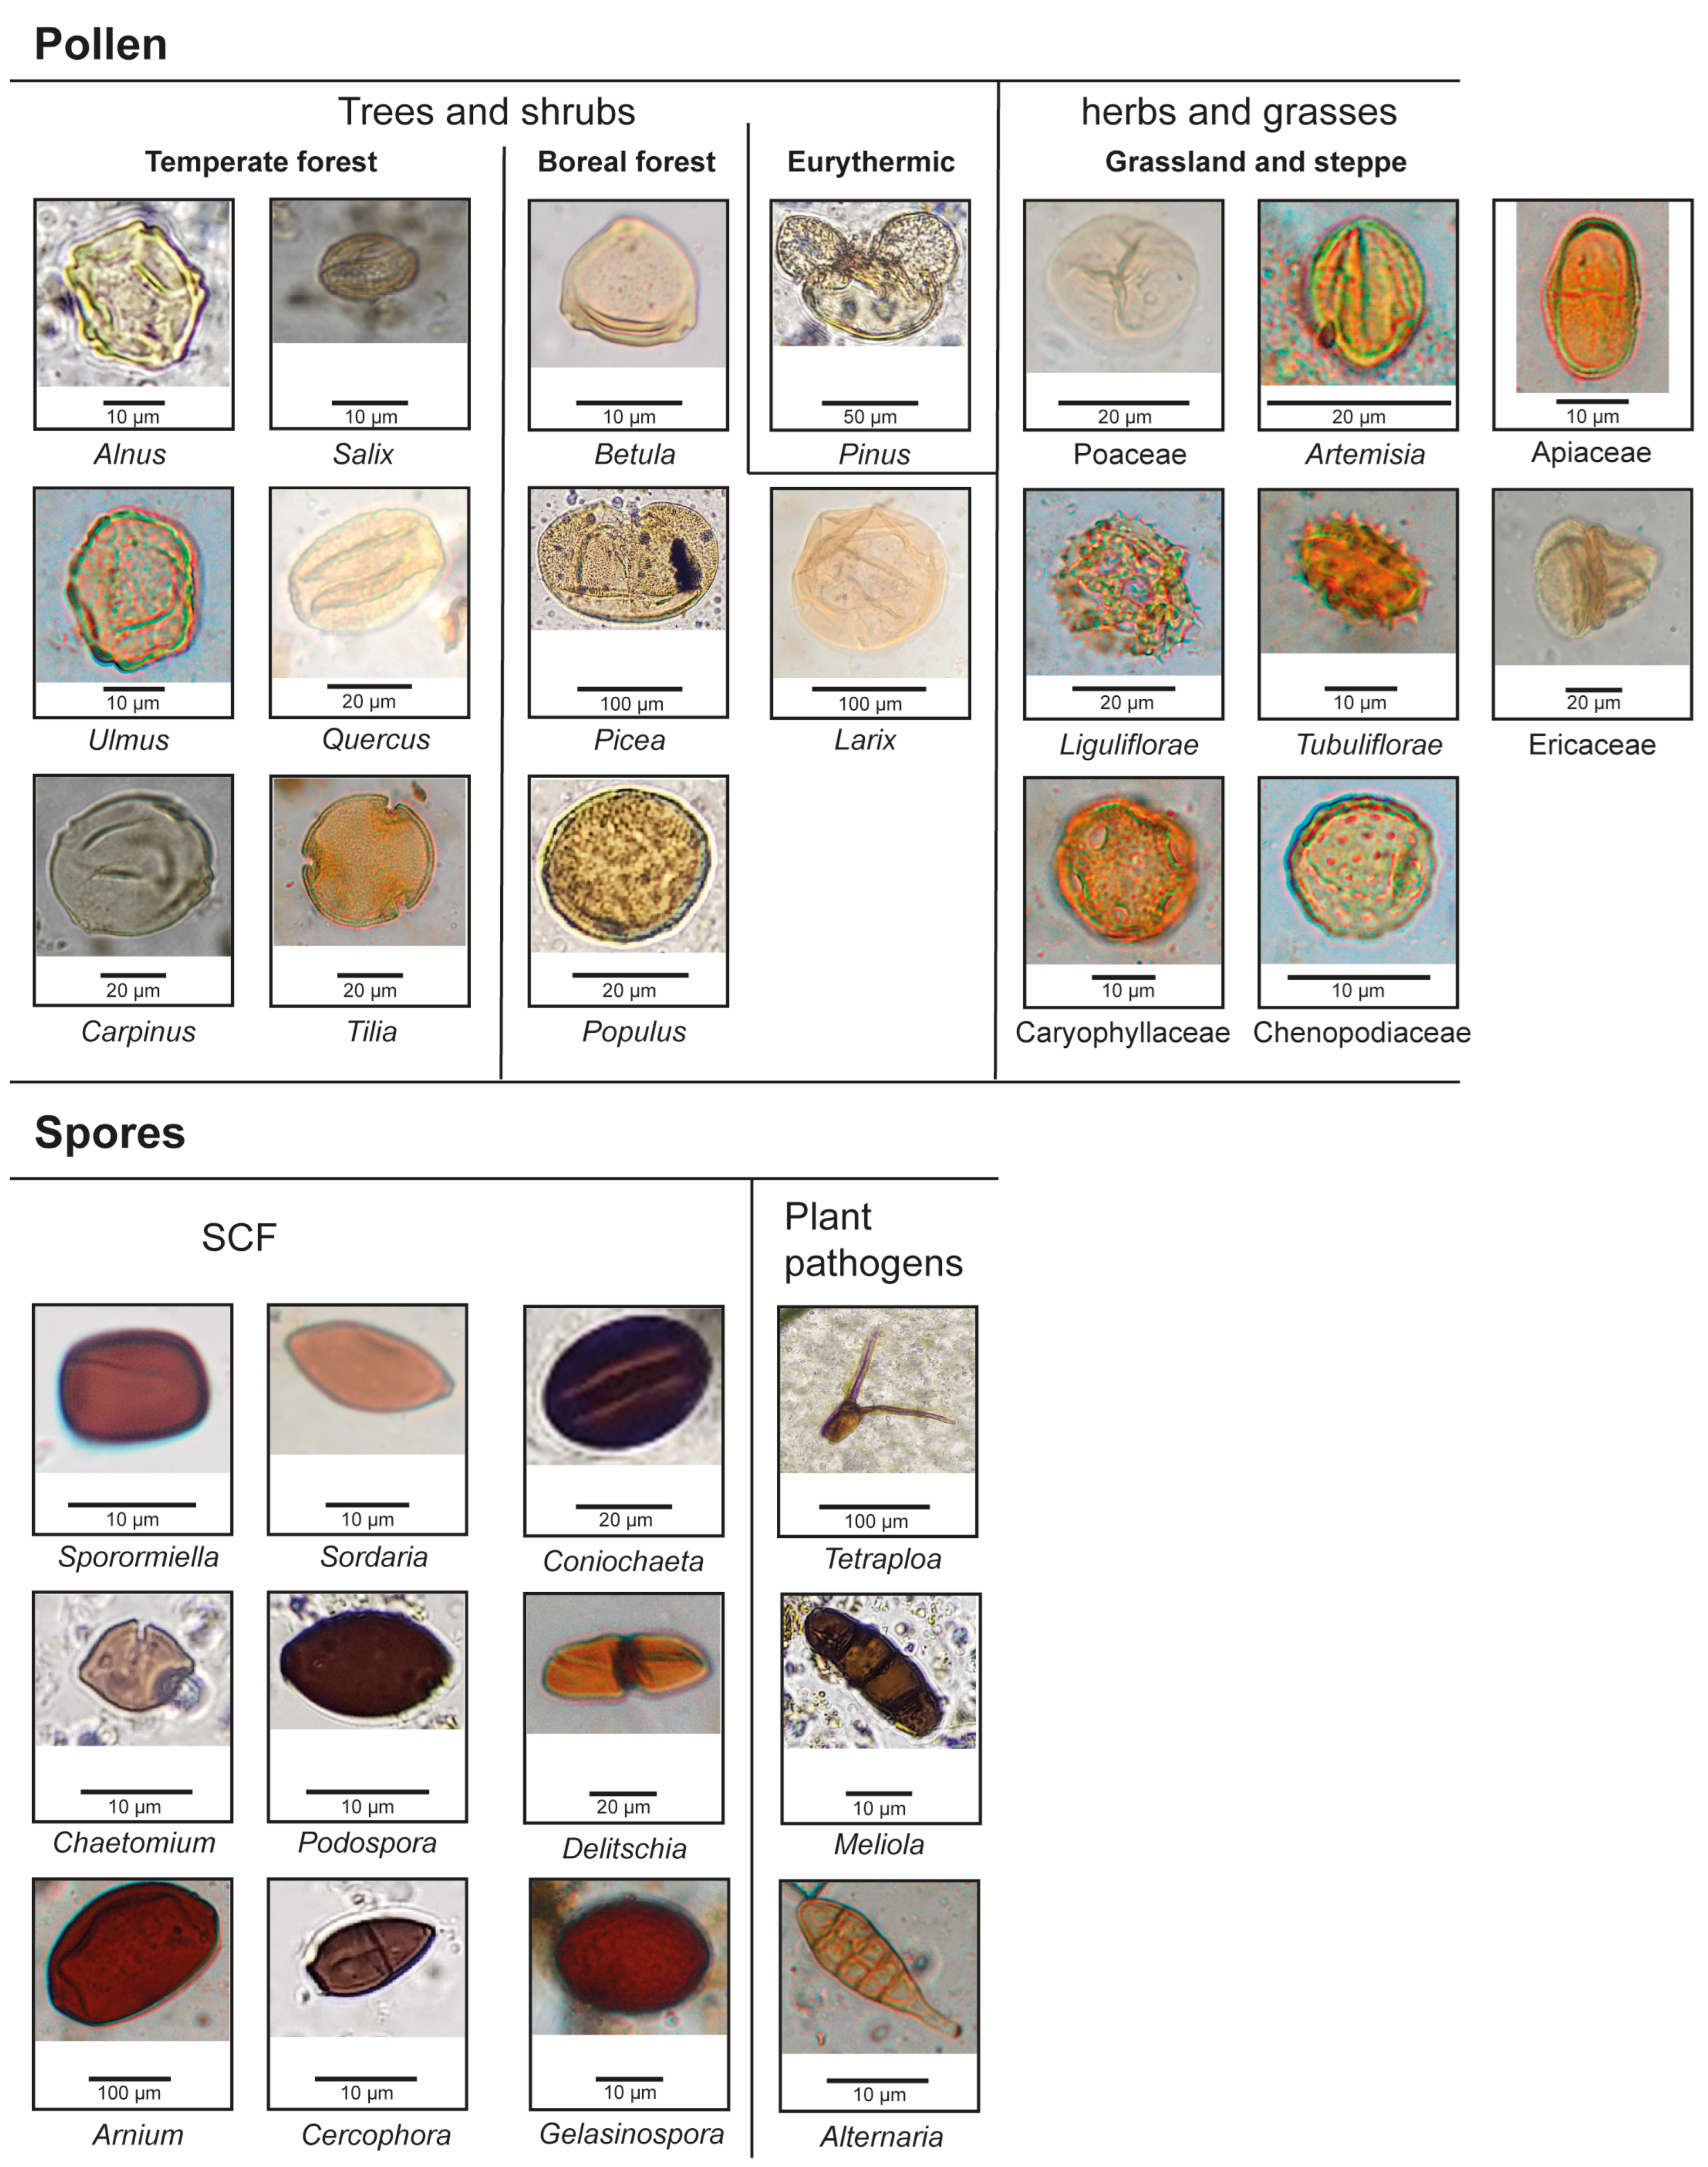
2.3. Pollen and Spore Sample Preparation

Pollen and spore sample preparation followed Berglund and Ralska-Jasiewiczowa [21] and Fægri and Iversen [22]. Samples were taken with a syringe of 1 ccm volume. Each sample spans a depth range of 1 cm. The sediment was treated with potassium hydroxide solution (KOH), hydrochloric acid (HCl) and hydrofluoric acid (HF). For acetolysis, acetic acid (C2H4O2) and a mixture (9:1) of acetic anhydride (C4H6O3) and sulfuric acid (H2SO4) was used. Centrifugation was done at 3000–3500 rpm for 5 min. The samples were sieved at 200 µm and filtered at 10 µm. Lycopodium-spore tablets were added for calibration of absolute pollen volumetric concentration [23]. The samples were mounted with liquid, anhydrous glycerol (C3H8O3). Pollen counting was done under an optical microscope at a maximum of magnification of 600×. Total pollen content (#/ccm) has been calculated using the known numbers of Lycopodium spores in added tablets. For all samples, at least 300 pollen grains or 100 Lycopodium spores were counted [24]. Results for both pollen and spores are given as percentage of the total terrestrial pollen sum.

3. Results

3.1. Age Model

We used the ELSA-20 [3] as the basic age model for this study. The model was further adjusted at one point, i.e., the Corg(chlorins)-peak prior to the onset of GI8. The respective equivalent structure in the Greenland ice δ18O allowed us to add another age-correlation-point at 38,440 yr b2k. Auel sediments are not varved, and thus annual layer counting was not possible. Further age-control points besides the Corg(chlorins)-structure are the tephra of the Dreiser Weiher eruption (DWT) at 40,370 b2k (i.e., a base depth of 71.16 m in core AU3, and 70.93 m in AU4) and the Campanian Ignimbrite (CI) at 39,900 b2k [25].

3.2. Pollen and Spores

From samples, 22 pollen taxa and 12 spore taxa could be identified (Figure 5). The pollen and spore spectra (Figure 6 and Figure 7) can be subdivided into seven local pollen assemblage zones (LPAZ). Respective subzones are defined by the presence or absence of species and significant changes in percentages of taxa. Since the pollen composition does not vary much between the LPAZ, zones are named after the taxa that show increased values during the respective zone (Figure 6 and Figure 7).
  • LPAZ 1 (41,800–41,520 yr b2k): Alnus-Salix-Ulmus-zone
This zone is characterized by low amounts of pollen and spores. Pollen of boreal wood taxa of Pinus, Picea, Betula as well as Poaceae dominate this section, accompanied by spores of coprophilous fungi, of which the majority make the taxa Sporormiella and Sordaria. Tree taxa typical for flood plains (Alnus, Salix, Ulmus) and Quercus are present at low percentages, as are forbs such as Artemisia.
  • LPAZ 2 (41,520–41,220 yr b2k): Carpinus-zone
Pollen and spore concentrations are higher during zone 2. Main taxa are Betula and Poaceae, that make ca. 80 % of the pollen spectrum. Carpinus pollen show a small but distinct maximum with up to 8%, whereas other temperate taxa (Alnus, Ulmus, Salix, Corylus, Tilia), with the exception of Quercus, are lacking. SCF Sporormiella and Sordaria decrease; most of the others disappear.
  • LPAZ 3 (41,220–40,420 yr b2k): Alnus-Ulmus-zone
Temperate tree taxa return, single pollen grains of Corylus and Tilia could be found in the lower part of this zone, whereas Juniperus was identified from samples at the transition to LPAZ 4. Most frequent taxa are Pinus, Picea, and Betula. SCF concentration slightly increases.
  • LPAZ 4 (40,420–39,600 yr b2k): Quercus-Salix-zone
  • Salix, Poaceae and total spores increase. During zone 4a, Salix and Quercus are representatives of temperate cold-deciduous trees, whereas main taxa are boreal species Betula and Pinus. Picea is not continuously present.
  • Single Tilia pollen were found at the transition from zone 4a to 4b, when Ulmus and Alnus return to the pollen spectrum. During zone 4b, all SCF increase to maximum values and are frequently present throughout the analyzed samples. Picea pollen concentration is low from 39,800 yr b2k on.
  • LPAZ 5 (39,600–38,860 yr b2k): open boreal forest
During zone 5, most deciduous tree taxa decrease or disappear, except Betula. Pinus, Picea, and Betula dominate the pollen spectrum. Other taxa are Poaceae and xerophytic forbs, especially Artemisia. All spore taxa of the spectrum are reduced; most disappear. SCF Sporormiella and Sordaria remain frequent, however in lower percentages.
  • LPAZ 6 (38,860–37,980 yr b2k): Alnus-Quercus-Ulmus-Salix-zone
  • With the onset of zone 6, Picea pollen percentages are reduced to values below 5%, while Alnus, Salix, Quercus, and Ulmus pollen reappear, followed by Carpinus about 38,450 yr b2k. Grasses and forbs make up to 50% of the total pollen sum until 38,220 yr b2k when forests of boreal and cold-deciduous taxa dominated by Betula pollen become established.
  • From 38,300–37,980 b2k, vegetation is dominated by Pinus, Betula, and Poaceae, with minor components of other boreal taxa (Larix, Populus). Broad-leaved temperate trees are Alnus, Quercus, Carpinus, and Salix.
  • LPAZ 7 (37,960–36,400 yr b2k): Open mixed forest with increased Betula
  • During earliest zone 7, total pollen amount increases. The main taxa are Betula, Pinus, and Poaceae. Steppe herbs and forbs are reduced. Except for Salix, tree taxa of the flood plains (Ulmus, Alnus) are reduced to minimum values.
  • At about 37,400 yr b2k, Betula pollen amounts decrease by 40%. Poaceae are the dominant taxon, whereas trees such as Salix and Carpinus show small maxima before they newly decrease at 37,000 yr b2k.
  • Similar to zone 7a, Betula become the dominant species with about 50% of the total pollen at about 37,000 yr b2k.

4. Discussion of Factors Influencing the Vegetation-Succession in the Eifel from 41,800 to 36,400 yr b2k

4.1. The Effect of the Laschamp Magnetic Excursion, Volcanic Eruptions, and Heinrich Stadial 4 on the Vegetation Succession

Besides the climate fluctuations visible in the NGRIP ice core record [1] and our Corg(chlorins) data, multiple other factors may have triggered environmental response between GS11 and GI8, e.g., the Laschamp geomagnetic excursion (weakening and reversal of Earth’s magnetic field), volcanic eruptions, or the Heinrich event 4.
The lowermost part of our study covers the Laschamp event from 42,000 to 38,200 b2k, with its main phase being at about 41,300 to 40,200 b2k [26]. The weakening of the Earth’s magnetic field entailed a range of atmospheric and climatic consequences on a global scale [27]. The record presented here covers the 1000 years of the Laschamp main event, including the late GS11, GI10, and GS10.
The amount of steppe forbs and megaherbivores was low during late GS11 and GI10, i.e., when the magnetic field strength was significantly weakened, which caused a severe depletion of global ozone levels in the atmosphere [27], resulting in an increase of UV-B radiation [28,29].
Excess-Si and the decline of Alnus and Ulmus pollen (LPAZ 2) point to dryer conditions and higher eolian input into the lake during the initial main event of the Laschamp excursion at 41,300 yr b2k contemporaneous to GI10. Other temperate tree taxa were not affected (Figure 7), so we can suggest that temperature, on the other side, must have stayed higher than 5 °C MAAT. Albeit the coincidence of the Laschamp main event with changing humidity, we cannot conclude from our record whether the magnetic excursion indeed caused grass-steppe to expand besides the tree-dominated vegetation (Figure 8). Tilia pollen, a taxon with single finds only during interstadials, is only found in the terminating GI10, when the Earth’s magnetic field was fully reversed [26] and climate in Europe became more humid again (Figure 9). Another period of increased eolian input into the lake is at the end of the Laschamp main phase, from 40,400 to 40,000 yr b2k. This coincides with a major retreat of trees after the eruption of the Dreiser Weiher volcano (see below). Based on our pollen data and excess-Si [2] in combination with a peak in carbonate roundness [30], we suggest that the shift from forest to steppe-environment around 40,300 b2k was not mainly driven by climate change induced by the Laschamp magnetic excursion.
During the timespan investigated in this study, the Eifel experienced one volcanic eruption, the formation of the Dreiser Weiher maar, around 40,370 yr b2k (GS10).
The Dreiser Weiher eruption at only 15 km distance from Auel deposited a volcanic tephra layer visible in the sediment cores AU3 and AU4. Subsequent to this event, a decline in tree pollen by about 30% is clearly visible in our pollen spectrum (Figure 8 and Figure 9). The onset of LPAZ 4 coincides with this event (Table 1), which must have destroyed at least parts of the regional tree populations. Subsequent to the Dreiser Weiher eruption, the forest-dominated landscape shifted toward expanding steppe environments, while megafauna indicators remained at low percentages. Steppe vegetation after the DWT was mostly made of grasses (Figure 7, LPAZ 4). From our pollen and SCF data, we can conclude that SCF correlate positively with both the number of forbs and Poaceae. Megaherbivores may thus have been partly distracted from the area after the Dreiser Weiher volcano erupted, with their return probably being prevented by the lowered availability of nutritious forbs and twigs from trees, and the reforestation during early GI9, ca. 200 years later. The elevated minerogenic input into the lake just before the onset of GI9 is likely a response to the loss in vegetation cover after the eruption.
Another dramatic event occurred after GI9 at 39,900 b2k, when a massive eruption in the Phlegrean Fields in Italy took place, named Campanian Ignimbrite after its source region [31]. Its ashes were deposited all across southern and eastern Europe [32], and are now proven to also be deposited in the Auel sediments [25]. Our pollen record gives no evidence that the CI eruption had a long-lasting impact on the Eifel vegetation; however, short-term changes that lasted only a few decades can be seen in the pollen spectrum, when tree taxa intolerant to drought and strong winds decline at around 39,800 yr b2k. A detailed discussion of the pollen succession at the time of the CI can be found in Schenk et al. [25].
With the increase of steppe forbs, herbivorous megafauna biomass indicators increased during early GS9 (LPAZ 4b, Figure 6 and Figure 7). Bones from gravel pits along the Upper Rhine Graben suggest that large herbivores such as steppe bison, mammoth, giant moose, elk, fallow deer, and water buffalo roamed western central Europe during GS9 [33]. Our pollen record implies a three-phased GS9 (LPAZ 4b, 5, and 6a). During the transition from GI9 to GS9, stadial vegetation established, with steppe taxa making up almost 50% of the terrestrial pollen sum. Interestingly, Alnus pollen amounts are increased during early GS9 (LPAZ 4b, Figure 7), probably in response to a short phase of more humid conditions as indicated by low values of excess-Si [2] and carbonate roundness [30] (Figure 9). Individuals of temperate, soil water tolerant taxa such as Alnus and Salix may have been restricted to the lower areas of the catchment. At 39,700 b2k, temperate taxa disappeared and mean annual air temperature dropped to below about 5 °C. The vegetation turned into an open boreal forest (LPAZ 5), until temperate taxa reappeared at around 38,860 yr b2k (onset LPAZ 6). We interpret this phase to represent the timing of H4 delimited from the GS9 vegetation in the Eifel. This is in accordance with Greenland ice core δ17O data [34] that imply a three-phased GS9, albeit with a temporal offset of 350 years to our age scale. Calculated pollen amounts (#/ccm) of Picea were reduced during GS9 in two steps, first at 39,800 yr b2k (i.e., roughly around the time of the lowest SST in the North Atlantic [7]) and second with the onset of H4 as interpreted from our data. From the pollen spectrum, percentages show a reduction only after H4. The more probable timing, in our opinion, is the earlier one, since percentages during H4 may appear increased due to the absence of all temperate deciduous taxa. Possible explanations for a decline in Picea are dryness during the growth season, late summer warming, strong winds, or waterlogged conditions.
We suggest that the early GS9-reduction of spruce was mainly due to the almost 1000-years of drier summers (rise in xerophytic steppe taxa), possibly in combination with the onset of strong easterly winds during H4 (carbonate roundness [30]). Frequent flood events may have contributed as an additional threat (Figure 9). Apart from flood events that likely were the results of snow melt in spring or early summer, the climate in central Europe became mainly cold and dry during H4 [35]. The second- and final- decline of Picea pollen concentration coincides with a lack of flood layers. Climate may have been drier due to the cold easterly winds, building an environment not suitable for spruce.
Very few scattered Quercus and Salix may have grown in the lowlands around the creek crossing Auel maar during LPAZ 5, accompanied by forbs such as Artemisia and xerophytic Ericaceae. Megafauna biomass proxies declined at around 39,340 yr b2k by about 10%, but never disappeared, and increased again at 38,550 b2k, when climate returned to drier conditions. The pattern of SCF may reflect a change in faunal assemblage, affected by the severe cold together with floral change. Fossil evidence implies an immigration of arctic herbivore taxa such as reindeer into central Europe during H4 [15], whereas animals typical for steppe habitats such as mammoth, steppe bison, and horse emigrated, following more suitable conditions.

4.2. The Effect of Initial Warming during Early GI8 on the Terrestrial Ecosystem

Total pollen and spore concentration are low during stadials respective to interstadial periods (Figure 8). Although no major compositional change is observable at the onsets of GI10-8 (Figure 7, Table 1), a shift from open forests with abundant steppe-like vegetation toward higher amounts of boreal tree species is evident during warmer phases (Figure 8). As Flückiger et al. Ref. [36] stated in their model, that GS-GI transitions in Europe had strongest warmings in spring, which in turn had no big effect on plant community compositions.
Figure 9. Megafauna proxies (total SCF), vegetation, and human presence from 44,000 to 36,400 yr b2k. Humidity is indicated by excess-Si [2], flood layers from nearby Dehner Maar [10], and dust particles [30]. SST shows the sea surface water temperature in the North Atlantic [7]. Tephra layers (red, CI = Campanian Ignimbrite, DWT = Dreiser Weiher Tephra) from Auel sediments, the Laschamp magnetic excursion (VADM = virtual axial dipole moment, yellow, [26]), and the Heinrich Event 4 (H4, blue) are shown as they possibly affected vegetation and megafauna. Pollen and spore data older than 41,800 yr b2k are taken from [2]. Pollen and spore curves were smoothed with a 3 pt running mean. Stars indicate the ages of the youngest found Neanderthal human bones [37,38]; triangles indicate the oldest Aurignacian human bones [37,38,39], both dated via bone collagen.
Quaternary 06 00044 g009
After H4, temperature estimations from pollen again exceed 5 °C MAAT, whereas runoff remained stable, however, with reduced flood events. From 38,550 to 38,350 yr b2k, climate became drier, followed by an increase in steppe forbs. SCF increase contemporaneously to the reduced availability of water—maybe the lake became an even more attractive source of fresh water during this time. Subsequent GI8-warming did not occur uniformly. The Corg(chlorins) peak at 38,440 yr b2k coincides with low runoff and may represent the initial GI8-warming phase that was interrupted by another 200-year-long cold phase with reduced tree pollen (Figure 8 and Figure 9). Vegetation reacted to the roughly 100-year-long warm phase represented by the initial Corg(chlorins) peak, resulting in the short-term increase of tree pollen and a contemporaneous reduction of steppe flora and megafauna indicators. The following cold period shows, however, the highest values of megafauna indicators during the investigated time span.
With the climate-induced reforestation during the first 300 years of GI8-warming (38,220–37,920 yr b2k), steppe taxa and megafauna indicators decreased continuously to a relatively constant level that lasted throughout the interstadial. Excess-Si and the reduction of tree taxa typical for flood plains (Alnus, Ulmus, Salix) indicate that precipitation was reduced during GI8, especially during LPAZ 7b, i.e., from 37,400 to 37,000 yr b2k (Table 1). Vegetation was dominated by boreal tree taxa such as Betula and Pinus (70%), and grasses, with few steppe forbs (Figure 7). Contrary to the preceding GI10 and 9, spruce did not recover during GI8, but stayed at low quantities, maybe due to drier climate.

4.3. The Role of Plant Succession and Megaherbivores for the Shift in Human Species and Culture

During the time investigated, a replacement of Neanderthal population by Aurignacian (Anatomically Modern Humans, AMH) took place in Europe [15,40,41,42,43]. This so called Mid to Upper Paleolithic Transition (MUPT) was a process that took place roughly between 45 and 35 ka cal BP [44]. The dating of collagen from human bones recently resulted in ages of 40,660 to 41,950 a cal BP years for the youngest known Neanderthal bones from Grotte du Renne, Arcy-sur-Cure, Bourgogne, France [37] and 36,000 14C BP in Spy cave, Belgium [38], only 120 km from the Auel site. The oldest individual belonging to the Aurignacian culture yielded an age of 42,500 yr b2k in the Geißenklösterle cave, Swabian Jura, southern Germany [39]; Aurignacian remains from Belgium are at least 33,000 14C BP years old, possibly older [38], which implies that AMH immigrated to southern central Europe at least during GS11, spreading across Europe during the following millennia.
The Aurignacian people arrived in central Europe around 40,000 b2k [37,38,39] following the megafauna migrations to suitable habitats, as suggested based on our SCF data (Figure 9). Around the same time, Neanderthals disappeared from western central Europe [37], which coincides exactly with the onset of a 2000-years-lasting (40,600–38,600 b2k) phase of cold, easterly winds near Auel (Figure 9, [30]). Humans living in the Eifel region and all over central Europe had to face severe cold and dry, recurring climatic fluctuations, which may have caused contractions of species diversity [15]; during cold phases, highly fluctuating human food resources such as reindeer immigrated from Arctic habitats, whereas others such as deer became less frequent or disappeared [15]. Fossils from Spy cave, Belgium, indicate that reindeer were present during most of the year during the MUPT and were frequently hunted by AMH [41].
The reasons for the demise of Neanderthals at around 40,000 yr b2k are still under debate. Among others, factors such as abrupt climate deterioration [42] may have caused a population decline, although NH are assumed to have been the most cold-adapted of all hominins [45] (see [46] for further discussion). During cold phases, fire was only infrequently used, which may have been due to the fact that firewood became less available [47]. Uncooked food, however, would have caused a lower nutritional and energetic value. This combined with the NH having a higher basal metabolic rate than AMH [45,46] while both used overlapping food resources favored the modern humans to outcompete NH [48]. Extreme events such as volcanic eruptions [32,49,50] and elevated radiation level during the Laschamp geomagnetic event [51], may have increased the vulnerability of humans to other environmental factors. Lowered availability of prey resulted in vitamin deficiency [52] and may thus have contributed to the disappearance of NH from central Europe as well as the relatively small size of Neanderthal population in comparison to the larger and expanding size of AMH populations [15] together with interbreeding with AMH, inbreeding, and competitive exclusion [48,53,54]. All these factors may have led to the demise of NH and it seems most probable that all of them have contributed in some way.
Whatever the causes, even prior to the replacement by AMH, Neanderthal population already declined in the course of several centuries [15] contemporaneously to a shift in hunted species [55], especially after GS10 (ca. 40,200 yr b2k). We see that bones from herbivores [33] typical for the Mammuthus-Coelodonta-steppe habitat are not deposited after GI9 (39,900 yr b2k) until the late GI8 (37,000 yr b2k). The change of faunal assemblage with many prey taxa ceasing must have been a challenge to Neanderthals, whose diet seems to have consisted mainly of meat from megaherbivores, especially calves of mammoth, bison, and rhinoceros [56]. AMH, on the other hand, preferred reindeer [38] and complemented their diet also with plants and aquatic resources [57]. Recently, however, results from isotope analysis put in question if NH in fact solely depended on meat as the single protein source [58].
As a result, Neanderthals may not have been capable to cope with the competition with expanding AMH during a time of lower ecosystem productivity during stadial conditions and were thus forced to migrate to more suitable habitats [59].

5. Conclusions

From 42,000 to 36,400 yr b2k, Eifel plant communities were controlled by climate fluctuations and nearby volcanic eruptions. Vegetation consisted mainly of boreal tree taxa, with up to 20% of deciduous temperate species. The amount of tree pollen follows the curve of bio-productivity in the lake indicated by organic carbon. The open forest allowed steppe plants to develop as well. The presence of herbivorous megafauna was controlled by vegetation, i.e., the availability of steppe forbs and grasses. Megafauna was continuously present in this environment, with highest biomass quantities during GS9, around when Neanderthal humans demised and the first Anatomically Modern Humans migrated to central Europe. We suggest that the latter followed their prey to suitable steppe habitats and arrived in the Eifel during the main phase of megafauna presence (from 39,700 yr b2k on), while faunal shifts and severe cold and dry periods caused the demise of Neanderthals.

Author Contributions

Conceptualization, S.B. and F.S.; methodology, S.B.; validation, F.S.; investigation, S.B.; resources, F.S.; writing—original draft preparation, S.B.; writing—review and editing, F.S.; visualization, S.B.; supervision, F.S. All authors have read and agreed to the published version of the manuscript.

Funding

This research was funded by the Johannes Gutenberg University Mainz and the Max Planck Institute for Chemistry Mainz.

Data Availability Statement

All data will be downloadable at the website of the ELSA-project (https://elsa-project.de) (accessed on 31 July 2023).

Acknowledgments

We thank Frank Dreher for sample preparation, Petra Sigl for implementation of the figures, and Johannes Albert for his contribution to the discussion. Furthermore, we would like to thank the three anonymous reviewers for their thoughtful and valuable comments that helped improve the manuscript.

Conflicts of Interest

The authors declare no conflict of interest.

References

  1. Rasmussen, S.O.; Bigler, M.; Blockley, S.P.; Blunier, T.; Buchardt, S.L.; Clausen, H.B.; Cvijanovic, I.; Dahl-Jensen, D.; Johnsen, S.J.; Fischer, H.; et al. A stratigraphic framework for abrupt climatic changes during the Last Glacial period based on three synchronized Greenland ice-core records: Refining and extending the INTIMATE event stratigraphy. Quat. Sci. Rev. 2014, 106, 14–28. [Google Scholar] [CrossRef] [Green Version]
  2. Sirocko, F.; Albert, J.; Britzius, S.; Dreher, F.; Martínez-García, A.; Dosseto, A.; Burger, J.; Terberger, T.; Haug, G. Thresholds for the presence of Glacial megafauna in central Europe during the last 60,000 years. Sci. Rep. 2022, 12, 20055. [Google Scholar] [CrossRef] [PubMed]
  3. Sirocko, F.; Martínez-García, A.; Mudelsee, M.; Albert, J.; Britzius, S.; Christl, M.; Diehl, D.; Diensberg, B.; Friedrich, R.; Fuhrmann, F.; et al. Muted multidecadal climate variability in central Europe during cold stadial periods. Nat. Geosci. 2021, 14, 651–658. [Google Scholar] [CrossRef]
  4. Sirocko, F.; Knapp, H.; Dreher, F.; Förster, M.W.; Albert, J.; Brunck, H.; Veres, D.; Dietrich, S.; Zech, M.; Hambach, U.; et al. The ELSA-Vegetation-Stack: Reconstruction of Landscape Evolution Zones (LEZ) from laminated Eifel maar sediments of the last 60,000 years. Glob. Planet. Chang. 2016, 142, 108–135. [Google Scholar] [CrossRef]
  5. Fleitmann, D.; Cheng, H.; Badertscher, S.; Edwards, R.L.; Mudelsee, M.; Göktürk, O.M.; Fankhauser, A.; Pickering, R.; Raible, C.C.; Matter, A.; et al. Timing and climatic impact of Greenland Interstadials recorded in stalagmites from Northern Turkey. Geophys. Res. Lett. 2009, 36, L19707. [Google Scholar] [CrossRef] [Green Version]
  6. Wang, Y.J.; Cheng, H.; Edwards, R.L.; An, Z.S.; Wu, J.Y.; Shen, C.-C.; Dorale, J.A. A high-resolution absolute-dated Late Pleistocene monsoon record from Hulu Cave, China. Science 2001, 294, 2345–2348. [Google Scholar] [CrossRef] [Green Version]
  7. Martrat, B.; Grimalt, J.O.; Shackleton, N.J.; de Abreu, L.; Hutterli, M.A.; Stocker, T.F. Four climate cycles of recurring deep and surface water destabilizations on the Iberian margin. Science 2007, 317, 502–507. [Google Scholar] [CrossRef] [PubMed] [Green Version]
  8. Shackleton, N.J.; Hall, M.A.; Vincent, E. Phase relationships between millennial-scale events 64,000–24,000 years ago. Paleooceanography 2000, 15, 565–569. [Google Scholar] [CrossRef]
  9. Förster, M.W.; Sirocko, F. The ELSA tephra stack: Volcanic activity in the Eifel during the last 500,000 years. Glob. Planet. Chang. 2016, 142, 100–107. [Google Scholar] [CrossRef]
  10. Albert, J.; Sirocko, F. Evidence for an extreme cooling event prior to the Laschamp geomagnetic excursion in Eifel maar sediments. Quaternary 2023, 6, 14. [Google Scholar] [CrossRef]
  11. Markova, A.K.; Puzachenko, A.Y.; van Kolfschoten, T.; van der Plicht, J.; Ponomarev, D.V. New data on changes in the European distribution of the mammoth and the woolly rhinoceros during the second half of the Late Pleistocene and the Early Holocene. Quat. Int. 2013, 292, 4–14. [Google Scholar] [CrossRef]
  12. Kahlke, R.-D. The origin of Eurasian mammoth faunas (MammuthusCoelodonta faunal complex). Quat. Sci. Rev. 2014, 96, 32–49. [Google Scholar] [CrossRef]
  13. Fletcher, W.J.; Sánchez Goñi, M.F.; Allen, J.R.M.; Cheddadi, R.; Combourieu-Nebout, N.; Huntley, B.; Lawson, I.; Londeix, L.; Magri, D.; Margari, V.; et al. Millennial-scale variability during the Last Glacial in vegetation records from Europe. Quat. Sci. Rev. 2010, 29, 2839–2864. [Google Scholar] [CrossRef]
  14. Lorenzen, E.D.; Nogués-Bravo, D.; Orlando, L.; Weinstock, J.; Binladen, J.; Marske, K.A.; Ugan, A.; Borregaard, M.K.; Gilbert, M.T.P.; Nielsen, R.; et al. Species-specific responses of Late Quaternary megafauna to climate and humans. Nature 2011, 479, 359–364. [Google Scholar] [CrossRef] [Green Version]
  15. Morin, E. Evidence for declines in human population densities during the Early Upper Paleolithic in Western Europe. Proc. Natl. Acad. Sci. USA 2008, 105, 48–53. [Google Scholar] [CrossRef]
  16. Jöris, O.; Street, M. At the End of the 14C-Scale: Scenarios at the Transition from the Middle to the Upper Palaeolithic. J. Hum. Evol. 2008, 55, 782–802. [Google Scholar] [CrossRef] [PubMed]
  17. Von Berg, A.; Condemi, S.; Frechen, M. Die Schädelkalotte des Neanderthalers von Ochtendung/Osteifel—Archäologie, Paläoanthropologie und Geologie. Eiszeitalt. Ggw. 2000, 50, 56–68. [Google Scholar] [CrossRef]
  18. Baales, M. Kartstein bei Mechernich/Eifel. Ein Naturkundlich-Archäologischer Rundgang; Forschungsbereich Altsteinzeit des RGZM Mainz; Rheinland-Verlag: Mechernich, Germany, 2001. [Google Scholar]
  19. Hahn, J. Aurignacien. Das Ältere Jungpaläolithikum in Mittel- und Osteuropa; Fundamenta A 9. Köln; Böhlau-Verlag: Mechernich, Germany, 1977. [Google Scholar]
  20. Rein, B.; Sirocko, F. In-situ reflectance spectroscopy—Analysing Techniques for high-resolution pigment logging in sediment cores. Int. J. Earth Sci. 2002, 91, 950–954. [Google Scholar] [CrossRef]
  21. Berglund, B.E.; Ralska-Jasiewiczowa, M. Pollen analysis and pollen diagrams. In Handbook of Holocene Palaeoecology and Palaeohydrology; Berglund, B.E., Ed.; John Wiley and Sons: Chichester, UK, 1986; pp. 455–484. [Google Scholar]
  22. Fægri, K.; Iversen, J. Textbook of Pollen Analysis; John Wiley and Sons: Chichester, UK, 1989. [Google Scholar]
  23. Stockmarr, J. Tablets with spores used in absolute pollen analysis. Pollen Spores 1971, 13, 615–621. [Google Scholar]
  24. Etienne, D.; Jouffroy-Bapicot, I. Optimal counting limit for fungal spore abundance estimation using Sporormiella as a case study. Veg. Hist. Archaeobot. 2014, 23, 743–749. [Google Scholar] [CrossRef]
  25. Schenk, F.; Hambach, U.; Britzius, S.; Sirocko, F. First evidence of Campanian Ignimbrite ash airfall in central Europe. Quaternary 2023. in preparation. [Google Scholar]
  26. Laj, C.; Kissel, C.; Beer, J. High resolution global paleointensity stack since 75 kyr (GLOPIS-75) calibrated to absolute values. In Timescales of the Geomagnetic Field; Channell, J.E.T., Kent, D.V., Lowrie, W., Meert, J.G., Eds.; American Geophysical Union: Washington, DC, USA, 2004; pp. 255–265. [Google Scholar] [CrossRef]
  27. Cooper, A.; Turney, C.; Hughen, K.A.; Brook, B.W.; McDonald, H.G.; Bradshaw, C.J.A. Abrupt warming events drove Late Pleistocene holarctic megafaunal turnover. Science 2015, 349, 602–606. [Google Scholar] [CrossRef] [PubMed]
  28. Vogt, J.; Zieger, B.; Glassmeier, K.-H.; Stadelmann, A.; Kallenrode, M.-B.; Sinnhuber, M.; Winkler, H. Energetic particles in the paleomagnetosphere: Reduced dipole configurations and quadrupolar contributions. J. Geophys. Res. 2007, 112, A062146. [Google Scholar] [CrossRef] [Green Version]
  29. Winkler, H.; Sinnhuber, M.; Notholt, J.; Kallenrode, M.-B.; Steinhilber, F.; Vogt, J.; Zieger, B.; Glassmeier, K.-H.; Stadelmann, A. Modeling impacts of geomagnetic field variations on middle atmospheric ozone responses to solar proton events on long timescales. J. Geophys. Res. 2008, 113, D02302. [Google Scholar] [CrossRef] [Green Version]
  30. Fuhrmann, F.; Seelos, K.; Sirocko, F. Eolian sedimentation in central European Auel dry maar from 60 to 13 ka. Quat. Res. 2021, 101, 4–12. [Google Scholar] [CrossRef]
  31. Barberi, F.; Innocenti, F.; Lirer, L.; Munno, R.; Pescatore, T.; Santacroce, R. The Campanian Ignimbrite: A major prehistoric eruption in the Neapolitan area (Italy). Bull. Volcanol. 1978, 41, 10–31. [Google Scholar] [CrossRef]
  32. Fitzsimmons, K.E.; Hambach, U.; Veres, D.; Iovita, R. The Campanian Ignimbrite eruption: New data on volcanic ash dispersal and its potential impact on human evolution. PLoS ONE 2013, 8, e65839. [Google Scholar] [CrossRef]
  33. Lindauer, S.; Döppes, D.; Britzius, S.; Knapp, H.; Rosendahl, W.; Sirocko, F. 14C dated mammal bones from MIS 3 recovered from Upper Rhine Graben gravel pits. Quaternary 2023. in preparation. [Google Scholar]
  34. Guillevic, M.; Bazin, L.; Landais, A.; Stowasser, C.; Masson-Delmotte, V.; Blunier, T.; Eynaud, F.; Falourd, S.; Michel, E.; Minster, B.; et al. Evidence for a three-phase sequence during Heinrich Stadial 4 using a multiproxy approach based on Greenland ice core records. Clim. Past 2014, 10, 2115–2133. [Google Scholar] [CrossRef] [Green Version]
  35. Fuhrmann, F.; Diensberg, B.; Gong, X.; Lohmann, G.; Sirocko, F. Aridity synthesis for eight selected key regions of the global climate system during the Last 60,000 years. Clim. Past 2020, 16, 2221–2238. [Google Scholar] [CrossRef]
  36. Flückiger, J.; Knutti, R.; White, J.W.C.; Renssen, H. Modeled seasonality of glacial abrupt climate events. Clim. Dyn. 2008, 31, 633–645. [Google Scholar] [CrossRef] [Green Version]
  37. Hublin, J.-J.; Talamo, S.; Julien, M.; David, F.; Connet, N.; Bodu, P.; Vandermeersch, B.; Richards, M.P. Radiocarbon dates from the Grotte du Renne and Saint-Césaire support a Neandertal Origin for the Châtelperronian. Proc. Natl. Acad. Sci. USA 2012, 109, 18743–18748. [Google Scholar] [CrossRef] [PubMed]
  38. Semal, P.; Rougier, H.; Crevecoeur, I.; Jungels, C.; Flas, D.; Hauzeur, A.; Maureille, B.; Germonpré, M.; Bocherens, H.; Pirson, S.; et al. New data on the Late Neandertals: Direct dating of the Belgian Spy fossils. Am. J. Phys. Anthropol. 2009, 138, 421–428. [Google Scholar] [CrossRef] [Green Version]
  39. Higham, T.; Basell, L.; Jacobi, R.; Wood, R.; Bronk Ramsey, C.; Conard, N.J. Τesting models for the beginnings of the Aurignacian and the advent of figurative art and music the radiocarbon chronology of Geißenklösterle. J. Hum. Evol. 2012, 62, 664–676. [Google Scholar] [CrossRef] [PubMed]
  40. Mellars, P. Neanderthals and the modern human colonization of Europe. Nature 2004, 432, 461–465. [Google Scholar] [CrossRef]
  41. Germonpré, M.; Udrescu, M.; Fiers, E. The fossil mammals of Spy. Anthropol. Praehist. 2012, 123, 289–327. [Google Scholar]
  42. Staubwasser, M.; Drăgușin, V.; Onac, B.P.; Assonov, S.; Ersek, V.; Hoffmann, D.L.; Veres, D. Impact of climate change on the transition of Neanderthals to modern humans in Europe. Proc. Natl. Acad. Sci. USA 2018, 115, 9116–9121. [Google Scholar] [CrossRef] [PubMed] [Green Version]
  43. Nigst, P.R.; Haesaerts, P.; Damblon, F.; Frank-Fellner, C.; Mallol, C.; Viola, B.; Götzinger, M.; Niven, L.; Trnka, G.; Hublin, J.-J. Early modern human settlement of Europe north of the Alps occurred 43,500 years ago in a cold steppe-type environment. Proc. Natl. Acad. Sci. USA 2014, 111, 14394–14399. [Google Scholar] [CrossRef]
  44. Hublin, J.-J. The modern human colonization of western Eurasia: When and where? Quat. Sci. Rev. 2015, 118, 194–210. [Google Scholar] [CrossRef] [Green Version]
  45. Ocobock, C.; Lacy, S.; Niclou, A. Between a rock and a cold place: Neanderthal biocultural cold adaptations. Evol. Anthropol. 2021, 30, 262–279. [Google Scholar] [CrossRef]
  46. Pomeroy, E. Review: The different adaptive trajectories in Neanderthals and Homo sapiens and their implications for contemporary human physiological variation. Comp. Biochem. Physiol. Part A Mol. 2023, 280, 111420. [Google Scholar] [CrossRef]
  47. Dibble, H.L.; Abodolahzadeh, A.; Aldeias, V.; Goldberg, P.; McPherron, S.P.; Sandgathe, D.M. How did hominins adapt to Ice Age Europe without fire? Curr. Anthropol. 2017, 58, S278. [Google Scholar] [CrossRef] [Green Version]
  48. Goldfield, A.E.; Booton, R.; Marston, J.M. Modeling the role of fire and cooking in the competitive exclusion of Neanderthals. J. Hum. Evol. 2018, 124, 91–104. [Google Scholar] [CrossRef] [PubMed]
  49. Fedele, F.G.; Giaccio, B.; Isaia, R.; Orsi, G. The Campanian Ignimbrite eruption, Heinrich Event 4, and palaeolithic change in Europe: A high-resolution investigation. In Volcanism and Earth’s Atmosphere; Robock, A., Oppenheimer, C., Eds.; American Geophysical Union: Washington, DC, USA, 2003; pp. 301–325. [Google Scholar] [CrossRef]
  50. Obreht, I.; Hambach, U.; Veres, D.; Zeeden, C.; Bösken, J.; Stevens, T.; Marković, S.B.; Klasen, N.; Brill, D.; Burow, C.; et al. Shift of large-scale atmospheric systems over Europe during Late MIS 3 and implications for modern human dispersal. Sci. Rep. 2017, 7, 5848. [Google Scholar] [CrossRef] [PubMed]
  51. Valet, J.-P.; Valladas, H. The Laschamp-Mono Lake geomagnetic events and the extinction of Neanderthal: A causal link or a coincidence? Quat. Sci. Rev. 2010, 29, 3887–3893. [Google Scholar] [CrossRef] [Green Version]
  52. Guil-Guerrero, J.L. The role of large mammals as vitamin C sources for MIS 3 hominins. Quaternary 2023, 6, 20. [Google Scholar] [CrossRef]
  53. Banks, W.E.; d’Errico, F.; Peterson, A.T.; Kageyama, M.; Sima, A.; Sánchez-Goñi, M.-F. Neanderthal extinction by competitive exclusion. PLoS ONE 2008, 3, e3972. [Google Scholar] [CrossRef]
  54. Timmermann, A. Quantifying the potential causes of Neanderthal extinction: Abrupt climate change versus competition and interbreeding. Quat. Sci. Rev. 2020, 238, 106331. [Google Scholar] [CrossRef]
  55. Discamps, E.; Jaubert, J.; Bachellerie, F. Human choices and environmental constraints: Deciphering the variability of large game procurement from Mousterian to Aurignacian times (MIS 5-3) in southwestern France. Quat. Sci. Rev. 2011, 30, 2755–2775. [Google Scholar] [CrossRef]
  56. Wißing, C.; Rougier, H.; Crevecoeur, I.; Germonpré, M.; Naito, Y.I.; Semal, P.; Bocherens, H. Isotopic evidence for dietary ecology of late Neandertals in north-western Europe. Quat. Int. 2016, 411, 327–345. [Google Scholar] [CrossRef]
  57. Richards, M.P.; Trinkaus, E. Isotopic evidence for the diets of European Neanderthals and early modern humans. Proc. Natl. Acad. Sci. USA 2009, 106, 16034–16039. [Google Scholar] [CrossRef]
  58. Naito, Y.I.; Chikaraishi, Y.; Drucker, D.G.; Ohkouchi, N.; Semal, P.; Wißing, C.; Bocherens, H. Ecological niche of Neanderthals from Spy Cave revealed by nitrogen isotopes of individual amino acids in collagen. J. Hum. Evol. 2016, 93, 82–90. [Google Scholar] [CrossRef] [PubMed]
  59. Rendu, W.; Renou, S.; Soulier, M.-C.; Rigaud, S.; Roussel, M.; Soressi, M. Subsistence strategy changes during the Middle to Upper Paleolithic Transition reveals specific adaptations of human populations to their environment. Sci. Rep. 2019, 9, 15817. [Google Scholar] [CrossRef] [PubMed] [Green Version]
Figure 1. Location of the Auel drill cores. (A) Overview of Europe and the North Atlantic including the site of the North Greenland Ice Core Project (NGRIP) [1] and the Eifel Laminated Sediment Archive (ELSA) and modern mean annual air temperatures (MAAT). (B) Auel infilled maar with catchment (green) and location of the drill cores AU3 and AU4. The solid line indicates the location of the infilled maar lake.
Quaternary 06 00044 g001
Figure 2. Eifel climate and vegetation from 60,000 to 10,000 yr b2k analyzed from Auel maar sediments. The Corg(chlorins) record [3] was tuned to the North Greenland Ice Core Project (NGRIP) δ18O [1]. Herbivorous megafauna presence (total spores of coprophilous fungi Sporormiella and Sordaria) mainly depended on the degree of forestation/the availability of open landscape. The vegetation type predominant during distinct phases is shown as Landscape Evolution Zones (LEZ [2,4]). Greenland Stadial 12 was marked by a slumping event reflecting permafrost conditions (Auel cooling event [10]). Vegetation and megafauna data are taken from [2]. Temperate forest taxa include Alnus, Corylus, Carpinus, Quercus, Ulmus, Tilia, Fraxinus, Fagus, Salix; Boreal forest taxa are Picea, Pinus, Betula; Steppe taxa contain Poaceae, Ericaceae, Artemisia, Liguliflorae, Tubuliflorae, Chenopodiaceae, Caryophyllaceae, Apiaceae. Also shown are the sea surface temperatures (SST) from the North Atlantic [7] and (Si/Al)/Corg as a proxy for the dust proportion of the Si-record [2].
Quaternary 06 00044 g002
Figure 3. Core photos of sediment cores AU3 and AU4 from Auel infilled maar. The section analyzed in this study is marked with a blue box. The onsets of Greenland interstadials with respective ages [1] are written in white; tephra layers are shown in red.
Quaternary 06 00044 g003
Figure 4. Alignment of cores AU3 and AU4. The cores were drilled with an offset of 0.5 m in order to be capable to fill gaps that may arise, e.g., at the transition from one core section to another. The Corg(chlorins) records of both cores [3] could be assigned to each other and to the North Greenland Ice Core Project δ18O [1]. Greenland Interstadials (GI, onsets marked with a green line) are recognizable from the Corg(chlorins) and from a darker brownish color of the sediment. The section analyzed in this study is marked with a red box.
Quaternary 06 00044 g004
Figure 5. Documentation of the pollen and fungal spores identified in the samples from Auel infilled maar, including spores of coprophilous fungi (SCF).
Quaternary 06 00044 g005
Figure 6. Spectra of all pollen (A) and all spore (B) taxa from cores AU3 and AU4 as composite versus AU4 depth. Local pollen assemblage zones (LPAZ) are indicated through solid lines, subzones through dotted lines.
Quaternary 06 00044 g006
Figure 7. Spectra of all pollen (A) and all spore (B) taxa from cores AU3 and AU4 as composite versus age [yr b2k]. Local pollen assemblage zones (LPAZ) are indicated through solid lines, subzones through dotted lines.
Quaternary 06 00044 g007
Figure 8. Vegetation types. Auel organic carbon [3] and vegetation types fine-tuned to the NGRIP δ18O record [1] between 41,800 and 36,400 yr b2k. The n-alkanes [2] show changes in the vegetational composition, whereby lower values correspond to higher amounts of trees and vice versa [2]. They were measured with a lower resolution than our pollen; however, both records are in accordance on the larger scale. Ice core data were smoothed with a 5pt running mean, pollen with a 3pt running mean. Vegetation types include the following taxa: Temperate forest: Alnus, Corylus, Carpinus, Quercus, Ulmus, Tilia, Fraxinus, Fagus, Salix; Boreal forest: Picea, Pinus, Betula; Steppe: Poaceae, Ericaceae, Artemisia, Liguliflorae, Tubuliflorae, Chenopodiaceae, Caryophyllaceae, Apiaceae.
Quaternary 06 00044 g008
Table 1. Local Pollen Assemblage Zones from 41,800 to 36,400 yr b2k in temporal relation to Landscape Evolution Zones (LEZ [4]), Greenland Stadials (GS), and Interstadials (GI) [1]. Tephra deposited in the Auel sediments is marked in red; the Heinrich event 4, as represented from the pollen spectrum, is marked in blue.
Age
[yr b2k]
VegetationLPAZLEZGS/GIMIS

37,000

Betula
Open mixed forest7c↑ 6 Forest - steppeGI8Marine Isotope Stage 3


37,400
↓Poaceae

↑Poaceae, Carpinus
b7 Cold temperate forest


37,960
Betula

↑Tot. pollen
a
Alnus, SCFs, herbs, forbs

Carpinus         single Tilia
6b

38,500
GS9

38,860

Alnus, Quercus, Salix, Ulmus
a


39,700
Picea

Artemisia
Open boreal forest5 Quaternary 06 00044 i001
Alnus, Quercus, Salix, Ulmus

Alnus, Ulmus,     single Tilia
Open mixed forest4bCI

40,130
GI9

Quercus, Salix, Poaceae, Chenopodiaceae
a

40,420
DWT

GS10


41,220
↓Ericaceae, Ulmus, Alnus, Picea, Betula

Pinus, Alnus, Ulmus, single Tilia
3
Carpinus, Poaceae

Betula, Carpinus, Poaceae
2 GI10

41,520
GS11
Pinus, Picea, Alnus, Ulmus, Salix1
Disclaimer/Publisher’s Note: The statements, opinions and data contained in all publications are solely those of the individual author(s) and contributor(s) and not of MDPI and/or the editor(s). MDPI and/or the editor(s) disclaim responsibility for any injury to people or property resulting from any ideas, methods, instructions or products referred to in the content.

