Solar Hybrid Micro Gas Turbine Based on Turbocharger


Laboratory of Thermal Turbomachines, School of Mechanical Engineering, National Technical University of Athens, Heroon Polytechniou 9, 15780 Zografou, Athens, Greece
*
Author to whom correspondence should be addressed.
Appl. Syst. Innov. 2018, 1(3), 27; https://doi.org/10.3390/asi1030027
Submission received: 7 June 2018
/
Revised: 27 July 2018
/
Accepted: 27 July 2018
/
Published: 1 August 2018
(This article belongs to the Special Issue Solar Thermal Systems)
Abstract
:The performance of solar hybrid Brayton cycle materialized by a micro-gas turbine based on a turbocharger is studied. The use of a turbocharger is aimed at investment cost reduction and construction simplification. Two configurations are investigated, namely hybrid and solar-only. Design aspects are discussed, in view of the requirement for minimizing the cost of electricity produced. A key parameter is the turbine inlet temperature and its effect on performance is investigated. The effect of heliostat field size is also investigated. Augmentation of the maximum temperature leads to better performance, as a result of higher cycle efficiency. Solar-only configuration features are compared with hybrid ones and the contribution of different cost components to the final electricity cost is discussed.
1. Introduction
The first solar thermal power plant (STPP) built mainly uses troughs and oil as heat transfer fluid (HTF), materializing a Rankine cycle [1]. While direct steam generation from troughs as well as the use of other materials as HTF is still under investigation today [2,3,4], steam generation using a tower receiver is already in commercial state either with the use of molten salts [5] or directly in the receiver [6]. Solar thermal power in the Brayton cycle is used to preheat the air before it enters the combustion chamber, in order to lower the needed amount of fuel. A heliostat field harnesses the Sun beams and reflects them to a receiver, which is placed at the top of a tower. The compressed air is fed into the receiver to be heated, before its entrance into the combustion chamber. Several European Union (EU) funded projects [7,8,9] and research works study this option [10,11,12,13]. This technology is in experimental stage [7,8,9].
The main difficulties encountered in the concept of this hybrid Brayton cycle are related to the combustion chamber and the extraction of compressed air fed into the receiver. Higher thermal stresses occur in the combustion chamber as a result of the higher inlet air temperature. Furthermore, combustion stability problems may occur as a result of the wide fuel flow variation and high inlet air temperature. Such difficulties have been studied by several groups [7,8,9]. The in-line arrangement of modern gas turbine components makes redesign of the engine obligatory in order to permit the extraction of air to be fed to the receiver [8,9,14].
Finally, in economic terms, installations with high power output are favored [15], but the use of small gas turbines or microturbines (MGTs) in small scale plants (kW to MW scale) is recognized to offer advantages in order to achieve lower investment cost [16].
The main problem with STPP today is that investment cost is high, resulting to high levelized electricity cost (LEC) that makes them far from competitive with other renewable technologies. The fact that mass production would be necessary in order to reduce the capital cost of CSP plants has been recognized and addressed in recent publications [17]. The idea behind the present work is to investigate if STPPs can be materialized by using low-cost components, taking advantage of existing mature technologies in other fields. The possibility of using a turbocharger (T/C) in the solar hybrid MGT scheme and its performance is investigated. Turbochargers for reciprocating engines are mass-produced, their cost being thus comparatively lower than other turbo-components, because of economies of scale. Furthermore, the use of a turbocharger has some advantages such as easy air extraction to feed the receiver.
Both solar-only and hybrid schemes are studied, while their performance is assessed for three maximum cycle temperatures. For every scheme, an optimum rotational speed schedule is determined and used. The effect of heliostat field size on performance (produced energy and electricity cost) is investigated, in order to identify the one that leads to the lower LEC.
The tool used to carry out the engine performance studies is PROOSIS [18] utilizing TURBO [19] and SOLAR [20] libraries. It is noted that the performance of compressor and turbine components is represented by suitable performance maps, interrelating speed, mass flow rate pressure ratio and efficiency, as is usually done for this kind of modelling. The maps for the studies presented in this paper have been produced using the software TurboGENIUS [21], which is based on existing widely accepted methods [22,23].
2. Design, Operation, and Performance Aspects
2.1. Design and Operation Aspects
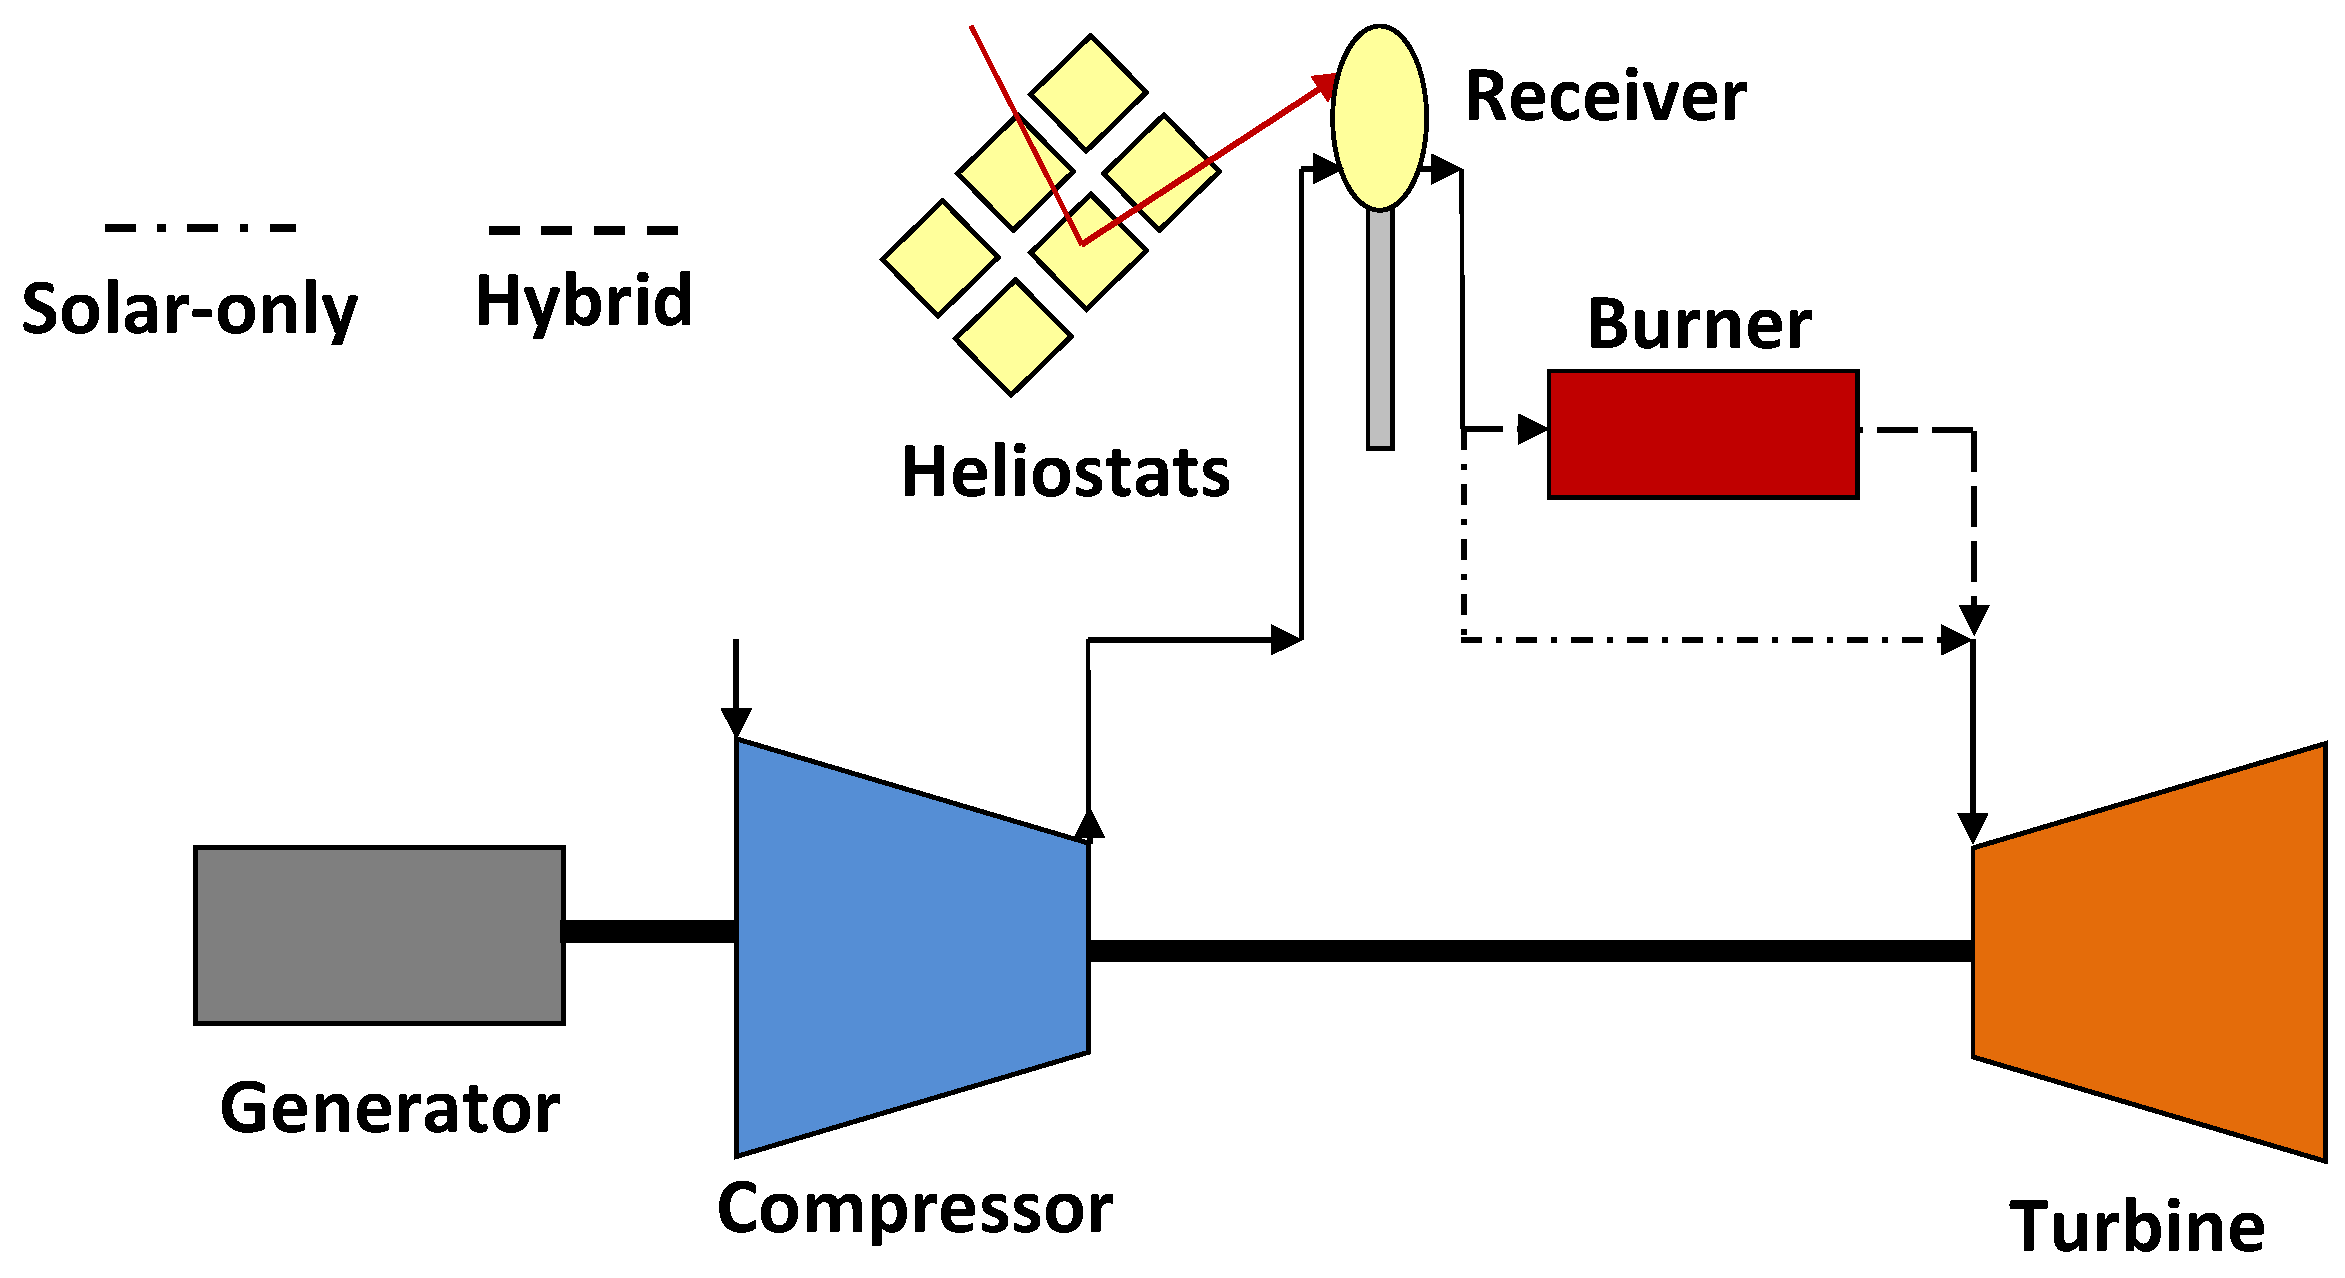
A solar MGT based on a turbocharger (MGT-T/C) is materialized using a turbocharger, a receiver, inlet and outlet ducts, a generator, and a burner in the case of the hybrid configuration. The generator is coupled on the T/C shaft on the compressor side. A high-speed generator, equipped with the relevant electronics for connection to the network is envisaged. Alternatively, a gear box can be used to match (reduce) high turbocharger speed with that of a generator, if the two rotational speeds cannot be directly matched. In the solar-only configuration operation exploits only the available solar energy, while in hybrid configuration, solar energy substitutes (partially or entirely) the fossil fuel energy. Solar energy is captured by the receiver, which heats the air after it exits the compressor. Solar beams are concentrated on the receiver by a heliostat field.
The entire set up of MGT-T/C is considered to be placed at the top of the tower, instead of being placed on the ground, to avoid long piping to connect the engine with the receiver. The layout of the described configurations is depicted in Figure 1.
A commercial, widely used turbocharger (SJ180 by Fuyuan turbo) has been selected for setting up the configurations that will be studied. It is employed in ship generator 600 kW diesel engines. Design specifications for the T/C are summarized in Table 1.
Ducts, and receiver and heating elements (burner) are assumed to add a pressure drop of 2% each at the design point [10,13]. The shaft/generator is assumed to have efficiency of 98% [24,25].
Design and manufacturing of combustion chamber for use with T/C has already been demonstrated, achieving a turbine inlet temperature of about 800 °C [26,27].
The heliostat field consists of mirrors with 64 m2 aperture [28] with reflectivity of 97% [28]. The number of mirrors in this study is a design parameter, which should be chosen for minimizing electricity cost. Description of modelling of the heliostat field is included in the solar components modeling tool produced by the authors [20].
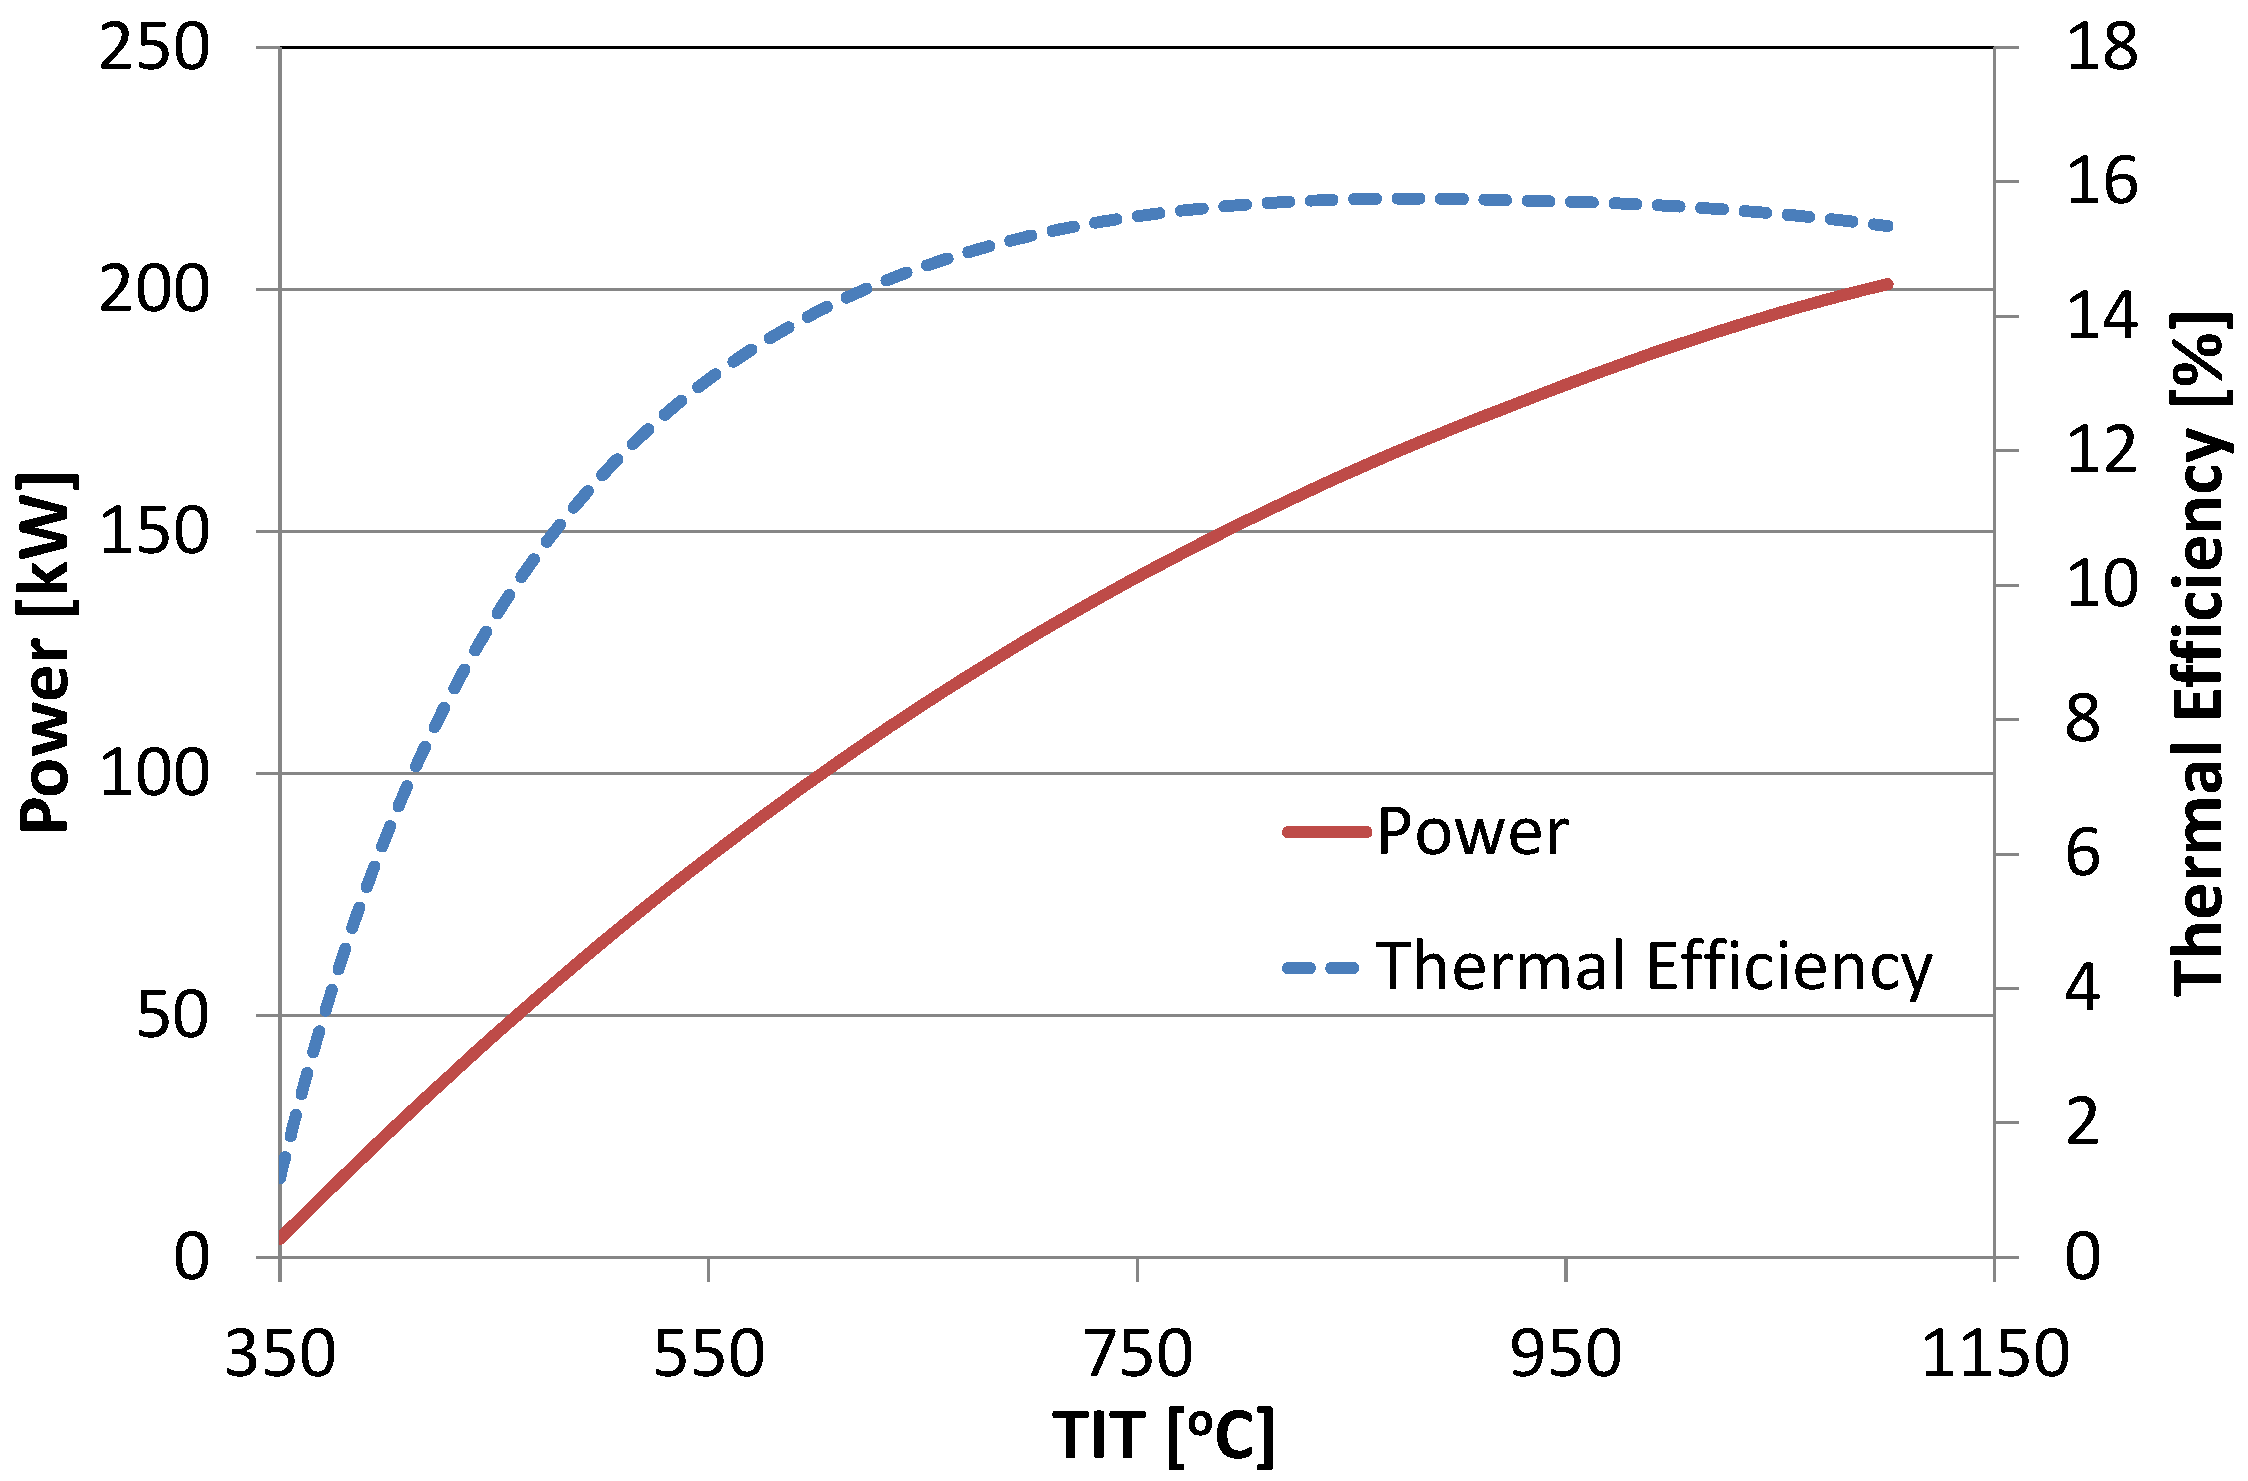
For given turbomachinery components, engine performance depends mainly on turbine inlet temperature (TIT). It is well known that the higher the TIT, the better the engine performance. Increasing TIT however, makes necessary the use of more expensive materials. Material properties for the components employed, the turbine in particular, put limits as to how high the TIT can be. In view of these opposing trends, and in order to produce information that can be useful in choosing a design TIT, simulation of the performance of the studied MGT-T/C is carried out for different TIT values. For the design specifications of Table 1, power and thermal efficiency are evaluated and depicted in Figure 2. Power increases with TIT, while thermal efficiency achieves a maximum for TIT of 850 °C. Here, three cases of turbine inlet temperature are studied: (a) 400 °C, because it is the nominal inlet turbine temperature of the T/C; (b) 800 °C, because it is the maximum one experimentally demonstrated [26,27] (while we are not sure if it is in within the limits of the specific T/C used in this work); and (c) 600 °C, the intermediate of the two in order to establish a performance trend.
The specifications of solar and other components of the MGT-T/C are summarized in Table 2.
For our test case, hourly ambient data (DNI, ambient temperature, pressure, and humidity) for a location in the south of the island of Crete, Greece were used by taking into account 10-year measured data to produce the typical meteorological year [28].
A model of each configuration is used and performance is simulated in hourly intervals, taking into account ambient conditions. Then, by integration, the annual figures are derived.
The continuous variation of the ambient conditions results in the off-design operation of the studied configurations, which is taken into account during the simulation with the usage of appropriate turbomachinery maps and the computation of time-changing loss factors for the solar part. The simulation of the design and off-design operation of turbomachinery and solar components can be found, in detail, in the literature [18,19,20,28].
2.2. Economic Aspects
Competitiveness and thus attractiveness of a plant are judged in terms of its economic performance. The economic performance of an installation is best expressed using the levelized electricity cost (LEC). Here, LEC is computed using Equation (1) below, which was derived from taking into account the discussion in the literature [29,30,31,32].
where: DEP: Depreciation; DPT: Loan Dept; INT: Loan Interest; N: Plant’s Life; t: Time; OP: Operating Cost; PI: Privet Investments; r: Discount Rate; TR: Tax Rate; E: Energy.
This formula has some advantages compared with others (e.g., [30]), because it takes into account accounting factors, such as the investment source type (private and/or loan), and the depreciation and tax rate. Thus, plant economic performance can be determined for a variety of financing cases. In order to apply this formula to compute LEC, economic data of the used components are necessary. They include the cost for acquiring the installation (investment cost) and the cost needed for operation (operational cost). Data for investment and operational cost were drawn from publications of international organizations (e.g., IEA—International Energy Agency, NREL—National Renewable Energy Laboratory, EIA—Energy Information Administration) [15,16,25], as presented by Spelling et al. [33], as well as communication with manufacturers. Annual operational cost equal to 2% of investment cost for turbomachinery components were considered, as proposed in the literature [25].
For components that are already mass produced and used in existing applications (e.g., turbomachinery, generator, etc.), the investment and operational costs are not expected to significantly change over time. On the other hand, solar components are not yet mass produced, and thus the advancement and penetration of solar thermal technology is expected to lead to lower costs. This applies in particular to the case of air type receiver, which is today in a rather experimental stage, while mirrors are already used in commercial solar Rankine plants, with water/steam or molten salts type receiver. In the particular application examined here, the relative low pressure and temperature at the receiver would permit the selection of cost values lower than the ones used for this component, which are current figures and obtained for receivers with pressure input from 10-bar and above.
Fuel cost can be the dominant factor to determine if a plant based on renewable energy sources is more profitable compared with a conventional one, based on fossil fuel. As a result of a variety of reasons, fuel price can change dramatically over time. For example, in the period 2012–2017, diesel price has fluctuated between 0.98 $/gallon and 3.3 $/gallon [34]. Furthermore, the fuel cost can significantly rise for remote locations because of the added transport cost.
In this study, carbon emissions cost is also taken into account. The methodology used for the computation of the CO2 emissions is described in the literature [35].
Plant life is assumed to be 30 years, built solely by private investments, while the discount rate is chosen to be 5% and constant. The used economic data are summarized in Table 3.
3. Results
3.1. Solar-Only MGT-T/C
This configuration operates solely on solar energy. The compressed air is heated in the receiver by the solar power and then expands through the turbine. The achievable TIT depends solely on the available solar power. Furthermore, the receiver outlet temperature is limited to be equal to the TIT (specified in a particular design). When irradiance is so high that it could drive the receiver outlet temperature above the limit, then the outlet temperature is set to a value equal to the limit, by defocusing an appropriate number of mirrors in the heliostat field. Before presenting results of performance calculations of this set up, it is useful to comment on some aspects of its operation and control.
Considering the use of a variable speed generator and/or power electronics, variable shaft speed is allowable. When irradiation is such that TIT for a given mass flow rate is lower than the desired TIT, shaft speed is reduced, leading to lower mass flow and thus higher receiver temperature (TIT), given the available solar thermal power. The reduction of air mass flow and the augmentation of the TIT have opposing effects on the power output. In order to optimize the engine performance to produce the maximum possible power, the optimum speed value for different receiver thermal input values was determined, and thus the speed schedule was obtained and utilized in the presented work.
The installation can be operational when the thermal input leads to turbine power higher than the one needed by the compressor. Thus, there is a minimum thermal input for sustainable operation, at which turbine and compressor powers are equal. For thermal inputs higher than this minimum, net output power is available for electricity generation. Furthermore, this minimum value depends on the ambient conditions. For example, increase of the ambient temperature leads to the augmentation of the minimum value because compressor power demand is increased. In order to determine when this configuration can be operational, the minimum thermal input value is computed considering different ambient conditions.
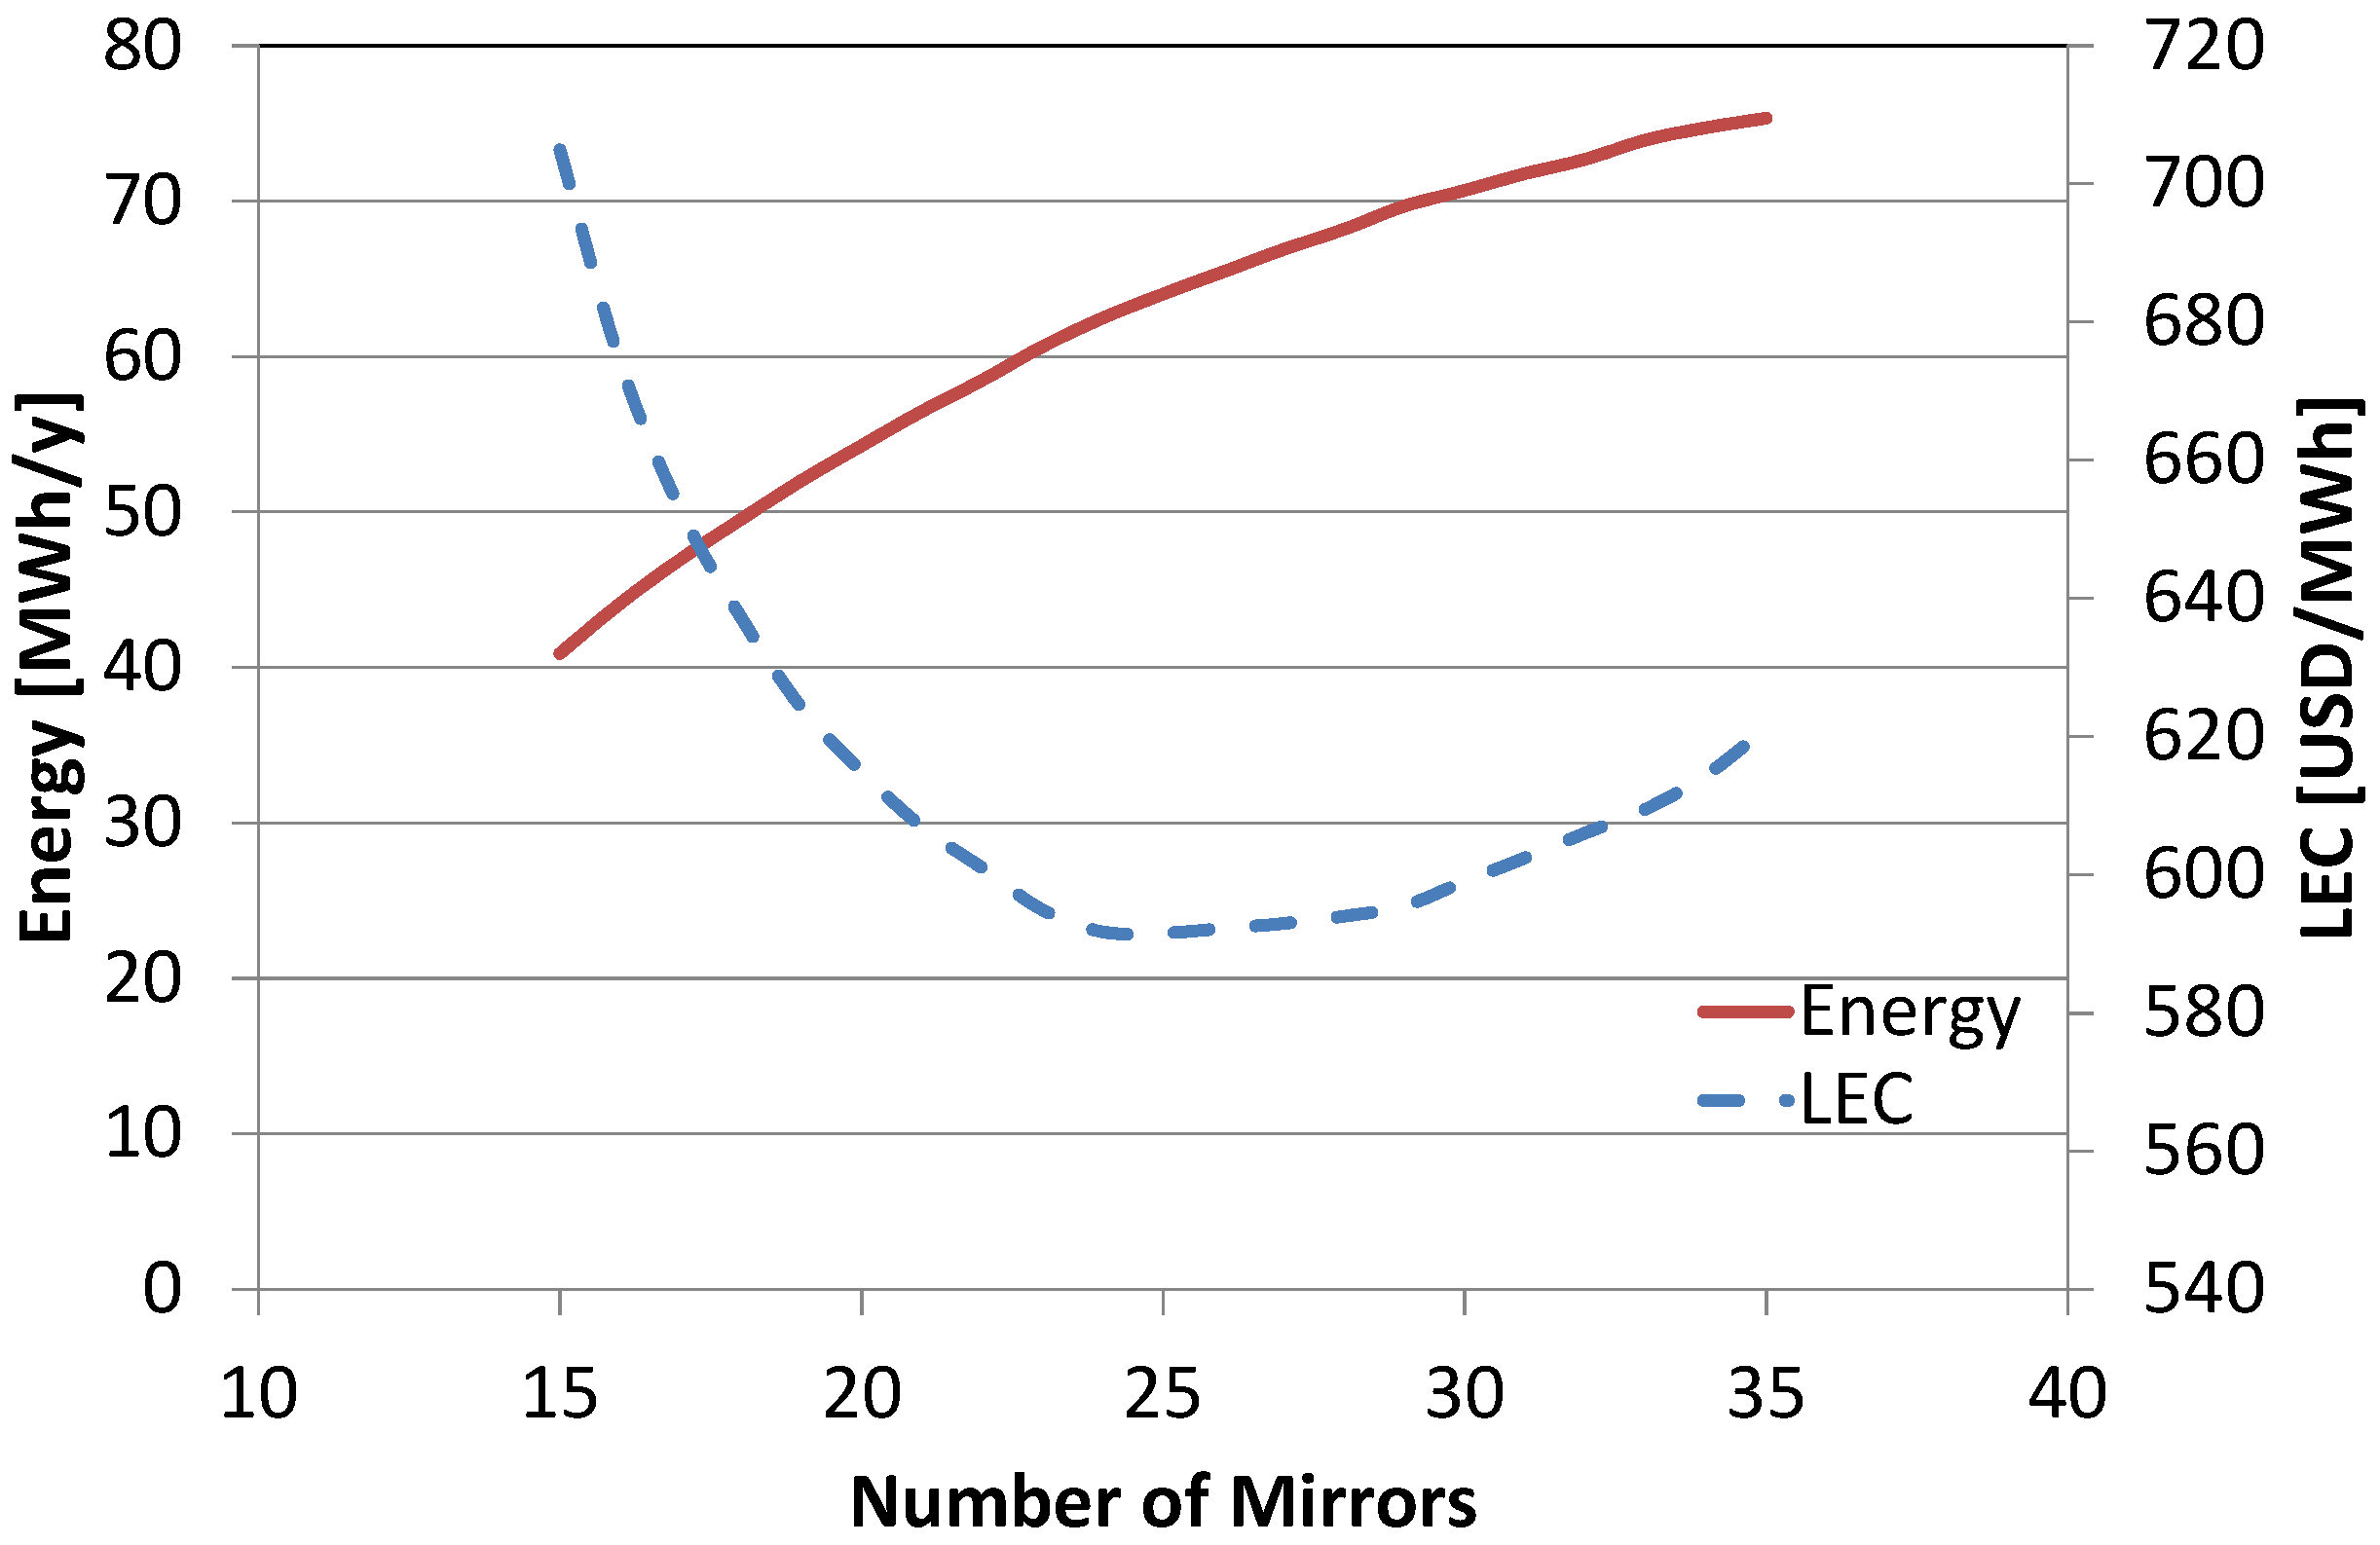
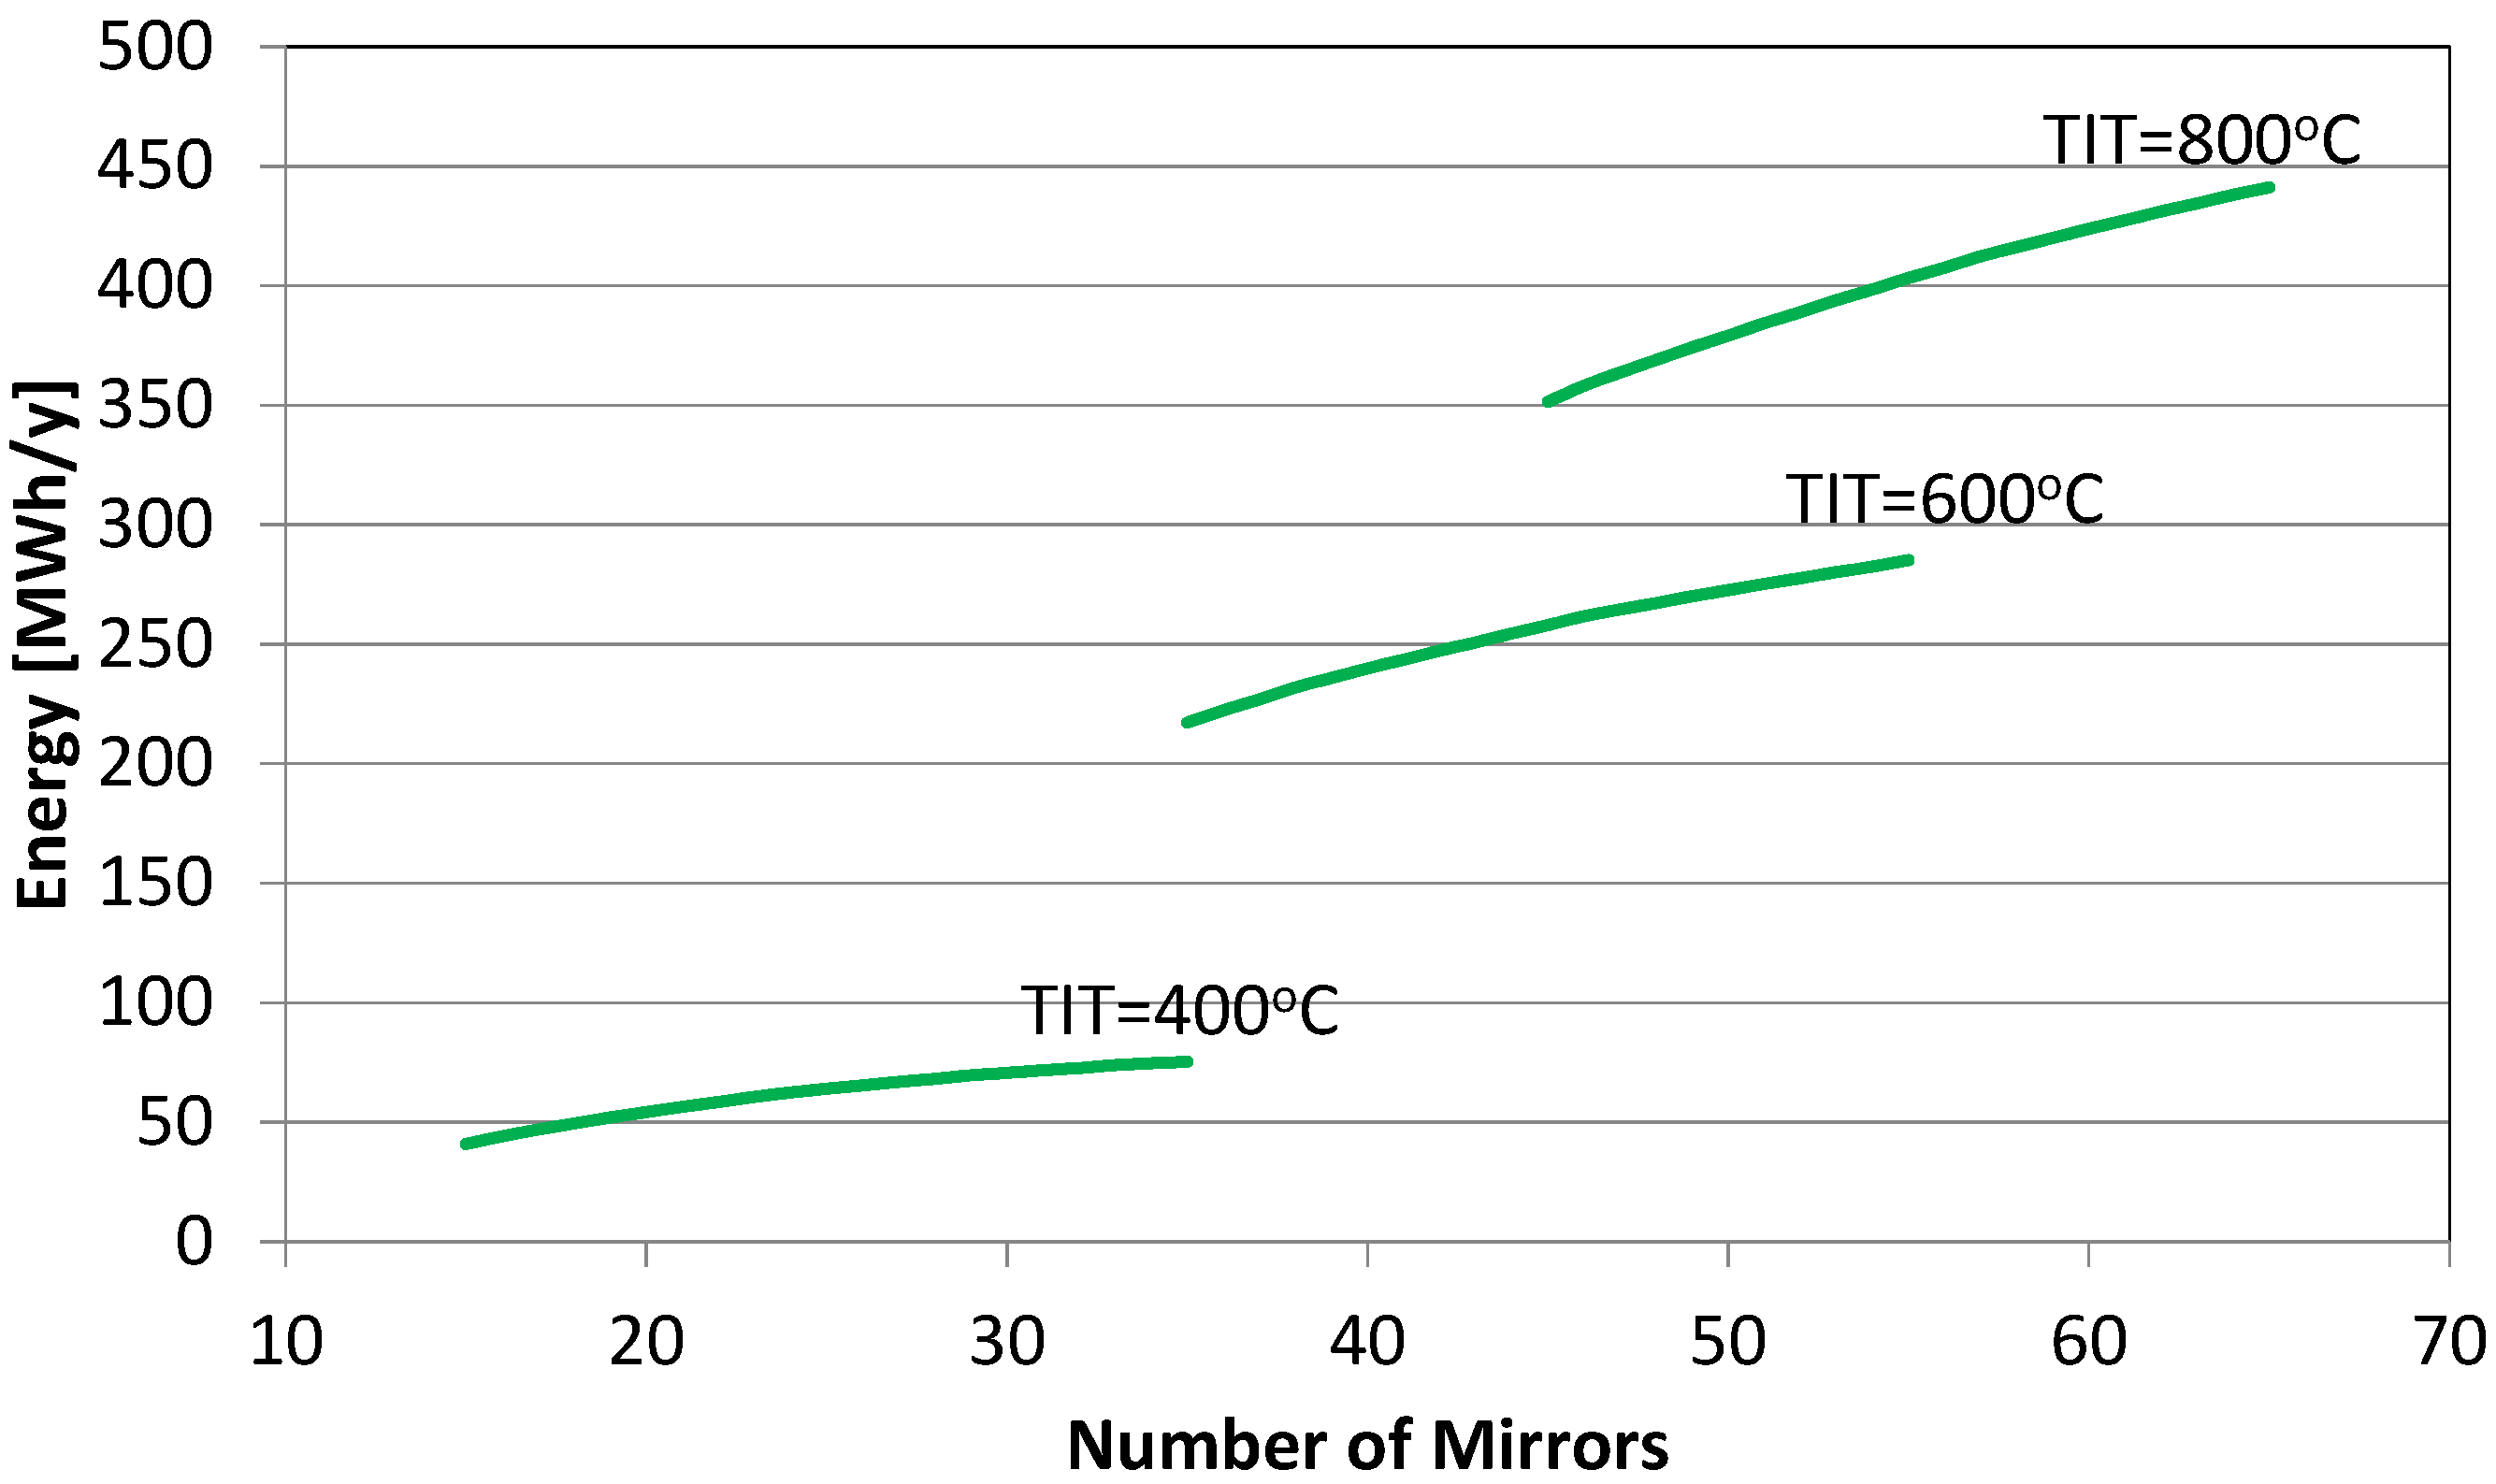
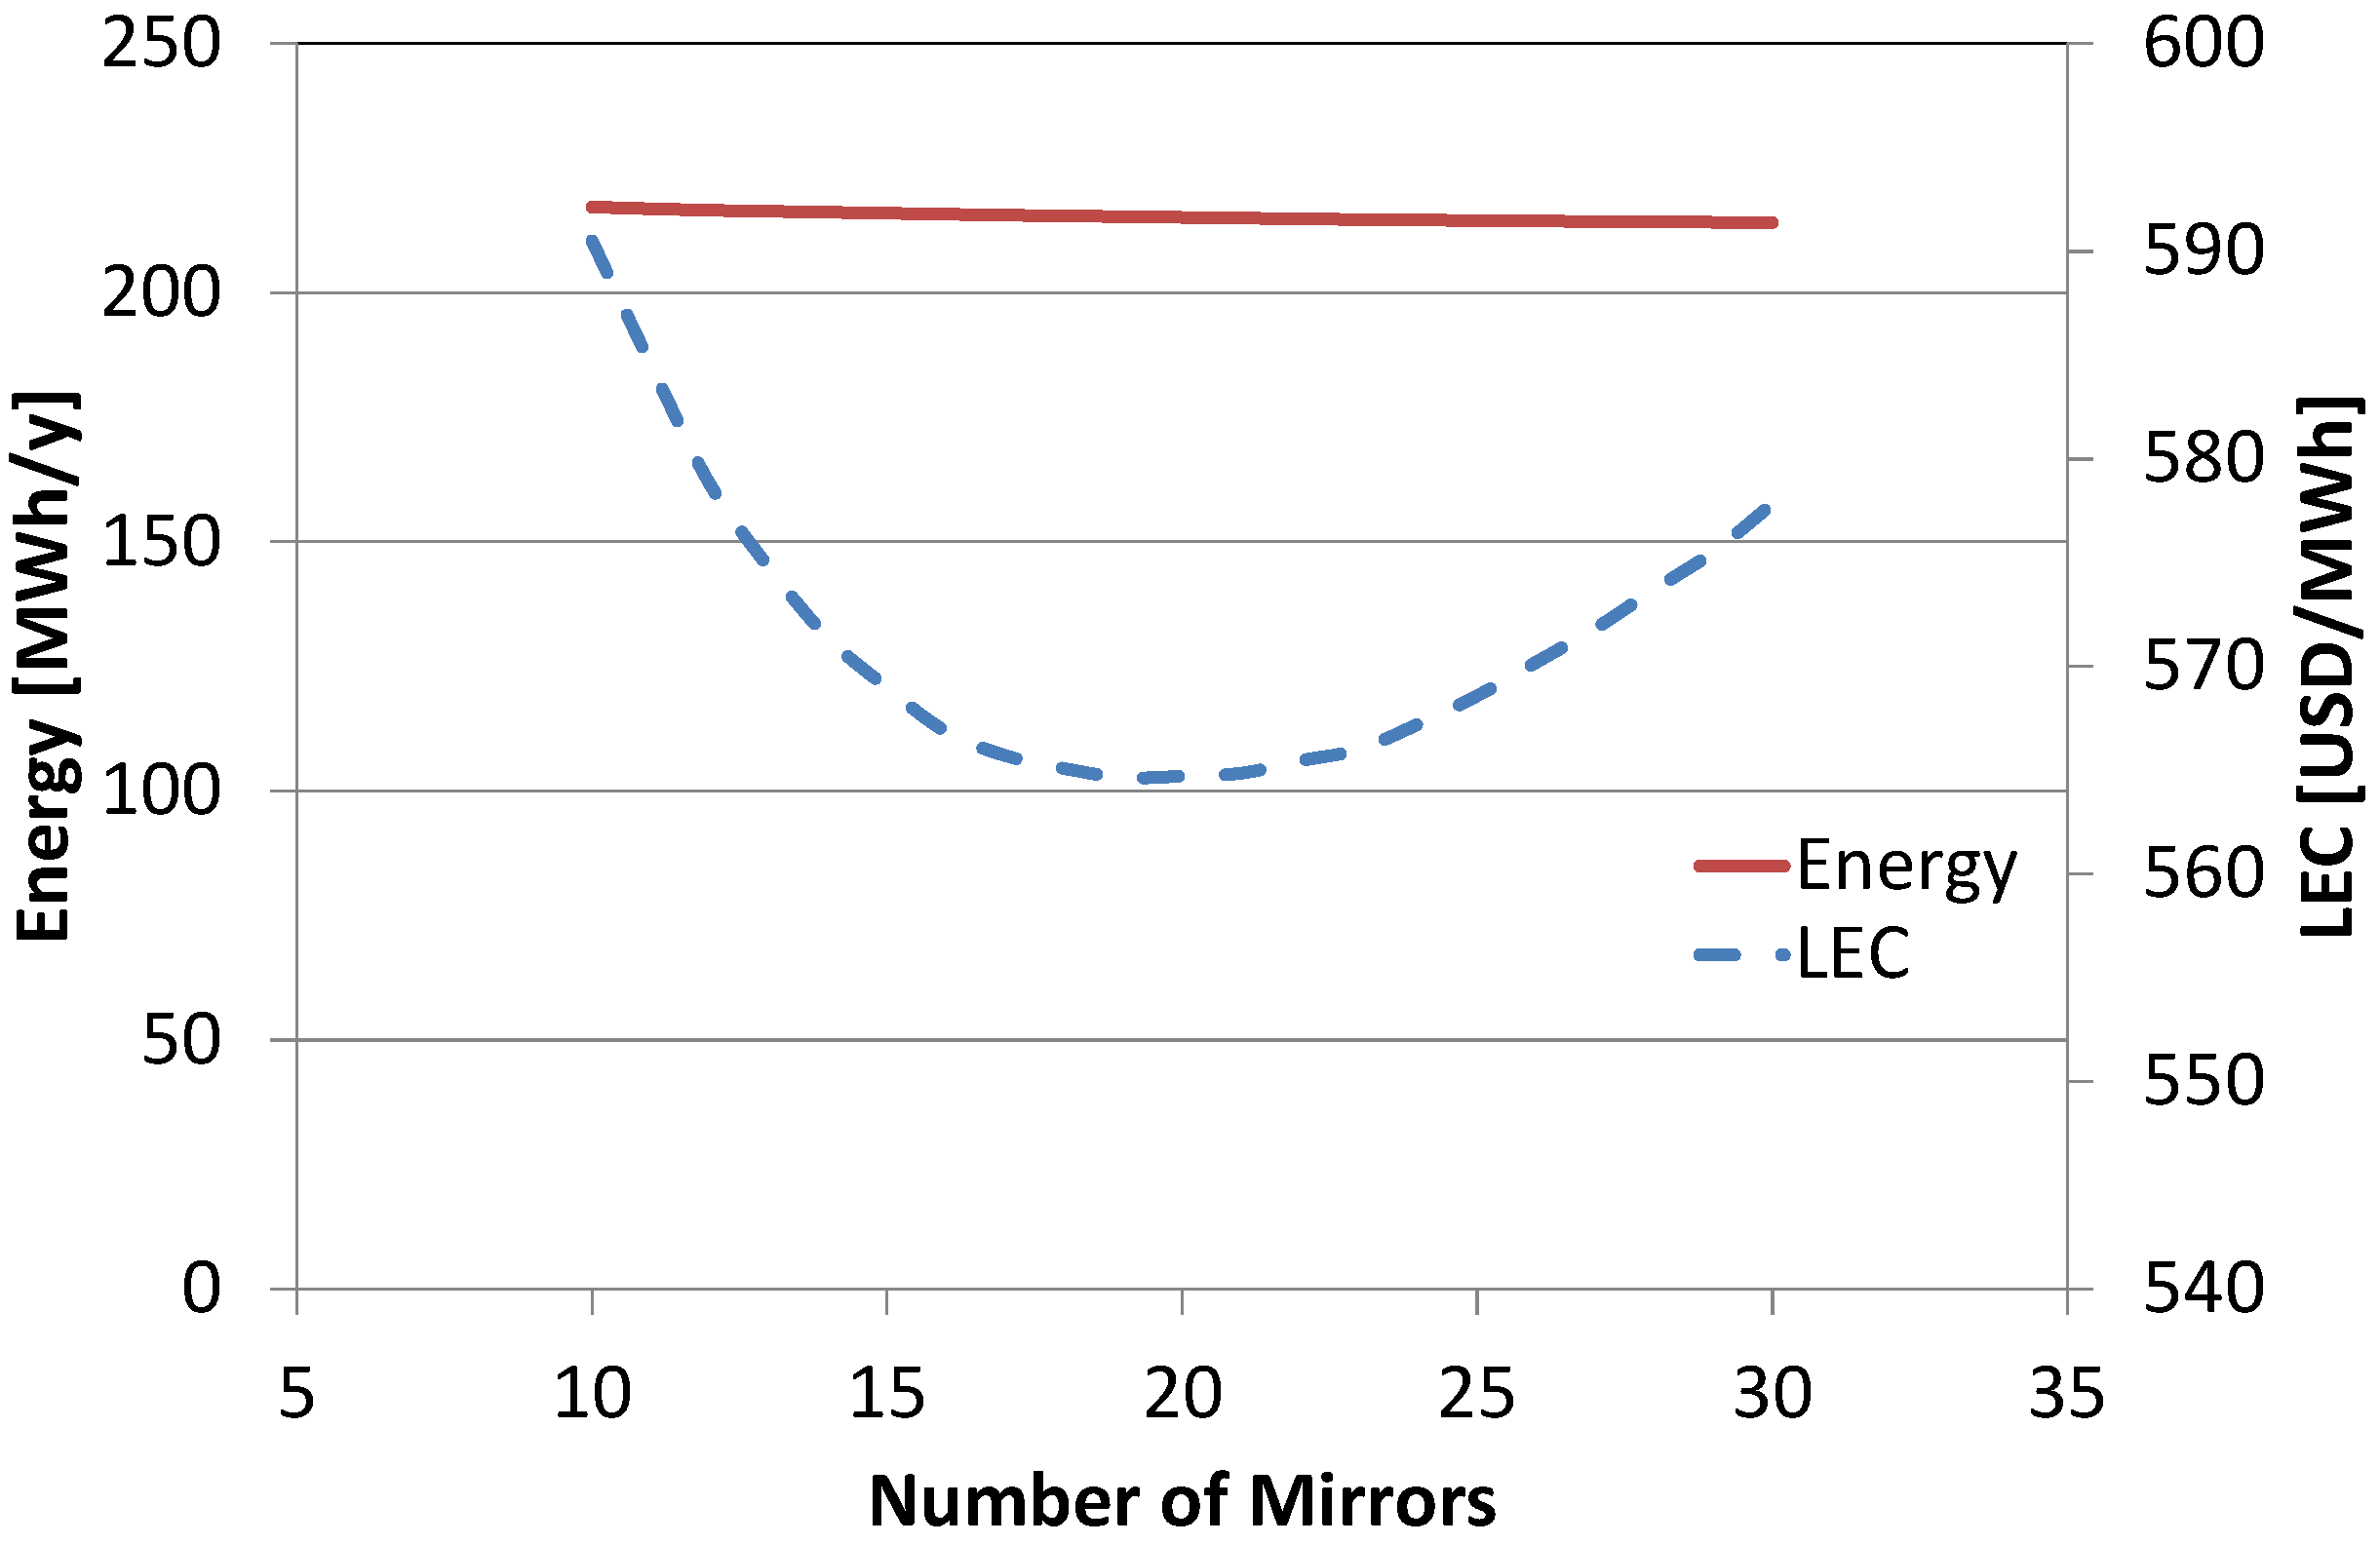
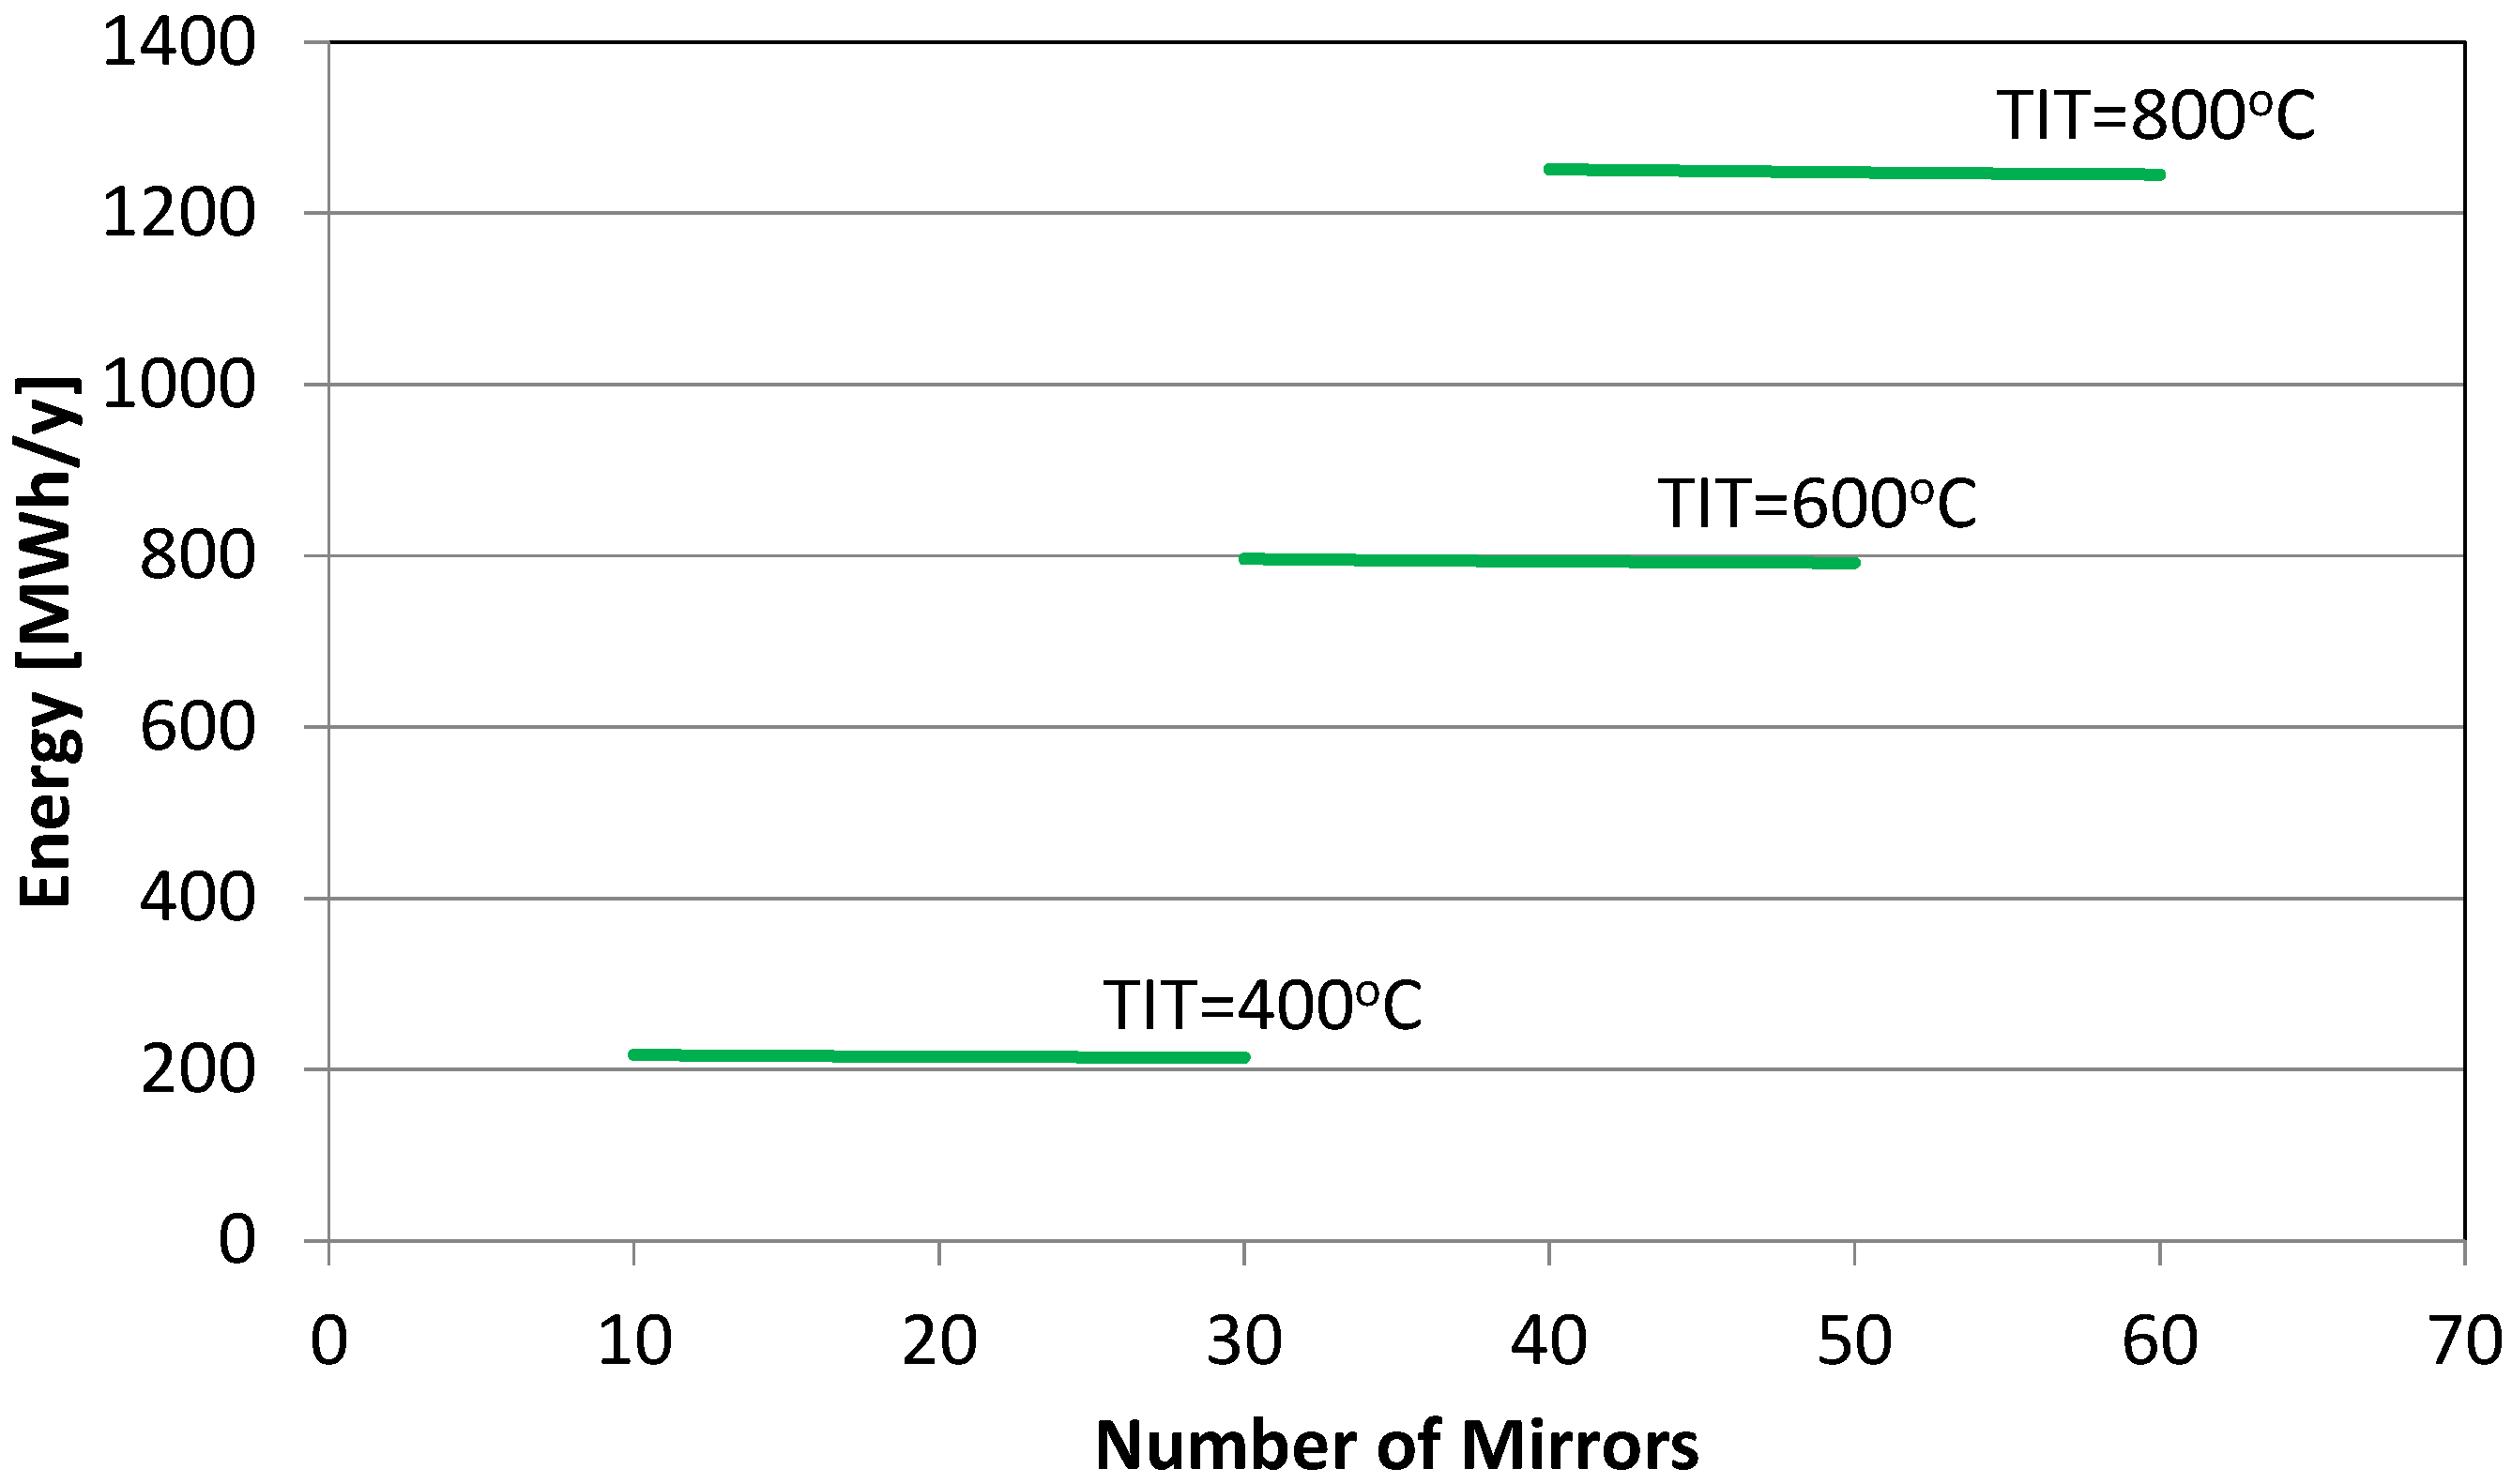
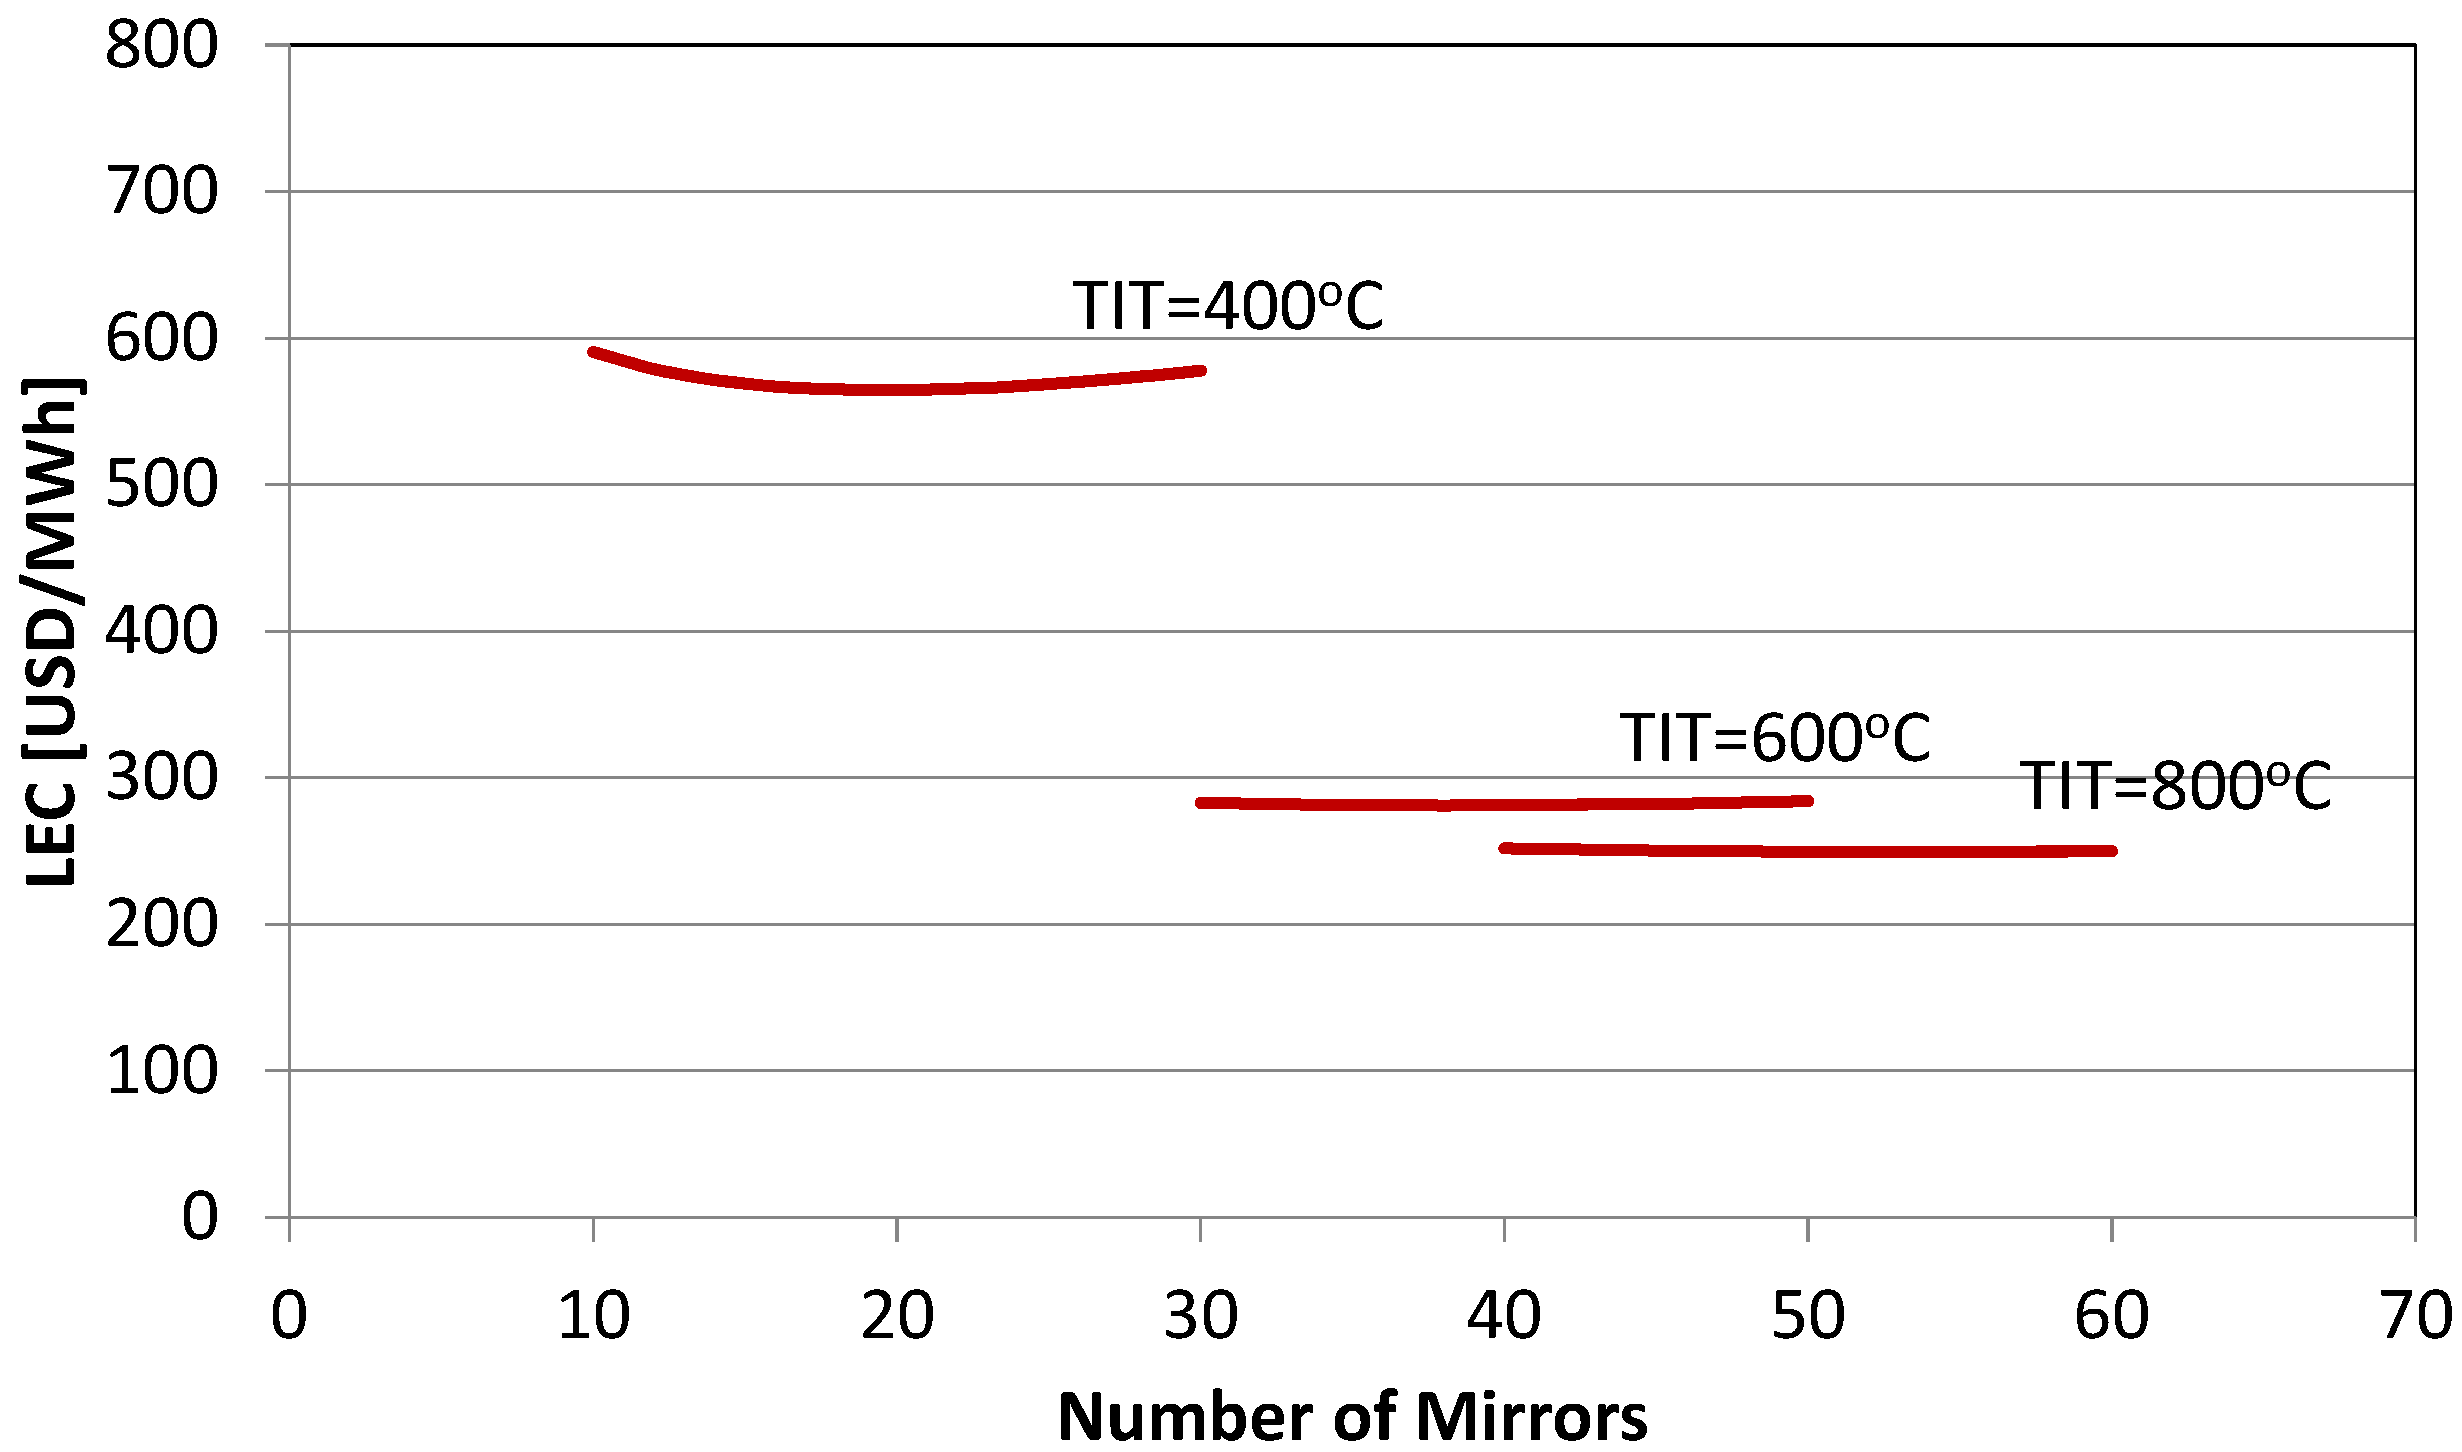
These operation aspects are incorporated in a simulation model of the installation studied and different scenarios for design parameters are considered. The performance of the solar-only configuration is computed for the three values of TIT (400, 600 and 800 °C) for a different number of mirrors and is depicted in Figure 3 (for the case of TIT = 400 °C), in terms of produced energy over a year and LEC. For each TIT, yearly produced energy increases with the number of mirrors, while LEC becomes minimum for a particular number. Energy production for the three TITs are shown in Figure 4. For a given number of mirrors, energy output increases significantly as TIT increases. This is a direct consequence of the increase of thermal efficiency shown in Figure 2 and the higher receiver temperature limit, which permits the exploitation of a larger amount of the available solar energy. A given number of mirrors correspond to a certain amount of solar energy captured by the heliostat field. The higher the TIT, the higher the efficiency and the higher the exploitable amount of the solar energy. A further consequence is the reduction of the corresponding LEC shown in Figure 5. For the same investment, the useful output is more, thus the unit cost is lower.
3.2. Solar Hybrid MGT-T/C
The operation of the solar-only MGT T/C configuration, and thus its power output, is determined by the solar power available. Power output is available while solar thermal input is available.
Controlled power availability can be provided if a solar hybrid MGT T/C configuration is employed. In this configuration, a burner component is employed after the receiver (Figure 1). During operation, if the available solar power is not adequate to heat the air to the desired TIT, the appropriate amount of fuel is burned and the desired TIT value is achieved. For operating hours with zero solar thermal power, the configuration operates as a usual fuel-only gas turbine, while for hours with high irradiation for which the desired TIT is achieved solely by the solar power, the configuration operates without fuel as the solar-only one. In order to maximize the produced power, the operating scenario is chosen to be continuous operation with constant TIT.
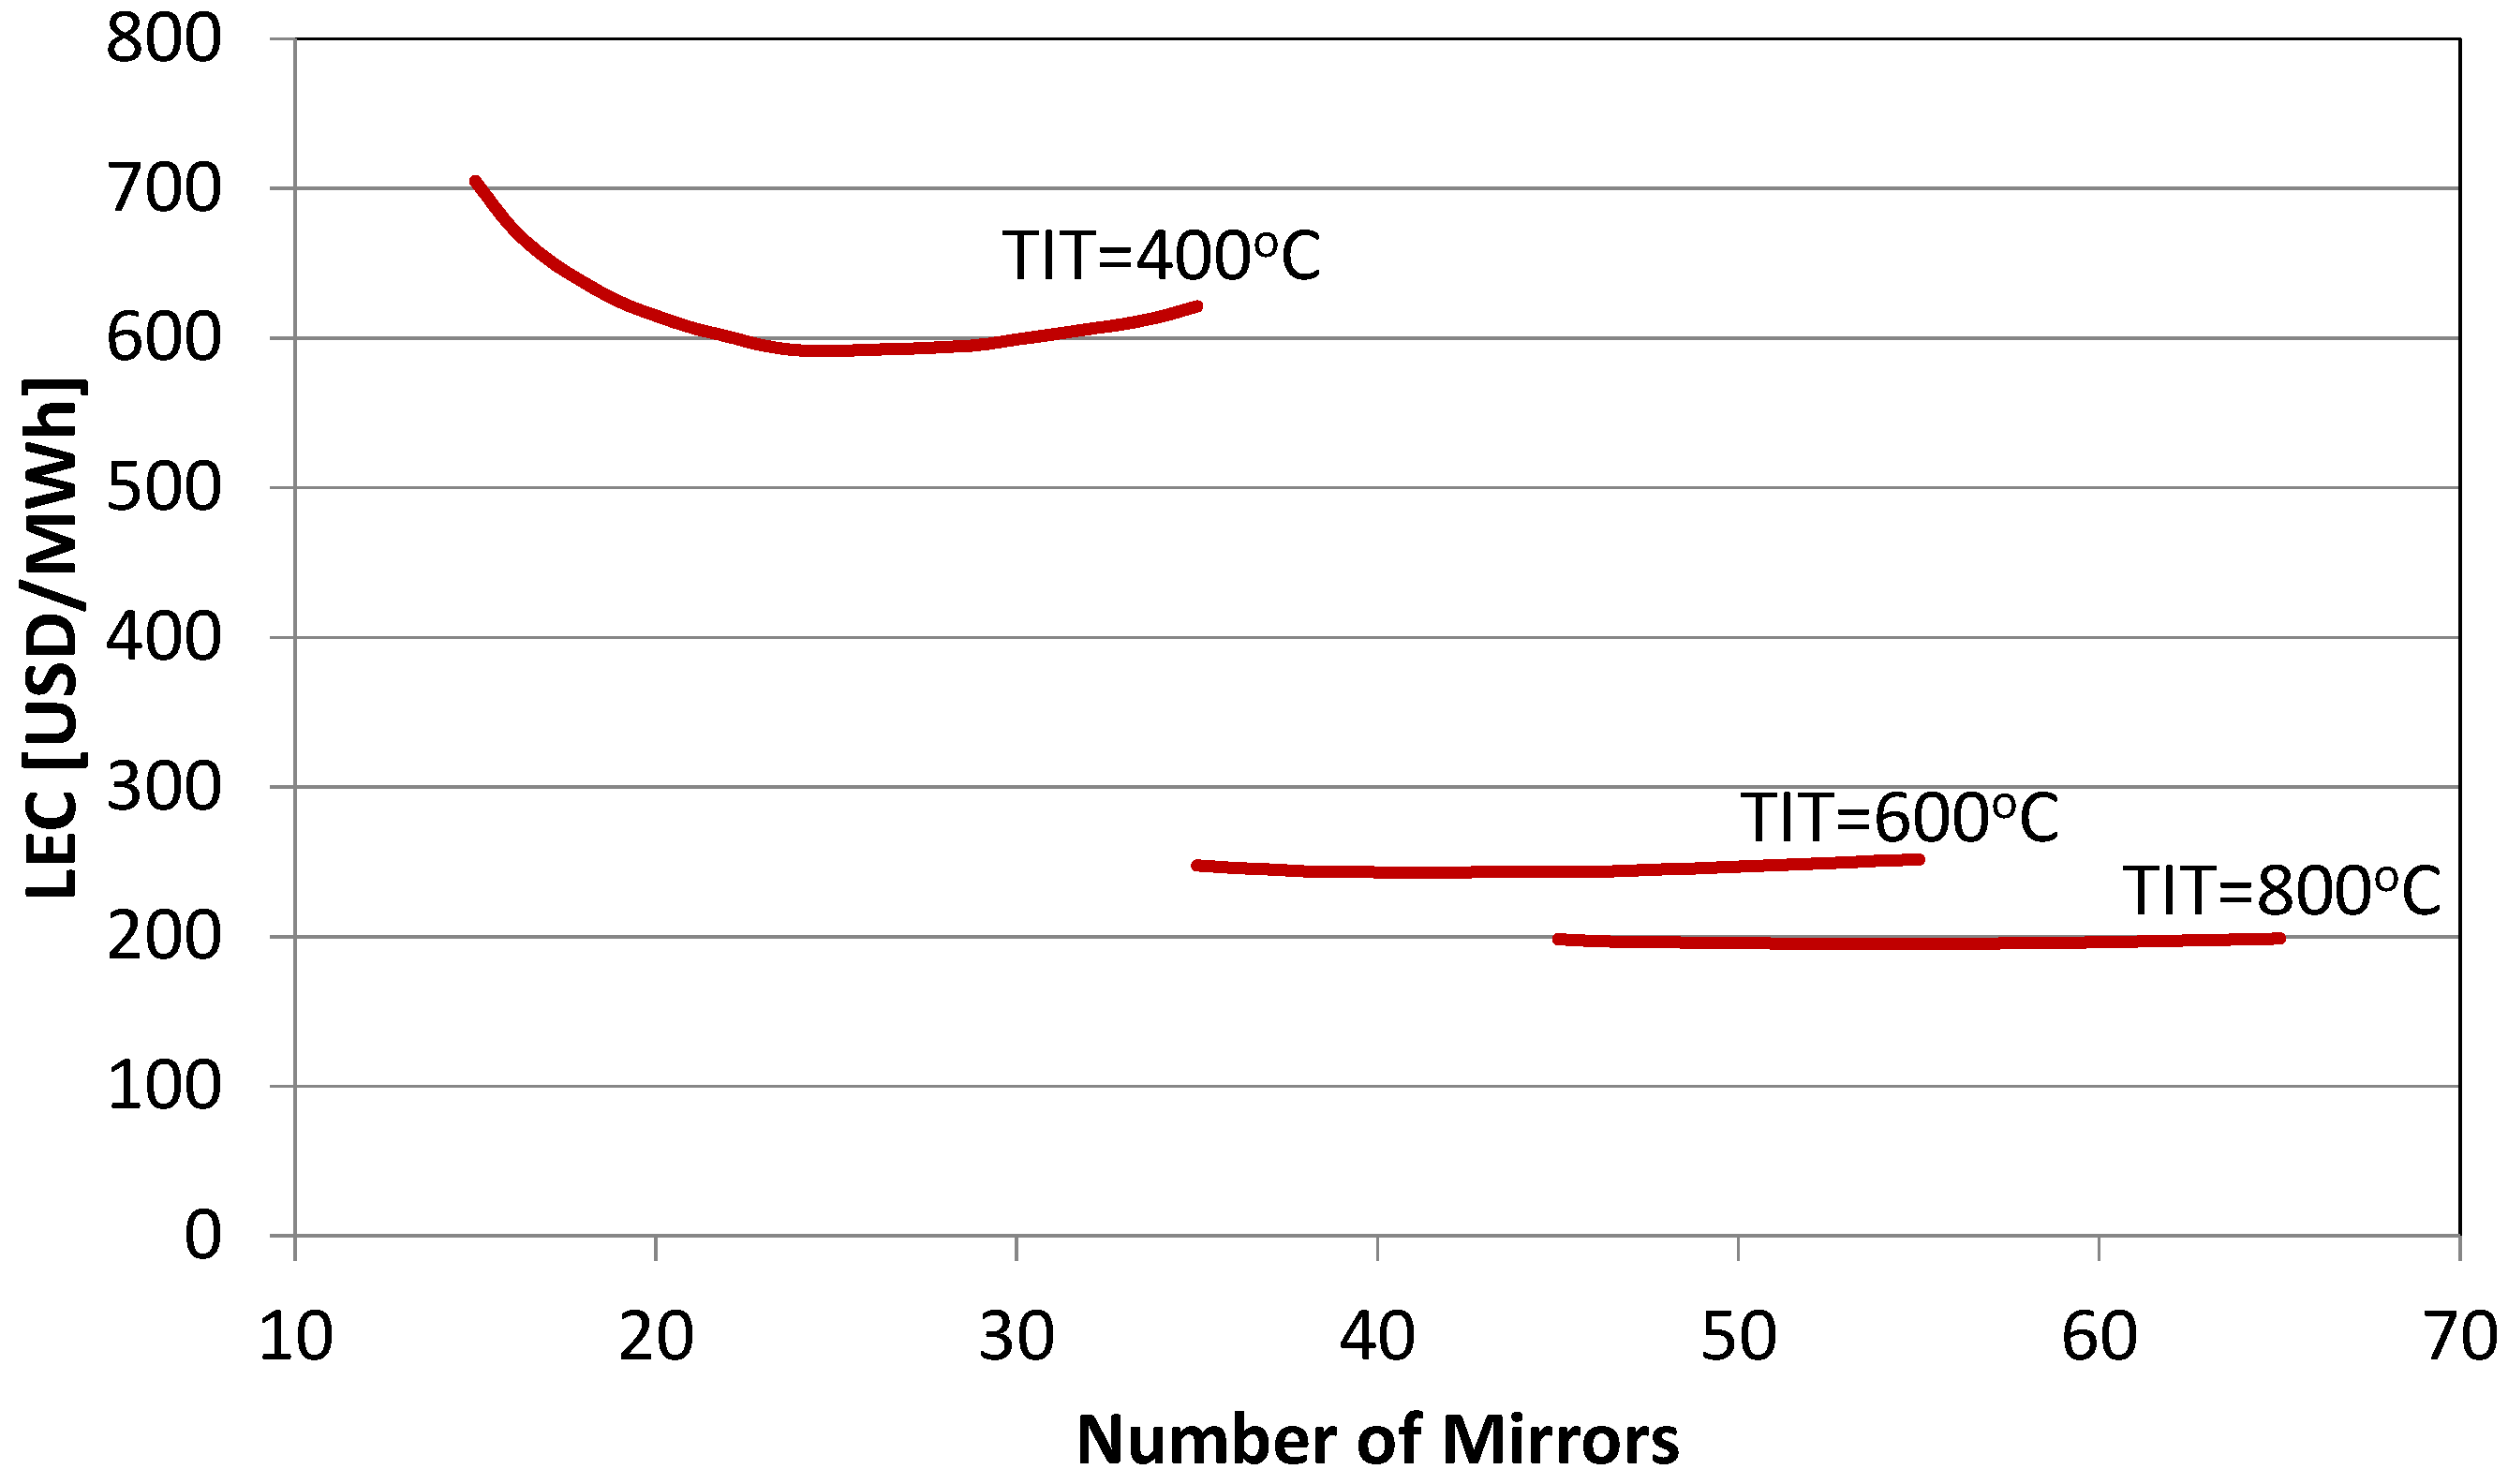
Performance in terms of annual energy output on LEC of the hybrid configuration for TIT of 400, 600, and 800 °C is depicted in Figure 6, Figure 7 and Figure 8, as it was done for the solar only configuration above. For the hybrid configuration, the produced power is almost constant while varying the size of heliostat field. This is a direct consequence to the constant TIT. The needed thermal power to achieve the desired TIT is continuously available to the engine from the combination of fuel and solar thermal power. Furthermore, the increase of the maximum TIT is favorable for the produced energy and LEC because the engine operates at higher efficiency and the fuel and solar thermal power are exploited more effectively. Energy production and LEC for the three TITs are shown in Figure 7 and Figure 8, respectively. Energy is independent of the number of mirrors in all cases. LEC decreases with increasing TIT, while it shows a less pronounced trend for an optimum. It is interesting to work out that of higher temperature, LEC is more than the corresponding value for the solar-only configuration (Figure 5). This is a consequence of the fact that in this case, most of the energy produced comes from the fuel input, which is converted with a relatively low efficiency.
4. Discussion
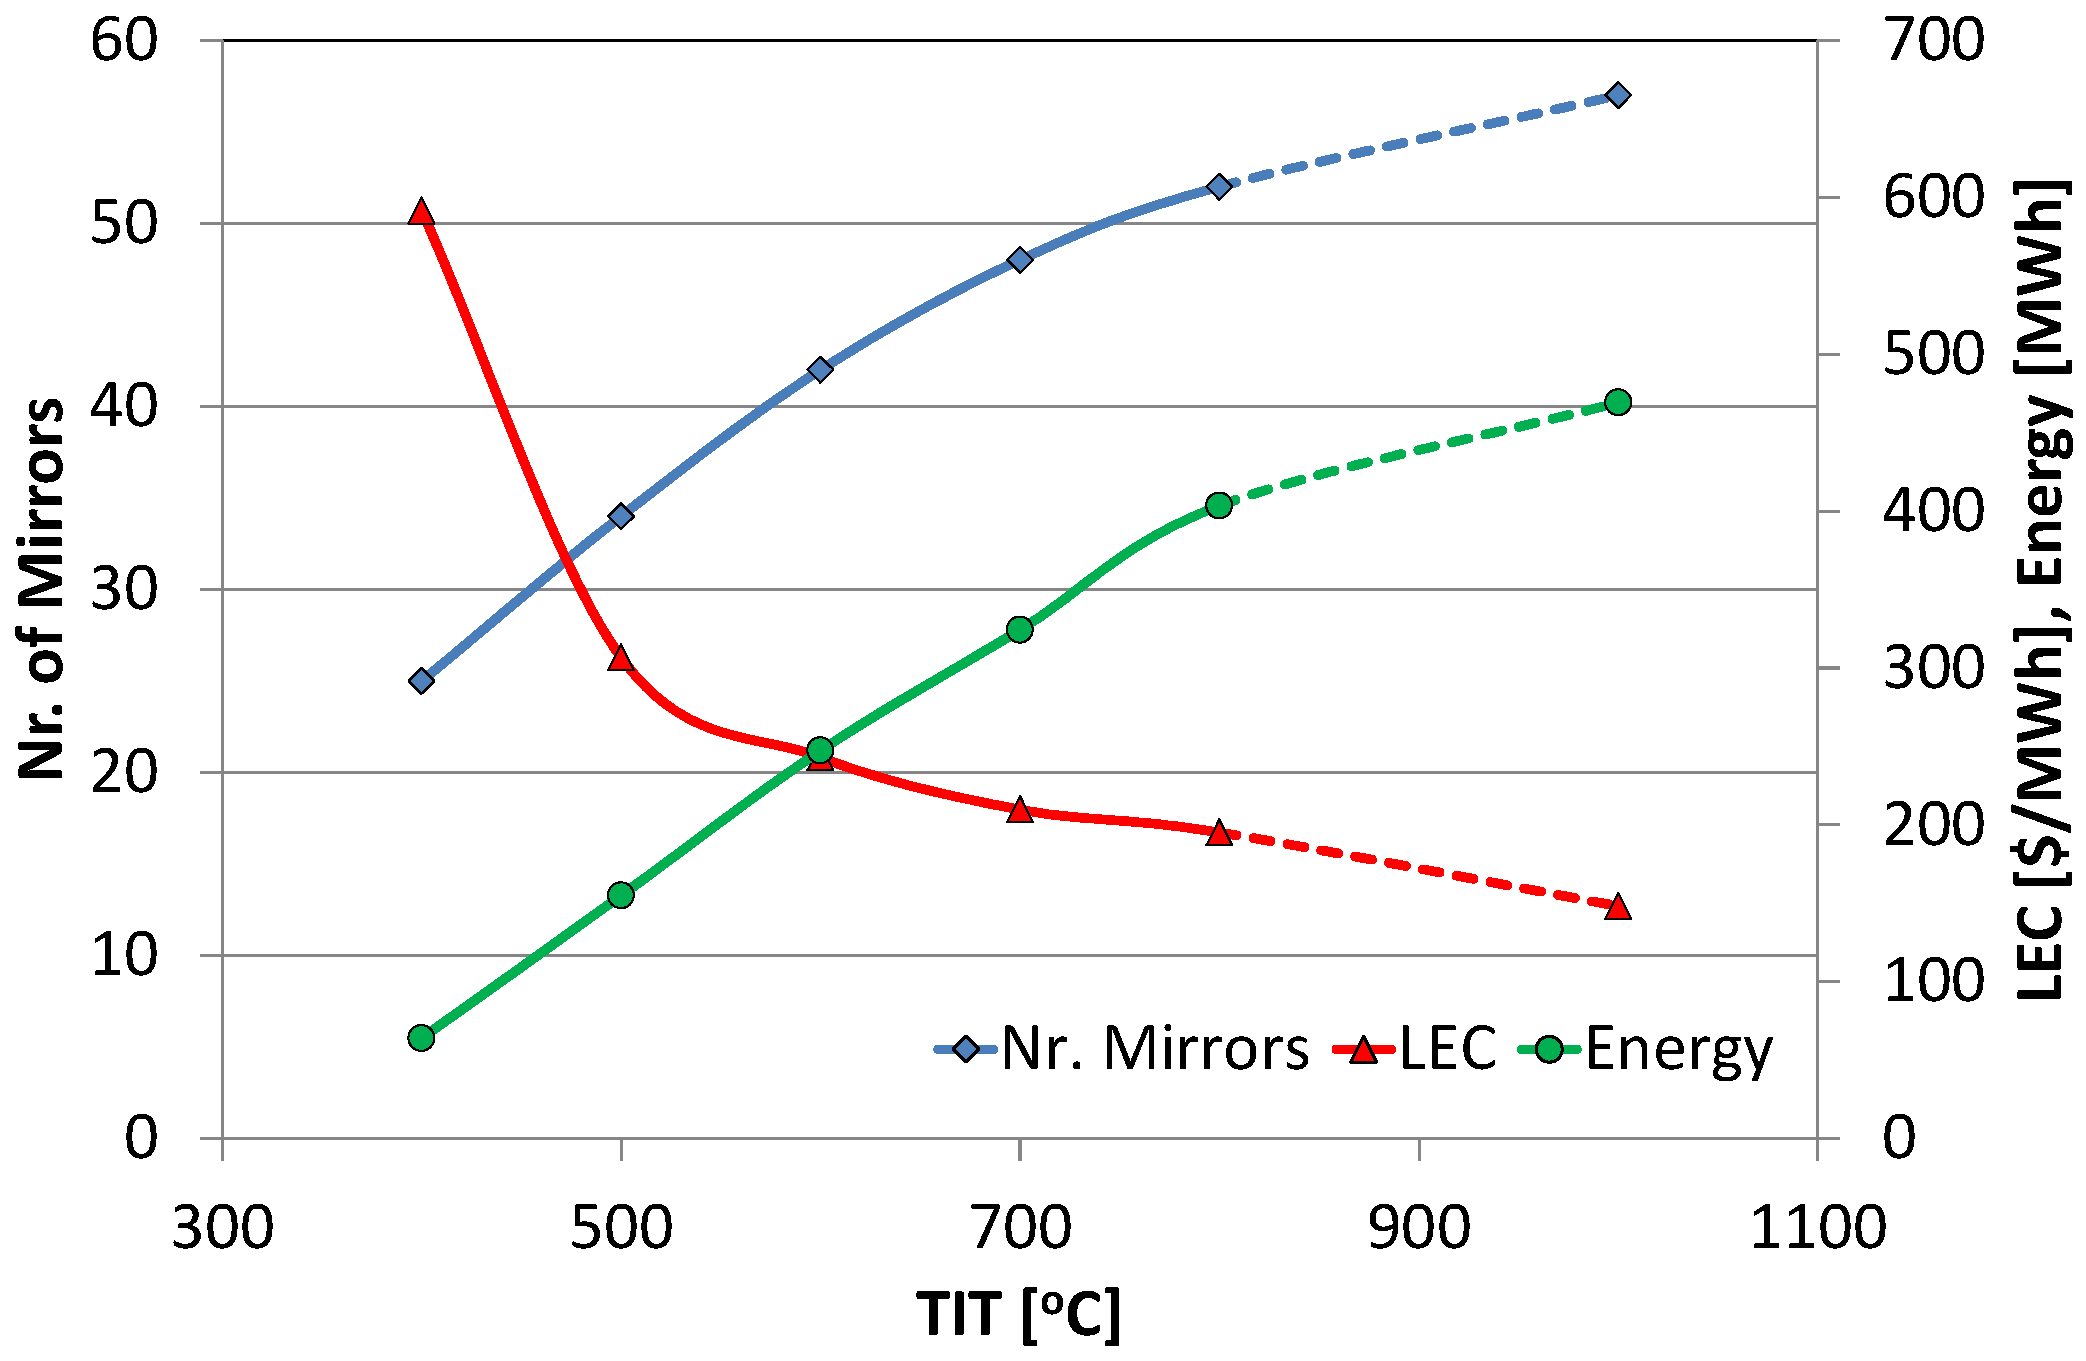
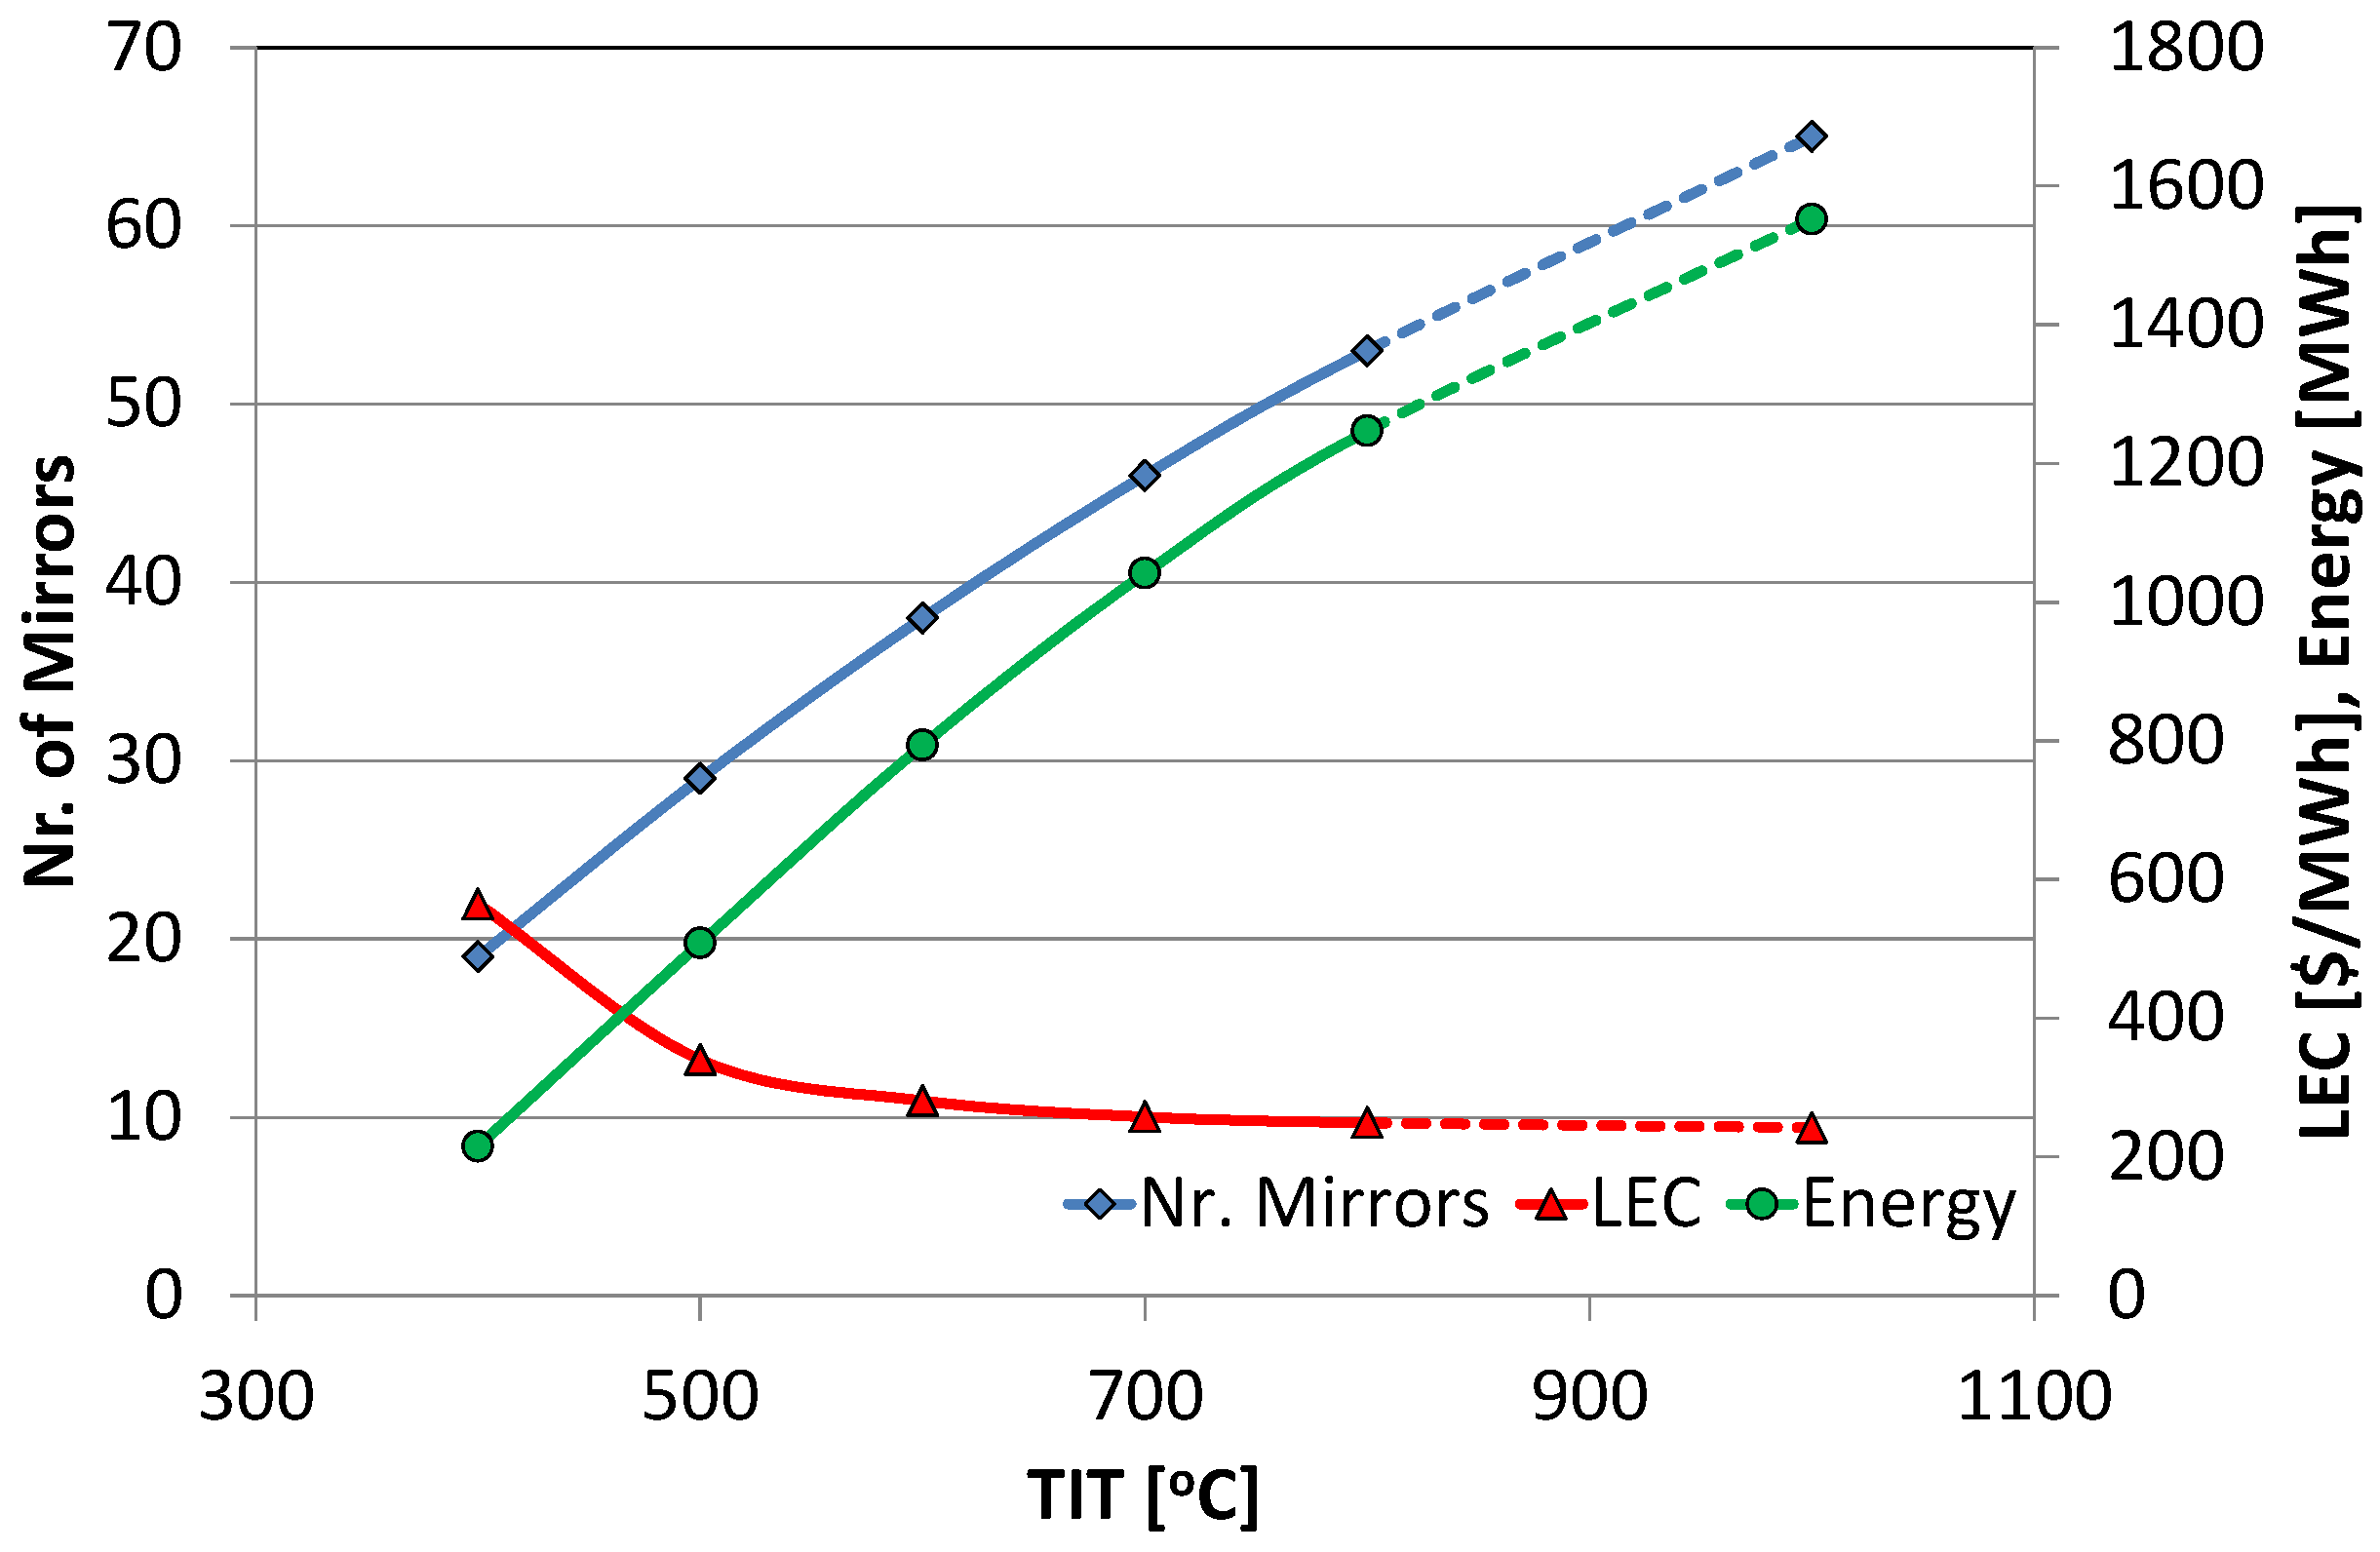
As shown above, for a given TIT, there is an optimum number of mirrors, for which LEC is minimized. The optimum LEC and the corresponding produced energy and number of mirrors in function of TIT for solar-only and hybrid configurations are summarized in Figure 9 and Figure 10, respectively. The performance in the studied range (400–800 °C) is depicted with the solid line, while the dotted line depicts the performance of the studied configurations if they could operate with higher turbine inlet temperature.
For the solar-only configuration, it is observed that the produced power increases with the size of heliostat field. This happens because of the fact that the given thermal power is only from the Sun, and thus bigger heliostat fields result in higher amount of given thermal power. Furthermore, increase of the maximum TIT is favorable because it results in an increased efficiency. Increase of the TIT results in energy increase and LEC decrease, but with declining rates (Figure 9) caused by the declining rate of thermal efficiency augmentation (Figure 2).
The comparison of solar-only and hybrid configurations shows that the solar-only configuration is more favorable because it demonstrates lower LEC due to the relative low fuel thermal efficiency of the hybrid configurations. However, this configuration has the disadvantage that the produced power is dictated by the available solar power, while in the hybrid configuration, produced power is available at any time. This disadvantage could be overcome by using energy storage configurations (e.g., batteries). Hybrid configuration could be set to operate as solar-only and set to hybrid/fuel operation only when is mandatory.
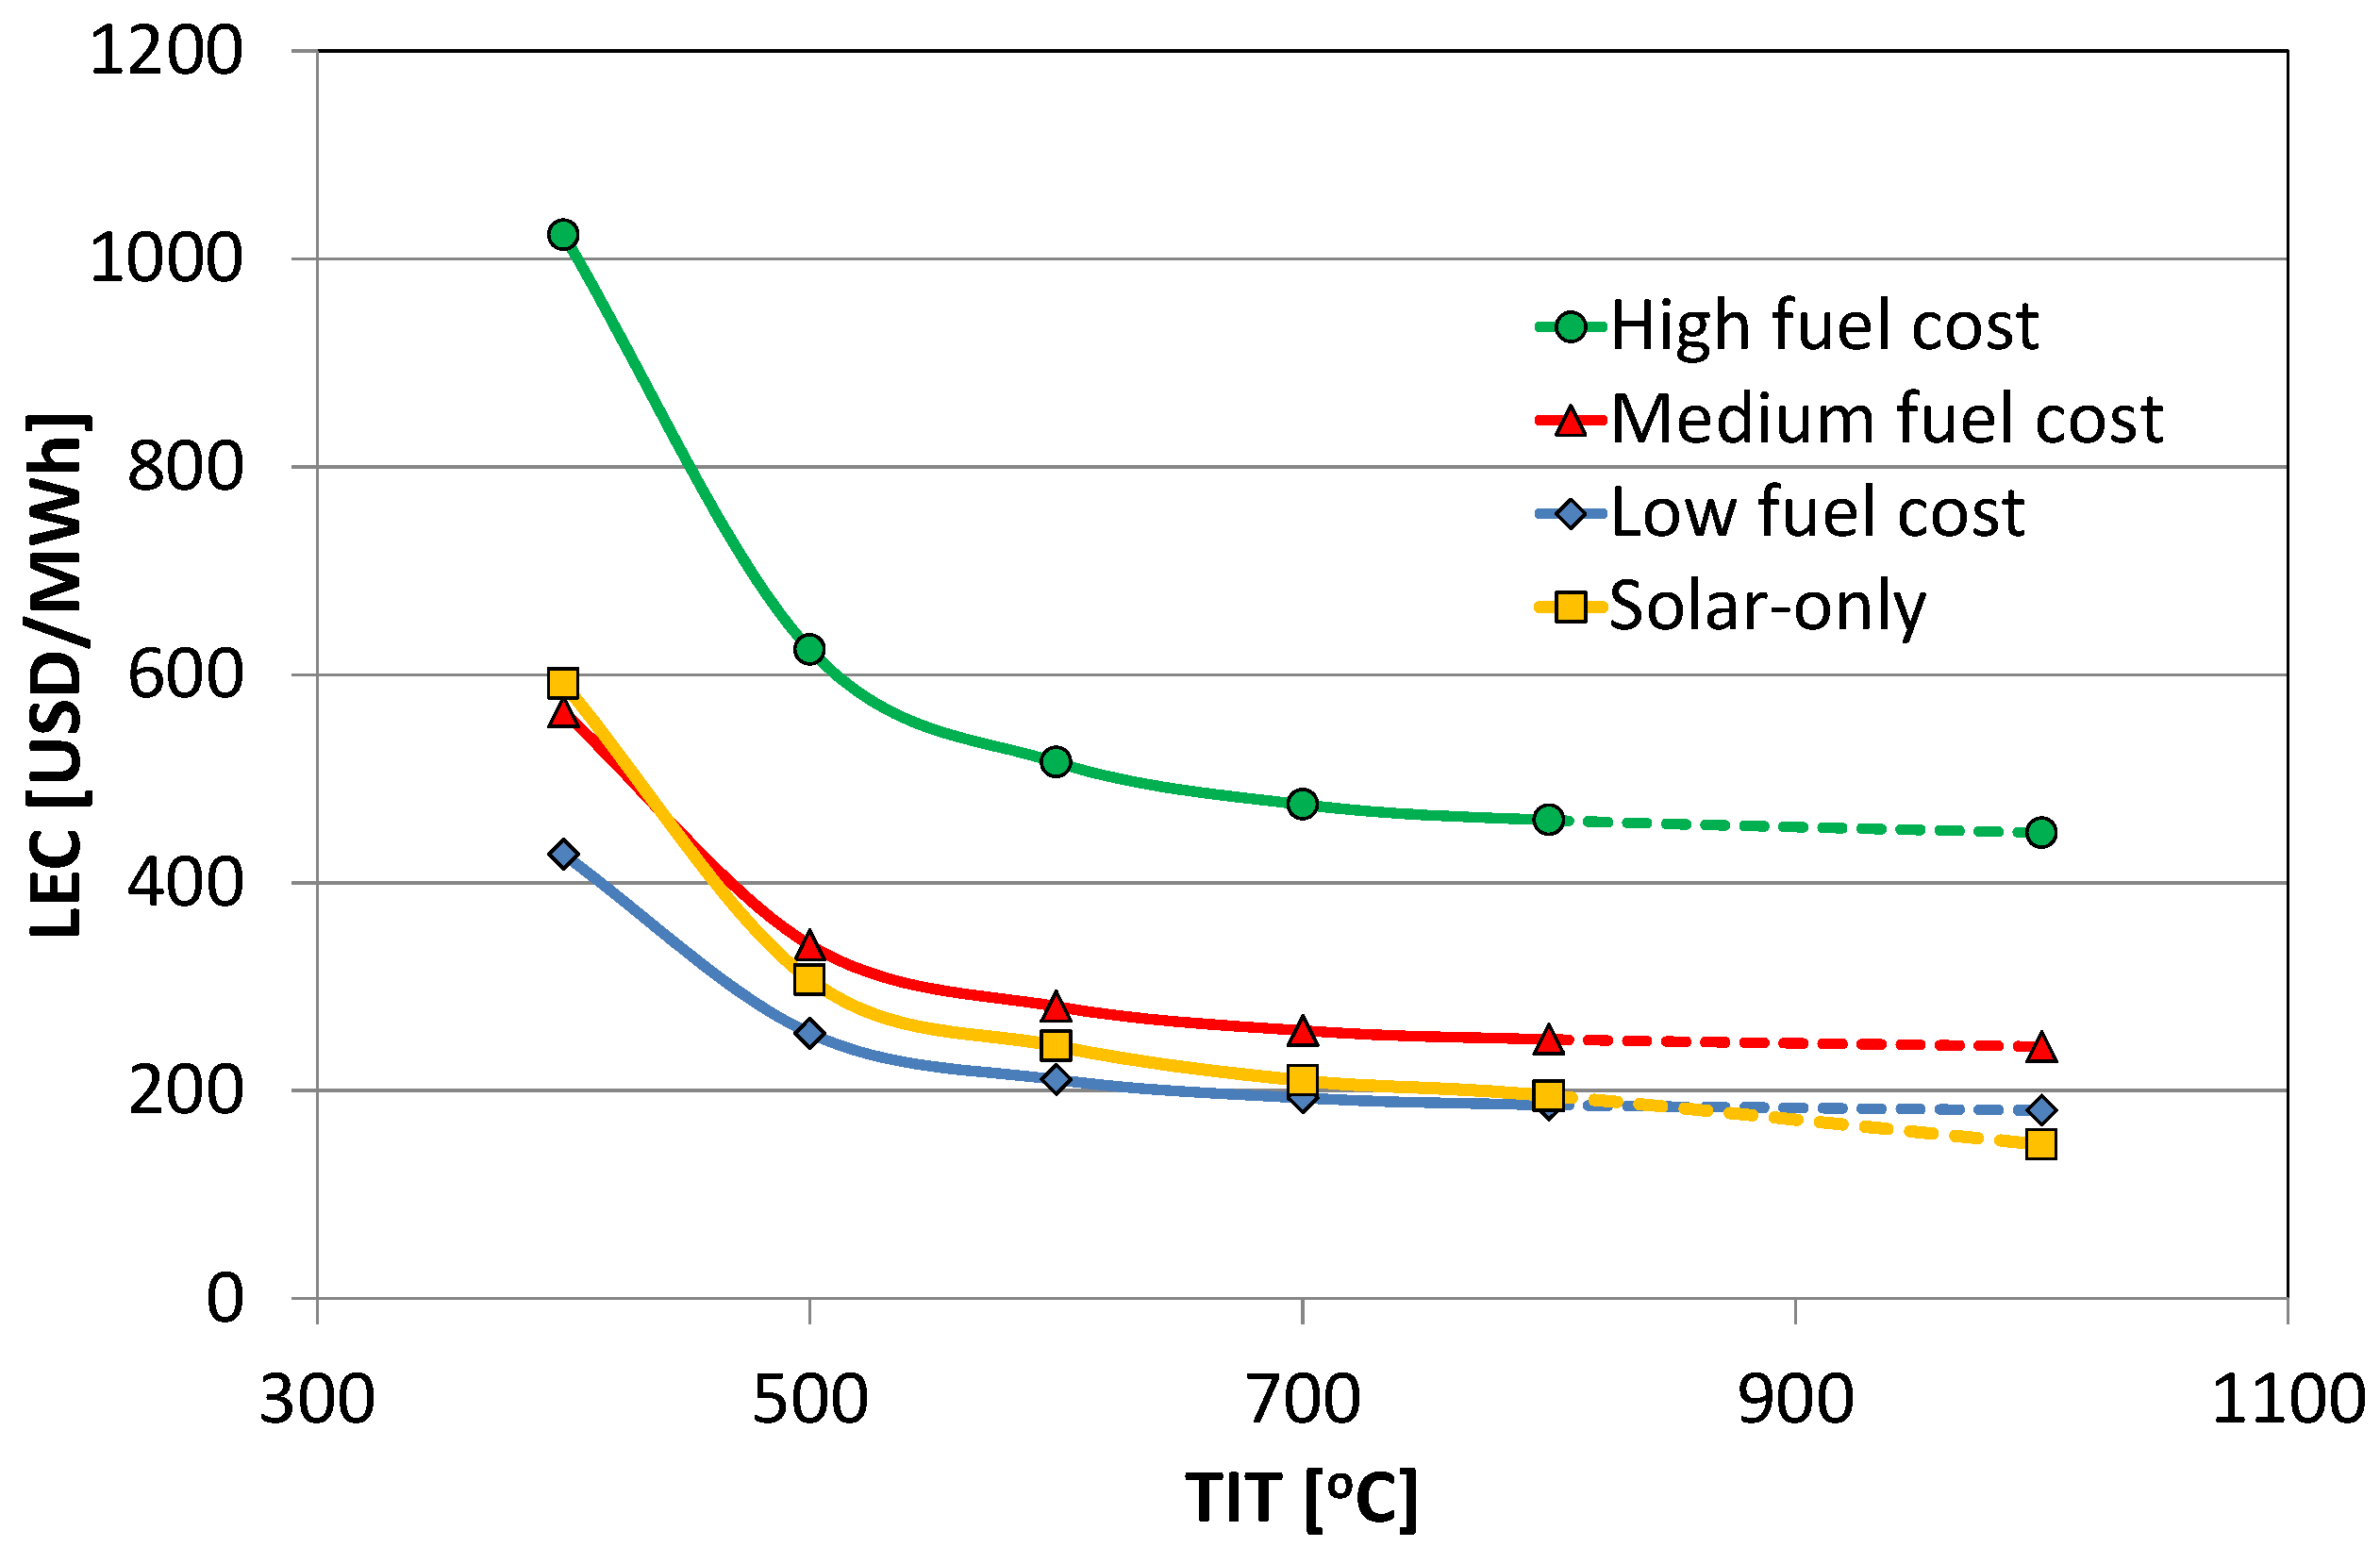
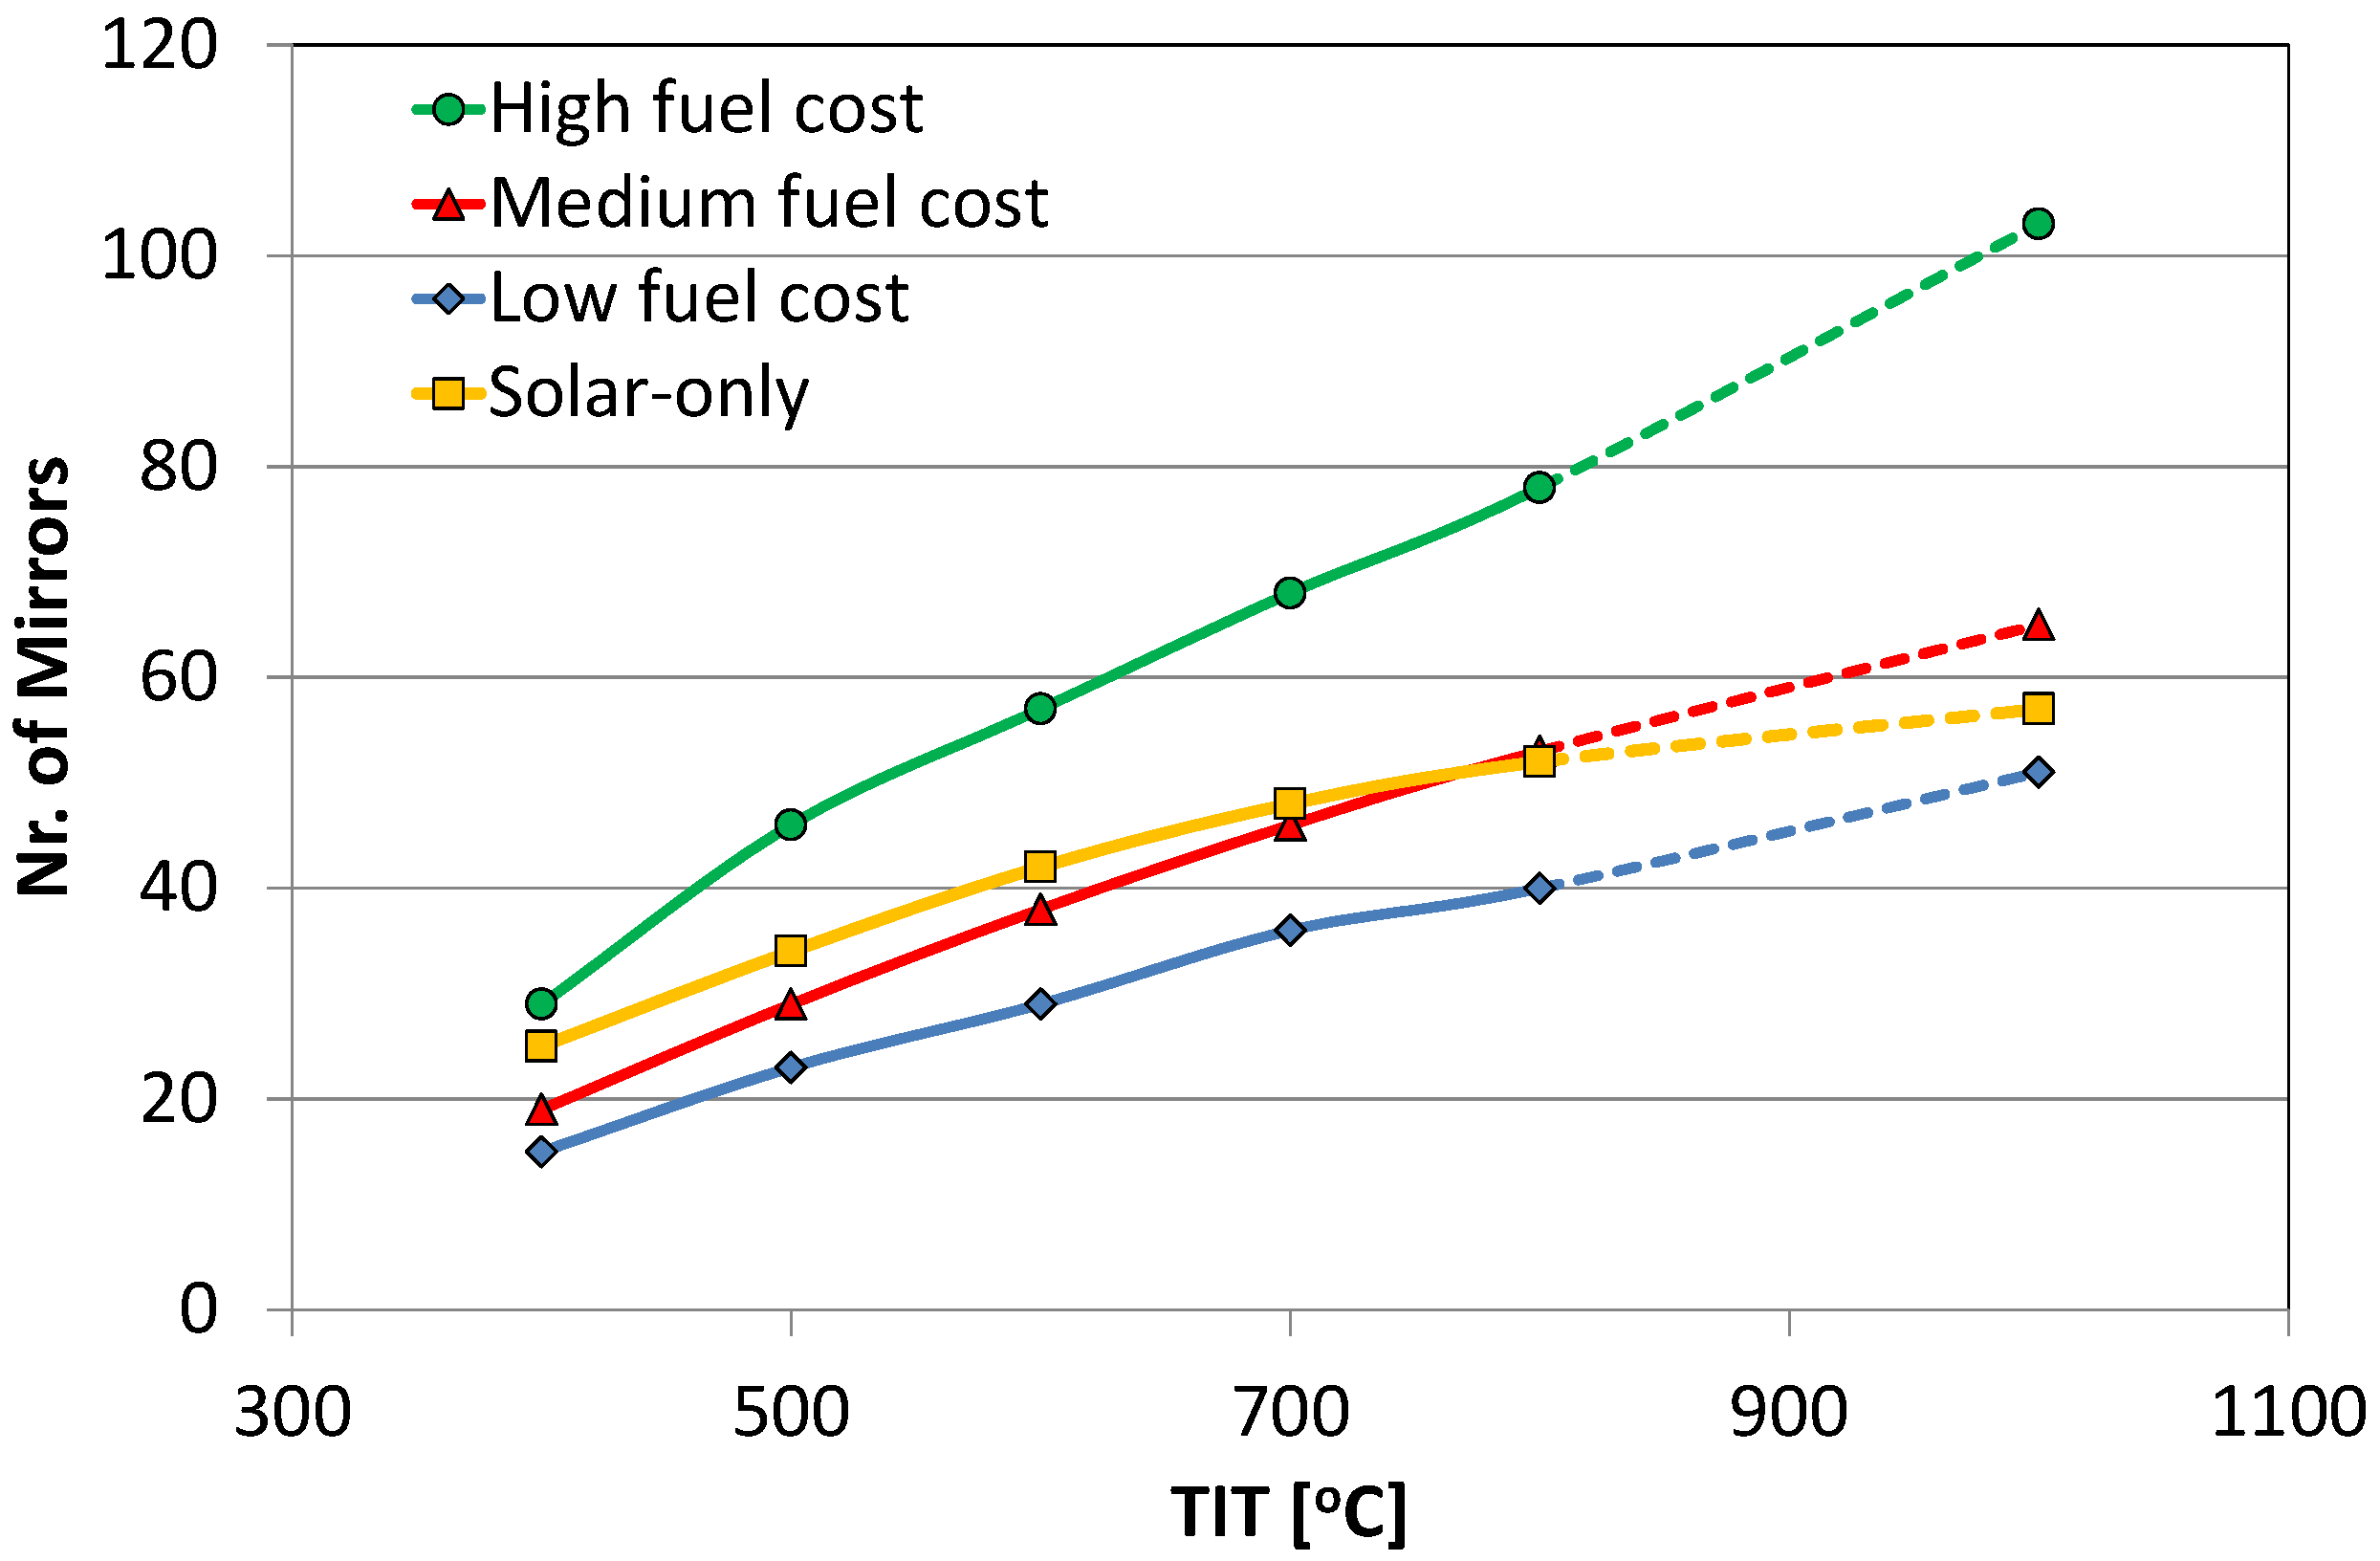
As mentioned above, fuel cost value can vary, and thus the optimum LEC obtained for the hybrid configurations may alter. In order to examine the effect of fuel cost on the performance of hybrid configuration, the optimum LEC was obtained for three fuel cost values: the two extreme ones for the period of 2012–2017 mentioned earlier and an intermediate one, the one of Table 3. The values obtained together with the one for the solar-only configuration are shown in Figure 11. Fuel cost has a strong impact on the economic performance of the plant. While solar-only LEC is altogether lower than that for hybrid, for “medium” and “high” fuel cost, the trend reverses for “low” fuel cost. Furthermore, it was found that for higher cost, the optimum LEC is obtained with a higher number of mirrors, as can be seen in Figure 12.
The results presented here show that such a configuration may be promising, as economic results for solar hybrid MGT of 100 kW show that the LECs vary in the range of 250–700 $/MWh (according to the chosen set up) [10], while the LEC of a typical diesel generator is about 500 $/MWh [10].
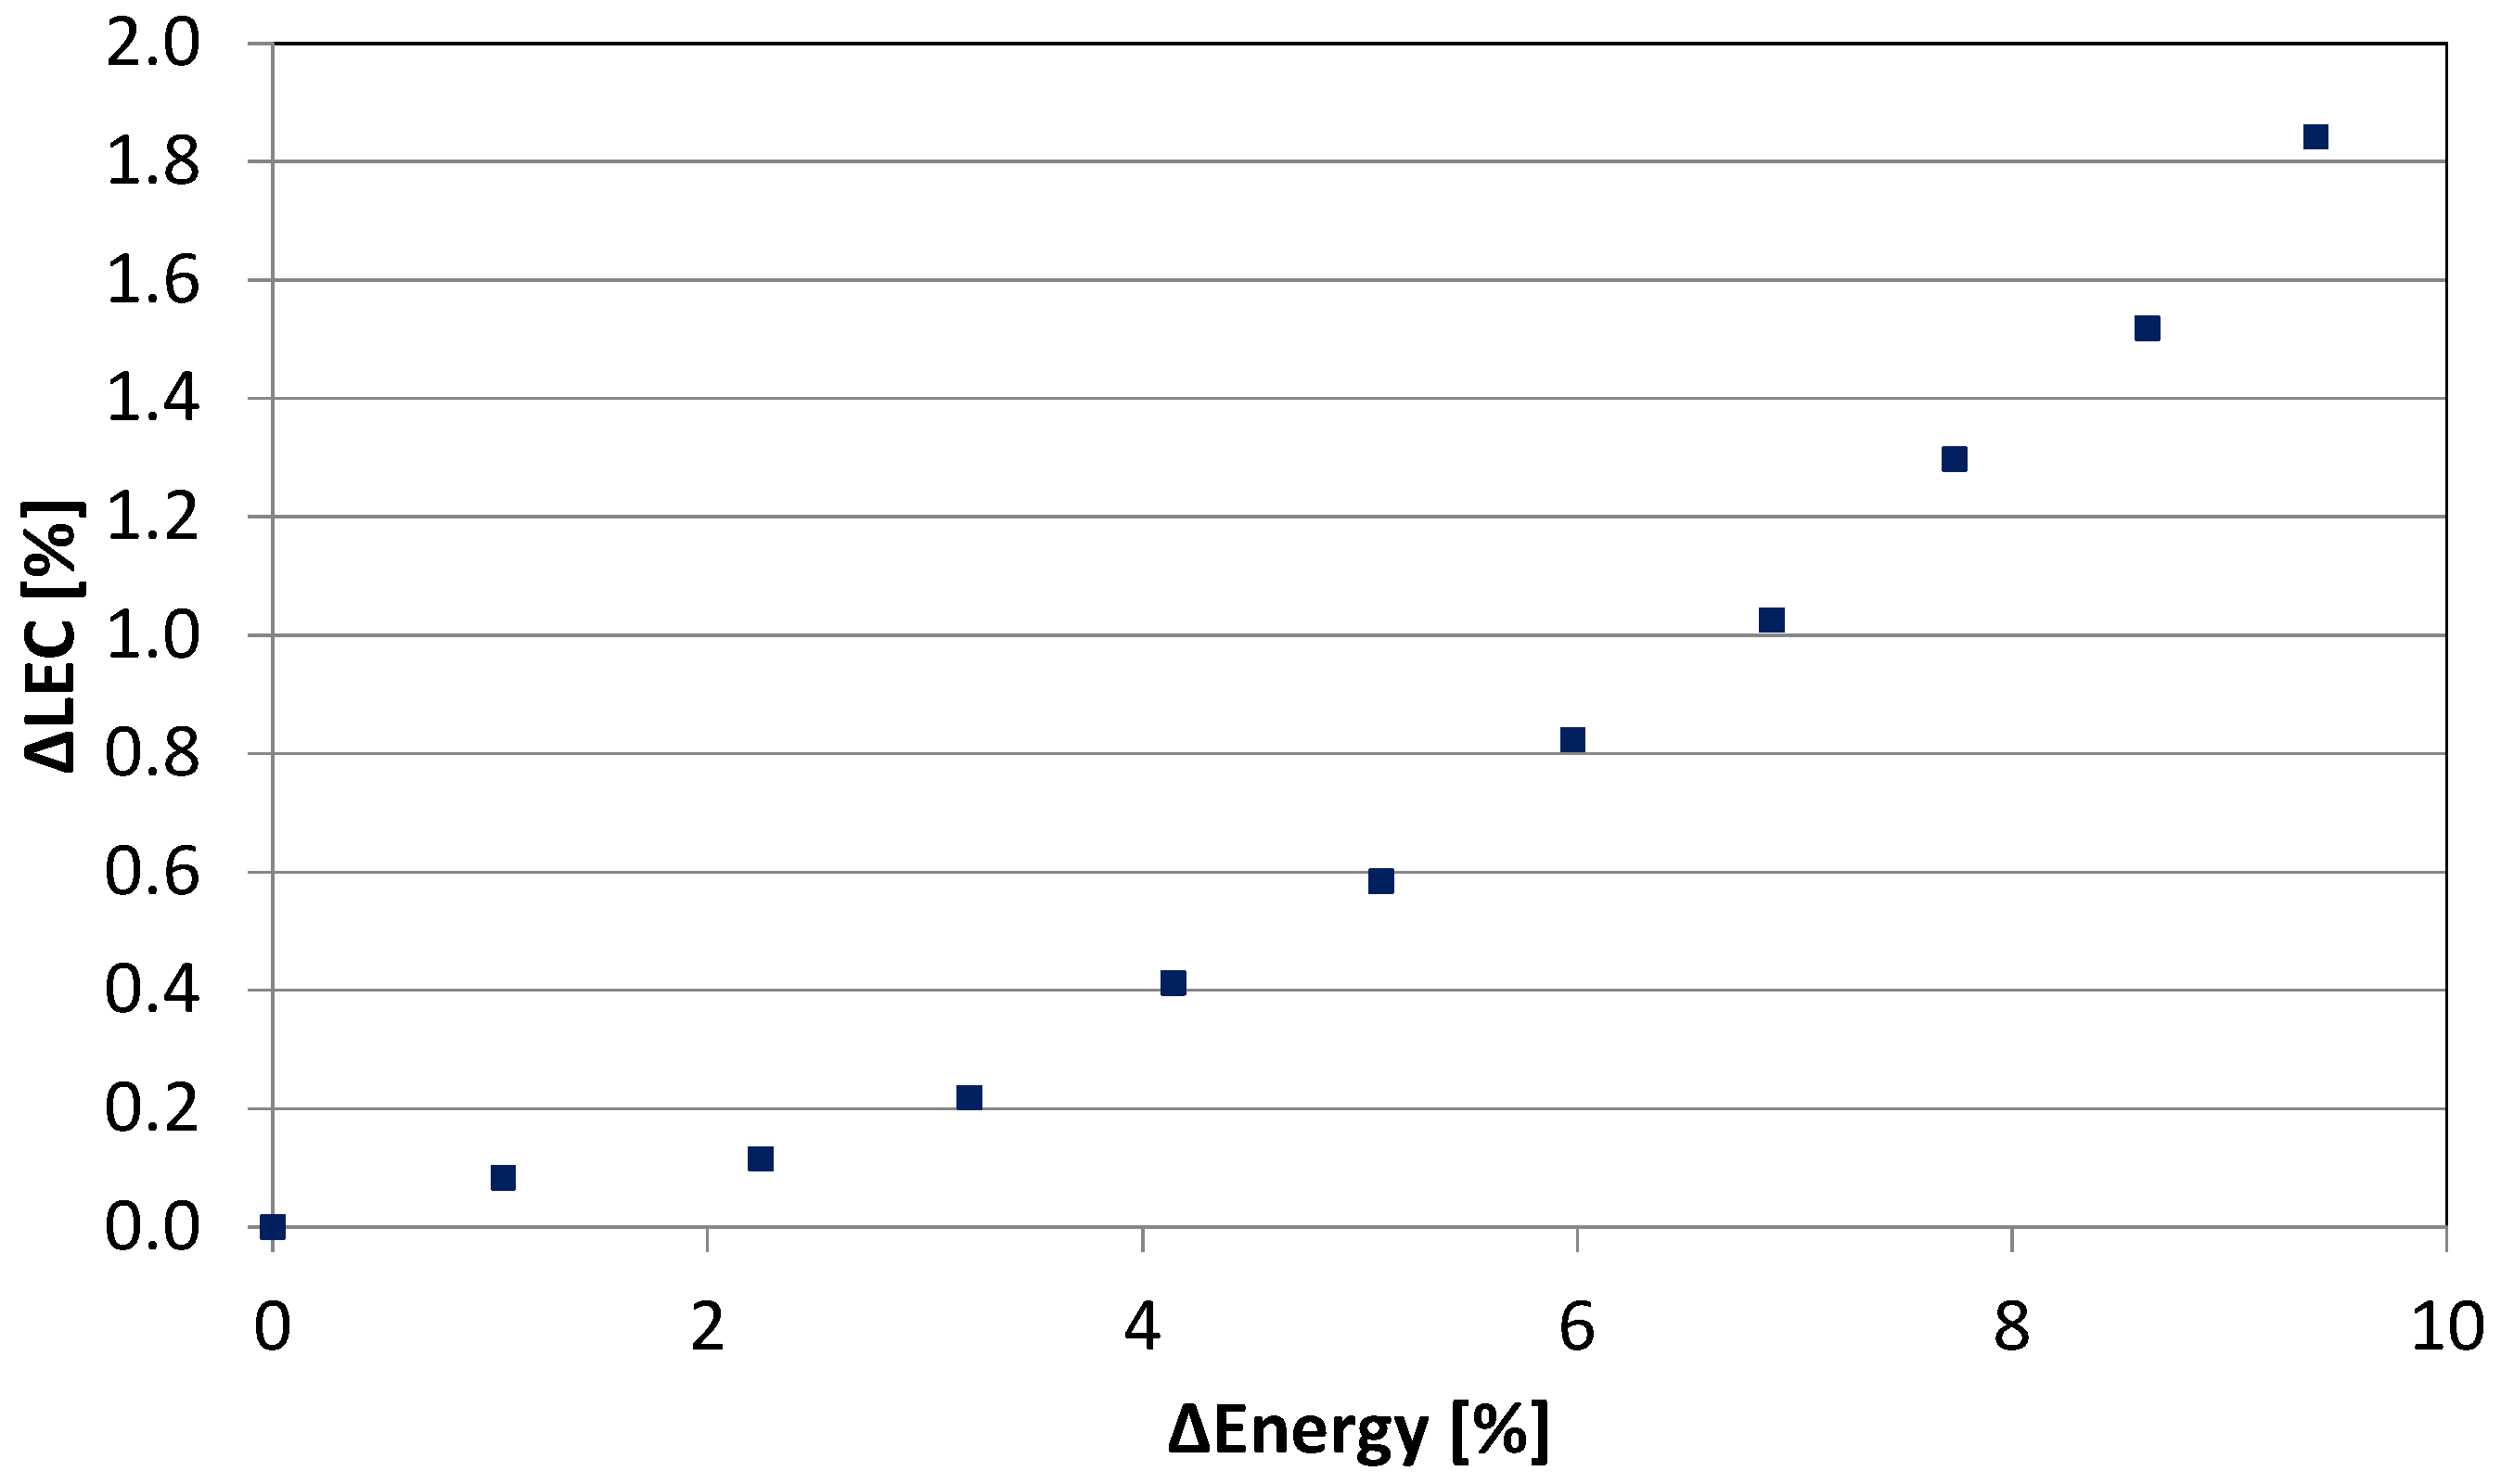
We saw that in the solar-only configuration the heliostat field size has stronger effect on produced energy than on the LEC. In other words, a bigger heliostat field will result in increased produced energy with a relative low penalty on LEC. Deviations of produced power and LEC from the values for minimum LEC, as the result of augmenting the heliostat field size, are shown in Figure 13. A significant increase of energy production can be achieved with a relatively small increase of LEC (e.g., a 9.5% increase in energy is achieved with 1.8% increase of LEC).
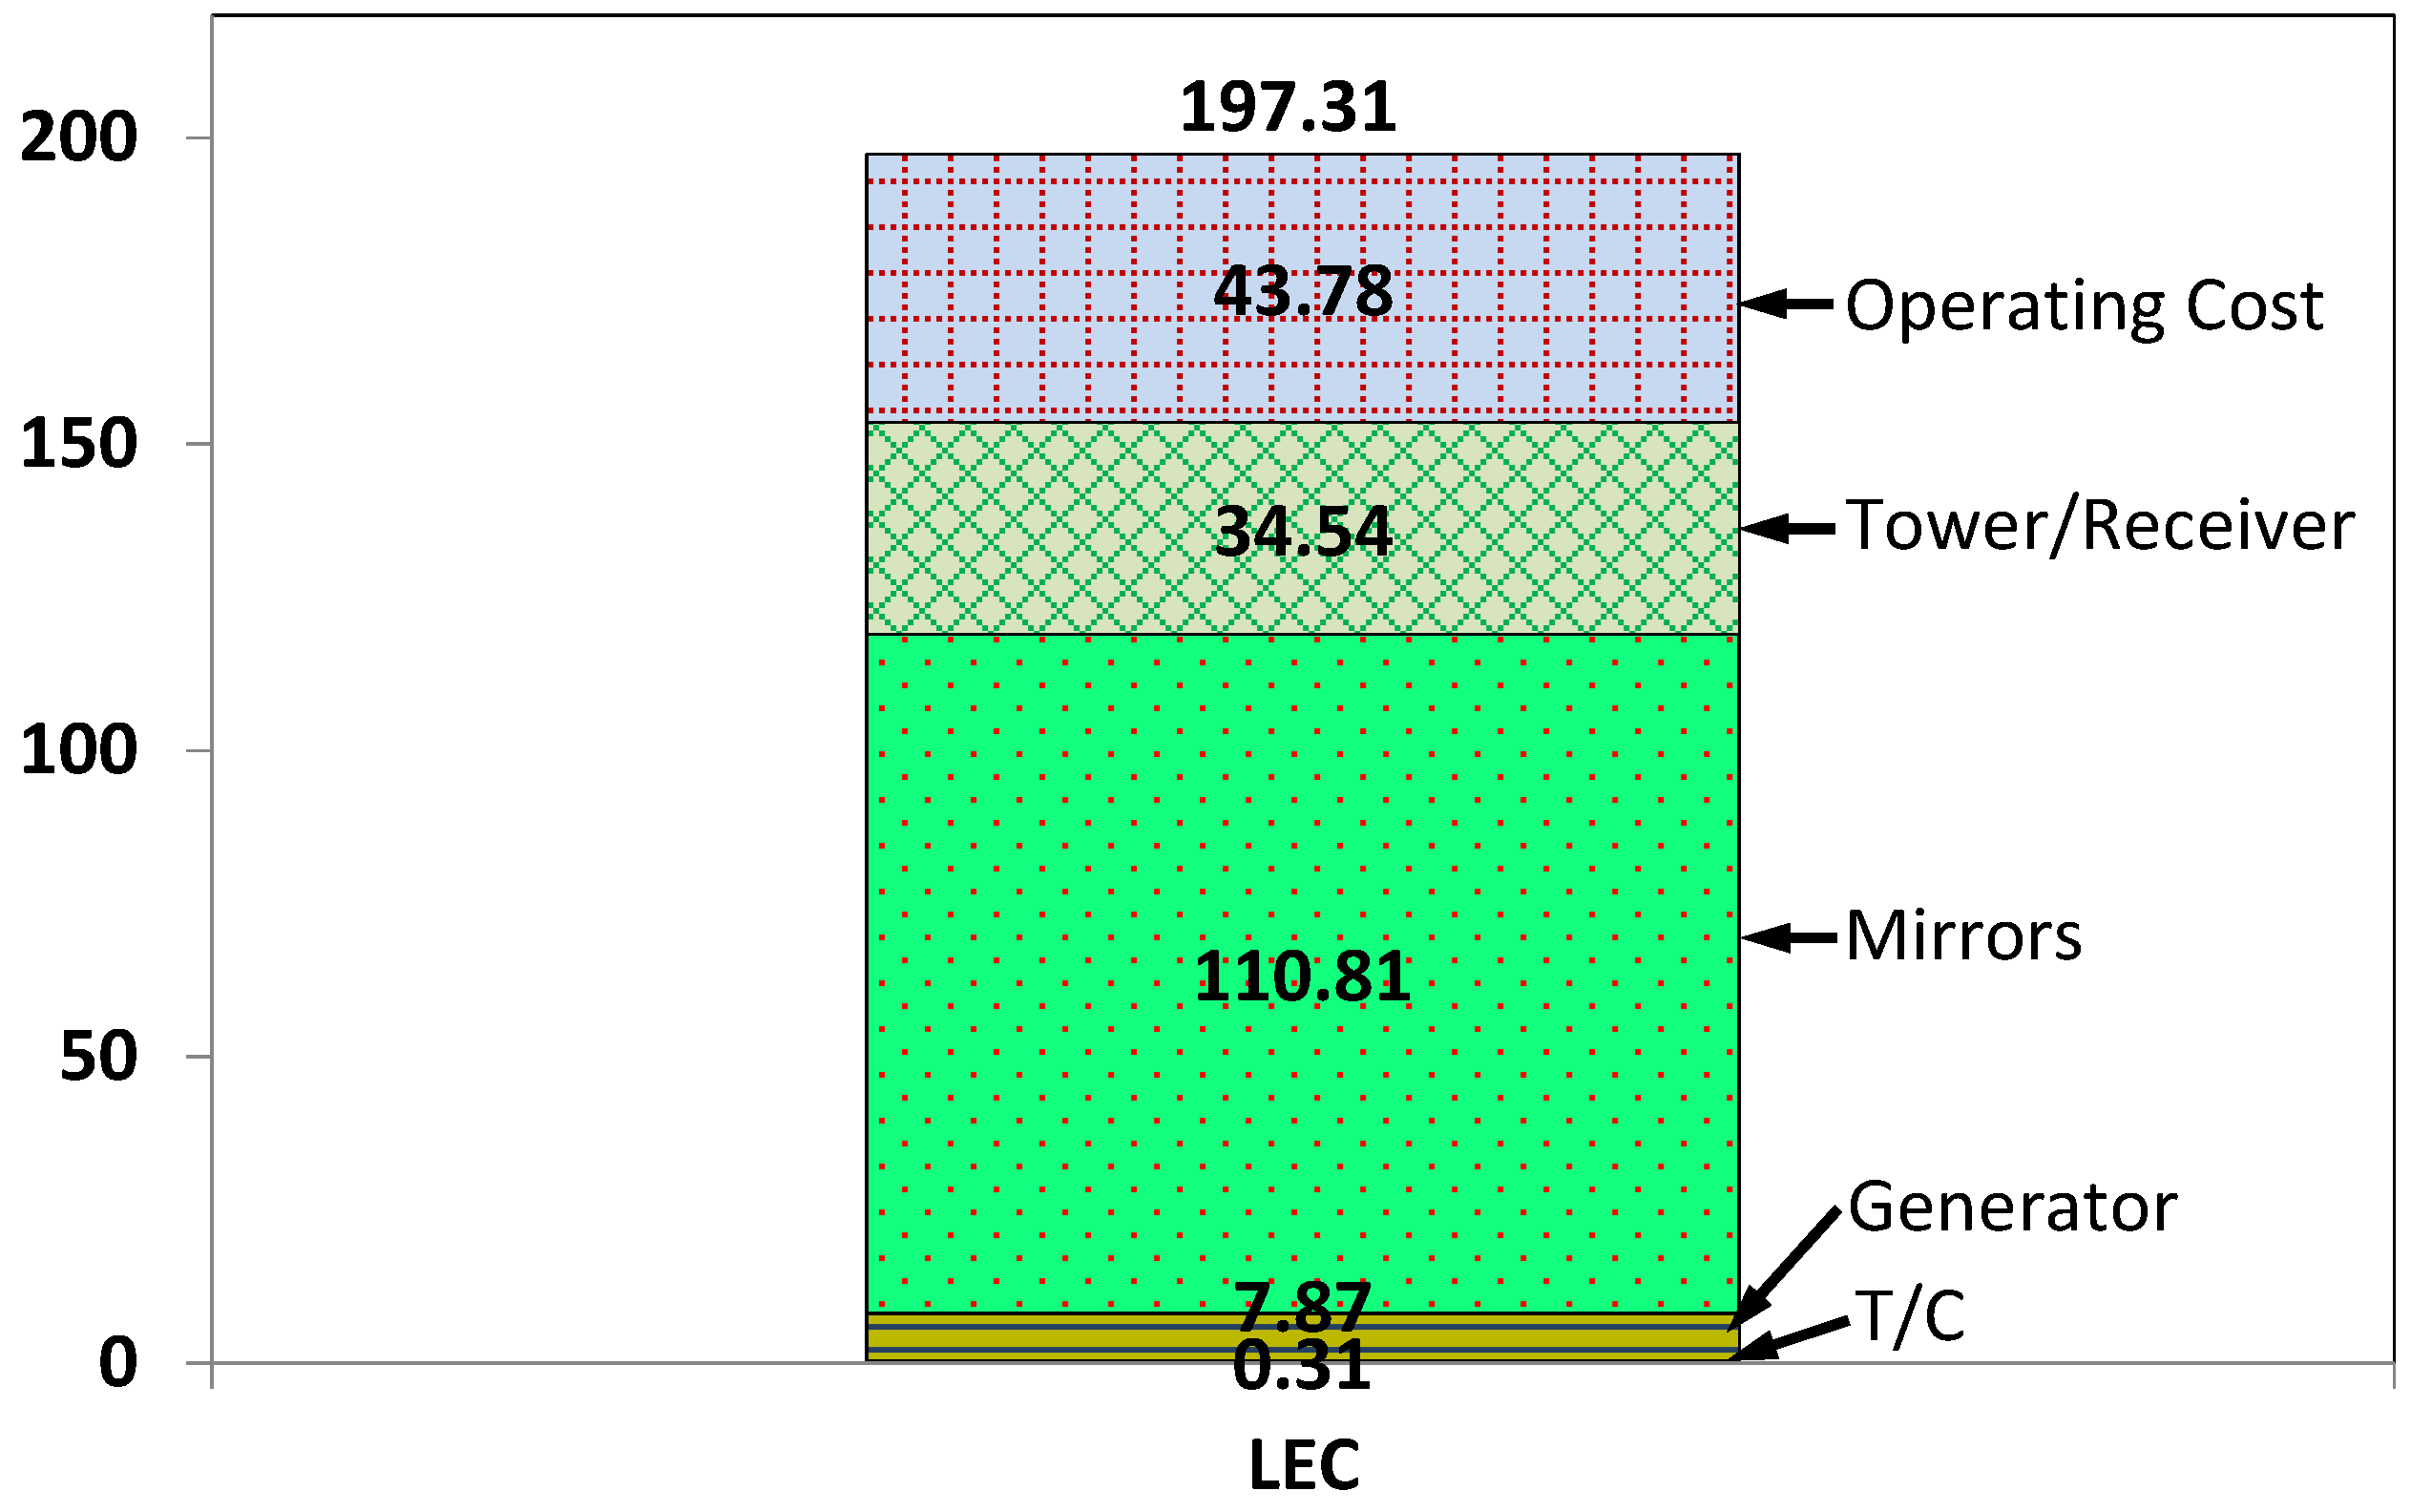
As this configuration has not related operational cost to consumed fuel, but the cost of electricity is mainly affected by the investment cost, the breakdown of LEC value is performed in order to point out the components that have the highest effect on LEC. Cost components of LEC are shown in Figure 14. The solar part, specifically the mirrors, is the main cost contributor. As the turbocharger is a low cost component, it represents a minute contribution to the overall cost (this should be compared with other estimates where power generation turbines have been used and the contribution to the total cost could be as high as 50% [25]). The dominating role of solar components on LEC, for a solar MGT, is also mentioned in the literature [17]. Configurations running solely on solar energy are capital cost intensive, the solar components being the main cost contributors [36]. As long as the cost of such components remains high, the low cost T/C is not a significant cost contributor, even though it is of lower cost than micro gas turbine. If the solar components cost reduces, however, then the relative importance of the turbine cost will be higher and the low cost T/C solution is expected to offer an advantage over more expensive micro gas turbine arrangements.
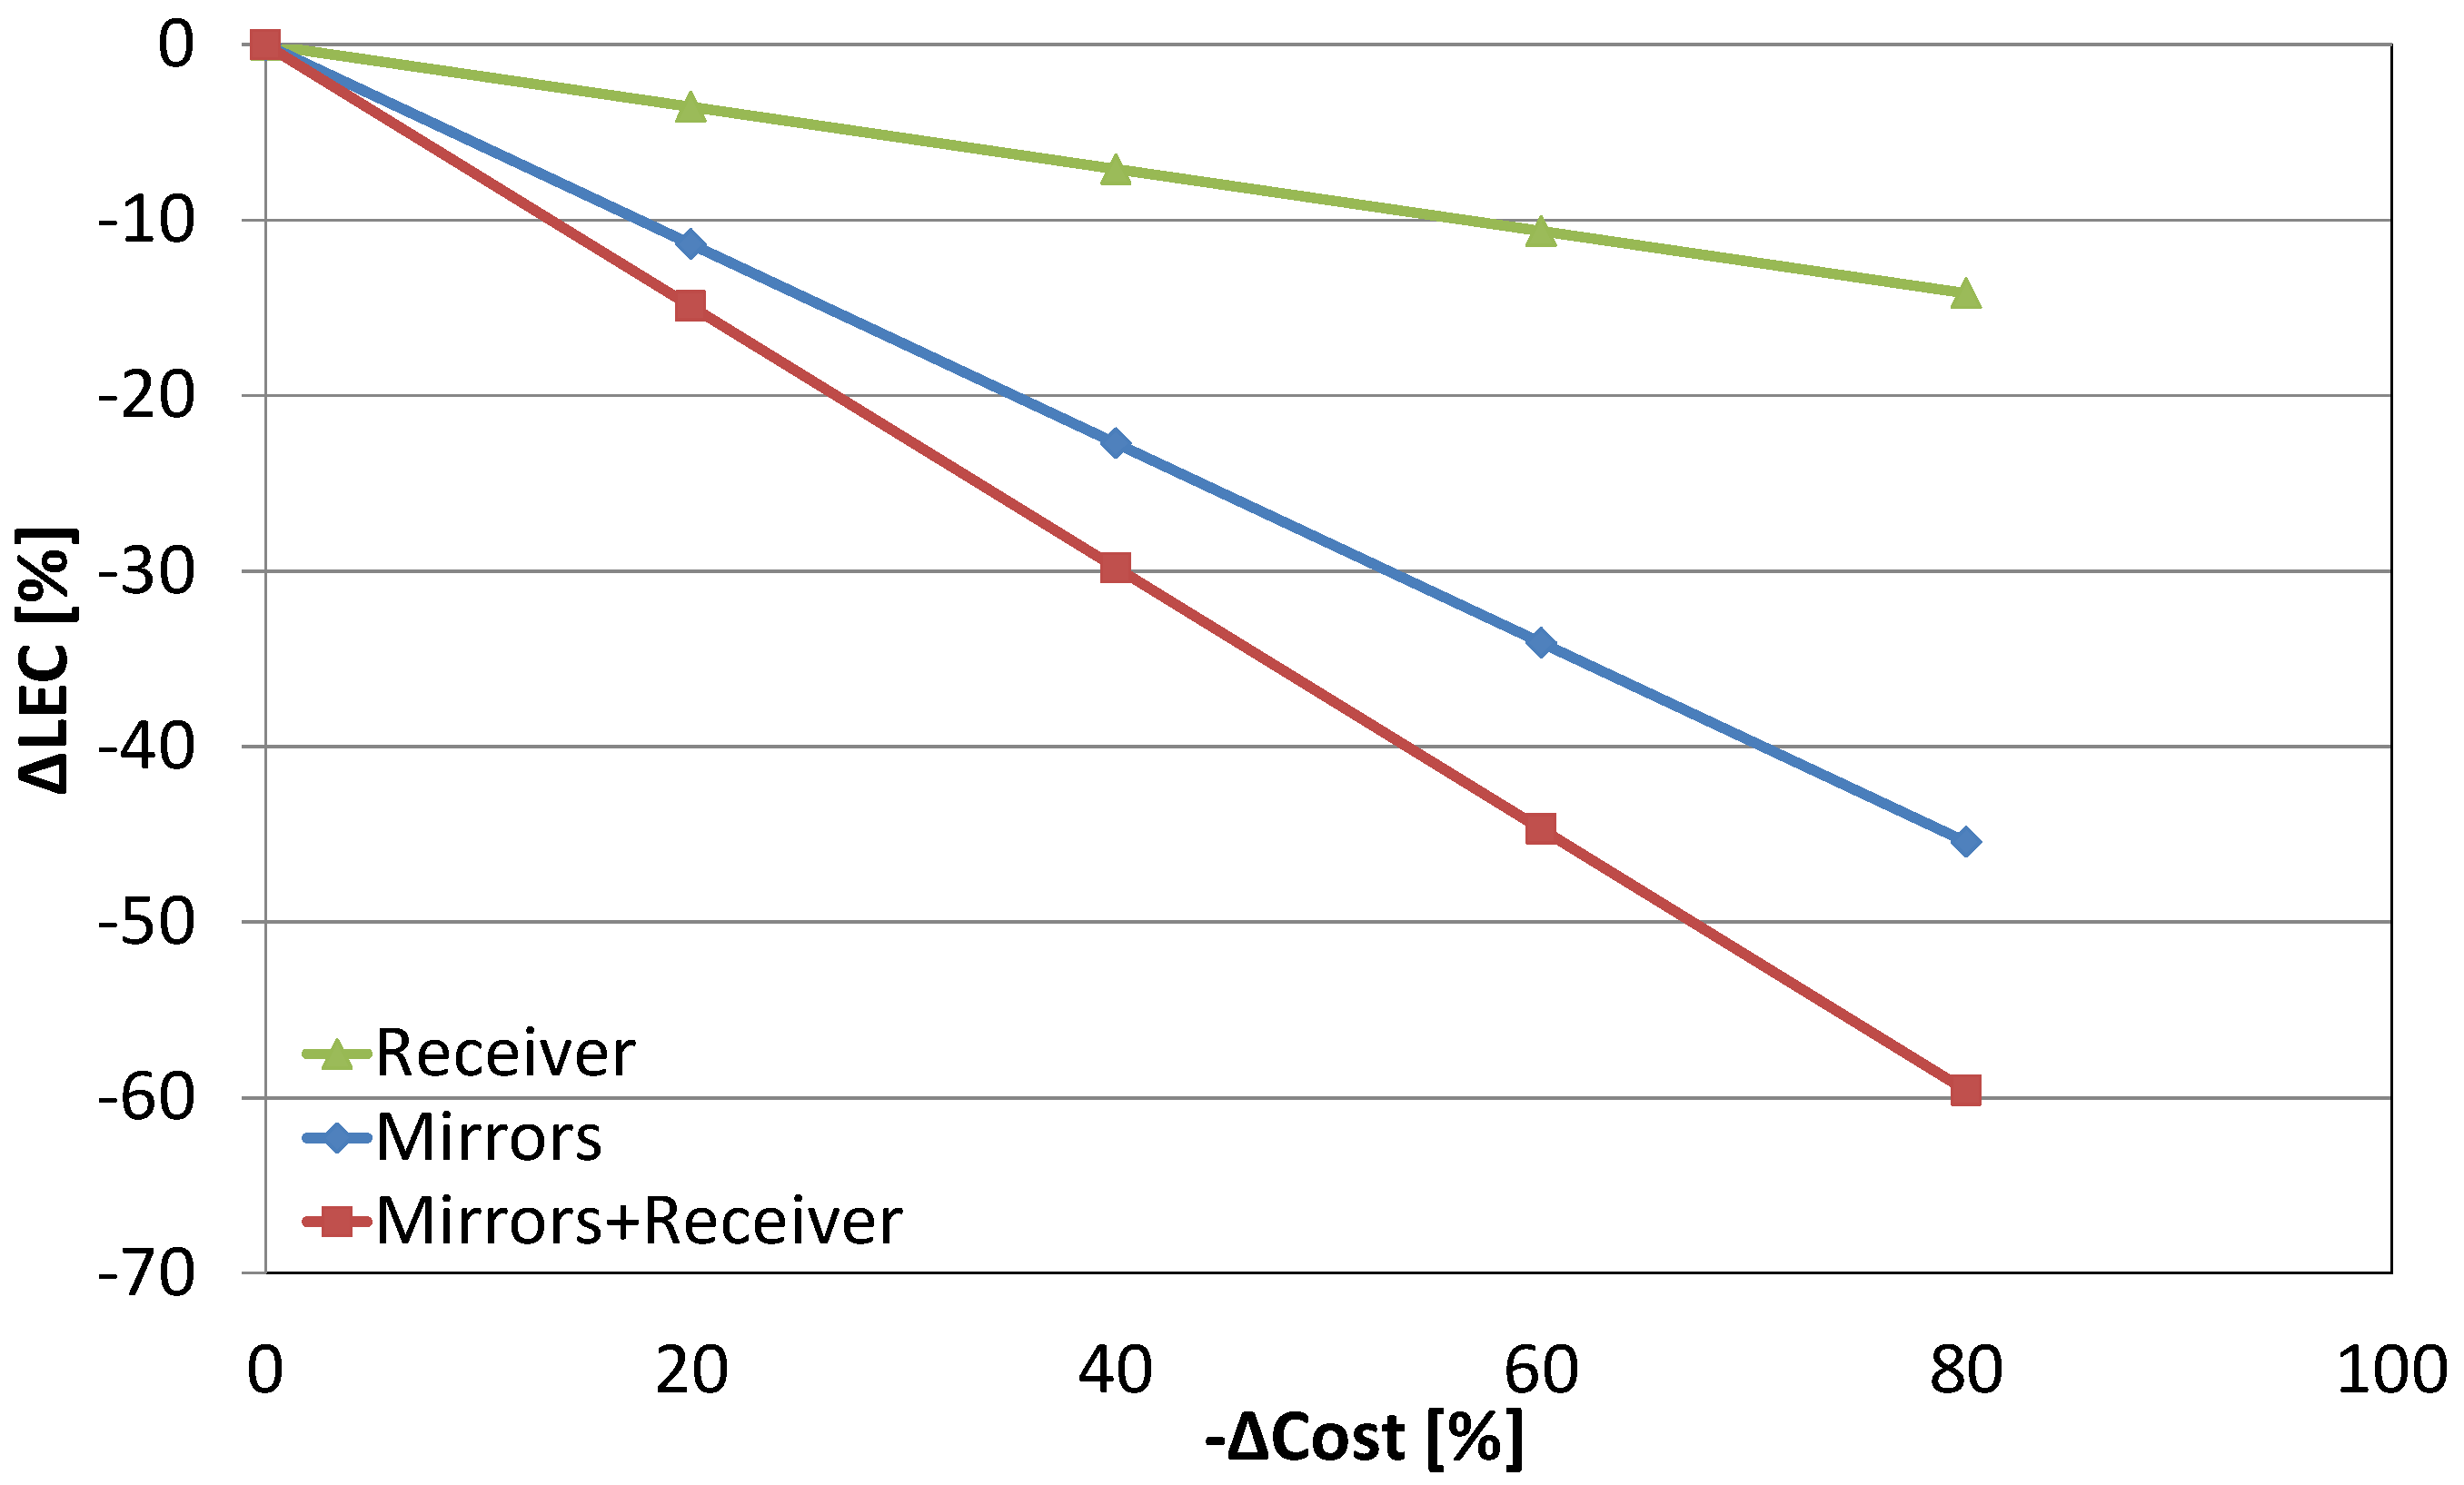
A reduction of the cost of solar parts would have a strong effect on the overall LEC. This reduction could be achieved when such configurations are in commercial stage and the needed components are mass-produced. In order to estimate the effect of investment cost reduction on LEC, the value of LEC is computed for various reduction rates of investment cost of solar components (mirrors and receiver). The decrease of LEC in function of the reduction of the solar components cost reduction, for the case of TIT = 800 °C, is shown in Figure 15. Mirror cost reduction has a more pronounced effect on LEC, as it is its main cost component. Significant reduction of solar components cost, such as those that the photovoltaics market has experienced, could make this option competitive to conventional electricity sources.
5. Conclusions
The performance of solar-only and hybrid micro gas turbine installations that could be built using diesel engine turbochargers was investigated. Ease of integration and relatively low cost make turbochargers a good candidate for materializing a solar hybrid Brayton cycle.
Solar-only and hybrid configuration performance was assessed and the effect of turbine inlet temperature (TIT) and number of mirrors was investigated. While increasing TIT favors the performance of one particular configuration, the heliostat size expressed in terms of number of mirrors can be optimized for minimizing the cost of electricity produced (LEC). The hybrid configurations lead to higher than the solar-only LEC, unless fuel prices are very low.
The cost of solar components is the major contributor to building up LEC. It is shown that if the cost of those components is significantly reduced, electricity can be produced with a competitive cost.
Author Contributions
Investigation, C.K. and N.A.; Methodology, C.K. and K.M.; Software, C.K. and N.A.; Supervision, K.M.; Validation, C.K.; Writing—original draft, C.K.; Writing—review & editing, N.A. and K.M.
Funding
This research received no external funding.
Conflicts of Interest
The authors declare no conflict of interest.
References
- Kearney, D. Solar Electric Generating Stations (SEGS). IEEE Power Eng. Rev. 1989, 9, 4–8. [Google Scholar] [CrossRef]
- Odeh, S.D.; Morrison, G.L.; Behnia, M. Modelling of parabolic trough direct steam generation solar collectors. Sol. Energy 1998, 62, 395–406. [Google Scholar] [CrossRef]
- Montes, M.J.; Abánades, A.; Martínez-Val, J.M. Thermofluidynamic Model and Comparative Analysis of Parabolic Trough Collectors Using Oil, Water/Steam, or Molten Salt as Heat Transfer Fluids. J. Sol. Energy Eng. 2010, 132, 021001. [Google Scholar] [CrossRef]
- Yamaguchi, H.; Zhang, X.R.; Fujima, K.; Enomoto, M.; Sawada, N. Solar energy powered Rankine cycle using supercritical CO2. Appl. Therm. Eng. 2006, 26, 2345–2354. [Google Scholar] [CrossRef]
- Han, W.; Jin, H.; Lin, R.; Wang, Y.; Su, J. A Novel Concentrated Solar Power System Hybrid Trough and Tower Collectors. In Volume 6: Oil and Gas Applications; Concentrating Solar Power Plants; Steam Turbines; Wind Energy; ASME: New York, NY, USA, 2012; pp. 303–311. [Google Scholar] [CrossRef]
- International Energy Agency (IEA). Tracking Clean Energy Progress; IEA: Paris, France, 2015. [Google Scholar]
- Heller, P. SOLHYCO_Final Public Report; Deutsches Zentrum für Luft- und Raumfahrt e.V. (DLR): Köln, Germany, 2011. [Google Scholar]
- EU Commission. SOLGATE: Solar Hybrid Gas Turbine Electric Power System; Directorate-General for Research and Innovation; EU Commission: Luxembourg, 2005. [Google Scholar]
- Quero, M.; Korzynietz, R.; Ebert, M.; Jiménez, A.A.; del Río, A.; Brioso, J.A. Solugas—Operation Experience of the First Solar Hybrid Gas Turbine System at MW Scale. Energy Proced. 2014, 49, 1820–1830. [Google Scholar] [CrossRef]
- Aichmayer, L.; Spelling, J.; Laumert, B.; Fransson, T. Micro Gas-Turbine Design for Small-Scale Hybrid Solar Power Plants. J. Eng. Gas Turbines Power 2013, 135, 113001. [Google Scholar] [CrossRef]
- Spelling, J.; Laumert, B.; Fransson, T. A Comparative Thermoeconomic Study of Hybrid Solar Gas-Turbine Power Plants. J. Eng. Gas Turbines Power 2013, 136, 011801. [Google Scholar] [CrossRef]
- Kitzmiller, K.; Miller, F. Effect of Variable Guide Vanes and Natural Gas Hybridization for Accommodating Fluctuations in Solar Input to a Gas Turbine. J. Sol. Energy Eng. 2012, 134, 041008. [Google Scholar] [CrossRef]
- Barigozzi, G.; Bonetti, G.; Franchini, G.; Perdichizzi, A.; Ravelli, S. Thermal performance prediction of a solar hybrid gas turbine. Sol. Energy 2012, 86, 2116–2127. [Google Scholar] [CrossRef]
- Sinai, J.; Sugarmen, C.; Fisher, U. Adaptation and Modification of Gas Turbines for Solar Energy Applications. In Volume 5: Turbo Expo 2005; ASME: New York, NY, USA, 2005; pp. 87–94. [Google Scholar]
- Pitz-Paal, R.; Dersch, J.; Milow, B. European Concentrated Solar Thermal Road-Mapping; European Commission: Luxembourg, 2005. [Google Scholar]
- Schwarzbözl, P.; Buck, R.; Sugarmen, C.; Ring, A.; Marcos Crespo, M.J.; Altwegg, P.; Enrile, J. Solar gas turbine systems: Design, cost and perspectives. Sol. Energy 2006, 80, 1231–1240. [Google Scholar] [CrossRef]
- Gavagnin, G.; Sánchez, D.; Martínez, G.S.; Rodríguez, J.M.; Muñoz, A. Cost analysis of solar thermal power generators based on parabolic dish and micro gas turbine: Manufacturing, transportation and installation. Appl. Energy 2017, 194, 108–122. [Google Scholar] [CrossRef]
- Empresarios Agrupados Internacional. EcosimPro/PROOSIS System Modelling and Simulation Toolkits and Services 2016. Available online: http://www.proosis.com/ (accessed on 5 November 2015).
- Alexiou, A. Introduction to Gas Turbine Modelling with PROOSIS, 2nd ed.; Empresarios Agrupados Internacional: Madrid, Spain, 2014. [Google Scholar]
- Kalathakis, C.; Aretakis, N.; Roumeliotis, I.; Alexiou, A.; Mathioudakis, K. Concentrated solar power components toolbox in an object oriented environment. Simul. Model. Pract. Theory 2017, 70, 21–35. [Google Scholar] [CrossRef]
- LTT/NTUA. TurboGenius 2016. Available online: https://www.ltt.ntua.gr/index.php/en/softwaremn/turbogenius (accessed on 20 December 2016).
- Galvas, M. FORTRAN Program for Predicting Off-Design Performance of Centrifugal Compressors; NASA Lewis Research Center: Cleveland, OH, USA, 1973.
- Wasserbauer, C.A.; Glassman, A.J. Fortran Program for Predicting off-Design Performance of Radial-Inflow Turbines; NASA Lewis Research Center: Cleveland, OH, USA, 1975.
- SIEMENS. Siemens Generators 2016. Available online: http://www.energy.siemens.com/hq/en/fossil-power-generation/generators/ (accessed on 18 May 2016).
- Spelling, J. Hybrid Solar Gas-Turbine Power Plants—A Thermoeconomic Analysis; KTH Royal Institute of Technology: Stockholm, Sweden, 2013. [Google Scholar]
- Krieger, G.C.; De Campos, A.P.V.; Filho, F.L.S.; De Souza, R.C. A swirler stabilized combustion chamber for a micro-gas turbine fuelled with natural gas. J. Braz. Soc. Mech. Sci. Eng. 2012, 34, 441–449. [Google Scholar] [CrossRef] [Green Version]
- De Campos, A.P.V.; Sacomano Filho, F.L.; Krieger Filho, G.C. Design Analysis of a Micro Gas Turbine Combustion Chamber Burning Natural Gas. In Volume 5: Manufacturing Materials and Metallurgy; Marine; Microturbines and Small Turbomachinery; Supercritical CO2 Power Cycles; ASME: New York, NY, USA, 2012; p. 797. [Google Scholar] [CrossRef]
- Kalathakis, C.; Aretakis, N.; Roumeliotis, I.; Alexiou, A.; Mathioudakis, K. Assessment of Solar Gas Turbine Hybridization Schemes. J. Eng. Gas Turbines Power 2017, 139, 061701. [Google Scholar] [CrossRef]
- Cambell, M. The Drivers of the Levelized Cost of Electricity for Utility-Scale Photovoltaics; SunPower: San Jose, CA, USA, 2008. [Google Scholar]
- IEA-NEA-OECD. Projected Costs of Generating Electricity; OECD Publishing: Paris, France, 2010; Volume 118. [Google Scholar] [CrossRef]
- International Energy Agency (IEA). Levelized Cost Calculation from TIMES—TIMES User Note; IEA: Paris, France, 2013; pp. 4–5. [Google Scholar]
- Darling, S.B.; You, F.; Veselka, T.; Velosa, A. Assumptions and the levelized cost of energy for photovoltaics. Energy Environ. Sci. 2011, 4, 3133–3139. [Google Scholar] [CrossRef]
- Spelling, J.; Laumert, B. Thermoeconomic Evaluation of Solar Thermal and Photovoltaic Hybridization Options for Combined-Cycle Power Plants. In Volume 3A: Coal, Biomass and Alternative Fuels; Cycle Innovations; Electric Power; Industrial and Cogeneration; ASME: New York, NY, USA, 2014; p. V03AT09A001. [Google Scholar]
- EIA. Petroleum & Other Liquids 2017. Available online: http://www.eia.gov/dnav/pet/hist/LeafHandler.ashx?n=pet&s=eer_epd2dxl0_pf4_y35ny_dpg&f=m (accessed on 15 January 2017).
- EIA. Carbon Dioxide Emissions Coefficients 2016. Available online: https://www.eia.gov/environment/emissions/co2_vol_mass.cfm (accessed on 21 October 2016).
- Semprini, S.; Sánchez, D.; De Pascale, A. Performance analysis of a micro gas turbine and solar dish integrated system under different solar-only and hybrid operating conditions. Sol. Energy 2016, 132, 279–293. [Google Scholar] [CrossRef]
Figure 1.
Solar microturbines based on a turbocharger MGT-T/C configuration.

Figure 2.
MGT-T/C power and thermal efficiency in function of turbine inlet temperature. TIT—turbine inlet temperature.
Figure 2.
MGT-T/C power and thermal efficiency in function of turbine inlet temperature. TIT—turbine inlet temperature.

Figure 3.
Performance of solar-only configuration for TIT = 400 °C. LEC—levelized electricity cost.

Figure 4.
Yearly energy output from different solar-only configurations.

Figure 5.
LEC for different solar-only configurations.

Figure 6.
Performance of hybrid configuration for TIT = 400 °C.

Figure 7.
Yearly energy output from different hybrid configurations.

Figure 8.
LEC for different hybrid configurations.

Figure 9.
Optimum LEC value and the corresponding produced energy and number of mirrors for each TIT (solar-only configuration).
Figure 9.
Optimum LEC value and the corresponding produced energy and number of mirrors for each TIT (solar-only configuration).

Figure 10.
Optimum LEC value and the corresponding produced energy and number of mirrors for each TIT (hybrid configuration).
Figure 10.
Optimum LEC value and the corresponding produced energy and number of mirrors for each TIT (hybrid configuration).

Figure 11.
Hybrid configuration optimum LEC value for three fuel cost values.

Figure 12.
Corresponding number of mirrors for optimum LEC value for three fuel cost values (hybrid configuration).
Figure 12.
Corresponding number of mirrors for optimum LEC value for three fuel cost values (hybrid configuration).

Figure 13.
Influence of changes in size of the heliostat field on electricity cost.

Figure 14.
Breakdown of minimum LEC for the solar-only configuration and the TIT = 800 °C case.

Figure 15.
Electricity cost reduction in function of solar components cost reduction.


Table 1.
Turbocharger design specifications.
| Parameter | Value |
|---|---|
| Air mass flow [kg/s] | 1.49 |
| Compressor isentropic efficiency | 0.85 |
| Turbine isentropic efficiency | 0.83 |
| Pressure Ratio | 3.69 |
| Speed [RPM] | 52,000 |
| Turbine Inlet Temperature (TIT) [°C] | 400 |
Table 2.
Added components design specifications.
| Parameter | Value |
|---|---|
| Heliostats | |
| Reflectivity | 0.97 |
| Heat interception | 1 |
| Shading–Blocking | 0.98 |
| Aperture [m2] | 64 |
| Receiver | |
| Absorptance | 0.95 |
| Optical efficiency | 0.96 |
| Emissivity | 0.05 |
| Engine Components | |
| Ducts pressure drop | 0.02 |
| Receiver pressure drop | 0.02 |
| Burner pressure drop | 0.02 |
| Shaft/Generator efficiency | 0.98 |
| TIT [°C] | (a) 400, (b) 600, (c) 800 |
| Hybrid Setup | |
| Fuel Lower Heating Value [MJ/kg] | 42.6 |
| CO2 emissions [kgCO2/MJfuel] | 0.07315 |
Table 3.
Economic data. T/C—turbocharger.
| Component | Value |
|---|---|
| Investment Cost | |
| T/C [USD] | 2000 |
| Burner [USD] | 10,000 |
| Generator [USD] | 50,000 |
| Mirrors [USD/m2] | 200 |
| Tower/Receiver [USD/MWth] | 231,000 |
| Annual Operational Cost | |
| T/C [USD] | 2% of Inv. Cost |
| Burner [USD] | 2% of Inv. Cost |
| Generator [USD] | 2% of Inv. Cost |
| Mirrors [USD/m2] | 1.1 |
| Tower/Receiver [USD/MWth] | 11,400 |
| Tower/Receiver [USD/MWhth] | 0.68 |
| Fuel [USD/t] | 465 |
| CO2 emissions [USD/t] | 5 |
© 2018 by the authors. Licensee MDPI, Basel, Switzerland. This article is an open access article distributed under the terms and conditions of the Creative Commons Attribution (CC BY) license (http://creativecommons.org/licenses/by/4.0/).
Share and Cite
MDPI and ACS Style
Kalathakis, C.; Aretakis, N.; Mathioudakis, K. Solar Hybrid Micro Gas Turbine Based on Turbocharger. Appl. Syst. Innov. 2018, 1, 27. https://doi.org/10.3390/asi1030027
AMA Style
Kalathakis C, Aretakis N, Mathioudakis K. Solar Hybrid Micro Gas Turbine Based on Turbocharger. Applied System Innovation. 2018; 1(3):27. https://doi.org/10.3390/asi1030027
Chicago/Turabian StyleKalathakis, Christos, Nikolaos Aretakis, and Konstantinos Mathioudakis. 2018. "Solar Hybrid Micro Gas Turbine Based on Turbocharger" Applied System Innovation 1, no. 3: 27. https://doi.org/10.3390/asi1030027