
Determination of Point-to-Point 3D Routing Algorithm Using LiDAR Data for Noise Prediction
by
 ,
,
Shruti Bharadwaj
1,† ,
,
Rakesh Dubey
1,†,
Md Iltaf Zafar
1,†,
Rashid Faridi
2,
Debashish Jena
3 and
Susham Biswas
1,* 1
Department of Computer Science and Engineering, Rajiv Gandhi Institute of Petroleum Technology, Amethi 229304, India
2
Department of Geography, Aligarh Muslim University, Aligarh 202001, India
3
Department of Management Studies, Rajiv Gandhi Institute of Petroleum Technology, Amethi 229304, India
*
Author to whom correspondence should be addressed.
†
These authors contributed equally to this work.
Appl. Syst. Innov. 2022, 5(3), 58; https://doi.org/10.3390/asi5030058
Submission received: 7 April 2022
/
Revised: 25 May 2022
/
Accepted: 8 June 2022
/
Published: 16 June 2022
Abstract
:Urban planning, noise propagation modelling, viewshed analysis, etc., require determination of routes or supply lines for propagation. A point-to-point routing algorithm is required to determine the best routes for the propagation of noise levels from source to destination. Various optimization algorithms are present in the literature to determine the shortest route, e.g., Dijkstra, Ant-Colony algorithms, etc. However, these algorithms primarily work over 2D maps and multiple routes. The shortest route determination in 3D from unlabeled data (e.g., precise LiDAR terrain point cloud) is very challenging. The prediction of noise data for a place necessitates extraction of all possible principal routes between every source of noise and its destination, e.g., direct route, the route over the top of the building (or obstruction), routes around the sides of the building, and the reflected routes. It is thus required to develop an algorithm that will determine all the possible routes for propagation, using LiDAR data. The algorithm uses the novel cutting plane technique customized to work with LiDAR data to extract all the principal routes between every pair of noise source and destination. Terrain parameters are determined from routes for modeling. The terrain parameters, and noise data when integrated with a sophisticated noise model give an accurate prediction of noise for a place. The novel point-to-point routing algorithm is developed using LiDAR data of the RGIPT campus. All the shortest routes were tested for their spatial accuracy and efficacy to predict the noise levels accurately. Various routes are found to be accurate within ±9 cm, while predicted noise levels are found to be accurate within ±6 dBA at an instantaneous scale. The novel accurate 3D routing algorithm can improve the other urban applications too.
1. Introduction
Town planners need to determine the noise levels at various parts of a city. Noises are primarily generated due to road traffic conditions. The noise levels vary in different parts of the city with time. The sound pressure levels in noise also vary in frequencies. Accurate prediction of noise levels is important for the determination of noisy areas of the city. It is important to adopt appropriate noise management measures. The accurate prediction of noise levels is challenging. Noises are generated by vehicles on roads before their propagation to nearby locations. Noise sources can be the point, line, or area types, depending on the sizes of the source for noise. Multiple point sources constitute line and area noise sources. The road noise is an example of a linear source, while factory noise is an area source. After generating noise from sources in roads, it propagates to nearby locations to increase the noise levels of those locations. Accurate prediction of noise levels requires the determination of all the possible routes through which the noises are propagating before reaching destinations (noise receiving points) [1]. The available noise modeling or mapping software (refer to supplementary literature review Section S1) try to integrate the sound pressure levels of sources, with their locations, and geometry of objects present between sources and receiver to predict the noise level at the receiving point. The time and space-based integration of noise levels for noise prediction often become very complex in a 3D real-world environment [2]. Existing models adopt various approximations in estimating the routes through which the noise can propagate. The parameters of geometry, orientation, and types of buildings (or other overground objects) are roughly incorporated into the models. Further, all possibilities of direct and indirect propagation of noise (i.e., through reflection, diffraction, etc.) are not considered. These approximations lead to inaccuracies. The majority of them fail to accurately predict the noise level outdoor at an instantaneous scale.
Accurate prediction of noise level at a receiving point requires ascertainment of all noise sources, which can contribute the noises to that receiving point. The routes for the propagation of noises from noise sources to a receiving point are required to be determined. Accurate estimation of source and receiving points and related routes is dependent on terrain data input. The quality and nature of terrain data can significantly impact the technique and accuracy of route determination [3,4,5].
GIS and Graph theory offers different approaches for the determination of routes using a raster or vector-based approach [6,7,8]. In graph theory, the root node is considered as the source and the goal node as the destination. In this sense, a graph is made up of vertices (also known as nodes) connected by edges (also called links). The Greedy algorithm [9], which is a type of algorithm that finds the maximum value at every node in the graph to find the shortest route, is important in this area. Even if it finds a node with a very large value throughout the search, the greedy algorithm will take that route because it cannot return. As a result, it takes some time to find an appropriate solution. The Dijkstra algorithm [10], on the other hand, seeks to determine the quickest route from one location to another based on the least weight. This can only be used for ages that are not negative. The Bellman ford algorithm is similar to Dijkstra’s, with the exception that it can also be used for negative weight. However, it takes longer to search. There is another algorithm known as the A* algorithm, which performs the search for all existing nodes. This algorithm is the combination of the greedy and Dijkstra algorithms (Madkour et al., 2017) [9]. There is also an ant colony algorithm that finds the shortest route between the nest and source of food. The genetic algorithm is the most frequently used algorithm. It can be used to find the quickest route based on the unique DNA of living creatures, which determines everyone’s property [11,12]. The graph theory-based techniques primarily work when various routes are delineated. Further, it works with the 2D transmission. The source to receiver propagation of noise works in 3D, and it does not necessarily follow a 2D road network in a city [13,14,15].
There is thus a need to develop a Point-to-Point 3D routing algorithm, customized for accurate noise prediction in the outdoor environment. It should be following the principle of physics for the determination of all the possible propagation routes between every source and receiver pair. Furthermore, the algorithm is needed to input detailed and accurate 3D outdoor terrain data (e.g., LiDAR data) for the best prediction of Point-to-Point 3D routes. Accurate routes should provide an accurate prediction of the noise level in outdoor environment [16,17,18].
The Point-to-Point routing algorithm should be compatible with high quality terrain data in 3D for accurate prediction. LiDAR offers detailed 3D terrain data of very high precision. There are also other 3D terrain data sources such as stereo-photo, Digital Elevation Model, contour, 3D Triangulated Irregular Network-TIN, etc. Some of these are in raw terrain data form (e.g., LiDAR, stereo-photo), while others are available as transformed terrain data form [19,20,21,22,23]. Building and other overground objects are required to be extracted from these unlabeled 3D data before Point-to-Point routes can be estimated. The proposed technique is required to work with all these high-quality 3D terrain data forms. The LiDAR 3D point cloud-based technique is targeted to derive an accurate solution for routing over the detailed high quality 3D data [24,25,26,27]. It is expected to improve the accuracy for noise prediction in 3D outdoor environment. The accurately determined routes can improve the accuracies in other urban applications as well, such as, determination of solar irradiance, solar shadow, view shade analysis, setting up wireless tower for a location, etc. [28,29,30].
Thus, the researchers have tried to address the following points in this paper.
- (a)
- Determination of a routing algorithm that can determine direct and other indirect routes (when the direct transmission is obstructed) between a source and destination (or receiver) points.
- (b)
- The establishment of optimal or best possible routes containing the highest energy/flow is tried to be determined.
- (c)
- Consider natural propagation of energy or pressure over 3D terrain in an outdoor environment. It did not try to find out any other algorithm which compares the existing city road networks to find the shortest route between two points.
- (d)
- The algorithm is required to find out a solution customized to handle propagation problems in 3D.
- (e)
- The algorithm should be capable of handling highly detailed and accurate 3D terrain data (e.g., LiDAR data) for the accurate determination of routes.
- (f)
- The efficiency of the route determination algorithm is required to be tested in terms of optimality of solutions.
- (g)
- The algorithm developed should be useful for accurate noise prediction and applicable for other urban applications, e.g., determination of solar irradiance, urban supply line, view shade analysis, setting up the wireless tower for a location, etc.
2. Research Gap and Need for Point-to-Point 3D Routing Algorithm for Noise Prediction Using LiDAR Data
Noise propagation modeling in general needs the incorporation of terrain and noise data into the noise prediction model. The collection of detailed terrain information along with the information of time-varying noise data is a challenge. It required the determination of routes through which noise can transmit from a source location to different noise destination (destination) locations. Traditionally noise maps are produced in 2D. These are built for a particular height, which does not show the impact of noise pollution in 3D. The noise due to interference with buildings and other structures cannot be visualized in 2D noise maps. Two-dimensional noise maps do not provide enough information for calculating the efficiency of noise mitigation measures due to the effect of barriers, building insulation material, etc.
There were also limitations in capturing accurate and dense terrain information for different noise prediction models. The limitations of models can be overcome using high-resolution 3D LiDAR data, which come in the form of the point cloud (X, Y, Z). This technique can produce accurate digital terrain data of the wide-area in quick time [1]. The terrain data are required to be processed to extract terrain features such as building, ground, and other overground objects. These are then required to be processed for the determination of terrain parameters for noise propagation modeling. The determination of terrain parameters requires the estimation of all routes for the propagation of noise between source and destination pairs. When there is no direct route noise undergoes diffraction from the top of barriers, and sides of the barrier. Noise can also reach the noise receiver (destination) after reflections from the ground or wall. Once all-terrain parameters are determined, they can be incorporated in the noise prediction model with noise data for the prediction of noise levels at noise receiver (destination) points. Thus, there is a need for the determination of a routing algorithm between any pair of points (source and receiver points). Accurate route determination is dependent on the quality of 3D terrain data. Hence, a routing algorithm is required to use 3D LiDAR point data for accuracy. Once all possible routes are efficiently be determined, these can be used for accurate noise prediction and used for other urban applications.
There are different algorithms for determination of shortest route between two points. These routing algorithms primarily work in 2D environments. Largely, the routing algorithms are used to determine the shortest route between two points in cities. Typically, in a city environment all routes are required to be laid down between any pair of points before routing algorithm can determine the shortest route. Every route is defined by all the points or vertices (in X and Y) and the vectors joining the points making the individual routes. Routing algorithms attempt to determine the shortest of all established routes in 2D. However, the issue is that the existing algorithms primarily work when routes are delineated in 2D. Establishment of routes require digitization of terrain and route data. Initial abstraction of route is the prerequisite for any routing algorithm. Inaccuracy in delineation of routes causes ineffective determination of the shortest route. Further, in the case of sound propagation modelling, sounds propagate through principal routes following the physics of propagation. The shortest routes for sound propagation work in 3D similar to the 2D shortest route discussed above. For sound propagation modeling, actual propagation routes are not limited in the 2D plane. In a real scenario, from the source point there are many routes that are possible. However, out of them, there are certain shortest routes in different directions, which form the set of principal routes. Existing algorithms are not customized to the need of these computations. The computation requires the determination of all principal propagation routes from the source point to any specific destination point. Unlike the existing routing algorithm, sound waves do not follow the network of previously laid down streets. Route determination requires extraction of all routes in 3D between the source and destination points. Once the 3D routes are determined, the algorithm is required to find the shortest route for propagation of sound waves. In the proposed research, a customized solution is evolved for extraction of routes between any pair of points (source and destination) and accurate shortest routes are determined in 3D using a highly dense LiDAR terrain point cloud. The novel solution is applicable for sound propagation modelling in 3D and for any route determination applications in cities when previously labelled routes are not available. The paper not only developed a novel algorithm of 3D routing for sound propagation modelling. It further demonstrates the 3D noise mapping with the above algorithm. Thus, in summary, the contributions of the paper are:
- Development of a novel algorithm to extract 3D shortest routes between a pair of points (source point and receiver point).
- Determination of 3D routes using unlabeled raw 3D LiDAR terrain points existing between source and receiver points.
- Determination detailed routes with highest accuracy.
- Accurate sound propagation modelling integrating noise data, and LiDAR terrain data with noise model.
Definition of terms used:
- Noise source: Source point of noise.
- Destination: Destination is where noise impact is about to calculate.
- Point-to-Point: It is pair of source and destination.
- Building Edges and corner: Edges of a building and its corners.
- Terrain data: Information of buildings, ground, trees, and other attributes.
- Terrain parameters: Route length and path difference.
- Ground and Non-ground points: Points on local ground levels. Points above the ground are non-ground points.
- Points of Intersection: Intersection points between lines.
- The route over the top of the building: Route determined from cutting plane technique that runs over buildings joining a noise source and noise receiver.
- The route around the sides of the building: Route determined from cutting plane technique that originates from the source and terminates at a receiving location traversing around the building.
- Reflected Route: Route determined where the route is formed after reflection from the ground or the nearby walls of the building (if any).
- Building Edges array: An array that contain building edges.
- Upward Route: A component of the route over top. It is the route from the source to the tallest building point.
- Downward Route: A component of the route over top. It is the route from the tallest building point to the destination point.
- Intersection Array: An array contains the intersection points between the building and cutting plane.
- Right side Route: Route from the source to destination point following the right side of the building.
- Left side Route: Route from the source to destination point following the left side of building.
- Tonal frequency: Short term single frequency sound.
3. Methodology
The proposed methodology defines the way to develop the point-to-point routing algorithm using LiDAR data. LiDAR data consists of an X, Y, Z point cloud of terrain features of buildings, ground, trees, and other objects [31,32]. Authors initially tried to establish the routing algorithm over simulated point cloud data of terrain. The simulated site for developing routing algorithm consisted of several buildings, ground, etc. (of varying height, orientation, texture, etc.). This simulated area was designed keeping different terrain complexities in mind. A MATLAB point cloud simulation program was used to generate an unlabeled 3D point cloud of building, ground, etc. Different terrain features were extracted from the point cloud data for further processing. These features were building, ground, vegetation, etc. The edges and corners of buildings were then identified and isolated separately [33].
The point-to-point routing algorithm was developed over these dense terrain data. The algorithm tried to determine all the possible routes between any pair of source and destination. These routes can be a direct route, routes over the top, routes around the sides, and the reflected routes (elaborated in the Section 4). As there is no such algorithm to determine the route, authors tried to come up with a novel cutting-plane technique [34]. The simulated terrain data were used for route determination. It was also used to determine the efficacy of route determination algorithm. The flowchart for routing algorithm, which can be used for noise prediction, is shown in Figure 1. The point cloud-based routing algorithm was also tested for its accuracy. Simulated terrain point cloud data were used to test various routes. The algorithm was also tried over the LiDAR data of RGIPT campus for noise data prediction.
Route Determination and efficacy for RGIPT campus: The routing algorithm was also tried to be trained and tested over real LiDAR terrain data and used later for noise prediction using noise modeling. The terrain data were generated for RGIPT campus using Terrestrial Laser Scanner, point cloud data has an accuracy of up to ±3 cm (mentioned in Supplementary Section S2). RGIPT campus lies in between (latitude (26.265788), longitude (81.504372)) and (latitude (26.263355), longitude (81.515723)), as shown in Figure 2. The project site has an area of 0.33 km2. Adjoining the campus, there is a railway line, which is the primary source of noise pollution for the campus [35]. The locations for noise sources and receivers (destinations) in the RGIPT campus were ascertained. All the routes were determined between every pair or source and destination. Next, the terrain parameters were determined for every route and incorporated inside a noise propagation model for noise prediction. Efficacy of noise prediction was also tested with ground noise data for the campus.
The detailed data processing worked on various stages such as LiDAR data acquisition, building extraction, building corner estimation, and the route determination (Route over the top, routes around the side, and reflections). All these routes were used to determine the terrain parameters and noise mapping. Stepwise processing and results were given below in Figure 3.
3.1. LiDAR Data Acquisition
LiDAR data acquisition was performed by Terrestrial Laser Scanner which provides data in the form of (X, Y, Z) point cloud. LiDAR data acquisition was done for simulated area and for the RGIPT campus [35]. Further details for data acquisition are provided in Supplementary Section S2.1.
3.2. Building Corner Extraction Step 1 to Step 3
In order to extract the building corners and the Building edges from the LiDAR data [36] (Further results are provided in the Supplementary Section S2.2).
Step 1: Extraction of elevated data after subtraction of BEM from DSM, where building of RGIPT campus is shown in (Figure S6a–d) of Supplementary File.
Step 2: Extraction of building edges and corner points from the elevated data in step 1. Corner points for each building were determined (Figure S7a–c of Supplementary File) and stored separately in an array by using the minimum and maximum criteria of x and y.
Step 3: Building corners for each building were extracted in the form of array [33]. Where (x1, y1) is one of the building corners.
For N buildings, building corners are b = ((N − 1) × 10) + 1
3.3. Route Determination for Direct Route and Indirect Route Step 4 to Step 19
Different routes were determined, which described how noise propagated from various sources (car, bus, train, etc.) to reach different locations. They could travel through direct or indirect routes after diffracting (around the building), reflecting (from the wall) over different surfaces. The basic flowchart for routing determination is shown in Figure 4. In absence of building or obstructions between source of noise and its destination, the route was considered direct [37]. The terrain parameter for the direct route was considered to be the Euclidian distance between source and receiver. Indirect route determination processing steps are given below (Figure 4).
Direct Route: Direct route is extracted when there was no obstruction between a pair of source and destination.
Indirect Route: Indirect routes were the routes that required diffracting or reflecting points, as given below in Figure 5. There were 12 principal routes (P1, P2, P3, P4, P5, P6, P7, P8, P9, P10, P11, P12) for noise propagation, as shown in Figure 5. Routes were demonstrated over simulated LiDAR terrain data. Principal routes for the route over the top, around the sides and reflection routes are indicated here. P1 = Source − t1 − t2 − Destination, P2 = Source − R1 − t1 − t2 − Destination, P3 = Source − t1 − t2 − R2 − Destination, P3= Source − R1 − t1 − t2 − R2 − Destination. Principal route with respect to route around the right side and reflection routes P5 = Source − rs1 − rs2 − Destination, P6 = Source − R3 − rs1 − rs2 − Destination, P7 = Source − rs1 − rs2 − R4 − Destination, P8 = Source − R3 − rs1 − rs2 − R4 − Destination. Principal route with respect to route around the left side and reflection routes P9 = Source − ls1 − ls2 − Destination, P10 = Source − R5 − ls1 − ls2 − Destination, P11 = Source − ls1 − ls2 − R6 − Destination, P3 = Source − R5 − ls1 − ls2 − R6 − Destination.
To understand the noise propagation, noise route determination was needed. A simulated area that consisted of a set of buildings was used for this purpose. The area contained buildings A, B, C, D, E, and F, which were of different heights and orientations. The area also contained a pair of source and destination points. The simulated area is shown in Figure 6a.
3.3.1. Route over the Top (Step 4 to Step 9)
Authors understood the possibility of sound diffraction over the top of the building. The route that followed was for propagation of noise from source to destination over the top of the building. Initially, for the principal route finding, it was required to consider the positions of source and destination points and the building in between, as shown in Figure 6a [10] in a 3D coordinate access system.
Step 4: For the simulated area shown in Figure 6a, a cutting plane in the XZ plane (abcd) was considered as shown in Figure 6b. A direct route from the 2D source coordinate to the destination is represented by a line in Figure 6c. The two-point form of a line is used for finding the equation of line between the source at point (xs, ys, zs) and destination (xd, yd, zd) with calculated direction ratios.
Here, l, m, n is DR’s. The two-point form of a line passing through these two 3D points is denoted by:
where (xsd, ysd, zsd) represents any random point on the line, and these ‘xsd’, ‘ysd’, and ‘zsd’ can be put as variables.
Step 5: When considering the building edges in 2D XY plane, the equation for each edge is formed that are (A1A2, A2A3, A3A4, A4A1, B1B2, B2B3, B3B4, B4B1, …, F4F1). These edges are stored in an array named as building edges array.
Step 6: It was required to check whether the line equation between a pair of source and destination intersects with line equations that were present in the building edges array in Step 5. To find the intersection point of two lines, the following is used: The source–destination line equation U with (l, m, n) are DR’s and the line equation of building edges- U1 with (a1, b1, c1), U2 with (a2, b2, c2), etc. For calculating point of intersection P with DR’s (ap, bp, cp)
If cp = 0, that means the line does not intersect.
Step 7: The author found the intersection point as i1, i2, i3, i4, ……, stored in an array I = [i1, i2, i3, i4, i5, i6] shown in Figure 7a. Considering the z plane here with the XZ and YZ plane. For each building intersection point adds up Z value to the intersection points, so the height points become j1, j2, j3, j4, etc. Additionally, the height was named as O1, O2, O3, O4, etc. Find the tallest height out of the O1, O2, O3, O4 shown in Figure 7b. Here, we find the maximum is O3 where O3 = i3 − j3. After finding the O3 as tall now, we consider two travels for finding a route, one from S to j3 (upward travel) and from j3 to D (downward travel) is shown in Figure 7b. “–“represents the line, for, e.g., i3–j3, which means line between i3 and j3 point.
Step 8: For the upward travel, apply “For loop” for choosing a source, for loop in range (0, len (upward array) − 2). Initially, S is chosen as the primary source. From S to (i3–j3), a line equation is formed, and checks which line equation in the upward array intersects with the S– (i3–j3) line. While checking for the upward travel line, S– (i3–j3) intersects with i1–j1 and creates an array that is:
The last index element is chosen from the (upward intersection array). It replaces i3j3, and again a line formed between (S to i1–j1) (will be repeated till the upward intersection array becomes empty). After this, choose the secondary source (after S) to be the last remaining element in the upward intersection array. Repeat the steps until the route between the S and the tallest height is found. We found an upward route (S–j1–j3), shown in Figure 8a.
Step 9: For the downward travel, apply “For loop” for choosing a source, for loop in range (0, len (downward array) − 2). Initially, O3 (i3–j3 tall height) is chosen as a source. From i3–j3 to D, a line equation is formed, checking which line equation in the downward array intersects with the (i3–j3)–D line. While checking for the downward travel line, (i3–j3) –D intersects with i4–j4 and creates an array that stores the intersected value.
The last index element is chosen from the (downward intersection array). It replaces the D, and again a line formed between j3 to i4j4 (will be repeated till the downward intersection becomes empty). After this, it is required to choose the secondary source after O3, which is (i3–j3). It is found to be the last remaining element in the (Downward intersection array). Repeat the steps (from step 8 to 11) until the route between the tallest height and D is found. The authors found a downward route (j3–D), shown in Figure 8b. The algorithm was also tested over complex terrain. The results for the complex buildings scenario and the route over the top for the project area of RGIPT are included in Supplementary Section S2.3.1.
3.3.2. Route around the Sides (Step 10 to Step 19)
These are the routes that are diffracted from the sides (right side and left side) of the building. Route traversal from the sides of the building is known as route around the sides.
Step 10: Initially consider the area or the region. Define the source–destination coordinates. Consider a buffer region that decides the inlier and outlier buildings to avoid complexity. Inliers are those that lie inside the buffer region. Let S = (xs, ys, zs) and D = (xd, yd, zd), for the source and the destination, calculate a buffer region that makes a square of a = (xa, ya, za), b = (xb, yb, zb), c = (xc, yc, zc), and d = (xd, yd, zd) shown in Figure 9a.
Step 11: Buildings inside the buffer region are considered for the algorithm. Form a line between the source and the destination defined in step 4 and define two different arrays. Array1 is for buildings on the line and the left side of line S-D. Array2 is for buildings that lie on the line and the right side of line S-D as shown in Figure 9b.
Step 12: Define the 3D coordinate in the 2D XY planar system. When considering the building edges in the 2D XY plane, the number of equations is formed and stored in an array such as Building edges array1 and Building edges array2 are shown in Figure 10a,b.
Building edges array1 = [B1B2, B2B4, B4B3, B3B1, D1D2, D2D4, D4D3, D3D1, E1E2, E2E4, E4B3, E3E1, F1F2, F2F4, F4F3, F3F1].
Building edges array2 = [A1A2, A2A4, A4A3, A3A1, B1B2, B2B4, B4B3, B3B1, E1E2, E2E4, E4B3, E3E1, F1F2, F2F4, F4F3, F3F1].
Step 13: Check whether the line equation between source and destination intersect with line equations present in the building edge arrays. Calculating the point of intersection P with DR’s (ap, bp, cp). To find the intersection point of two lines, the following is used: The source–destination line equation U with (l, m, n) are DR’s and the line equation of building edges—U1 with (a1, b1, c1), U2 with (a2, b2, c2), etc. For calculating point of intersection P with DR’s (ap, bp, cp).
If cp = 0, that means the line does not intersect.
Step 14: For the two-arrays created in step 11, here found the intersection point for first array i1, i2, i3, i4, i5, i6…… stored in the array I.
Height intersection points j1, j2, j3, j4, j5, j6……stored in the array J.
Step 15: In the intersection points arrays, calculate the distance of buildings such as d1, d2, d3, d4, etc., for each intersection point. Distances are stored in an array for an array1 in D and an array2 in C shown in (Figure 10a,b).
where d = distance between and the I = [xi, yi, zi].
where c = distance between and the I = [xi, yi, zi].
Step 16: A cutting plane (XY perpendicular to Z) is drawn between the source and destination, so that intersection points of buildings with planes is calculated, and the intersection points are stored in an array. Figure 11a shows the selection of inlier buildings with the help of the buffer region “abcd” in the previous image. The inlier buildings are based on the ground as (A1, A2, A3, A4), (B1, B2, B3, B4), (D1, D2, D3, D4), (E1, E2, E3, E4), and (F1, F2, F3, F4).
Step 17: Consider the Array1 and calculate the intersection height array. After calculating the intersection height array, choose the maximum dH value out of the array D. For the dH, find a corresponding IH and make a line between source and the IH point. Check whether any building intersects in between; if any building intersects, create an array for intersecting building array (IBA). If there exists an intersection, keep on adding in IBA. After this, take the last element of IBA, create a line with the source, and again check for intersection and update IBA. Repeat the process till the IBA is null. Then, when the last found element of IBA is connected to the IH point of dH again, repeat the above process until the pointer reaches the dH point.
Step 18: After reaching the dH point, make a line between dH and the destination. Check further for the intersection buildings and stores in IBA and repeat step 21 until the pointer reaches the destination point. The entire route for array1 is Source-1-2-Destination, shown in Figure 11c.
Figure 11c mentions “abcd” is the buffer region to select inlier and outlier buildings. Route from Source(S)-1-2-Destination(D) is the left side route for region “abfe”, where 1 and 2 (iD1 and iD3) shows the intersection point with the cutting plane “LMNO” between the source and destination. The source is denoted by “S” and destination is denoted by “D”.
Step 19: Repeat steps 17 and 18 for the Array2 and form a route. The entire route for Array2 is Source-3-4-Destination shown in Figure 11d. The entire route around the sides is shown in Figure 11e. Routes for the project area of an RGIPT campus for both right and left sides (Included in Supplementary Section S2.3.2).
Figure 11d mentions “abcd” is the buffer region to select inlier and outlier buildings. Route from Source(S)-3-4-5-Destination(D) is the right-side route for region “cdef”, where 3, 4, 5 (iA2, iA4, iF4) shows the intersection point with the cutting plane between the source and destination. The source is denoted by “S” and destination is denoted by “D”.
Figure 11e mentions when noise propagates from source to destination through the sides of the building, then the combined route has shown. Where the blue path is the right-side route and the black one is the left-side route. (Values in x and y-axis are in meter).
3.3.3. Reflection Route
Route followed by noise following the law of reflection, which states that the angle of incidence is equal to the angle of reflection [38]. According to the Snell’s law for reflection, the angle made by the incident ray is equal to the reflected ray that is Sin α (i) = Sin β (r), where, α and β are incident and reflected angle (as shown in Figure S10) [39]. The basics of Snell’s law are mentioned in Supplementary Section S2.3.3. For the reflection route, there are two types of routes (a) ground reflection routes and (b) wall reflection routes.
- (a)
- Ground Reflection: Reflection through the ground. The ground may be uniform and non-uniform. There are two cases formed, one for uniform and other for non-uniform ground. Both cases are discussed in Supplementary Section S2.3.3 (c). An example for ground reflection is shown in Figure 12a,b.
- (b)
- Wall reflection Route: Route that is calculated after reflection of noise signal from the wall of building. Procedure for wall reflection route is provided in Supplementary Section S2.3.3 (c). Result is shown in Figure 13.
3.4. Determination of Terrain Parameters
Noise Propagation Modelling requires noise data of sources, the detail of terrain through which noise propagates to different receiving (or destination) locations, and a prediction model. The noise after generating from source propagates to receiving locations. During its propagation, noise energies are lost due to the distance they travel, interact with buildings, ground, trees, etc. The distance-related losses are termed as Distance Attenuation (DA), while building or barrier-related losses are Barrier Attenuation (BA) [1,19,22]. The determination of barrier attenuation depends on determination of ‘Route Difference’, the extra route a sound wave needs to travel to reach a destination after diffraction.
where D1 = Indirect transmission route, D = Direct transmission route.
The noise data at receiver location is computed after accounting all losses in energy in its travel route. The noise level or Sound Pressure Level (SPL) at the receiving location is determined after deducting the loses in sound levels during propagation (attenuations) from the SPL of source location.
where,
- D = Direct transmission route
- D.A = Distance Attenuation
- B.A = Barrier attenuation
- λ = wavelength
- c = Speed of light
- f = Frequency
- N = Fresnel number
4. Results and Discussions
Efficiency of Algorithm
The efficiency of algorithm is tested using two verification schemes. One: checking whether the routes determined to be the principal routes (for propagation of sound (noise)) are indeed the principal routes. It is understood [40] that the principal routes carry the maximum sound energy during propagation. Further, the principal routes need to be shortest to carry maximum energy and become principal. Thus, all the determined routes are checked whether they are the shortest in their respective planes. Two: If the routing algorithm indeed offers the optimal routes, then the efficiency of noise modeling (where the routes are used for noise prediction) would improve significantly. Thus, the noise levels are predicted for the RGIPT campus and verified with ground recorded data of noise level to determine the improvement of accuracy for noise prediction.
4.1. Accuracy for Determined Principal Routes
Various routes over the top, around the sides, or reflected are tested to find the accuracy of algorithm.
4.1.1. Route over the Top Accuracy
From the discussed algorithm for the route over the top, we got a route for a building as shown in (Figure 8b) as the blue line indicates the desired route. It got two points on building that create a route over the top (Source, 1st, 2nd, destination). Now, to check the accuracy change in the y value, change in the 1st point is done with (±0.5, ±1, ±1.5) m, where (+) means left side of desired point and (–) means right side of desired point. Then, calculate the distance of the new route created with these changes. The blue line below and above the red line shows the changed route (Figure 14a). The changes in route length with deviation in right and left side of desired point is shown in Figure 14b. It is clear from the calculation that the route calculated by “Routes over the top algorithm” is the shortest route.
4.1.2. Route around the Side Accuracy
As discussed earlier, the routes around both sides of a building are calculated by the discussed algorithm. The desired route of one side is shown by the blue color line; the created route follows the XZ plane cutting technique to calculate the intersection point on the sidewalls of the building shown below in Figure 15a. The value at point 1, just next to the source, has (x, y, z) coordinate to check the accuracy. Make deviations in the z value of the 1st point from the desired z value in (±1, ±2, ±3) m and develop the route for modified z. In deviations, the (+) indicates the positive changes from desired point and (−) indicates the negative changes. The changes in route length with deviation in positive and negative direction of the desired point are shown in Figure 15b. It is clear from the calculation that the route calculated by “Routes around the side algorithm” is the shortest route.
In a complex building scenario, between any pair of the source (primary or secondary) and destination, the routing algorithm works and finds the best routes, which are the shortest routes.
4.2. Accuracy of Noise Prediction
The accuracy for prediction of noise levels is tested in dB levels. The noise prediction model used the routing algorithm for incorporating terrain parameters during prediction. Accurate terrain parameters are expected to improve accuracies of noise prediction. The accuracy of noise prediction is tested in two ways. One: comparing the effect of using new LiDAR algorithm generated routes on noise prediction in relation with theoretically generated routes (which is having no error) on noise prediction. Two: Determination of error in prediction of instantaneous noise levels for RGIPT campus in relation with measured noise levels at different locations of the campus.
4.2.1. Deviations in New Algorithm Generated Routes, Which Are Extracted Using LiDAR Data Are Compared with Routes (Having no Error) Extracted Theoretically. Deviations Are Related in Terms of Predicted Noise Levels
A simulated ground with a pair of noise source and receiver was planned. A building was also placed between the source and receiver. The routes and terrain parameters were estimated for this scene theoretically with principles of physics (i.e., zero error in determination of principal routes). Noise levels were predicted at the destination for source-generated noise level. The routes and terrain parameters were also estimated separately in the above realistic scenario. Error and deviations were simulated in the above noise propagation scenario from the source to the destination. Errors in terrain data measurement with LiDAR, deviations in extracted routes with new algorithm and error in measurement in noise levels were estimated to determine the deviations in predicted noise level at the destination in comparison with noise level predicted theoretically at the destination (Figure 16. Estimated error in LiDAR data, terrain parameter extraction and noise data measurement leading the uncertainty in prediction are detailed in Supplementary Section S3.1.
4.2.2. Determination of Error in the Predicted Instantaneous Noise Levels
Once all the routes are determined, these are used to determine the terrain parameters such as direct distance between source and destination pair, route difference and length for diffracted routes, reflected route length, etc. [17]. This process is repeated for all routes and each pair of sources and destination. The noise data of source(s) and terrain parameters between source and destination pairs are integrated using noise model for prediction of noise levels. The predicted noise levels of different parts of the study site are compared with measured noise levels to estimate the accuracy. Noise mapping is done to show the noise propagation in a particular area. Here, 25 noise sources at the railway line near the RGIPT campus are used to determine all the routes for all the destination locations at the campus shown in (Figure 17). The predicted noise levels are found to be accurate within ±6 dB (tested for over 100 destination points at RGIPT campus) and compared with in accuracies of other instantaneous scale noise prediction [40,41] and are found to be significantly better.
These determined routes are then used to map the noise level for the RGIPT campus due to railway noise sources (Figure 17b) at various locations of noise sources. Predicted noise levels are plotted in a GIS environment using ArcGIS software [26,42,43]. The project area of the RGIPT campus noise map in 3D is generated for 3 different instances, as shown in Figure 18a–c. These 3 different maps are for train noise sources when a train is at 3 different positions. Noise prediction of RGIPT campus is performed by gathering information of routes, terrain parameters, noise source, and noise level at the source. Noise source is considered as the train passes through the railway track near the campus for 2 min. These routes, terrain parameters, and noise level at source are further given to the noise model, which will finally calculate the noise level at noise receiver points (destination) of the RGIPT campus. Various routes determined are found to be accurate within ± 9 cm, which is a testimony for the effectiveness of the approach. Further, it was found to significantly improve the accuracy of prediction of noise level for a place (for short period). The predicted noise levels are found to be accurate within ±6 dB (tested for over 100 points at RGIPT campus), which is about two-fold superior to what was earlier achieved (±10 to 12 dB). The novel route determination algorithm applicable over precise LiDAR point cloud data can easily be extended for significantly improving other urban applications.
5. Conclusions
Route determination is instrumental for successful implementation of various urban applications. Noise prediction application requires extraction of routes in outdoor environment through which the noises or acoustic pressure waves primary propagate to generate a noise level for a place. GIS-based applications determine the routes primarily in 2D; however, the acoustic pressure waves transmit in 3D, requiring extraction of routes in 3D. Authors understood the need to establish a solution in this direction. Further, for noise propagation modelling, the available applications primarily consider the noise sources as linear source, which is further averaged over a long duration to normalize fluctuation of noise levels over time. The averaging significantly reduces the prediction accuracies specially for a short period or instantaneous scale. Authors realized the challenge and came up with the scheme of point-to-point prediction, considering noise originating from a point and propagating to many surrounding points. Novel cutting plane technique essentially tried to accurately determine all the possible routes between every pair of noise source and destination. It helped to compute the extent of sound pressure level (dB) reaching a destination point after originating from a source. This point-to-point computational technique was extended for all the noise sources (be it point source or line source or area source) and noise receiving location pairs to generate a noise map for an area. The authors developed a robust approach where it tried to determine all the principal routes in stages, which are independently dedicated to route over top, route around sides, reflected routes, etc., when direct propagation of noise is not possible. The challenge of handling huge unlabeled point cloud data is managed through extraction of edges of the buildings (and other obstructions), along with various terrain points such as building corner, reflection point, diffraction point or the transmission point (as the case may be). This approach in comparison to the existing technology is significantly more efficient in determining and analyzing the terrain points and terrain parameters. With the above computation, authors focus on determining the principal routes that are required to be ascertained for determining the noise level without considering a large number of non-principal routes, saving time for computation, and avoiding compromising the accuracy. The proposed routing technique is further used for determining the optimal location of cell phone towers for adequate signal strength.
6. Future Scope
The current study was focused on determination of a point-to-point routing algorithm taking LiDAR data as terrain input. The routing algorithm worked in two stages, i.e., extraction of building, ground and other terrain points from LiDAR data in the first stage, and then extraction of detailed routes between a source point and a receiving point in the second stage. The approach determined all the possible routes for propagation in 3D for every pair of source and receiver points and utilized it for sound propagation modelling integrating terrain and noise data with noise propagation model. At present, the extraction of building, ground and other terrain features between source and receiver points are accurate, but semi-automatic in nature. In the future, the entire process is planned to be made automatic, thus the algorithm will determine the shortest 3D routes directly after receiving the LiDAR data, and noise data of noise sources for all the noise receiving locations. It would then automatically determine the 3D noise map for an area accurately.
The routing algorithm has an important role to play in sound propagation modelling. Routing algorithms are important for various applications, i.e., route planning, travelling salesman problem, laying out of pipeline, determination of sun angle, viewshed analysis, etc. An automatic and efficient 3D routing algorithm working over detailed terrain data can improve the performance of all the above applications.
Supplementary Materials
The following supporting information can be downloaded at: https://www.mdpi.com/article/10.3390/asi5030058/s1, Figure S1. Noise prediction. Figure S2. The two figures in the Lima Modeling: (a) Principle of the line segmentation using projection; (b) Demo of Lima technique to create model and noise map. Figure S3. Three figures show the principle working of Nordic Noise propagation model to calculate: (a) Generated receiver for Noise prediction; (b) non-barrier angle and its bisector; (c) Barrier angle and its bisector; (d) Noise map of an area. Figure S4. (a) Step to proceed SoundPlan Techniques; (b) Graphic screen (Geo-database); (c) Model creation in SoundPlan Modeling; (d) Isolines creation by means of direct and indirect routes. Figure S5. Diagram showing results of Dijkstra and other existing algorithms. Figure S6. (a) Shows the area of RGIPT from google map; (b) The plot shows LiDAR point data for the area in step 1; (c) Extracted Ground points from 3D point cloud data. (d) Elevation data after Subtraction of BEM from DSM where building of RGIPT campus. Figure S7. (a) Non-Ground points are now classified for extraction of building coordinates, for this class 1 is mentioned for Regular shaped and class 2 is for non-regular shape; (b) Planimetric view of non-ground points after classification in different classes, the partition is done in order to find out the building edges and corners; (c) 1,2,3,4,5,6,7,8 and 9,10,11,12,13,14,15,16 are the building corners of AB1 & AB2 extracted from the algorithm. Figure S8. (a) The route over the top of the building for setup contains slanted building is S-1-D. (Values in x and y-axis are in meter); (b) The route over the top of the building for the hut-shaped building is S-1-2-3-D (Values in x and y-axis are in meter); (c) Source-1-2-Destination is the route over the top for the academic area of RGIPT between the pair of Source-Destination. Figure S9. (a) Source-1-destination is the left-side route around the sides of the building for an academic area of the RGIPT campus. It consists of AB1 and AB2. Source point and destination point are taken manually to discuss the case for the project area, (b) source-1-destination is the right-side route around the sides of the building for an academic area of the RGIPT campus. It consists of AB1 and AB2. Source point and destination point are taken manually to discuss the case for the project area. Figure S10. Source (S1) is the source point at ground and Source (S2) at some height (which can vary) and Destination (D1) is the destination point at ground and Destination (D2) at some height (which can vary). Finding the reflection point “R” for a general case where source at “h1” height and destination at “h2” height is taken with incident angle α and reflected angle β. Figure S11. Image classification is done to determine the ground type of an area for reflection. Figure S12. (a) Here, the plane between the source and destination is non-uniform. There exist number of point data defines the non-uniformly. Point 1 to Point 29 defines random points on the source–destination plane. “h1” is height of source from the plane at S1 and “h2” is height of destination from the plane at D1. (b) Point number “1” is taken to check the difference between angle incidence α and angle of reflection β. Where “T” defines the intersection point of line between the S1 and the point “1” with Line D1-D2. (c) Here, point number “12” is taken and calculate the “T” point which is an intersection of line S1-point 12 and Line D1-D2. After that a normal is drawn at point number 12 per perpendicular to S1-T line to calculate difference between α and β. (d) “S” is source and “D” is destination R is reflection point found by applying law of reflection between S and D. Figure S13. (a) Triangulation of buffer region near the R point found for uniform plane. This process is done to find the accurate reflection on ground which is affected due to non-uniform plane, (b) Checking every point in buffer to check at which point angle difference between incident angle and reflected angle is least and the route difference is least, (C) In this figure Reflection point (R’) is found after checking all points in buffer region near the reflection point first find between source and destination, (d) Reflection from the plane on ground and the arrow indicates the path from source to destination, (e) “S” is source and “D” is destination, R’ is new reflection point received. Figure S14. (a) Source and destination at height h1 and h2 is given. “ijkl” is the cutting plane (XY) which is perpendicular to Z (between source and destination). Plane “ijkl” cuts the building at “m” and “n”, (b) Length of k to l is equal to the line length between S2 and D2. Number of points from 1 to 15 are taken between k-l and check the difference if incidence and reflected angle for every point. Difference value least with minimum route length will be the point of reflection on wall, (c) Point of reflection where difference between incident angle “α” and reflected angle “β” is minimum. Point that has the minimum route length is the point number 10, (d) “S” is source and “D” is destination and R’ is the new reflection point found on wall of building. Figure S15. Source at S (4,4,5,4) and destination at D (11,4,5,8), building has A, B, C, D ground corner points of building and height of building is 15 m. Here t1, t2 are point of intersection on building which forms top way path. Similarly, s1, s2, s3, s4 are points on building forming path around the sides. Figure S16. (a) Building LiDAR points with Accuracy (±3 cm), (b) Point accuracy is (±3 cm) means in all directions the maximum error is 6 cm, From the least square method 1, 2, 3 pairs of lines intersect to find a building corner, (c) With (±3 cm) Accuracy at each point, there may be a shift of 3 cm in both directions while calculating the building corner, (d) For the Building corner points due to LiDAR point accuracy is (±4.5 cm). Table S1: Noise level calculation with error or without error at destination location. Supplementary Section S1: Literature Review; Section S2.1 (LiDAR Data acquisition); Section S2.2 (Building Edges and corner extraction); Section S2.3 (Indirect Route determination); Section S3 (Results and Discussions). References [44,45,46,47,48,49,50,51,52,53,54] are cited in the Supplementary Materials.
Author Contributions
Conceptualization, S.B. (Shruti Bharadwaj), R.D. and S.B. (Susham Biswas); methodology, R.D., M.I.Z. and S.B. (Susham Biswas); software, R.D. and R.F.; validation, R.F.; formal analysis, S.B. (Shruti Bharadwaj), M.I.Z. and R.F.; investigation, R.D.; data curation, R.D. and R.F.; writing—original draft preparation, S.B. (Shruti Bharadwaj) and M.I.Z.; writing—review and editing, D.J.; visualization, M.I.Z., D.J. and S.B. (Susham Biswas); supervision, S.B. (Susham Biswas); project administration, S.B. (Shruti Bharadwaj). All authors have read and agreed to the published version of the manuscript.
Funding
This research received no external funding.
Institutional Review Board Statement
Not applicable.
Informed Consent Statement
Not applicable.
Data Availability Statement
The data presented in this study are available on request from the corresponding author.
Acknowledgments
The authors are thankful to the Rajiv Gandhi Institute of Petroleum Technology, established by the Ministry of Petroleum and Natural Gas, India, for providing infrastructural supports and facilities required to carry out this research work.
Conflicts of Interest
The authors declare no conflict of interest.
References
- Biswas, S.; Lohani, B. Development of High Resolution 3D Sound Propagation Model Using LIDAR Data and Air Photo. Int. Arch. Photogramm. Remote Sens. Spat. Inf. Sci. 2008, 37, 1735–1740. [Google Scholar]
- Choi, J.; Zhang, B.; Oh, K. The shortest path from shortest distance on a polygon mesh. J. Theor. Appl. Inf. Technol. 2017, 95, 4446–4454. [Google Scholar]
- Tandel, B.; Sonaviya, D. A Quick Review on Noise Propagation Models and Software. In Proceedings of the ICSBE-2016—7th International Conference On Sustainable Built Environment, Kandy, Sri Lanka, 16–18 December 2016; p. 6. [Google Scholar]
- Bendtsen, H. The Nordic prediction method for road traffic noise. Sci. Total Environ. 1999, 235, 331–338. [Google Scholar] [CrossRef]
- Hadzi-Nikolova, M.; Mirakovski, D.; Ristova, E.; Ceravolo, S. Modeling and Mapping of Urban Noise Pollution with SoundPLAN Software. Univ. Goce Delcev. 2012, 185, 38–41. [Google Scholar]
- Kogut, J.P.; Pilecka, E. Application of the terrestrial laser scanner in the monitoring of earth structures. Open Geosci. 2020, 12, 503–517. [Google Scholar] [CrossRef]
- Veronese, L.D.P.; Ismail, A.; Narayan, V.; Schulze, M. An Accurate and Computational Efficient System for Detecting and Classifying Ego and Sides Lanes Using LiDAR. In Proceedings of the IEEE Intelligent Vehicles Symposium (IV), Changshu, China, 26–30 June 2018; pp. 1476–1483. [Google Scholar] [CrossRef]
- Asal, F.F.F. Comparative Analysis of the Digital Terrain Models Extracted from Airborne LiDAR Point Clouds Using Different Filtering Approaches in Residential Landscapes. Adv. Remote Sens. 2019, 8, 51–75. [Google Scholar] [CrossRef] [Green Version]
- Madkour, A.; Aref, W.G.; Rehman, F.U.; Rahman, M.A.; Basalamah, S. A Survey of Shortest-Path Algorithms. arXiv 2017, arXiv:1705.02044. [Google Scholar]
- Chen, Y.; She, J.; Li, X.; Zhang, S.; Tan, J. Accurate and efficient calculation of three-dimensional cost distance. ISPRS Int. J. Geo-Inf. 2020, 9, 353. [Google Scholar] [CrossRef]
- Duan, P.; AI, Y. Research on an Improved Ant Colony Optimization Algorithm and its Application. Int. J. Hybrid Inf. Technol. 2016, 9, 223–234. [Google Scholar] [CrossRef]
- Zarrinpanjeh, N.; Dadrass Javan, F.; Naji, A.; Azadi, H.; De Maeyer, P.; Witlox, F. Optimum path determination to facilitate fire station rescue missions using ant colony optimization algorithms (case study: City of Karaj). Int. Arch. Photogramm. Remote Sens. Spat. Inf. Sci. ISPRS Arch. 2020, 43, 1285–1291. [Google Scholar] [CrossRef]
- Alasadi, H.A.A.; Aziz, M.T.; Dhiya, M.; Abdulmajed, A. A Network Analysis for Finding the Shortest Path in Hospital Information System with GIS and GPS. J. Netw. Comput. Appl. 2020, 5, 10–23. [Google Scholar] [CrossRef]
- Canali, C.; Lancellotti, R. GASP: Genetic Algorithms for Service Placement in Fog Computing Systems. Algorithms 2019, 12, 201. [Google Scholar] [CrossRef] [Green Version]
- Mittal, H.; Okorn, B.; Jangid, A.; Held, D. Self-Supervised Point Cloud Completion via Inpainting. arXiv 2021, arXiv:2111.10701. [Google Scholar]
- Medrano, F.A. Effects of raster terrain representation on GIS shortest path analysis. PLoS ONE 2021, 16, e0250106. [Google Scholar] [CrossRef]
- Jyothi, S.; Padmavati, S.; Visvavidyalayam, M.; Varma, M.K.R.; Varma, S.A.K. Digitizing the Forest Resource Map Using ArcGIS. Int. J. Comput. Sci. Issues 2010, 7, 300. [Google Scholar]
- Tiwari, S.K.; Kumaraswamidhas, L.A.; Garg, N. Accuracy of short-term noise monitoring strategy in comparison to long-term noise monitoring strategy. Indian J. Pure Appl. Phys. 2021, 59, 569–576. [Google Scholar]
- Dubey, R.; Bharadwaj, S. Collaborative air quality mapping of different metropolitan collaborative air quality mapping of different metropolitan. Int. Arch. Photogramm. Remote Sens. Spat. Inf. Sci. 2021, 43, 87–94. [Google Scholar] [CrossRef]
- Dubey, R.; Bharadwaj, S.; Zafar, M.I.; Mahajan, V.; Srivastava, A.; Biswas, S. GIS Mapping of Short-Term Noisy Event of Diwali Night in Lucknow City. ISPRS Int. J. Geo-Inf. 2021, 11, 25. [Google Scholar] [CrossRef]
- Dubey, R.; Bharadwaj, S.; Zafar, M.I.; Bhushan Sharma, V.; Biswas, S. Collaborative noise mapping using smartphone. Int. Arch. Photogramm. Remote Sens. Spat. Inf. Sci. 2020, 43, 253–260. [Google Scholar] [CrossRef]
- Zafar, M.I.; Bharadwaj, S.; Dubey, R.; Biswas, S. Different scales of urban traffic noise prediction. Int. Arch. Photogramm. Remote Sens. Spat. Inf. Sci. 2020, 43, 1181–1188. [Google Scholar] [CrossRef]
- Joshi, G.; Pal, B.; Zafar, I.; Bharadwaj, S.; Biswas, S. Developing intelligent fire alarm system and need of UAV. Lect. Notes Civ. Eng. 2020, 51, 403–414. [Google Scholar] [CrossRef]
- Bharadwaj, S.; Dubey, R.; Biswas, S. Determination of the Best Location for Setting up a Transmission Tower in the City. In Proceedings of the 2020 International Conference on Smart Innovations in Design, Environment, Management, Planning and Computing (ICSIDEMPC), Aurangabad, India, 30–31 October 2020; pp. 63–68. [Google Scholar] [CrossRef]
- Bharadwaj, S.; Dubey, R. Raster data based automated noise data integration for noise raster data based automated noise data integration for noise. Int. Arch. Photogramm. Remote Sens. Spat. Inf. Sci. 2021, 43, 159–166. [Google Scholar] [CrossRef]
- Dubey, R.; Bharadwaj, S.; Biswas, D.S. Intelligent Noise Mapping Using Smart Phone on Web Platform. In Proceedings of the 2020 International Conference on Smart Innovations in Design, Environment, Management, Planning and Computing (ICSIDEMPC), Aurangabad, India, 30–31 October 2020; pp. 69–74. [Google Scholar] [CrossRef]
- Sun, P.; Zhao, X.; Xu, Z.; Wang, R.; Min, H. A 3D LiDAR Data-Based Dedicated Road Boundary Detection Algorithm for Autonomous Vehicles. IEEE Access 2019, 7, 29623–29638. [Google Scholar] [CrossRef]
- Masiero, A.; Tucci, G.; Vettore, A. Tree Detection with a Mobile Laser Scanner. In IOP Conference Series: Earth and Environmental Science; IOP Publishing: Bristol, UK, 2021; Volume 76, p. 012034. [Google Scholar] [CrossRef]
- Bharadwaj, S.; Dubey, R.; Zafar, M.I.; Srivastava, A.; Bhushan Sharma, V.; Biswas, S. Determination of Optimal Location for Setting Up Cell Phone Tower in City Environment Using Lidar Data. Int. Arch. Photogramm. Remote Sens. Spat. Inf. Sci. 2020, 43, 647–654. [Google Scholar] [CrossRef]
- Sharma, V.B.; Singh, K.; Gupta, R.; Joshi, A.; Dubey, R.; Gupta, V.; Bharadwaj, S.; Zafar, M.I.; Bajpai, S.; Khan, M.A.; et al. Review of structural health monitoring techniques in pipeline and wind turbine industries. Appl. Syst. Innov. 2021, 4, 59. [Google Scholar] [CrossRef]
- Bello, S.A.; Yu, S.; Wang, C.; Adam, J.M.; Li, J. Review: Deep learning on 3D point clouds. Remote Sens. 2020, 12, 1729. [Google Scholar] [CrossRef]
- Popescu, G. The accuracy of lidar measurements for the different land cover categories. Fast system of monitoring and interactive mapping View project. Earth Obs. Surv. Environ. Eng. 2015, 4, 158–164. [Google Scholar]
- Liu, X.; Zhang, Z.; Peterson, J.; Chandra, S. Large Area DEM Generation Using Airborne LiDAR Data and Quality Control. In Proceedings of the 8th International Symposium on Spatial Accuracy Assessment in Natural Resources and Environmental Sciences, Shanghai, China, 25–27 June 2008; pp. 79–85. [Google Scholar]
- Kanpur, I.I.T.; Lohani, B. Building Extraction Why Building Extraction? arXiv 2008, arXiv:2111.15637. [Google Scholar]
- Lohani, B.; Ghosh, S. Airborne LiDAR Technology: A Review of Data Collection and Processing Systems. Proc. Natl. Acad. Sci. India Sect. A Phys. Sci. 2017, 87, 567–579. [Google Scholar] [CrossRef]
- Jovanović, D.; Milovanov, S.; Ruskovski, I.; Govedarica, M.; Sladić, D.; Radulović, A.; Pajić, V. Building virtual 3D city model for smart cities applications: A case study on campus area of the university of novi sad. ISPRS Int. J. Geo-Inf. 2020, 9, 476. [Google Scholar] [CrossRef]
- Sonker, M.; Bajpai, S.; Khan, M.A.; Yu, X.; Tiwary, S.K.; Shreyash, N. Review of Recent Advances and Their Improvement in the Effectiveness of Hydrogel-Based Targeted Drug Delivery: A Hope for Treating Cancer. ACS Appl. Bio Mater. 2021, 4, 8080–8109. [Google Scholar] [CrossRef]
- Rodrigues, M.; Simeão Carvalho, P. Laws of reflection and Snell’s law revisited by video modeling. In Proceedings of the 12th Education and Training in Optics and Photonics Conference, Porto, Portugal, 17 July 2014; Volume 9289, p. 928922. [Google Scholar] [CrossRef] [Green Version]
- Gaol, F.L. Bresenham Algorithm: Implementation and Analysis in Raster Shape. J. Comput. 2013, 8, 69–78. [Google Scholar] [CrossRef] [Green Version]
- Rabah, F.K.; Ghabayen, S.M.; Salha, A.A. Effect of GIS Interpolation Techniques on the Accuracy of the Spatial Representation of Groundwater Monitoring Data in Gaza Strip. J. Environ. Sci. Technol. 2011, 4, 579–589. [Google Scholar] [CrossRef] [Green Version]
- Bocher, E.; Guillaume, G.; Picaut, J.; Petit, G.; Fortin, N. Noisemodelling: An open source GIS based tool to produce environmental noise maps. ISPRS Int. J. Geo-Inf. 2019, 8, 130. [Google Scholar] [CrossRef] [Green Version]
- Laixing, L.I.U.; Deren, L.I.; Zhenfeng, S. Research on geospatial information sharing platform based on ArcGIS server. Archives 2003, 37, 791–795. [Google Scholar]
- Bajpai, S.; Shreyash, N.; Sonker, M.; Tiwary, S.K.; Biswas, S. Investigation of SiO2 Nanoparticle Retention in Flow Channels, Its Remediation Using Surfactants and Relevance of Artificial Intelligence in the Future. Chemistry 2021, 3, 1371–1380. [Google Scholar] [CrossRef]
- Win, L.L. Finding optimal route information and network analysis for emergency service. Int. J. Adv. Res. Dev. 2018, 3, 22–25. [Google Scholar]
- Guo, Y.; Wang, H.; Hu, Q.; Liu, H.; Liu, L.; Bennamoun, M. Deep Learning for 3D Point Clouds: A Survey. IEEE Trans. Pattern Anal. Mach. Intell. 2021, 43, 4338–4364. [Google Scholar] [CrossRef]
- Nguyen, H.T.; Pearce, J.M.; Harrap, R.; Barber, G. The application of LiDAR to assessment of rooftop solar photovoltaic deployment potential in a municipal district unit. Sensors 2012, 12, 4534–4558. [Google Scholar] [CrossRef]
- Song, W.; Zou, S.; Tian, Y.; Fong, S.; Cho, K. Classifying 3D objects in LiDAR point clouds with a back-propagation neural network. Hum.-Cent. Comput. Inf. Sci. 2018, 8, 1–12. [Google Scholar] [CrossRef]
- Murcia, H.F.; Tilaguy, S.; Ouazaa, S. Development of a Low-Cost System for 3D Orchard Mapping Integrating UGV and LiDAR. Plants 2021, 10, 2804. [Google Scholar] [CrossRef]
- Chen, Z.; Gao, B.; Devereux, B. State-of-the-art: DTM generation using airborne LIDAR data. Sensors 2017, 17, 150. [Google Scholar] [CrossRef] [Green Version]
- Guoping, L.; Chunxiang, C.; Xiaowen, L.; Hao, Z.; Qisheng, H.; Linyan, B.; Chaoyi, C. Classification of Lidar Point Cloud and Generation of DTM from Lidar Height and Intensity Data in Forested Area. Int. Arch. Photogramm. Remote Sens. Spat. Inf. Sci. 2008, 37, 313–318. [Google Scholar]
- Sharma, M.; Paige, G.B.; Miller, S.N. DEM development from ground-based LiDAR data: A method to remove non-surface objects. Remote Sens. 2010, 2, 2629–2642. [Google Scholar] [CrossRef] [Green Version]
- Sulaiman, N.S.; Majid, Z.; Setan, H. DTM generation from LiDAR data by using different filters in open–source software. Geoinf. Sci. J. 2010, 10, 89–109. [Google Scholar]
- Meng, X.; Currit, N.; Zhao, K. Ground filtering algorithms for airborne LiDAR data: A review of critical issues. Remote Sens. 2010, 2, 833–860. [Google Scholar] [CrossRef] [Green Version]
- Priestnall, G.; Jaafar, J.; Duncan, A. Extracting urban features from LiDAR digital surface models. Comput. Environ. Urban Syst. 2000, 24, 65–78. [Google Scholar] [CrossRef]
Figure 1.
Methodology for determination of routes extracting terrain parameter and utilization of same for noise prediction.
Figure 1.
Methodology for determination of routes extracting terrain parameter and utilization of same for noise prediction.
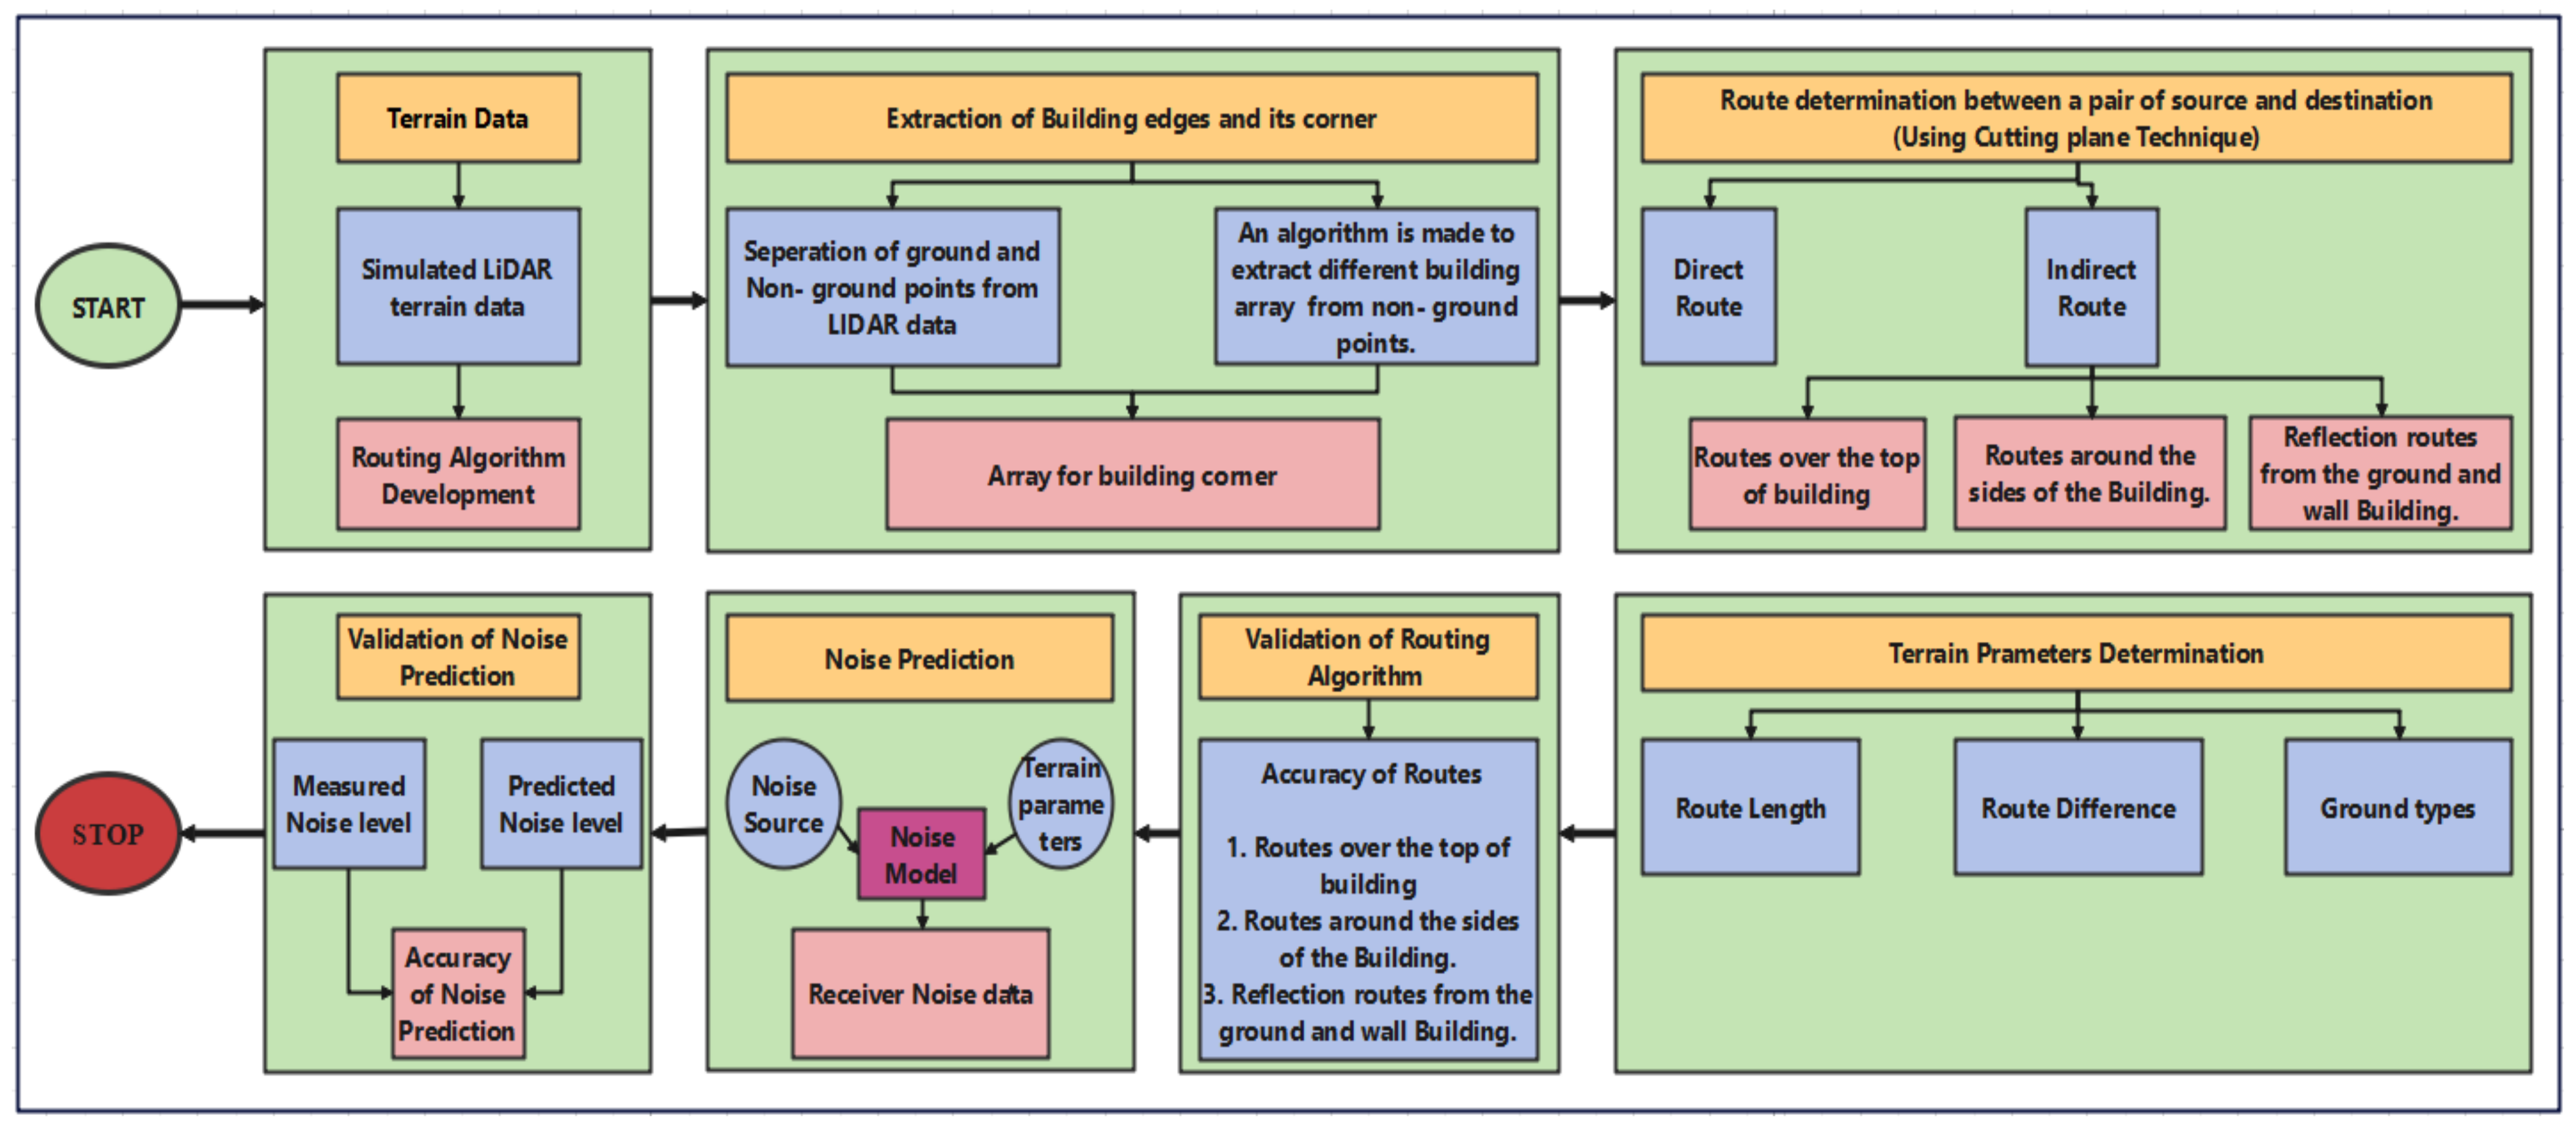
Figure 2.
RGIPT project site LiDAR data were used for noise prediction leveraging point to point routing algorithm.
Figure 2.
RGIPT project site LiDAR data were used for noise prediction leveraging point to point routing algorithm.

Figure 3.
Summary flow chart of stepwise processing of LiDAR data for deriving a point-to-point routing algorithm for noise mapping.
Figure 3.
Summary flow chart of stepwise processing of LiDAR data for deriving a point-to-point routing algorithm for noise mapping.

Figure 4.
Flow chart explaining route determination in short.
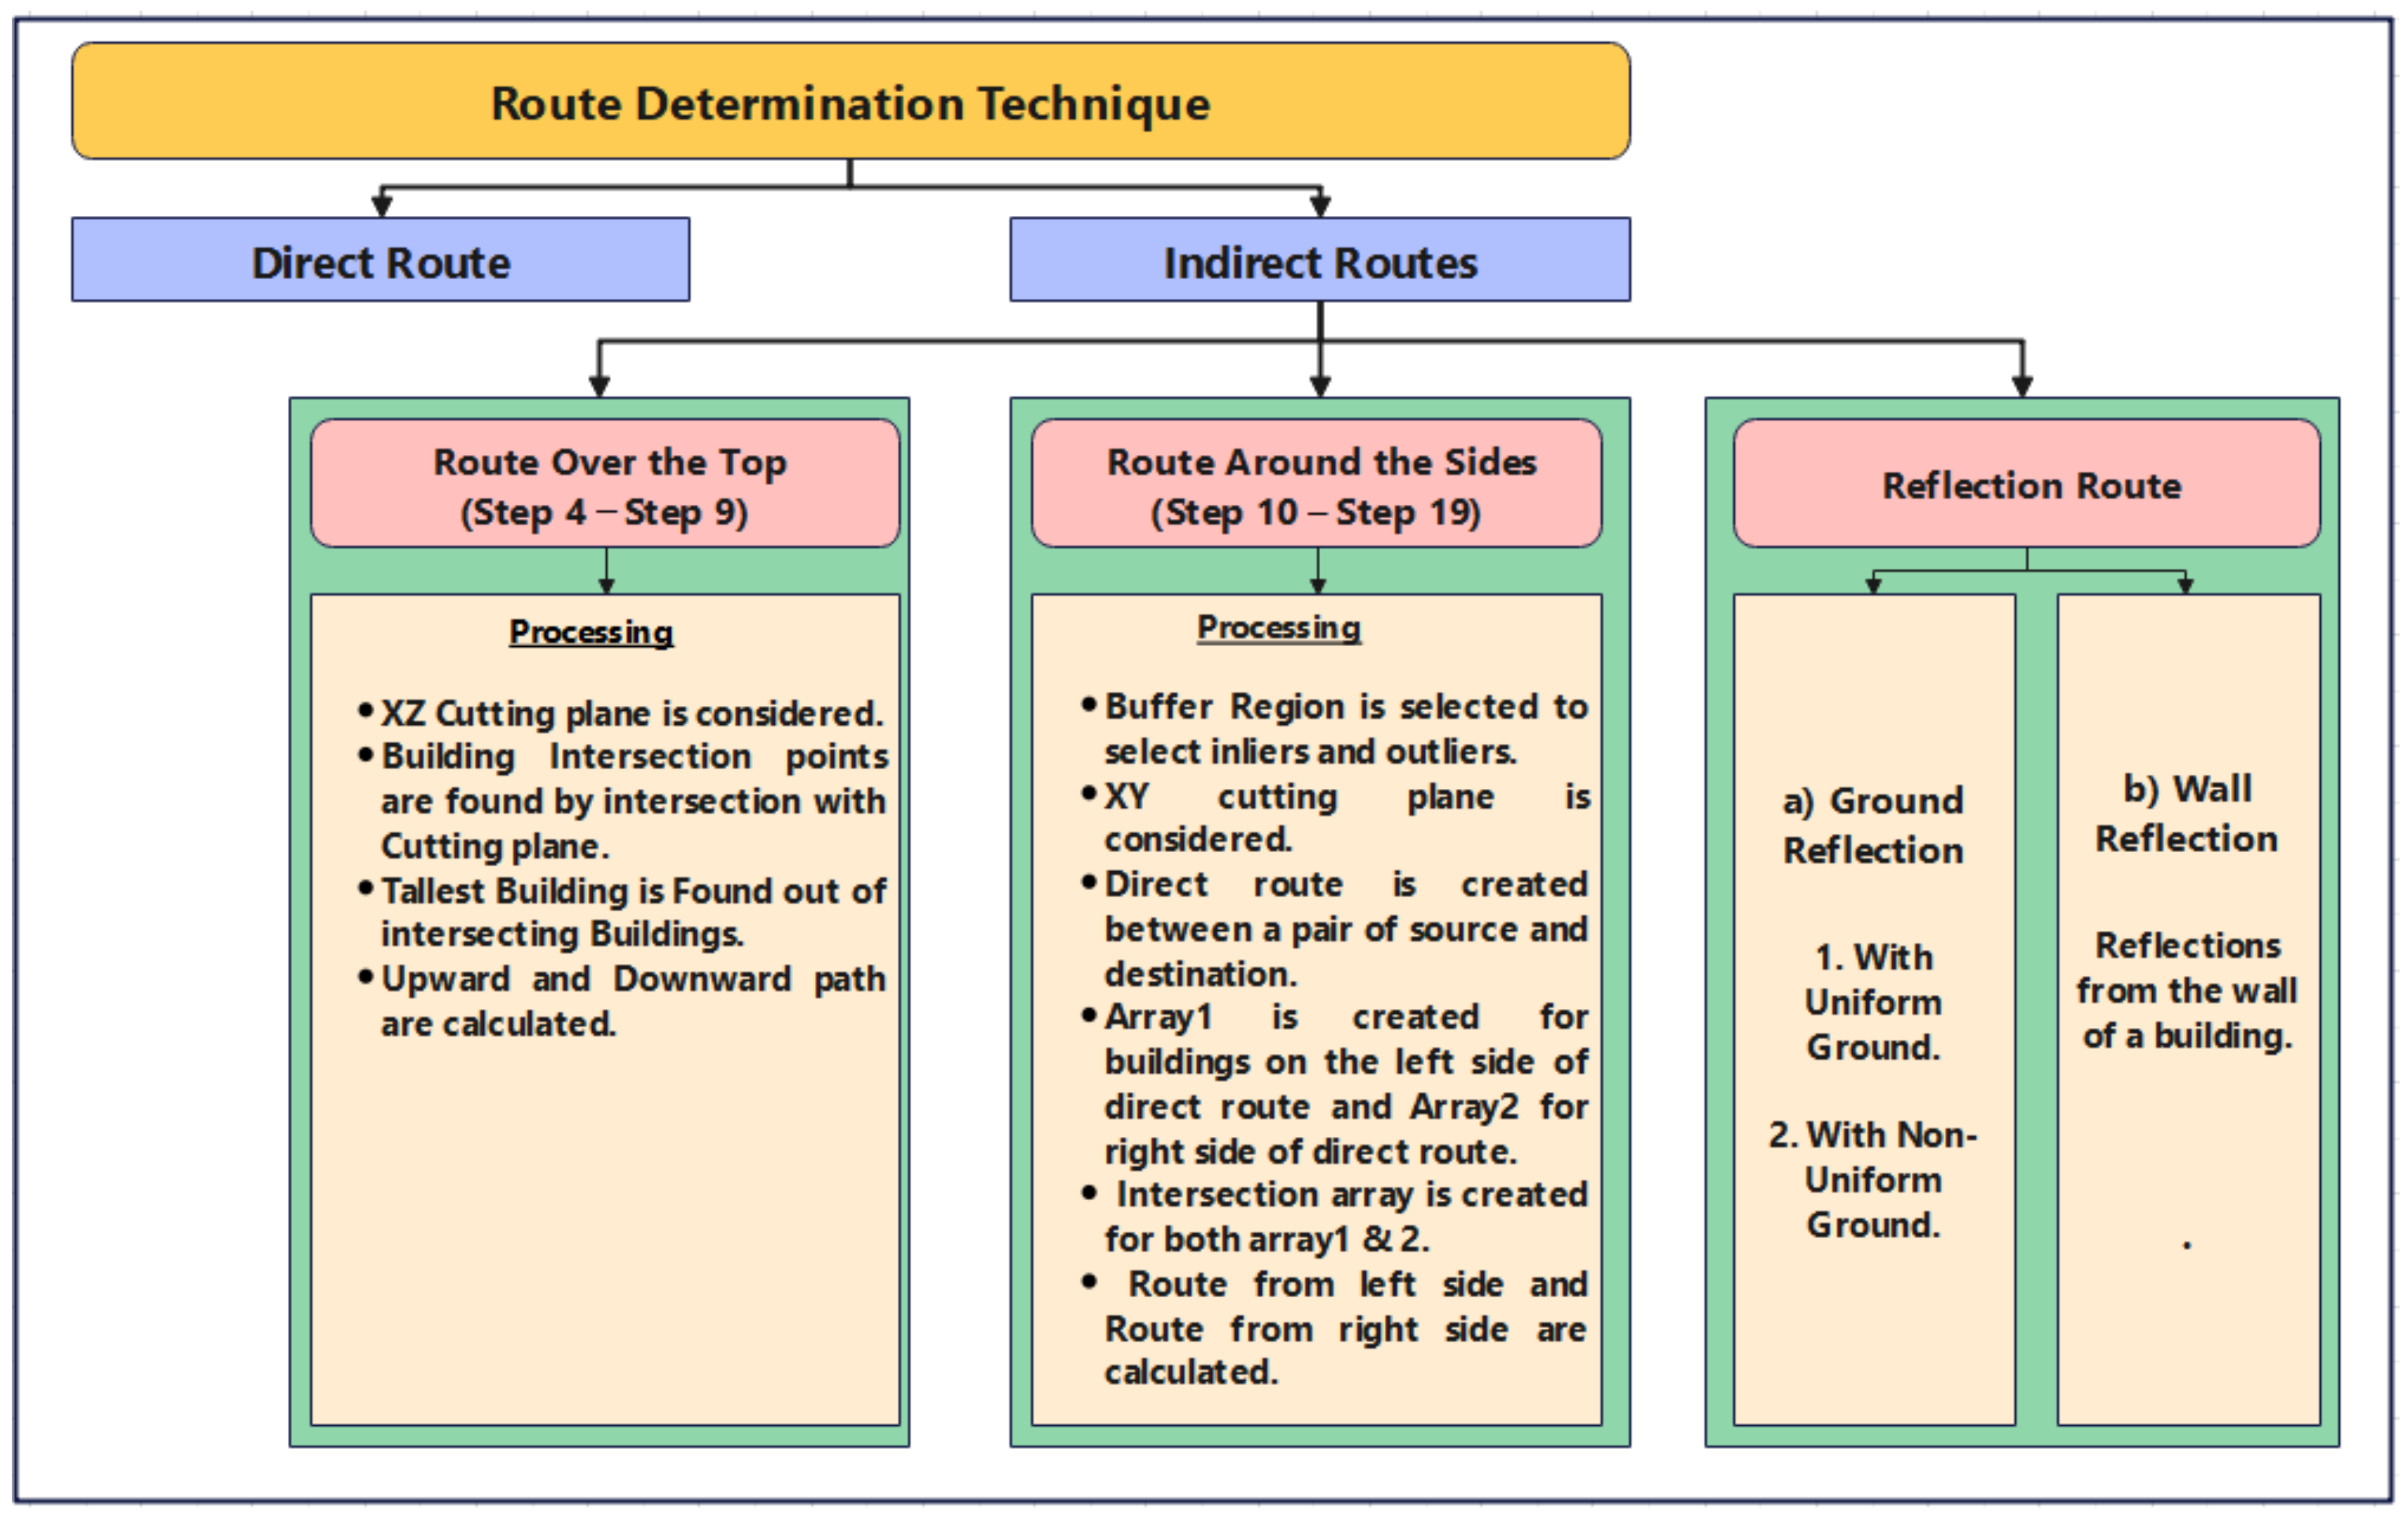
Figure 5.
(a) Principal route with respect to route over the top and reflection routes (Routes are P1, P2, P3, and P4). (b) Principal route with respect to route around the right side and reflection routes (Routes are P5, P6, P7, and P8). (c) Principal route with respect to route around the left side and route of reflection (Routes are P9, P10, P11, and P12).
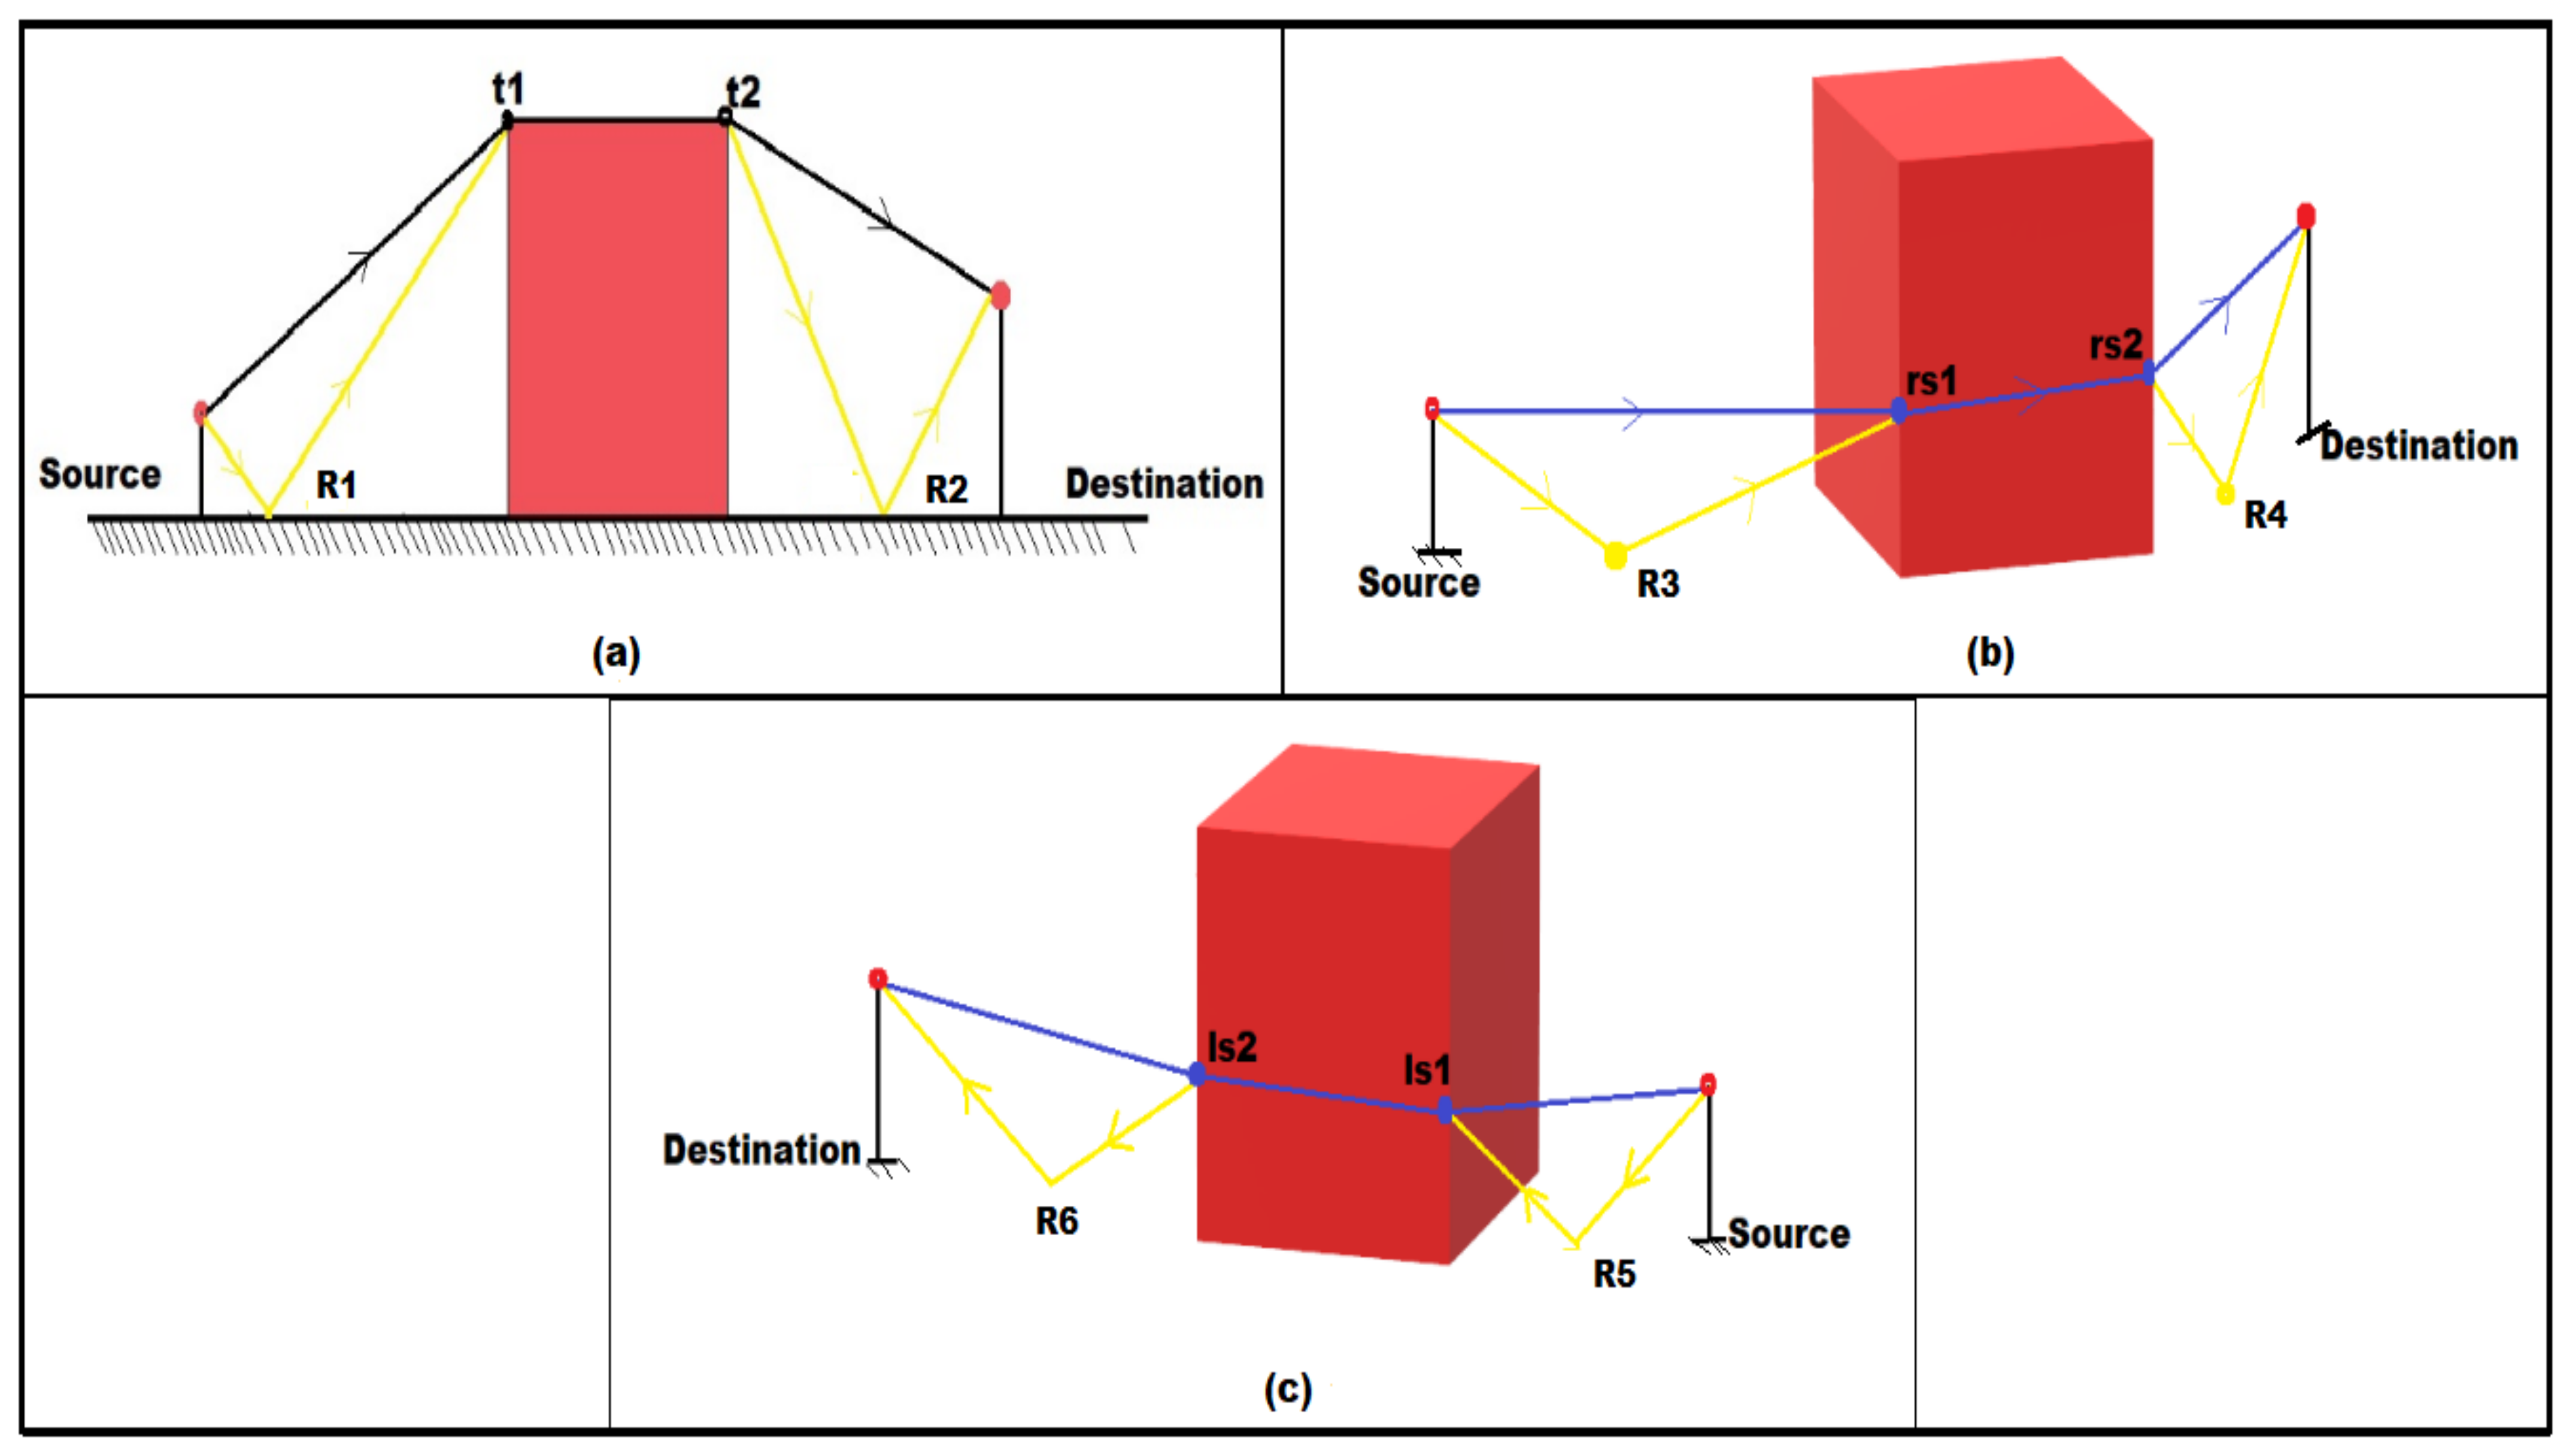
Figure 6.
(a) A Simulated area is taken for understanding the working of route determination with a pair of source and destination points, and (b) “abcd” is the XZ cutting plane created between the source to find out intersecting buildings and points. Intersecting buildings are Building B, Building E, and Building F, and (c) (B1, B2, B3, B4), (E1, E2, E3, E4) and (F1, F2, F3, F4) are the building corners on ground, which is calculated by the intersection of the XZ plane (that has shown in the previous figure) with the buildings. The source is denoted by “S” and destination by “D”.
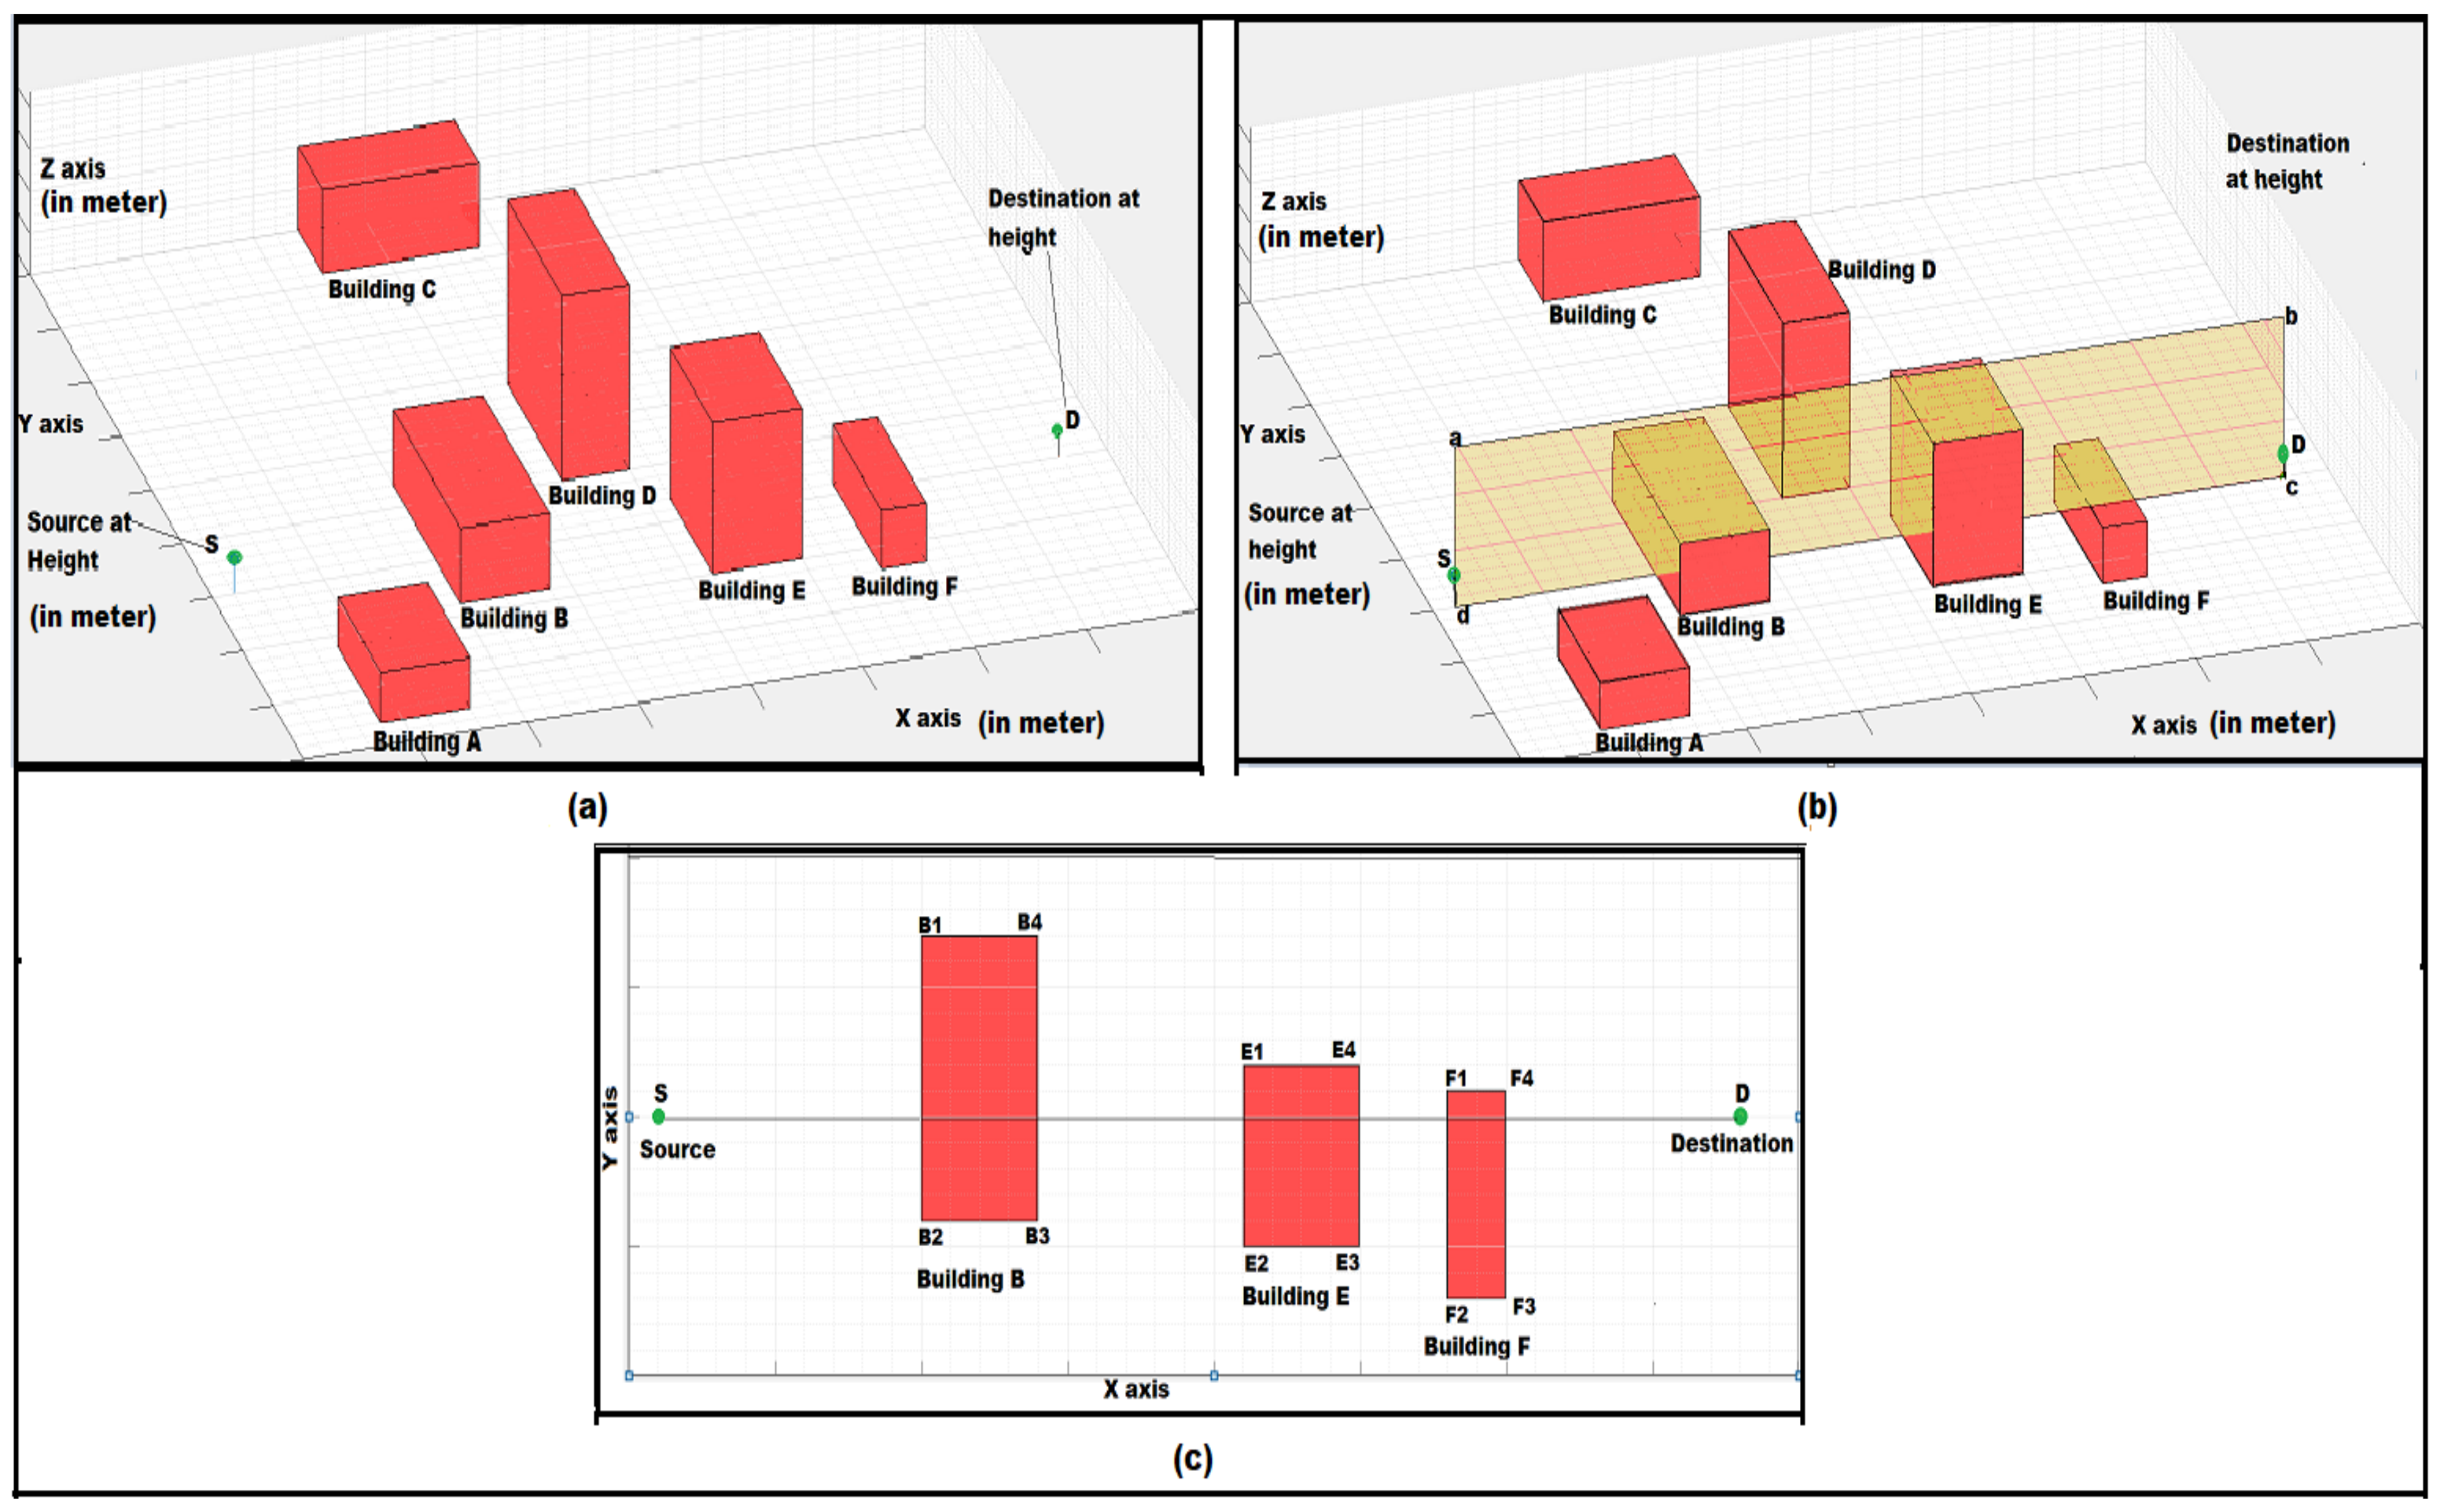
Figure 7.
(a) (i1, i2), (i3, i4), (i5, i6) are the intersecting points found after the intersection of plane XZ (between S and D that has shown in the previous figure) with Building B, Building E, Building F denoted by (\). (Values in x and y-axis are in meter). (b) This line j1 to i1 denotes the height of the Building B edge denoted by O1. Similarly, for other edges (j2–i2), (j3–i3), (j4–i4), (j5–i5), (j6–i6) the heights are O2, O3, O4, O5, O6. The source is denoted by “S” and Destination is denoted by “D”.
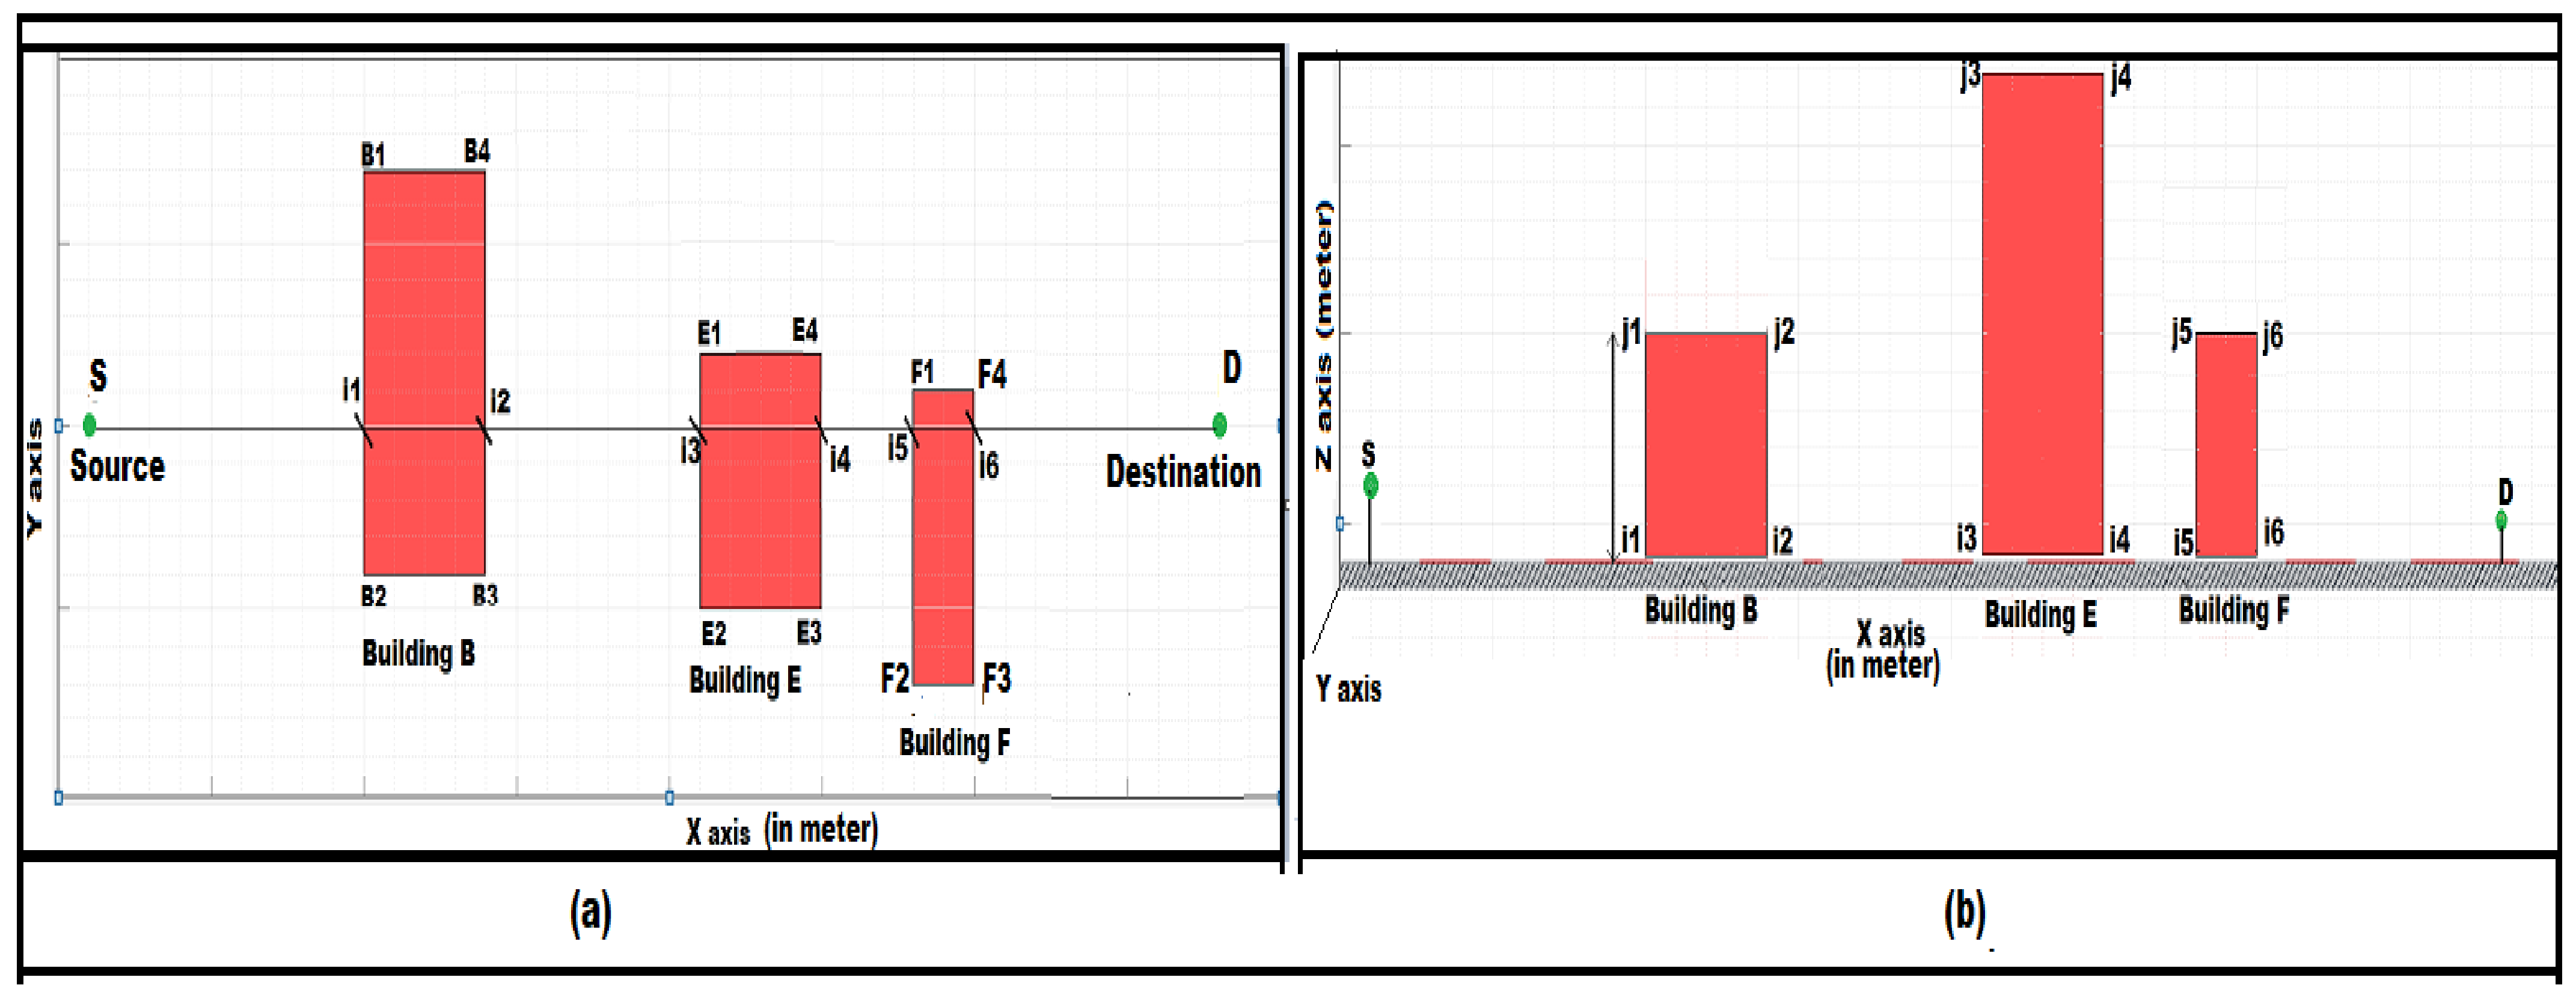
Figure 8.
(a) Route from Source(S) –j1–j3 is an upward travel path where j1 and j3 are the height points of intersection point i1 and i3 with respect to height of buildings denoted by (●). (b) Route from j3–j4–D (Destination) is a downward travel path where j3 and j4 are the height points of intersection point i3 and i4 with respect to height of buildings denoted by (●).
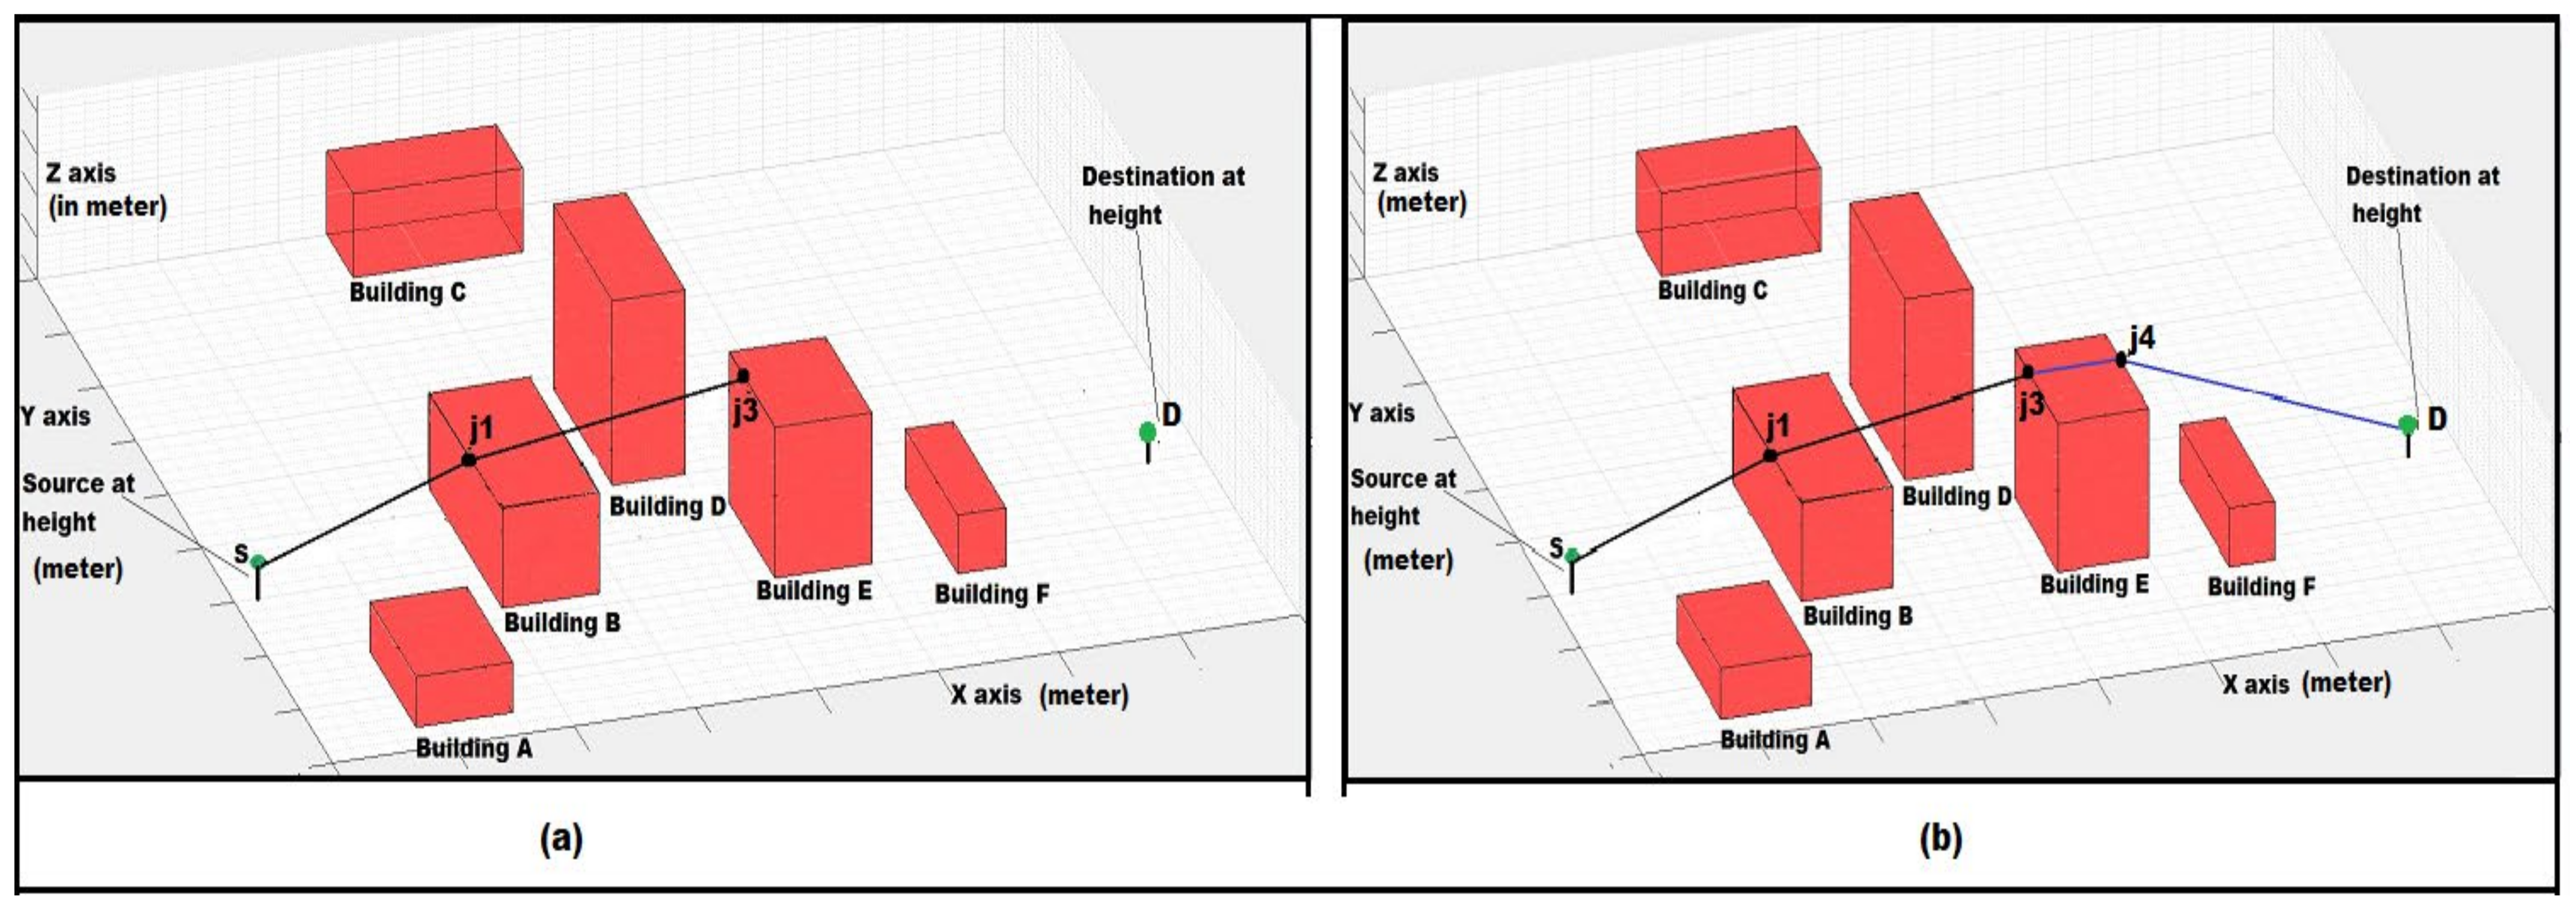
Figure 9.
(a) “abcd” is the buffer region to define inlier and outlier buildings and the region “abfe” is the left side panel and “cdef” is the right side. Buffer region defines that Building C is an outlier and the rest are inliers. (Values in x and y-axis are in meter.) (b) Planimetric view of setup that shows the building corner ground points of inlier buildings where (A1, A2, A3, A4), (B1, B2, B3, B4), (D1, D2, D3, D4), (E1, E2, E3, E4) and (F1, F2, F3, F4) are building corner ground points of Building A, Building B, Building D, Building E and Building F.
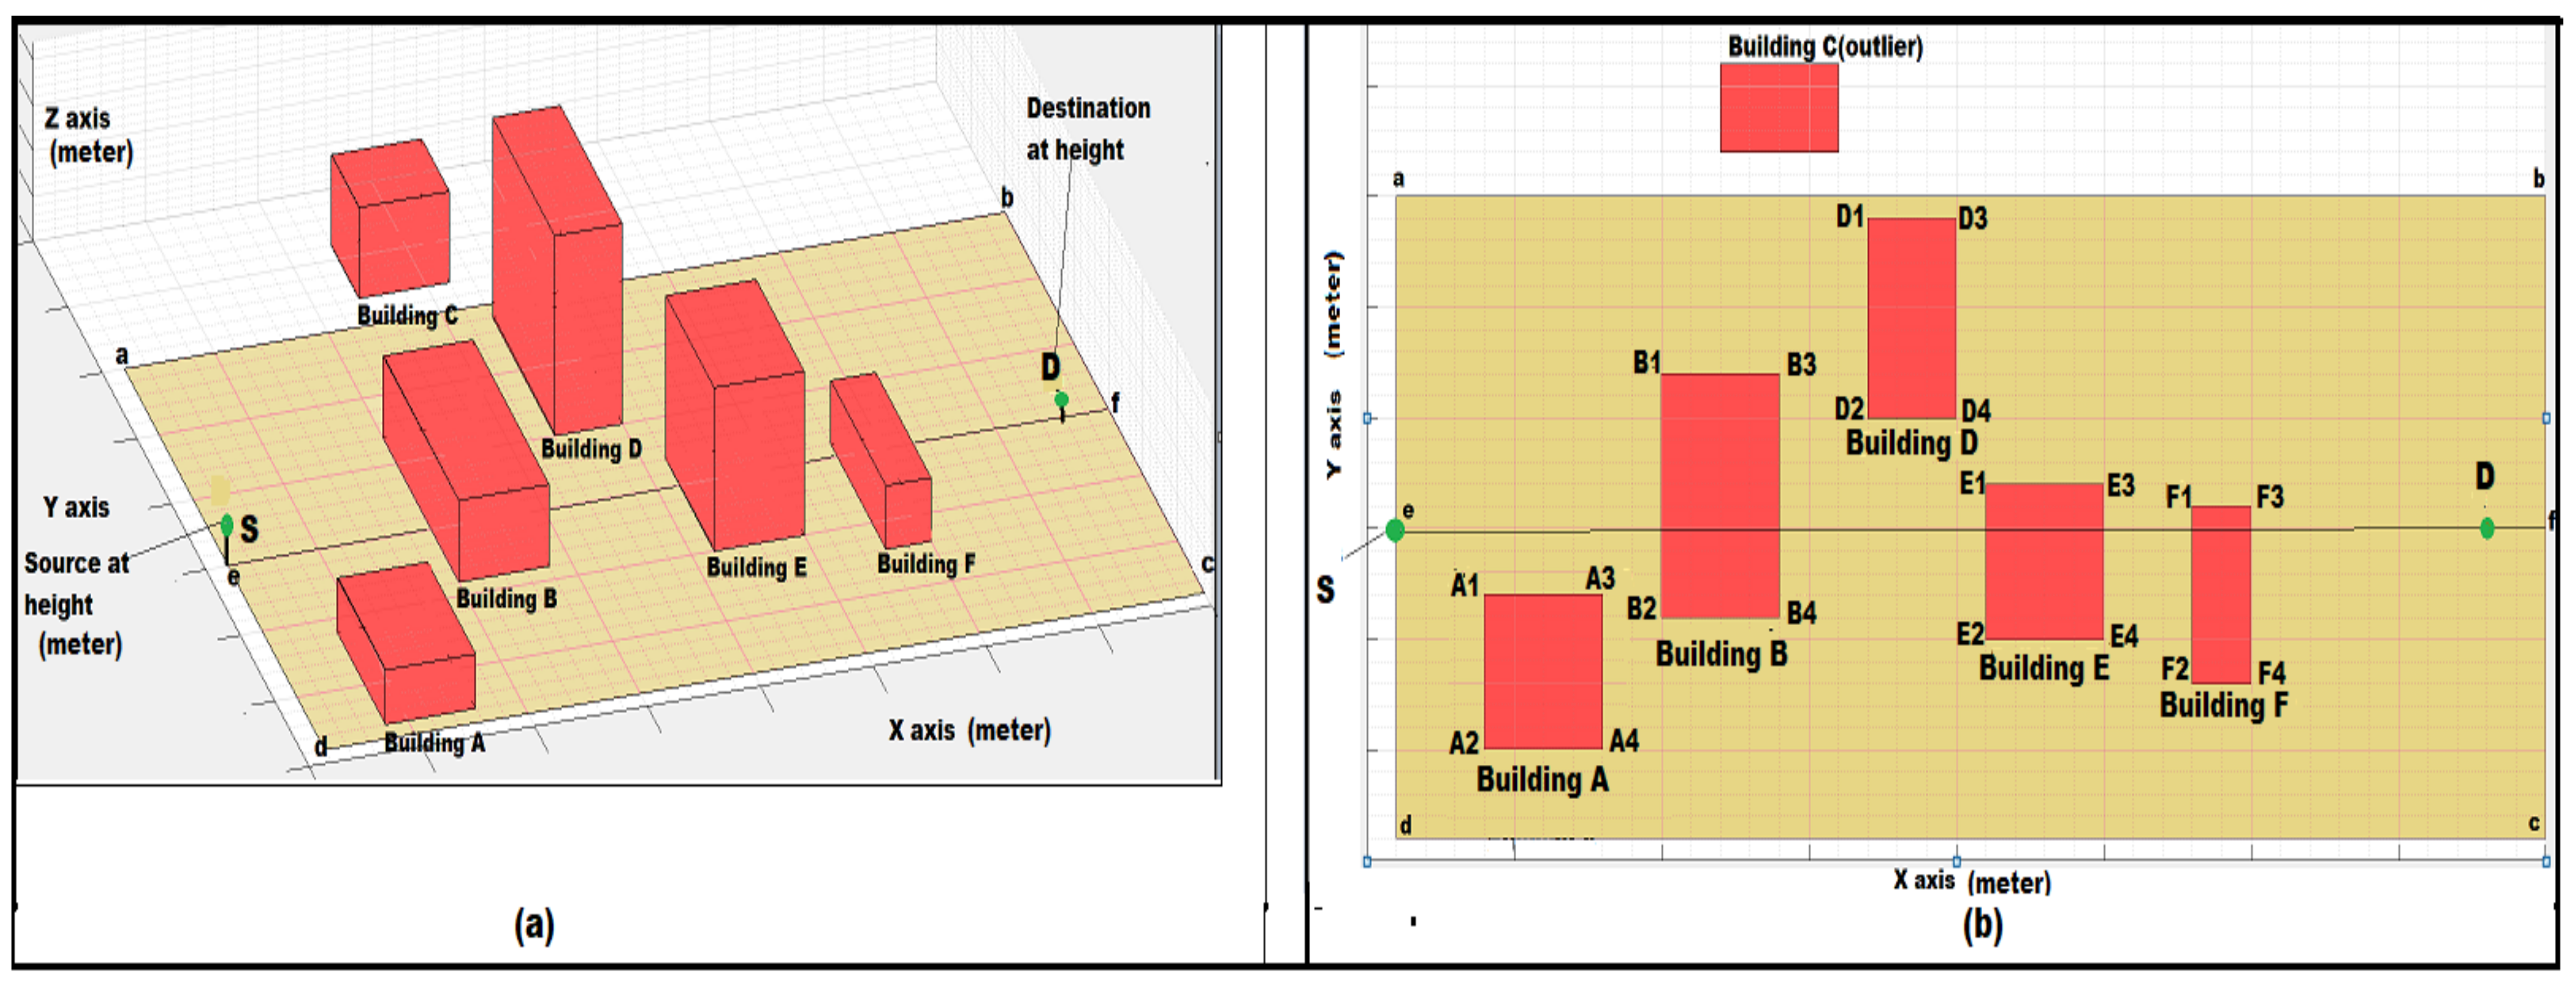
Figure 10.
(a) “abcd” shows the buffer region to select inlier and outlier buildings. The intersection points i1, i2, i3, i4, i5, i6, i7, and i8 were calculated from the intersection of the XZ plane between source and destination with the buildings. In this, the region “abfe” is considered and the distance from the right-side building points to the intersection points as (d1 = distance from B1 to i1) similarly from B3, D1, D3, E1, E3, F1 to i2, i3, i4, i5, i6, i7, and i8 are d2, d3, d4, d5, d6, d7, and d8 where S is source and D is the destination. (b) “abcd” shows the buffer region to select inlier and outlier buildings. The intersection points j1, j2, j3, j4, j5, j6, j7, and j8 were calculated from the intersection of the XZ plane between source and destination with the buildings. In this, the region “cdef” is considered and the distance from the right-side building points to the intersection points as (c1 = distance from A2 to j1) similarly from A4, B2, B4, E4, F2, F4 to j2, j3, j4, j5, j6, j7, and j8 are c2, c3, c4, c5, c6, c7, and c8, where S is source and D is the destination.
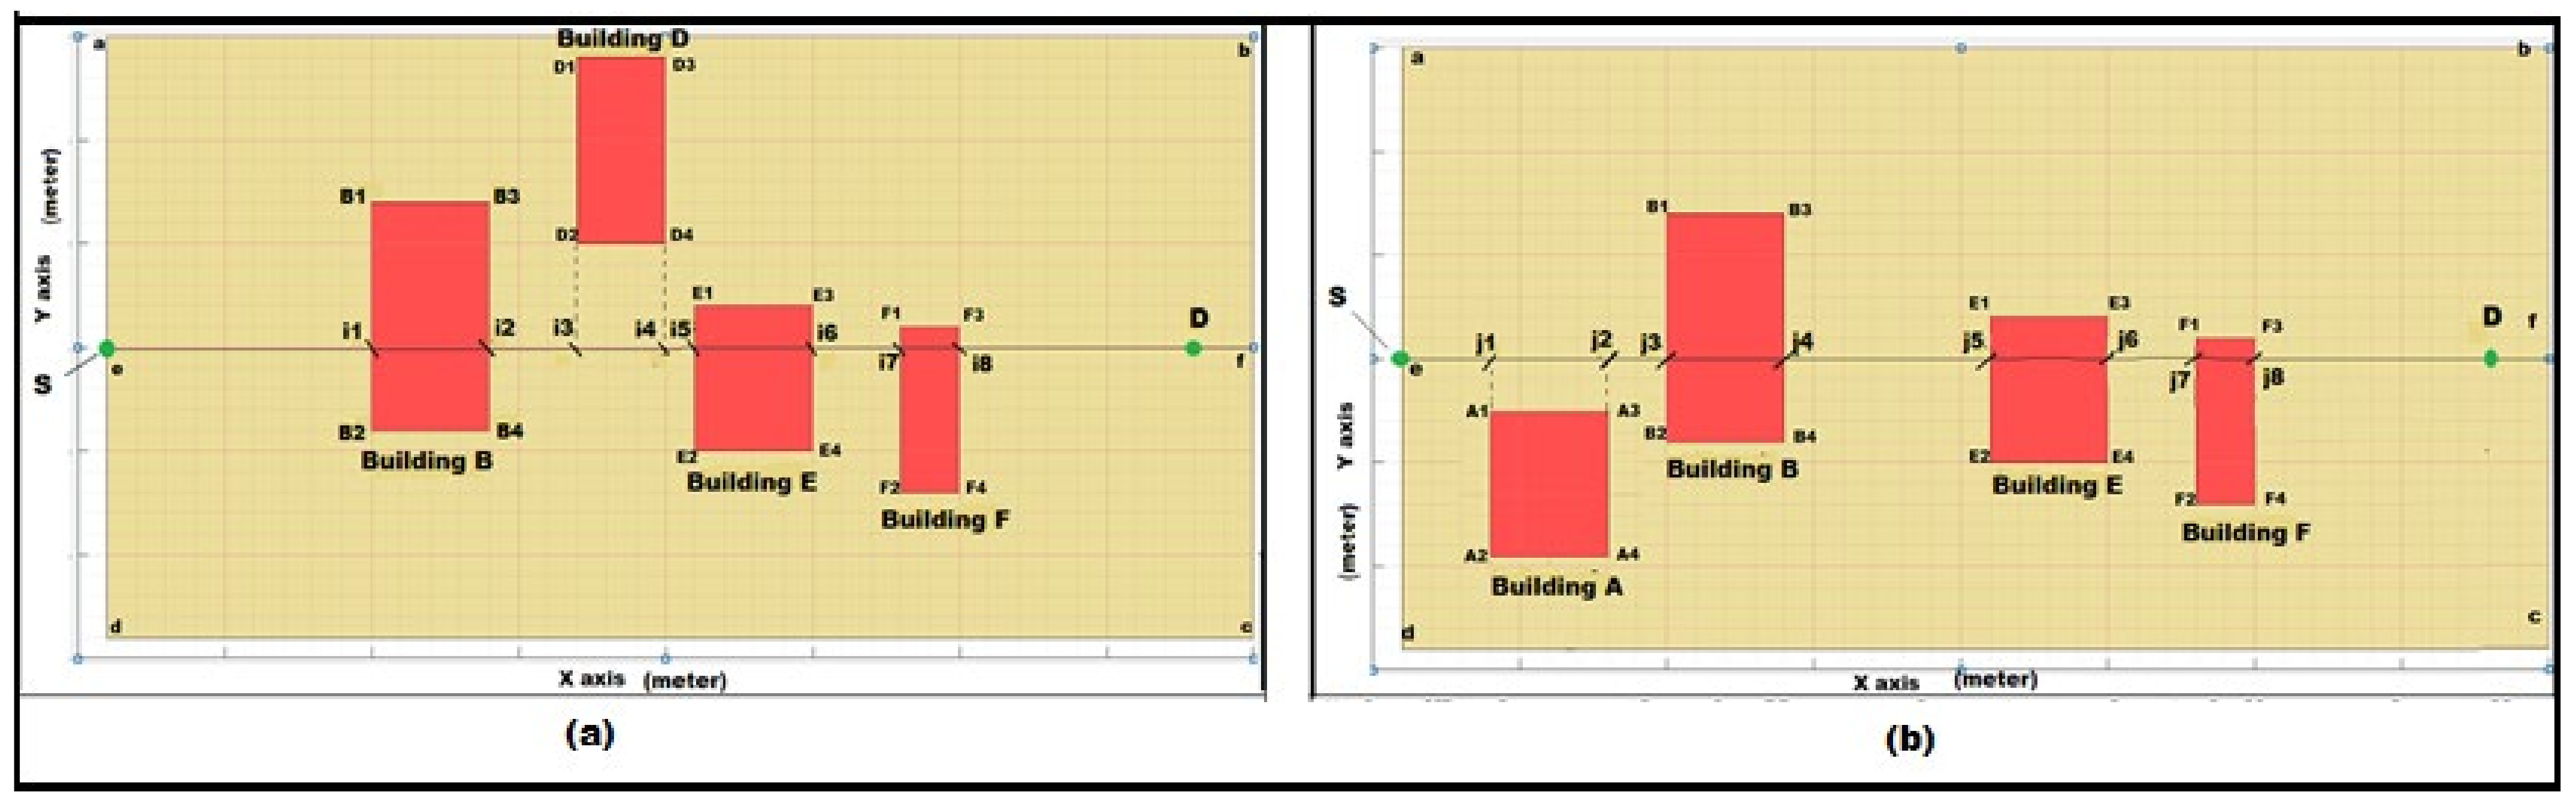
Figure 11.
(a) Simulated 3D environment of route determination where green dot show the source and destination symbol (●). (b) Cutting plane results for the simulated region. (c) Complete route traversal on left side panel. (d) Route traversal on right side panel starting from source. (e) Route traversal on left side and right side.
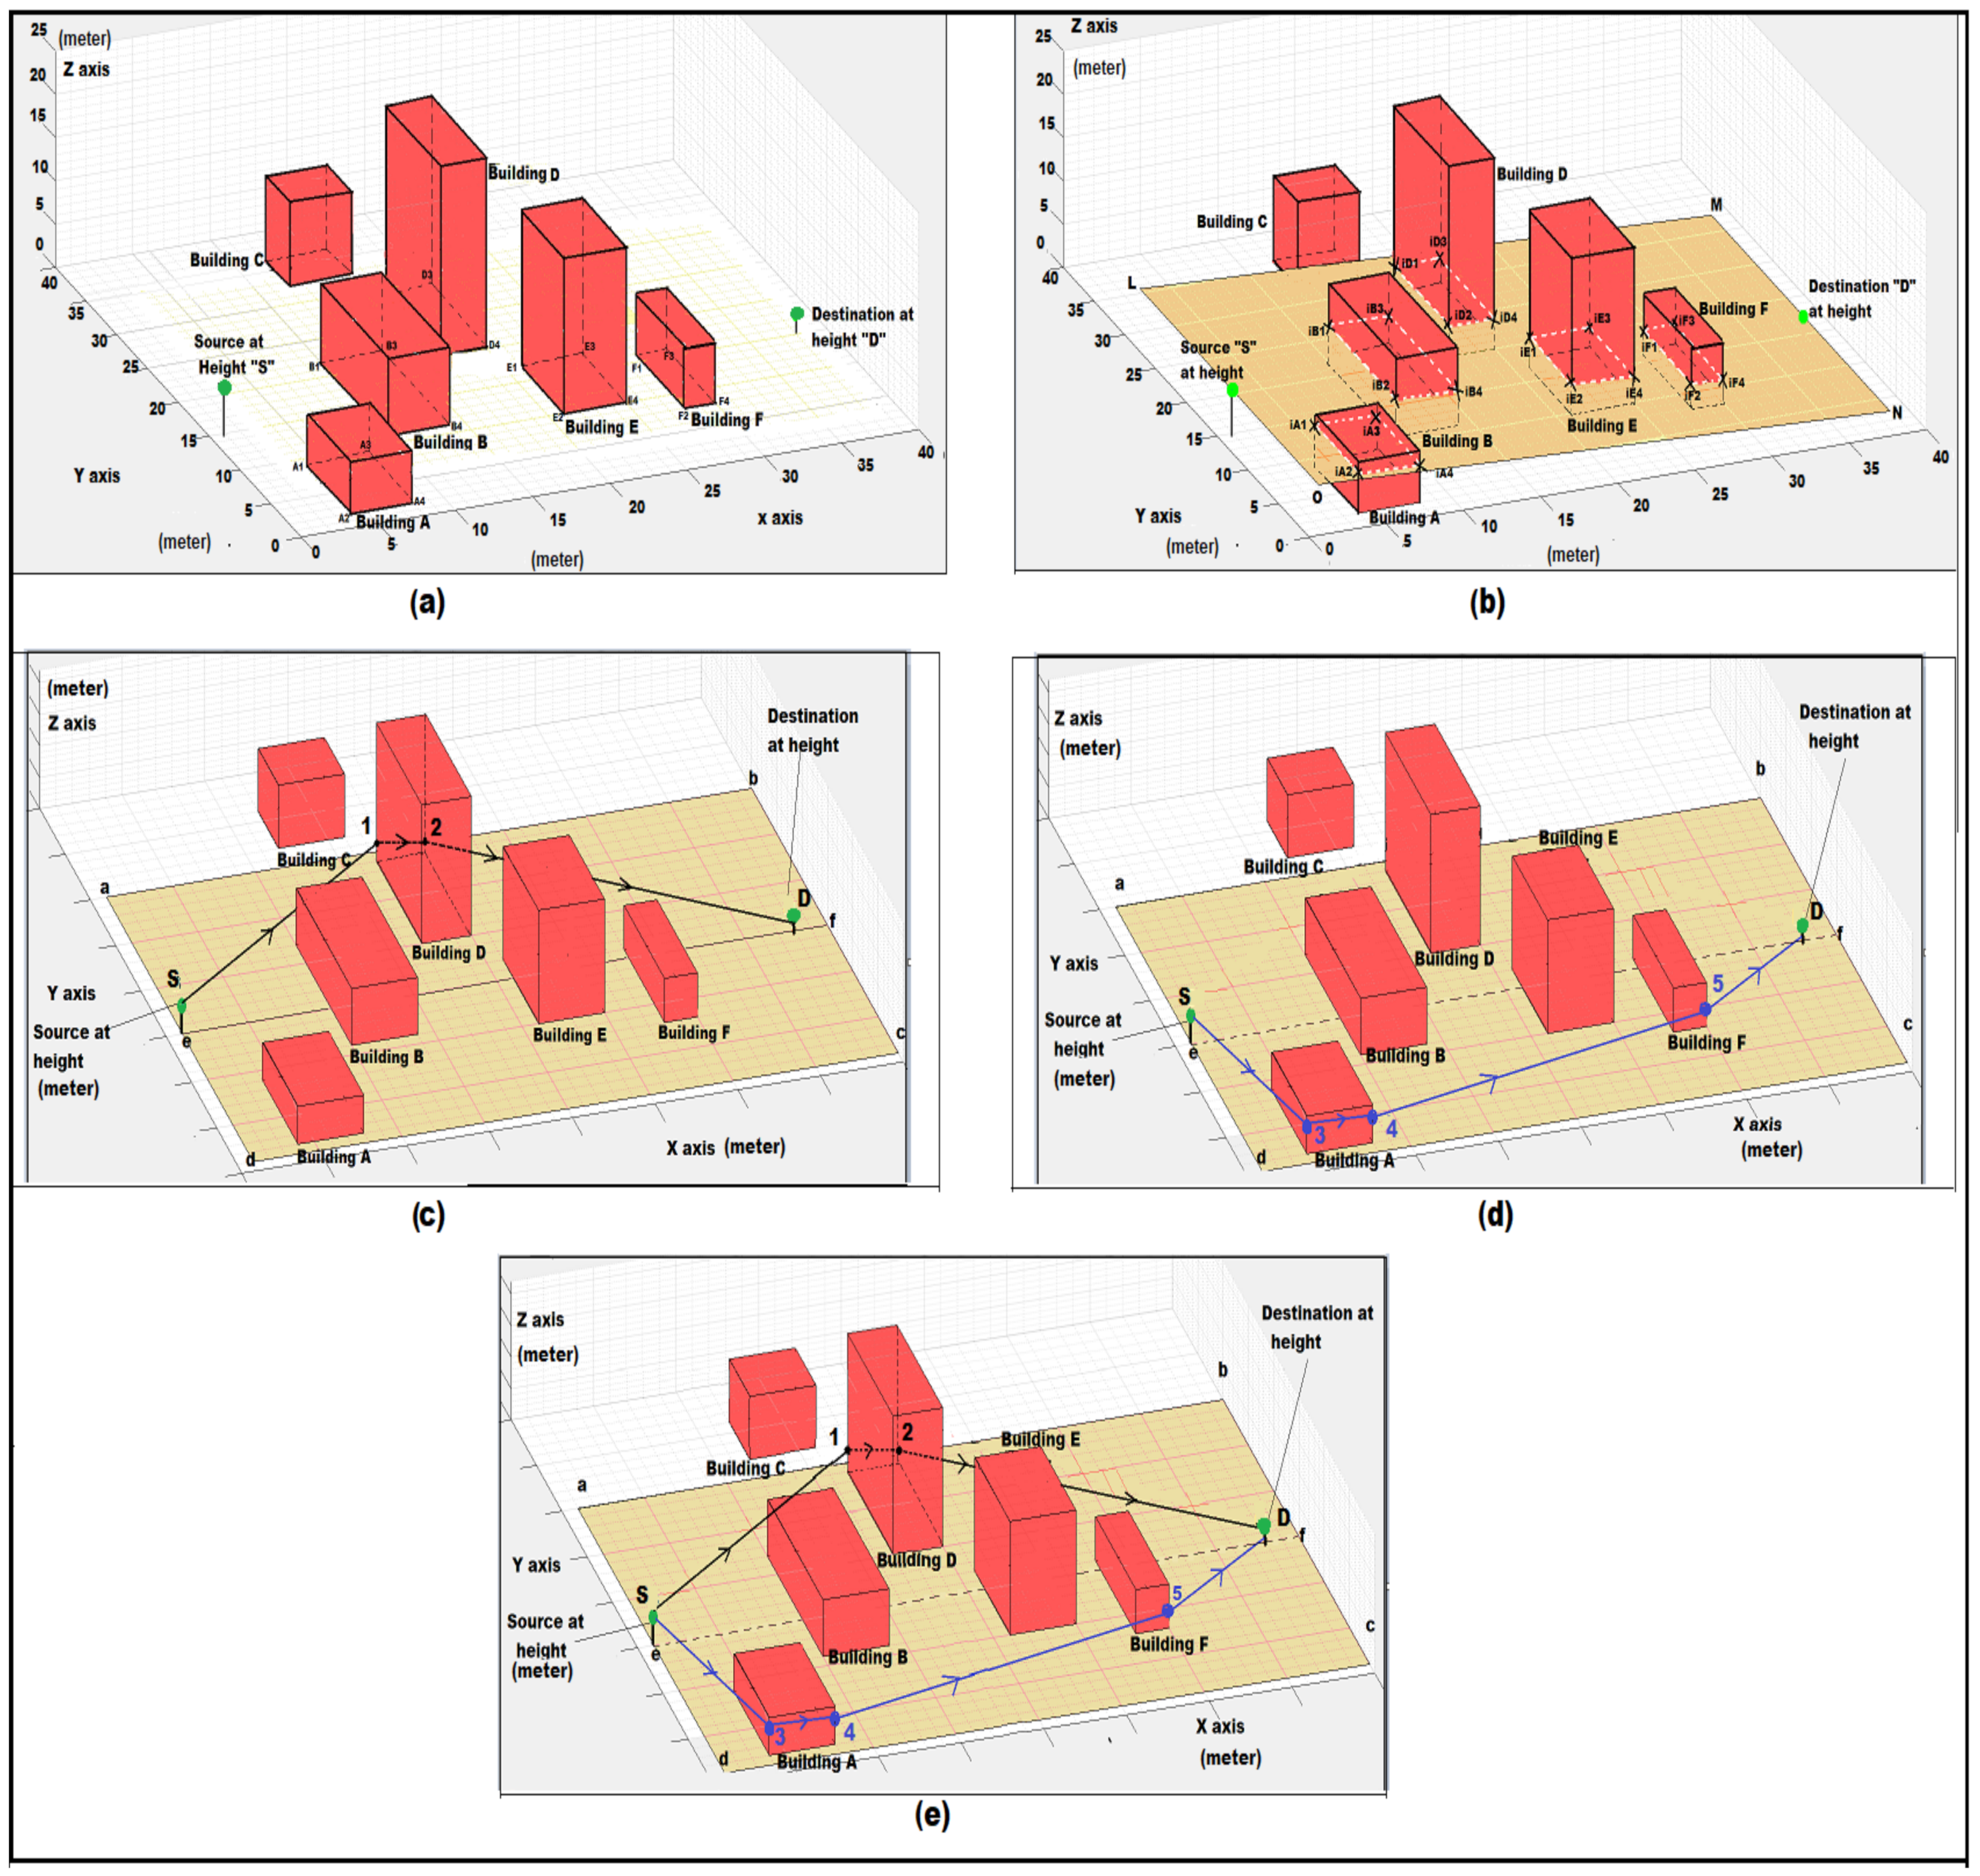
Figure 12.
(a) In this figure, reflection point (R’) is found (triangulation exists) between a pair of source and destination, (b) “S” is source and “D” is destination, R’ is new reflection point received.
Figure 12.
(a) In this figure, reflection point (R’) is found (triangulation exists) between a pair of source and destination, (b) “S” is source and “D” is destination, R’ is new reflection point received.
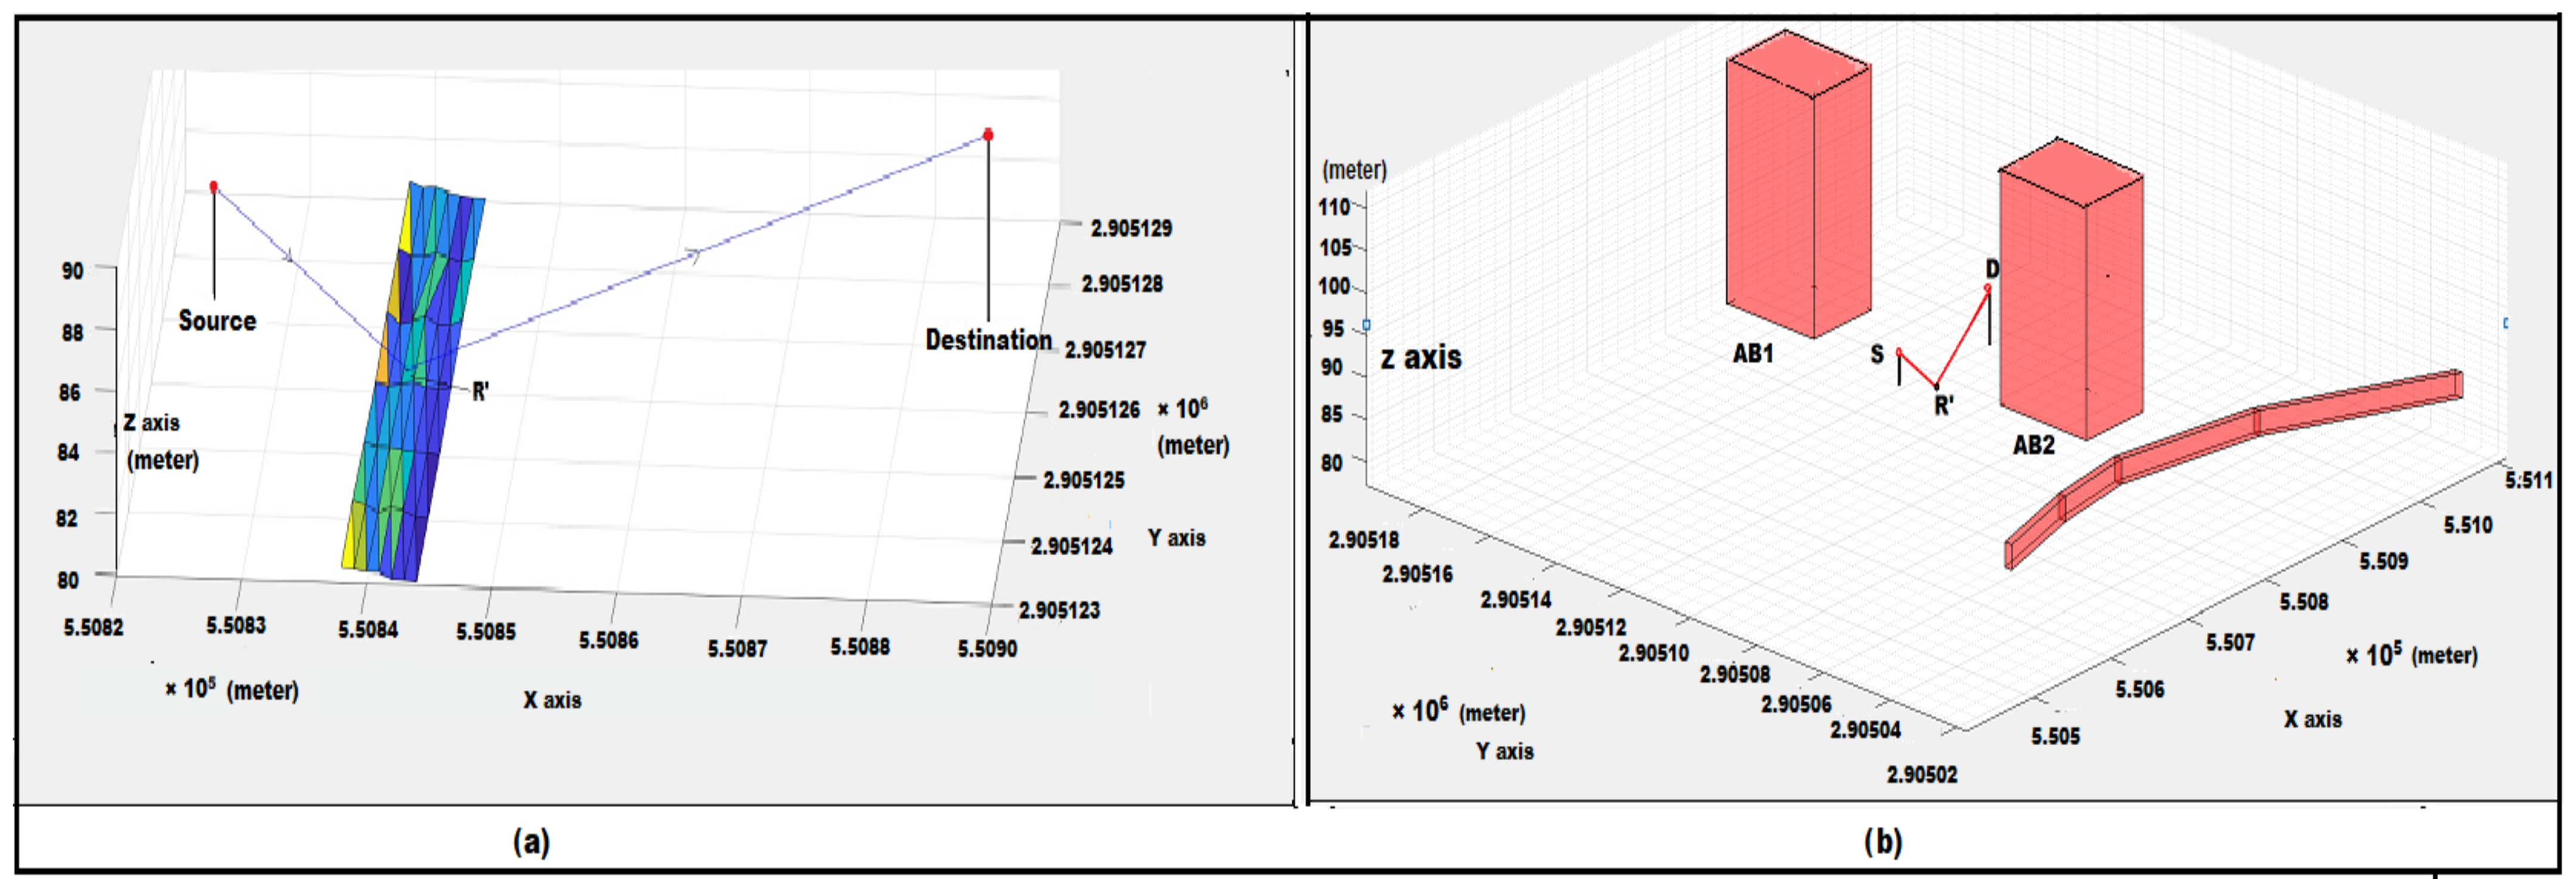
Figure 13.
“S” is source and “D” is destination and R’ is the new reflection point found on wall of building.
Figure 13.
“S” is source and “D” is destination and R’ is the new reflection point found on wall of building.

Figure 14.
(a) The blue route is the desired shortest route, and the rest of the yellow routes are the deviated routes. (b) Graph for the accuracy of route over the top.
Figure 14.
(a) The blue route is the desired shortest route, and the rest of the yellow routes are the deviated routes. (b) Graph for the accuracy of route over the top.
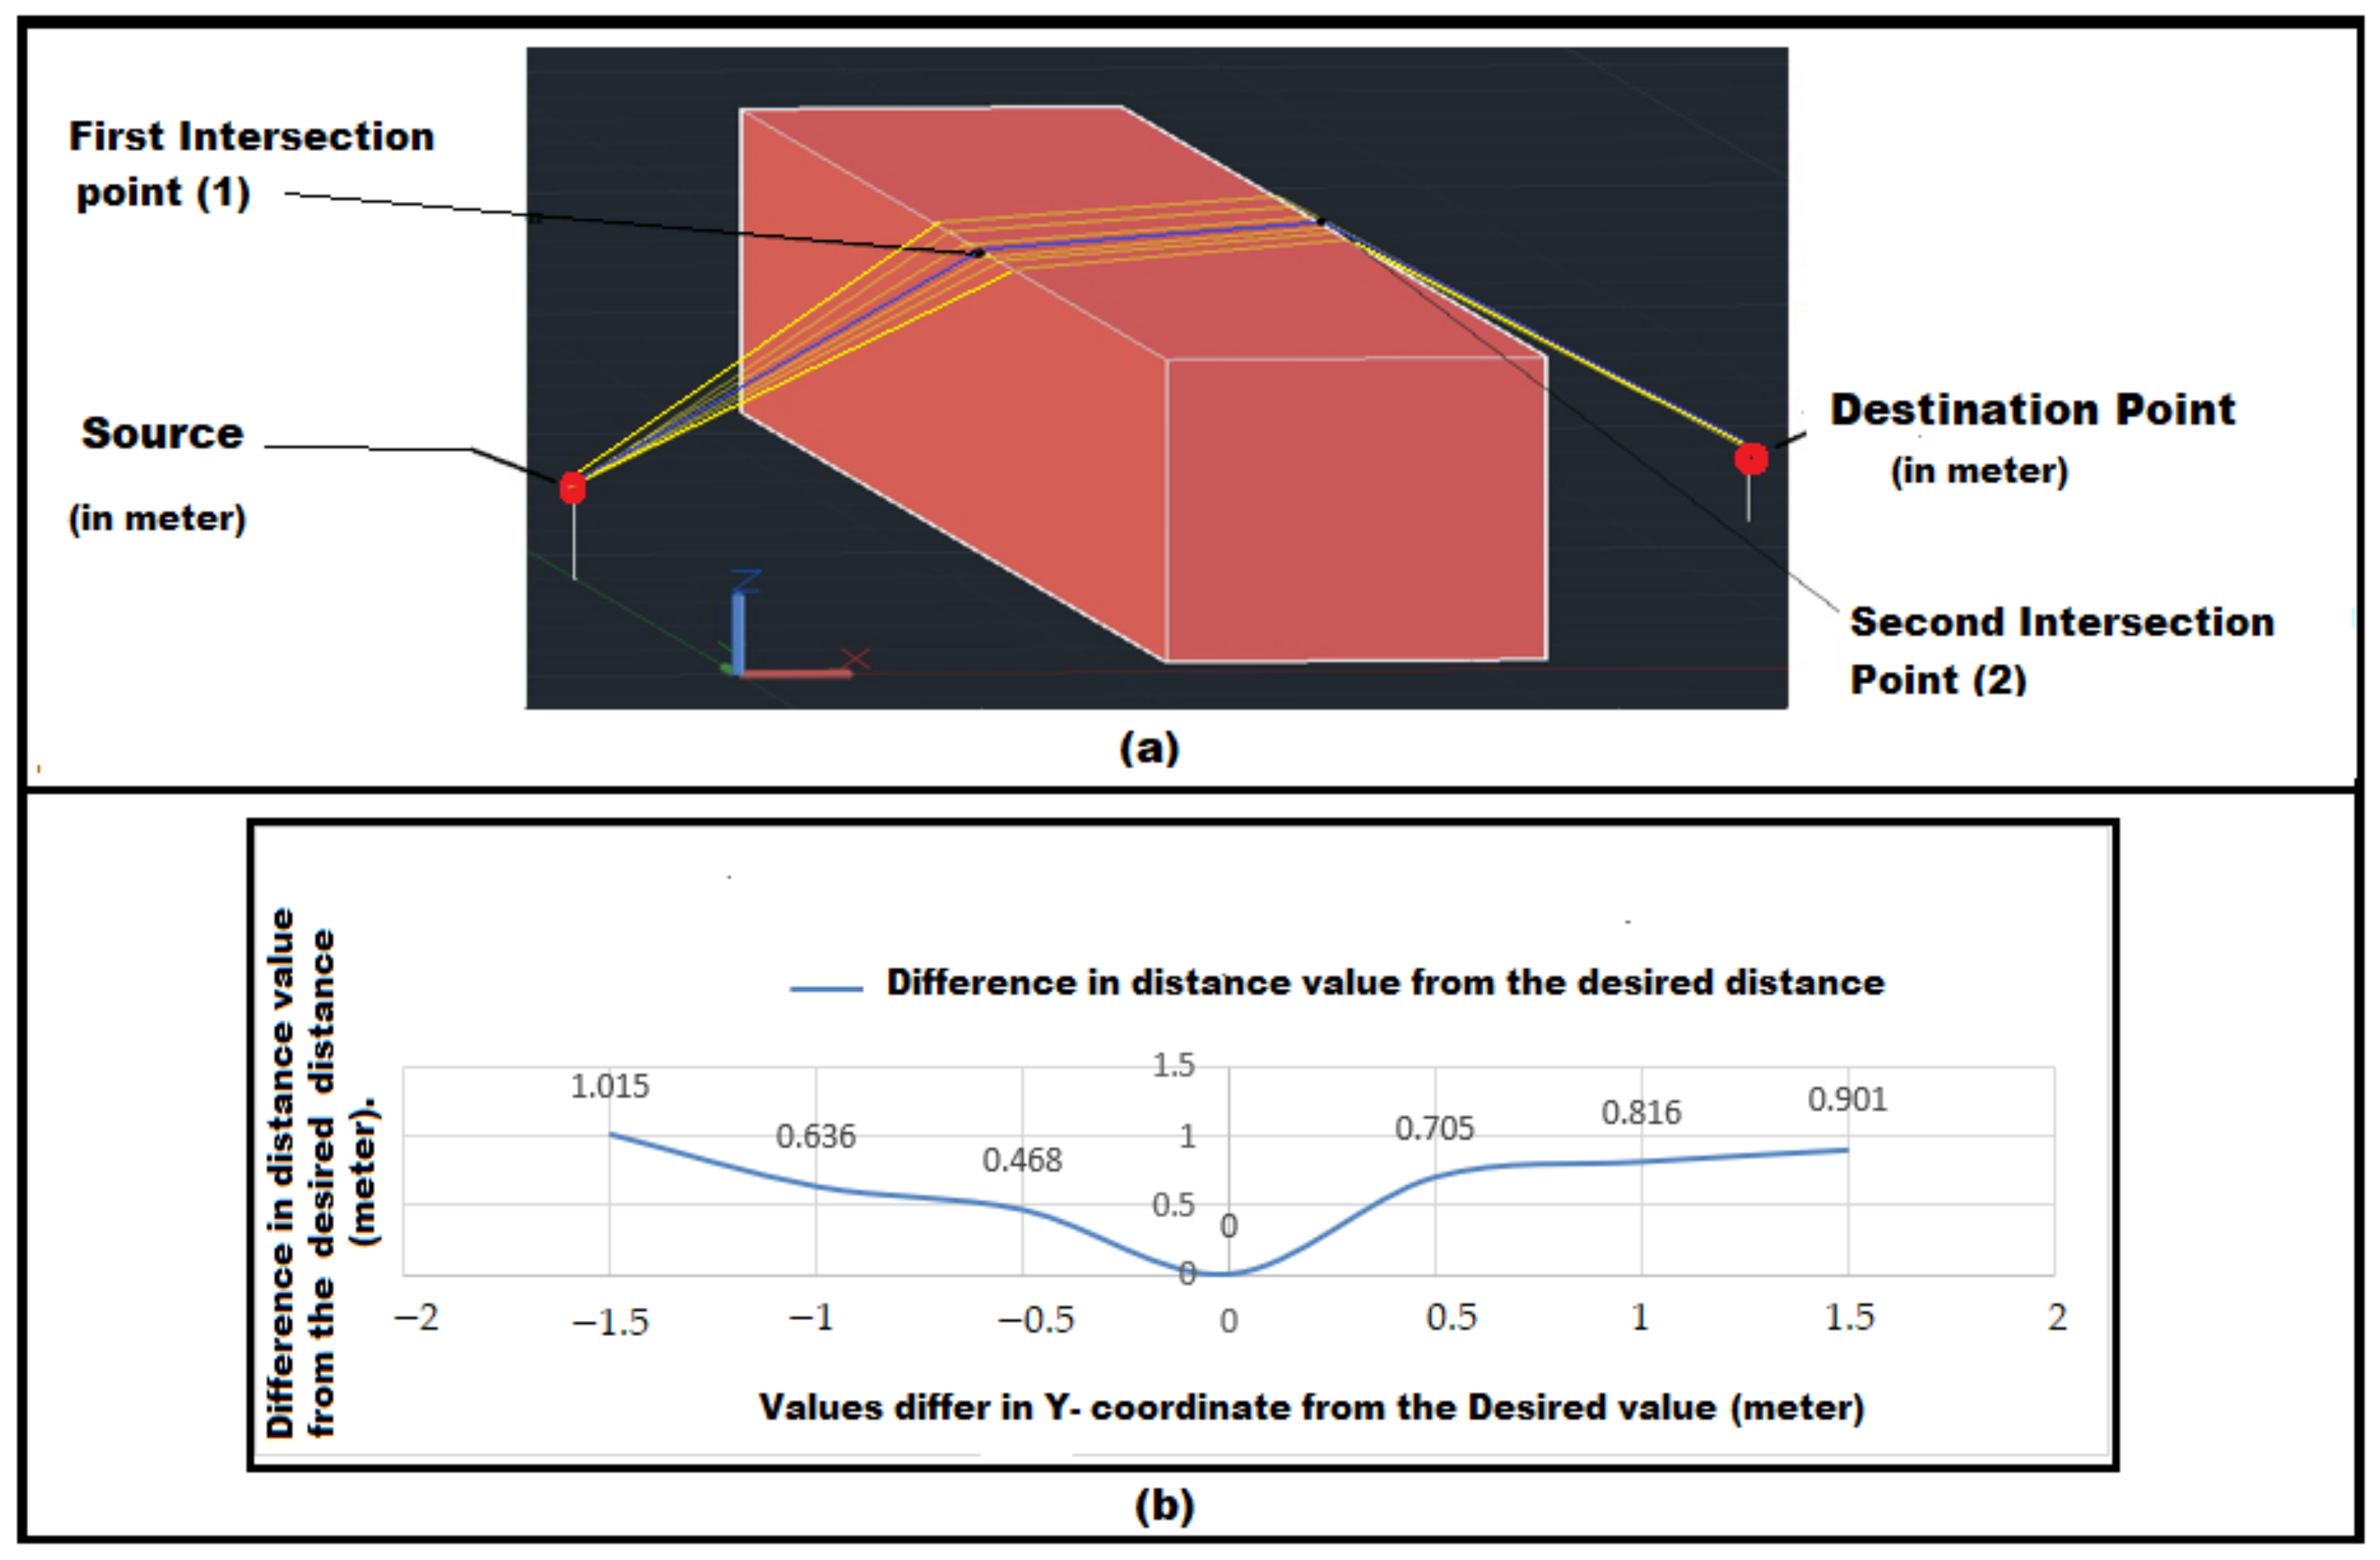
Figure 15.
(a) “1” is the first intersection point moving from source to destination around the sides of the building. Similarly, “2” is the second intersection point. The blue route is the desired route from the algorithm and the rest yellow routes are the deviated routes, when the first intersected point has shifted value upward and downward in the Z direction. (b) Graph shows the accuracy of the route around the sides.
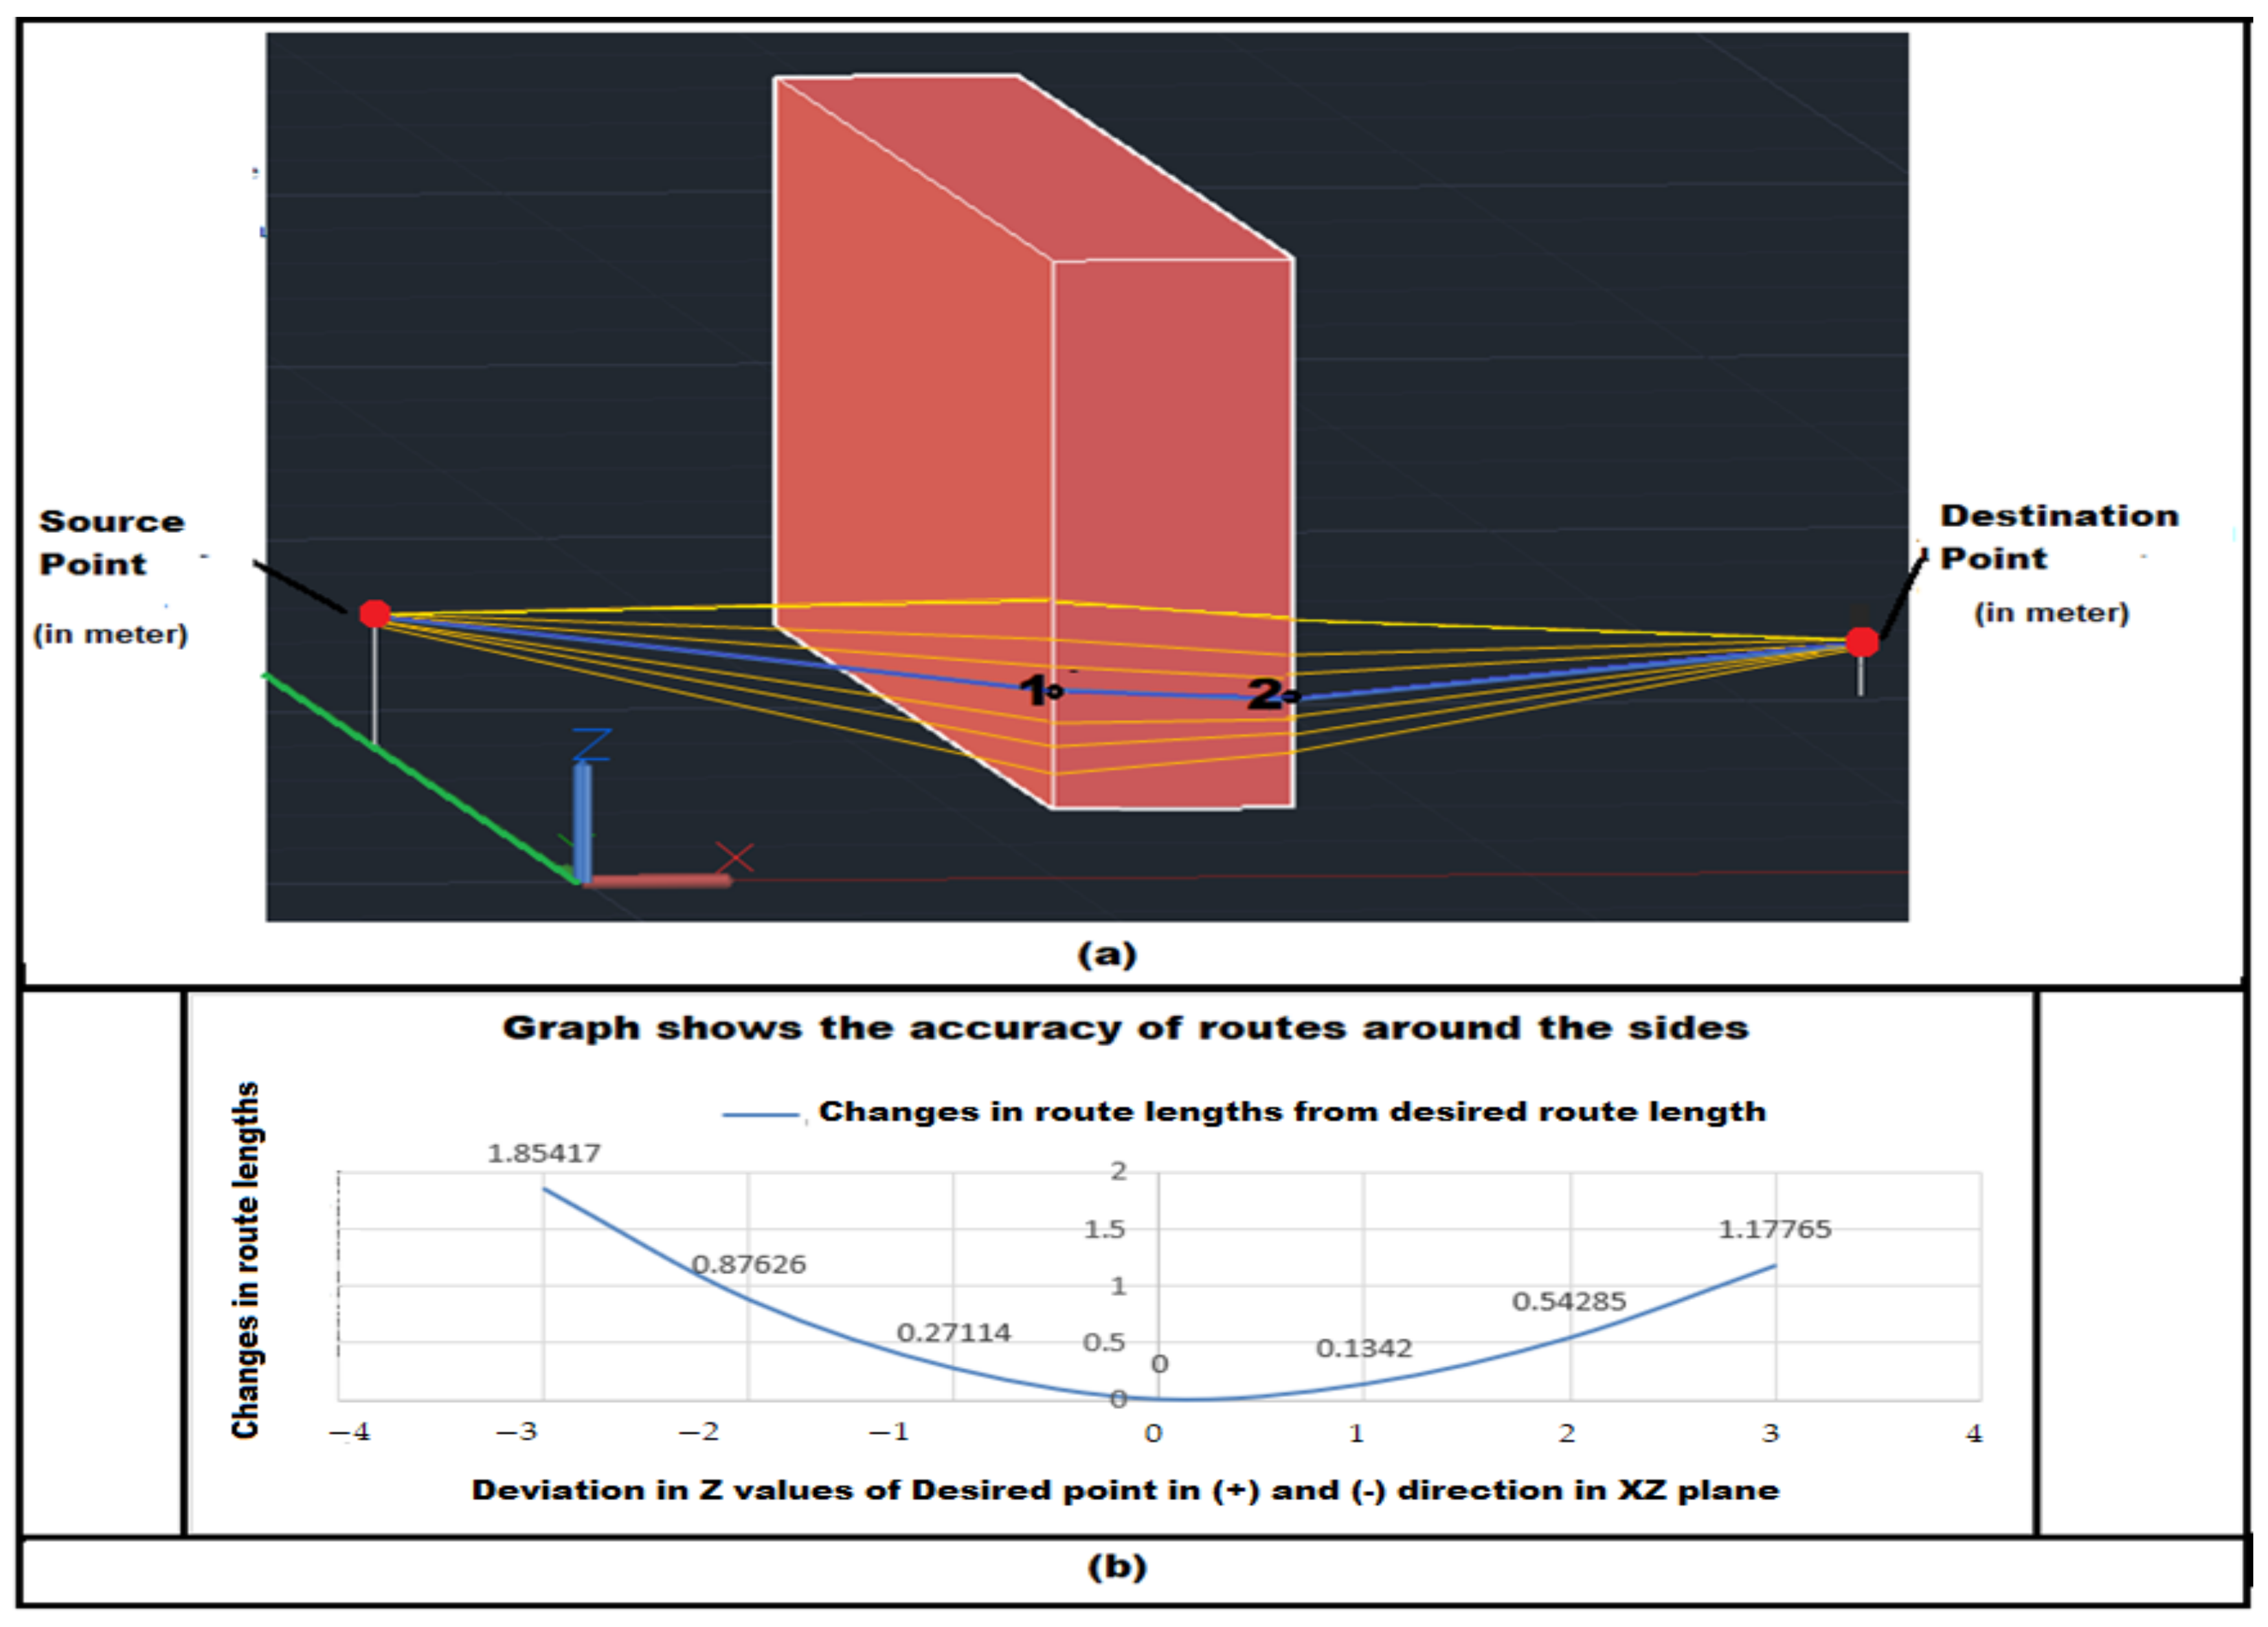
Figure 16.
Error propagation due to inaccuracies in terrain data.
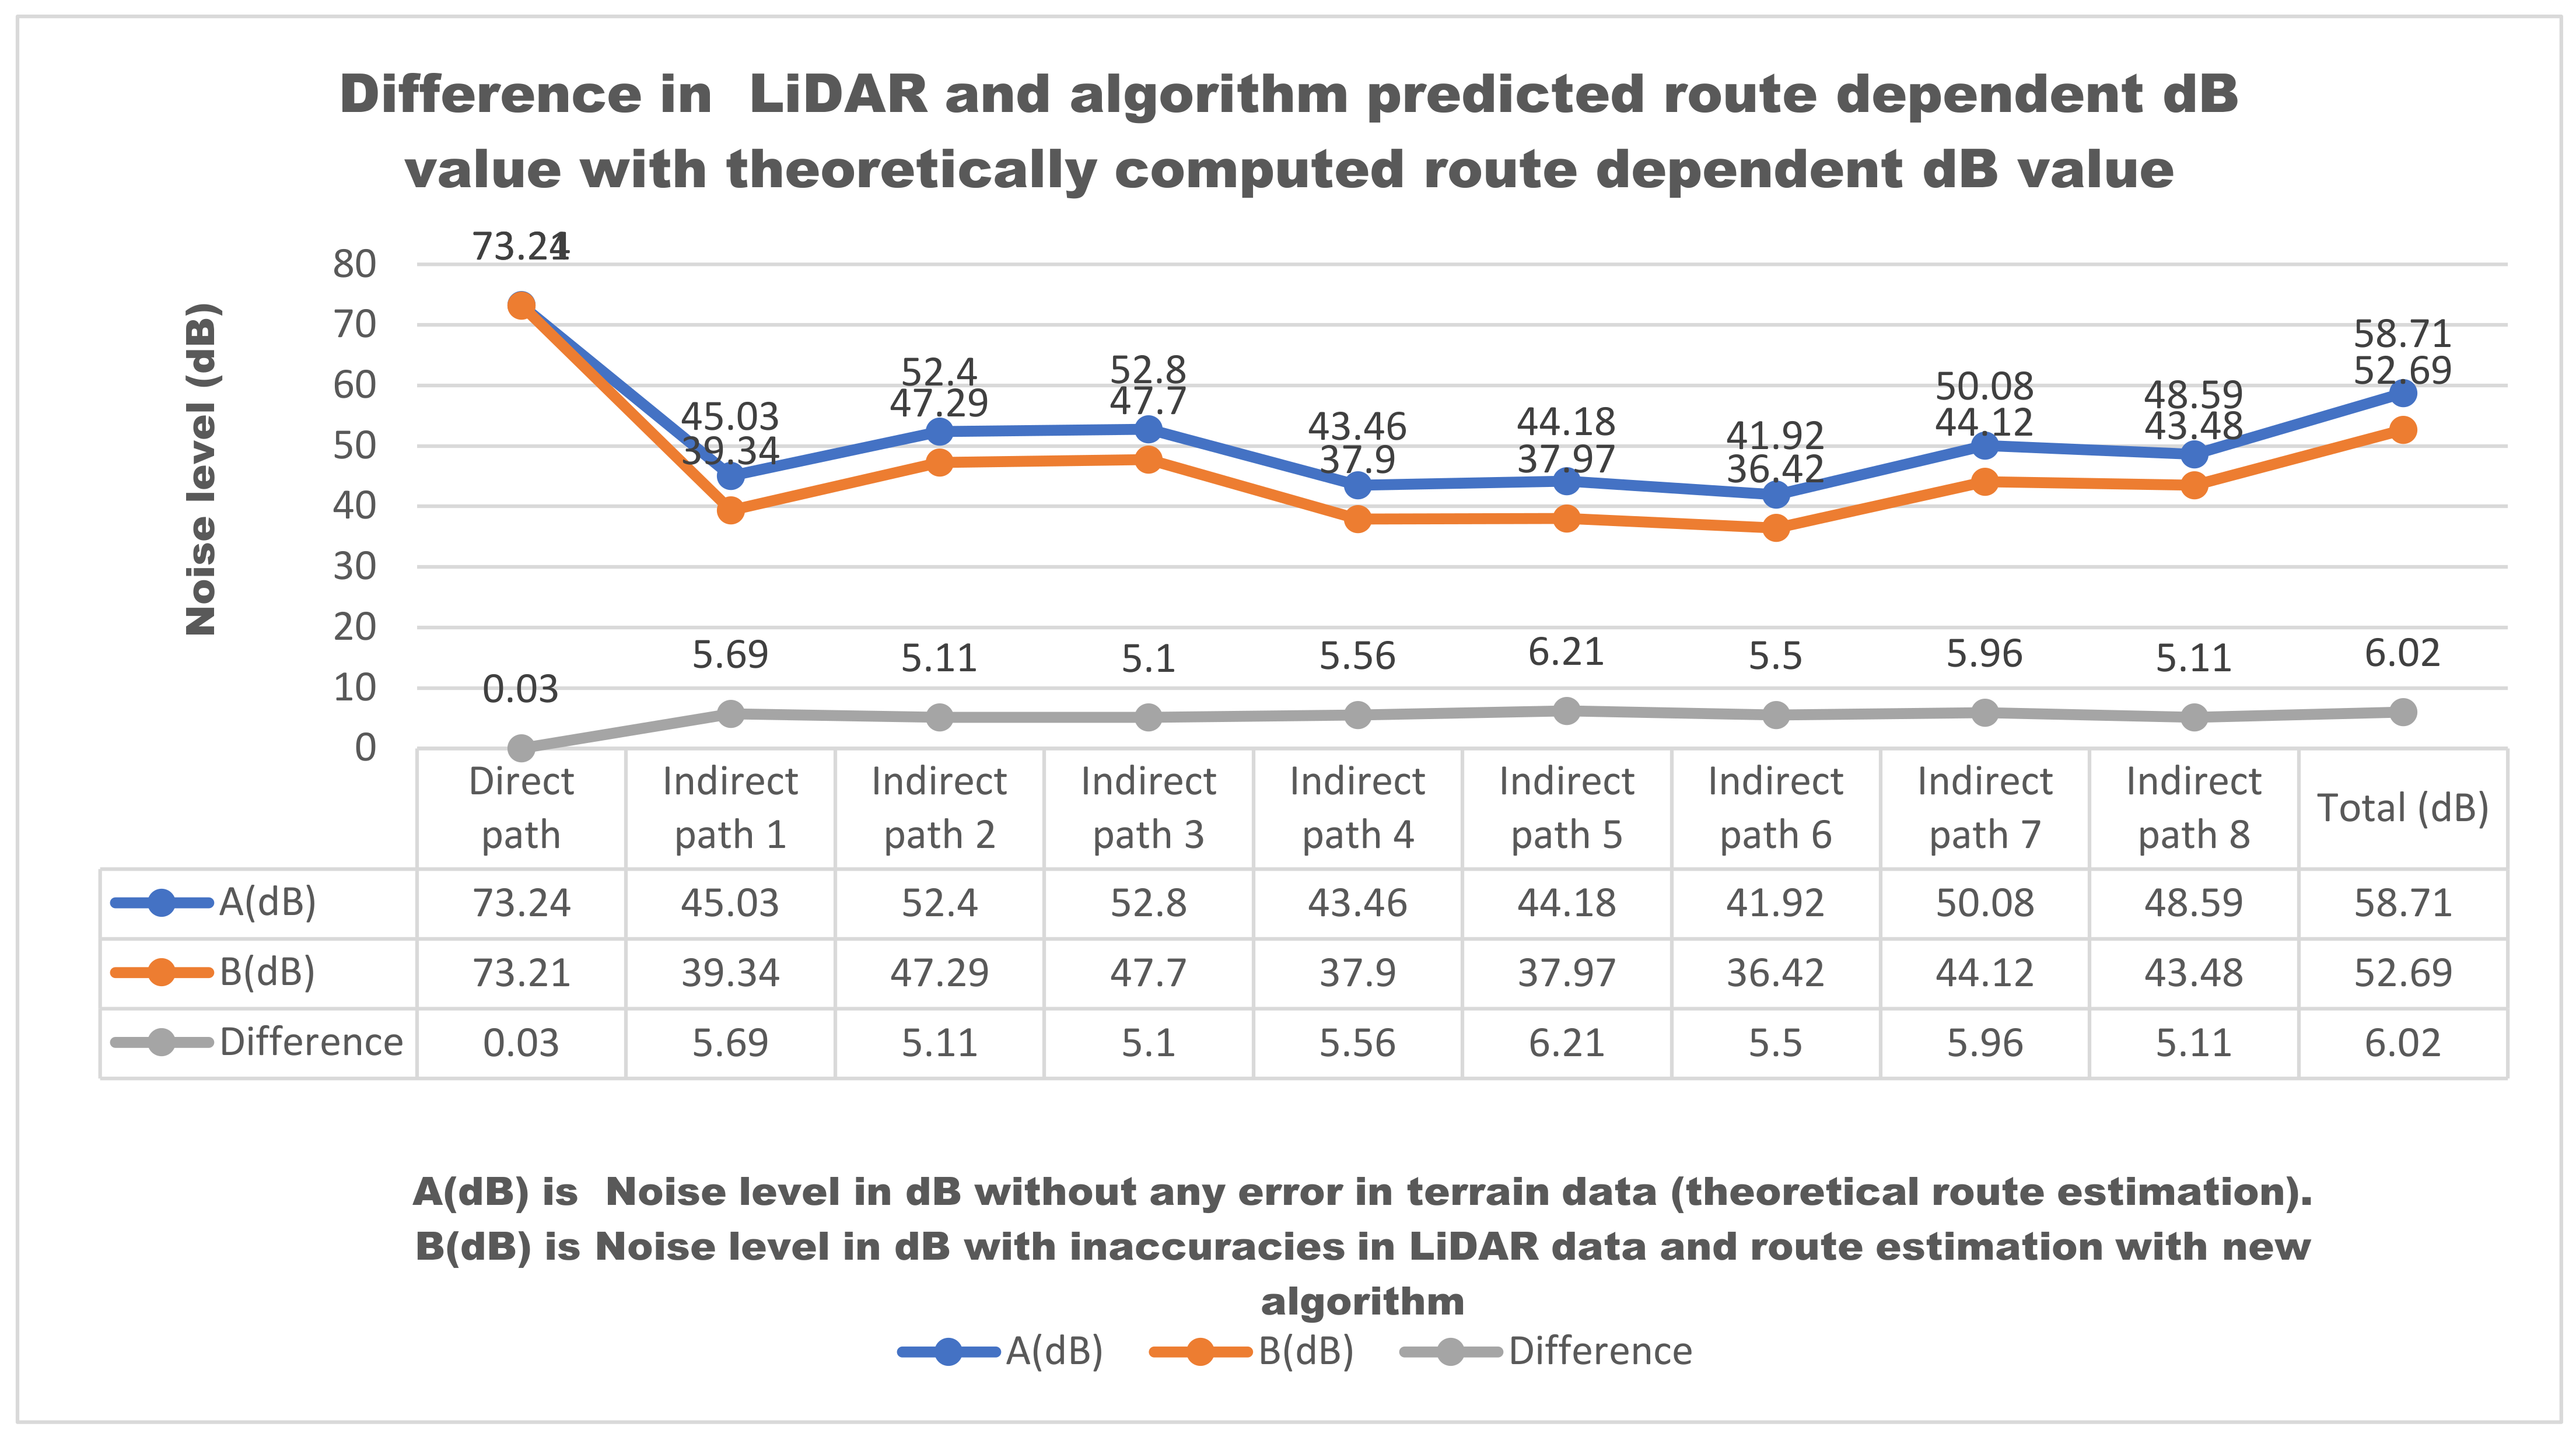
Figure 17.
(a) Google Earth map of RGIPT campus showing railway line (noise source) with 25 points on line, buildings and the rest area where the destination points are considered. (b) Prediction of noise map of RGIPT campus due to noise sources at railway line. Noise levels are projected in DB. Source and destinations’ locations are marked with small circular points.
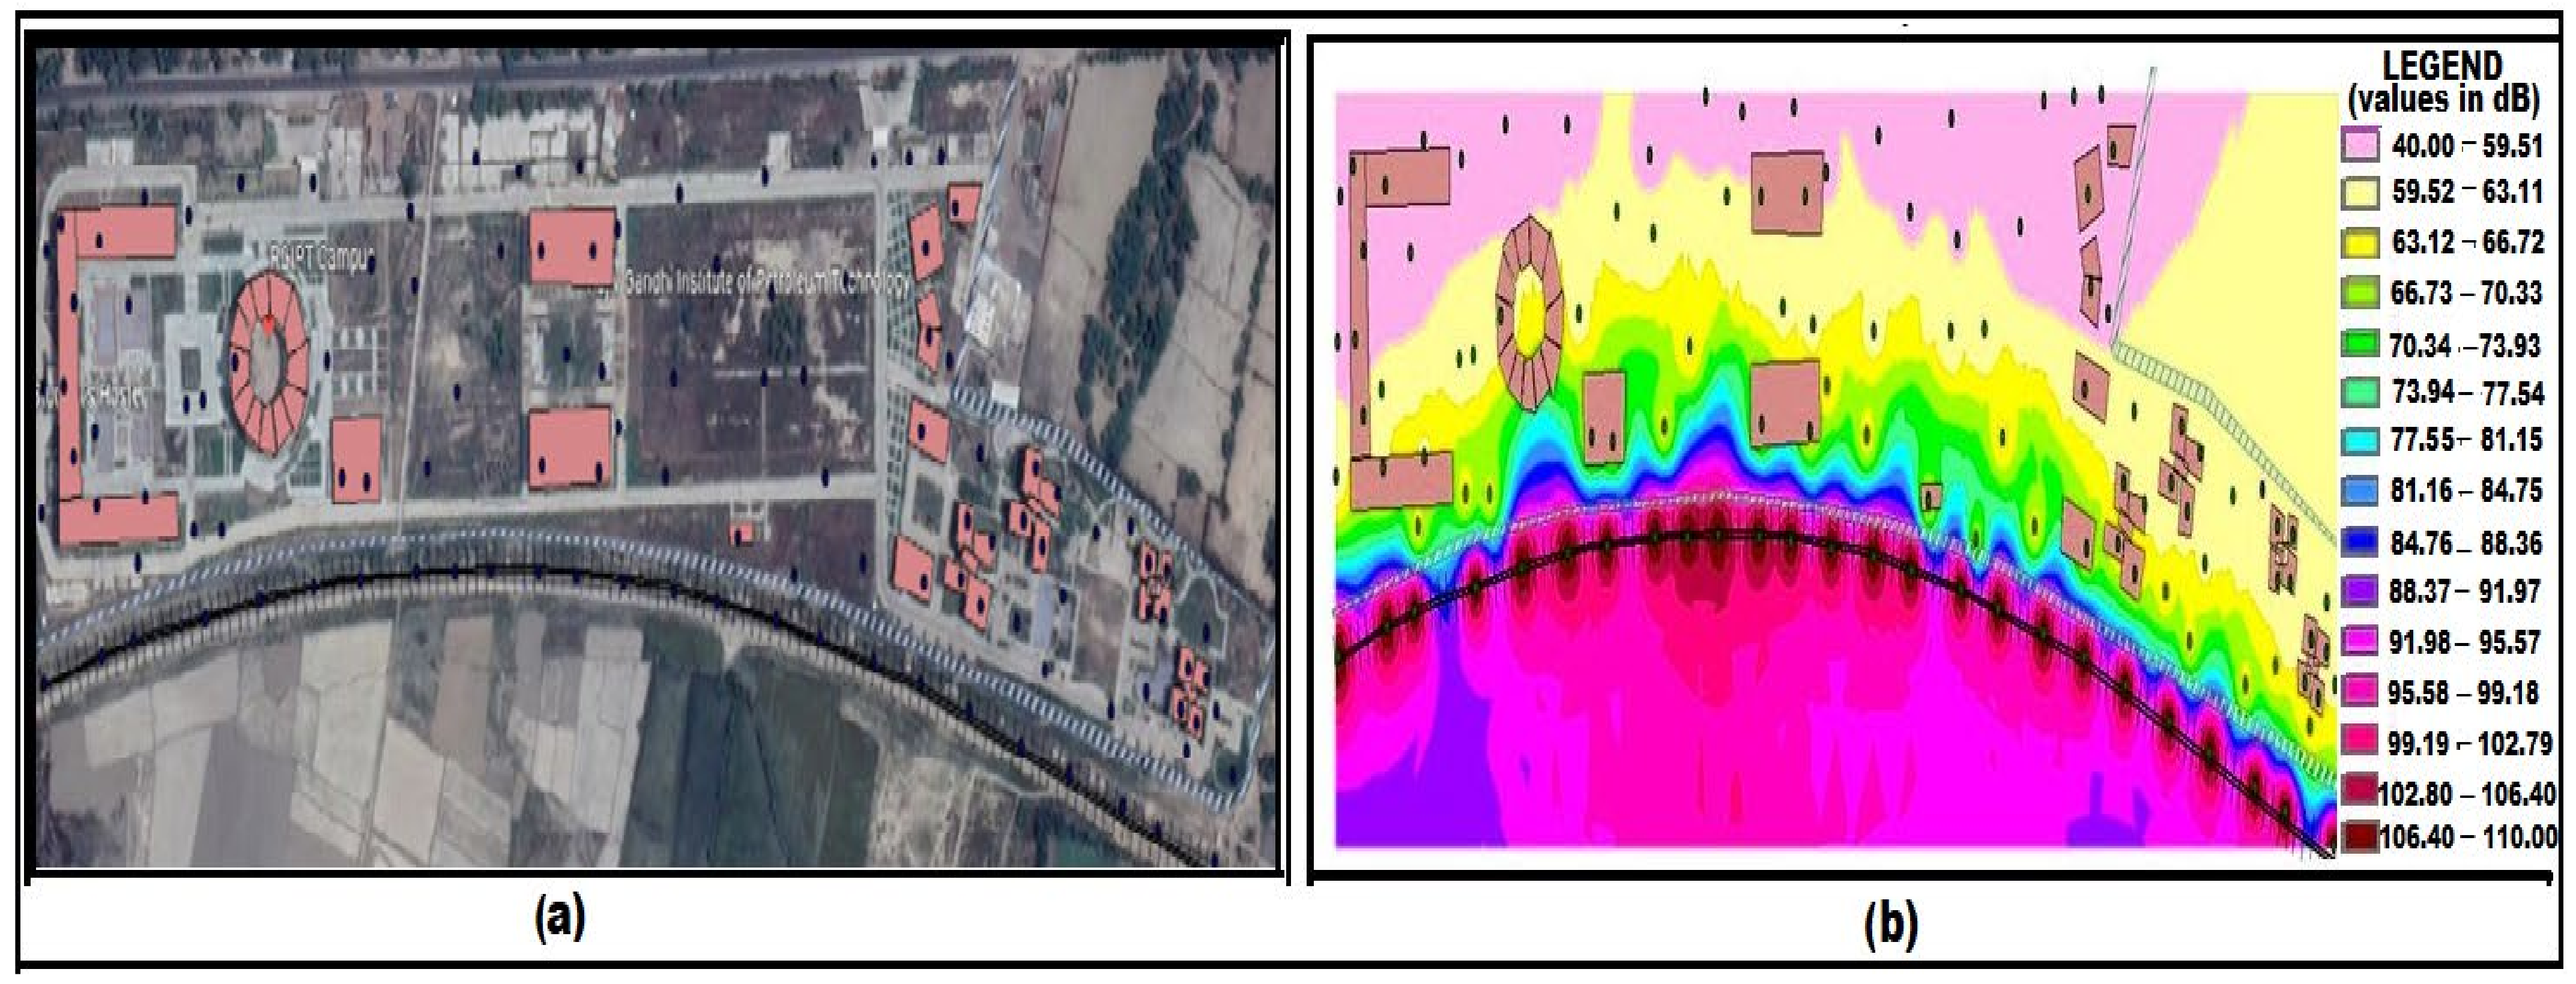
Figure 18.
RGIPT campus noise map for noise source points at railway line when train is at different location and the noise receiver points (destination) are all over the RGIPT campus including buildings of different height. (a) 1st instance, (b) 2nd instance, and (c) 3rd instance.
Figure 18.
RGIPT campus noise map for noise source points at railway line when train is at different location and the noise receiver points (destination) are all over the RGIPT campus including buildings of different height. (a) 1st instance, (b) 2nd instance, and (c) 3rd instance.
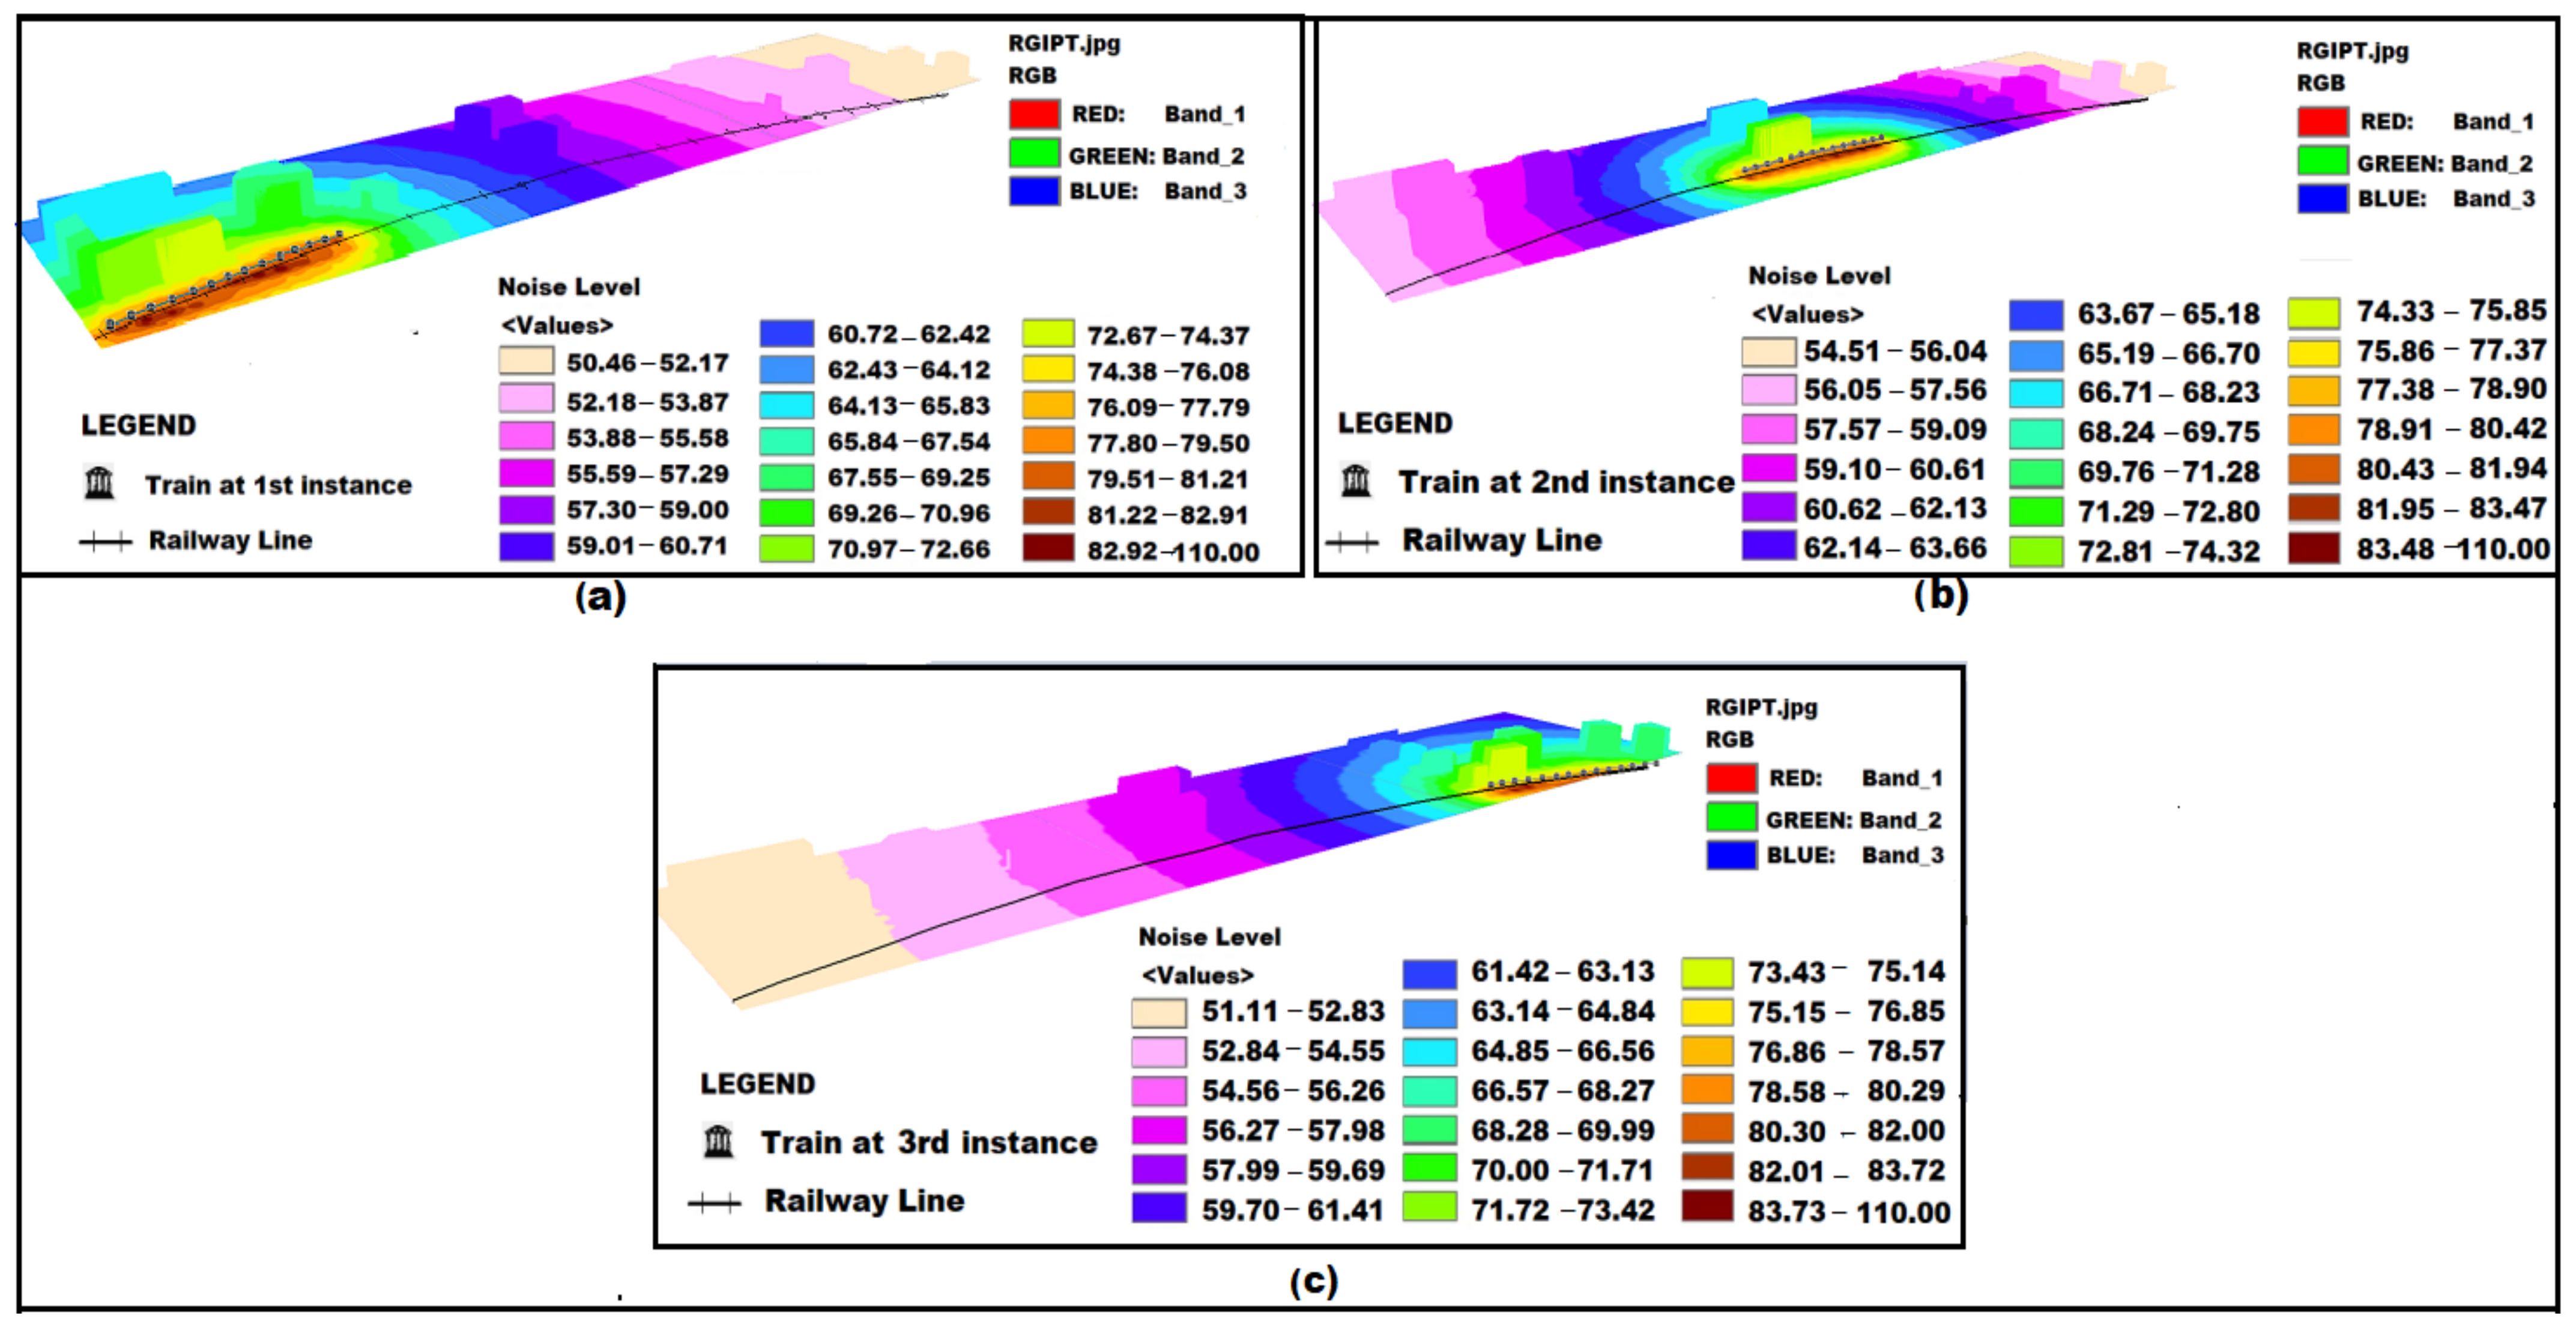
Publisher’s Note: MDPI stays neutral with regard to jurisdictional claims in published maps and institutional affiliations. |
© 2022 by the authors. Licensee MDPI, Basel, Switzerland. This article is an open access article distributed under the terms and conditions of the Creative Commons Attribution (CC BY) license (https://creativecommons.org/licenses/by/4.0/).
Share and Cite
MDPI and ACS Style
Bharadwaj, S.; Dubey, R.; Zafar, M.I.; Faridi, R.; Jena, D.; Biswas, S. Determination of Point-to-Point 3D Routing Algorithm Using LiDAR Data for Noise Prediction. Appl. Syst. Innov. 2022, 5, 58. https://doi.org/10.3390/asi5030058
AMA Style
Bharadwaj S, Dubey R, Zafar MI, Faridi R, Jena D, Biswas S. Determination of Point-to-Point 3D Routing Algorithm Using LiDAR Data for Noise Prediction. Applied System Innovation. 2022; 5(3):58. https://doi.org/10.3390/asi5030058
Chicago/Turabian StyleBharadwaj, Shruti, Rakesh Dubey, Md Iltaf Zafar, Rashid Faridi, Debashish Jena, and Susham Biswas. 2022. "Determination of Point-to-Point 3D Routing Algorithm Using LiDAR Data for Noise Prediction" Applied System Innovation 5, no. 3: 58. https://doi.org/10.3390/asi5030058