Article

Unsupervised Classification of Human Activity with Hidden Semi-Markov Models

by
Francesca Romana Cavallo
1,
Christofer Toumazou
1 and
Konstantin Nikolic
1,2,*
1
Centre for Bio-Inspired Technology, Department of Electrical and Electronic Engineering, Imperial College London, London SW7 2AZ, UK
2
School of Computing and Engineering, University of West London, London W5 5RF, UK
*
Author to whom correspondence should be addressed.
Appl. Syst. Innov. 2022, 5(4), 83; https://doi.org/10.3390/asi5040083
Submission received: 13 June 2022 / Revised: 3 August 2022 / Accepted: 15 August 2022 / Published: 17 August 2022
(This article belongs to the Section Information Systems)

Abstract

:
The modern sedentary lifestyle is negatively influencing human health, and the current guidelines recommend at least 150 min of moderate activity per week. However, the challenge is how to measure human activity in a practical way. While accelerometers are the most common tools to measure activity, current activity classification methods require calibration studies or labelled datasets—requirements that slow the research progress. Therefore, there is a pressing need to classify and quantify human activity efficiently. In this work, we propose an unsupervised approach to classify activities from accelerometer data using hidden semi-Markov models. We tune and infer the model parameters on accelerometer data from the UK Biobank and select the optimal model based on features used and informativeness of the prior. The best model achieves an average correlation of 0.4 between the inferred activities and the reference ones, with the overall physical activity obtaining a correlation of 0.8. Additionally, to prove the clinical significance of the method, we validate it by performing a linear regression between the inferred activities and anthropometric measures such as BMI and waist circumference. We show that for a sedentary behaviour and total physical activity, the proposed method achieves comparable regression coefficients to the reference labelled dataset. Moreover, the proposed method achieves a good agreement with a labelled dataset for daily time spent in a sedentary behaviour and total physical activity. The unsupervised nature of the method allows for a data-driven classification that does not require calibration studies or labelled datasets and can thus facilitate both clinical research as well as lifestyle recommendations.

1. Introduction

Current national guidelines suggest that people engage in at least 150 min of moderate activity per week (or 75 min of vigorous activity). These guidelines are supported by years of research showing that active individuals have reduced risks of cardiovascular disease, cancer and mortality [1,2]. Recently, some countries such as Australia and the UK have introduced guidelines to reduce sedentary behaviour, but sufficient evidence is lacking for specific time-based recommendations. Likewise, the current research evidence is not enough to advise on the type and intensity of activity one should engage in during nonsedentary time [3]. More research is needed to collect further evidence to inform such guidelines.
Accelerometers are vital in collecting data to understand the effects of physical behaviours and support guideline development. Data collected through accelerometers can be processed to classify the type and intensity of activities through various signal processing techniques. The most common method to classify human activity is the cut-off or thresholding approach. The method requires the development of a calibration study to measure the acceleration magnitude while engaging in activities of varying intensities. The acceleration magnitude is then regressed against the metabolic equivalent (MET) values for the recorded activities to obtain device-specific cut-off values. Conventionally, two cutoffs of 1.5 and 3 METs are used to split activity into sedentary, light intensity and moderate-to-vigorous intensity [4,5]. Cut-off points are developed using studies carried out in laboratory settings, which are not reflective of free-living conditions. Calibration studies are required practically for every study, as applying established cutoffs could create biased results due to them being established on different populations, devices and activity types. As Ref. [6] found, even when using the same accelerometer device, the cut-off points ranged from 191 to 2743 counts-per-minute (CPM) for moderate-intensity activity and from 4945 to 7526 CPM for vigorous-intensity activity, depending on whether the calibration was done on laboratory or free-living activities, reflecting the poor generalisability of the cut-off approach.
Supervised machine learning can be applied to accelerometer data to recognise activities. Such methods require a large number of labelled data to train the models, which can be hard to obtain in free-living settings. For example, it could require the participants to complete a very detailed activity log, which does not guarantee the accuracy of the labelled set as it is subject to recall bias. Willets et al. [7] achieved a high accuracy (≥90%) with random forests paired with a hidden Markov model, but used a ground-truth set of labelled data acquired with a camera to train their model, which is extremely resource ineffective and would require participants to wear a camera for several days, on top of their accelerometer. Alternative solutions include training the model on laboratory-acquired acceleration data, but the prediction accuracy of the classification model can be reduced by 20–30% when cross-validated on free-living acceleration data [8]. Furthermore, using existing data sets to train a model would not be feasible, given the heterogeneity in the population, device type and placement. A further problem related to conventional supervised methods is that they do not capture the time dependence of the data and assume the data to be independent [9].
Unsupervised learning methods offer a viable alternative to the methods outlined above without requiring labelled data. Clustering methods are at the heart of unsupervised learning, and standard techniques such as K-means [10,11] and Gaussian mixture models [11] have been applied to human activity recognition. However, simple clustering has some disadvantages when it comes to accelerometer data, mainly because the data are assumed to be independent and, consequently, the time dependency is lost. When dealing with accelerometer data, time dependency is a feature that we do not want to lose, as it can help distinguish between two activities which would otherwise be quite similar.
Hidden Markov models solve the time-dependency issue by representing and learning the data through the exploitation of their sequential characteristics [12]. They have been found to outperform both K-means and Gaussian mixture models when used for the classification of activities recorded in laboratory settings [9]. However, when recording data in free-living conditions, we are presented with a much more complex set of activities, which hinder HMM performance because HMM models the duration of the states implicitly as a geometric distribution, which is unlikely to be particularly informative for modelling the activity duration [13]. State duration is another critical feature for human activity classification when dealing with activities that have similar acceleration profiles but differ in duration, and it significantly impacts the prediction accuracy of the model [13]. Consequently, we introduce hidden semi-Markov models (HSMMs), which solve the issues mentioned above by modelling the classification problem as an HMM but include an explicit distribution for the state duration, which is related to the number of observations emitted by the state. This is also the main difference between HSMMs and HMMs, as the latter only have one observation being emitted from each state, and the state duration is implicitly modelled through self-transitions. An HSMM was previously used to segment accelerometer data by Van Kuppevelt et al. [14], who found a small correlation between HSMM-inferred states and states found with the cut-off method. However, this may be because the study did not perform model selection by testing different feature spaces and other parameters such as duration and observation priors hyperparameters. Therefore, the potential of the HSMM’s inference remains unexplored. Moreover, they did not assess the usefulness of inferring physical behaviours through an HSMM in epidemiological studies, and thus the feasibility of HSMMs in epidemiological research remains unclear.
In this work, we address the problem of the unsupervised classification of human activity by using accelerometer data. The methodology that we used is based on HSMM. We assess the ability of the HSMM to make a correct inference, by first tuning the HSMM parameters to optimise the inference performance. Then, we investigate the ability of the HSMM approach to be useful for epidemiological studies, with the examples of association between anthropometric data and physical behaviours. In particular, we assess the association between body mass index (BMI) and waist circumference (WC) and sedentary behaviour, moderate-intensity activity and light-intensity activity [15,16].

2. Materials and Methods

2.1. Dataset

The sample used in the analyses was selected among the participants from the UK Biobank, a database of over 500,000 adults aged 37–73 recruited in the UK between 2006 and 2010. The UK Biobank concept and design are described in detail in [17]. Physical activity was measured for seven days in a subset of participants between 2013 and 2015 using a wrist-worn triaxial accelerometer [18]. The triaxial acceleration data were captured over a seven-day period at 100 Hz with a dynamic range of ± 8 g. The labelled accelerometer data provided by Willetts et al. [7] were used as a reference dataset to validate our method.
The ethics approval for the UK Biobank study was obtained from the North West Centre for Research Ethics Committee (REC reference: 21/NW/0157). In addition, informed consent for the UK Biobank study was obtained from participants during the baseline assessment.

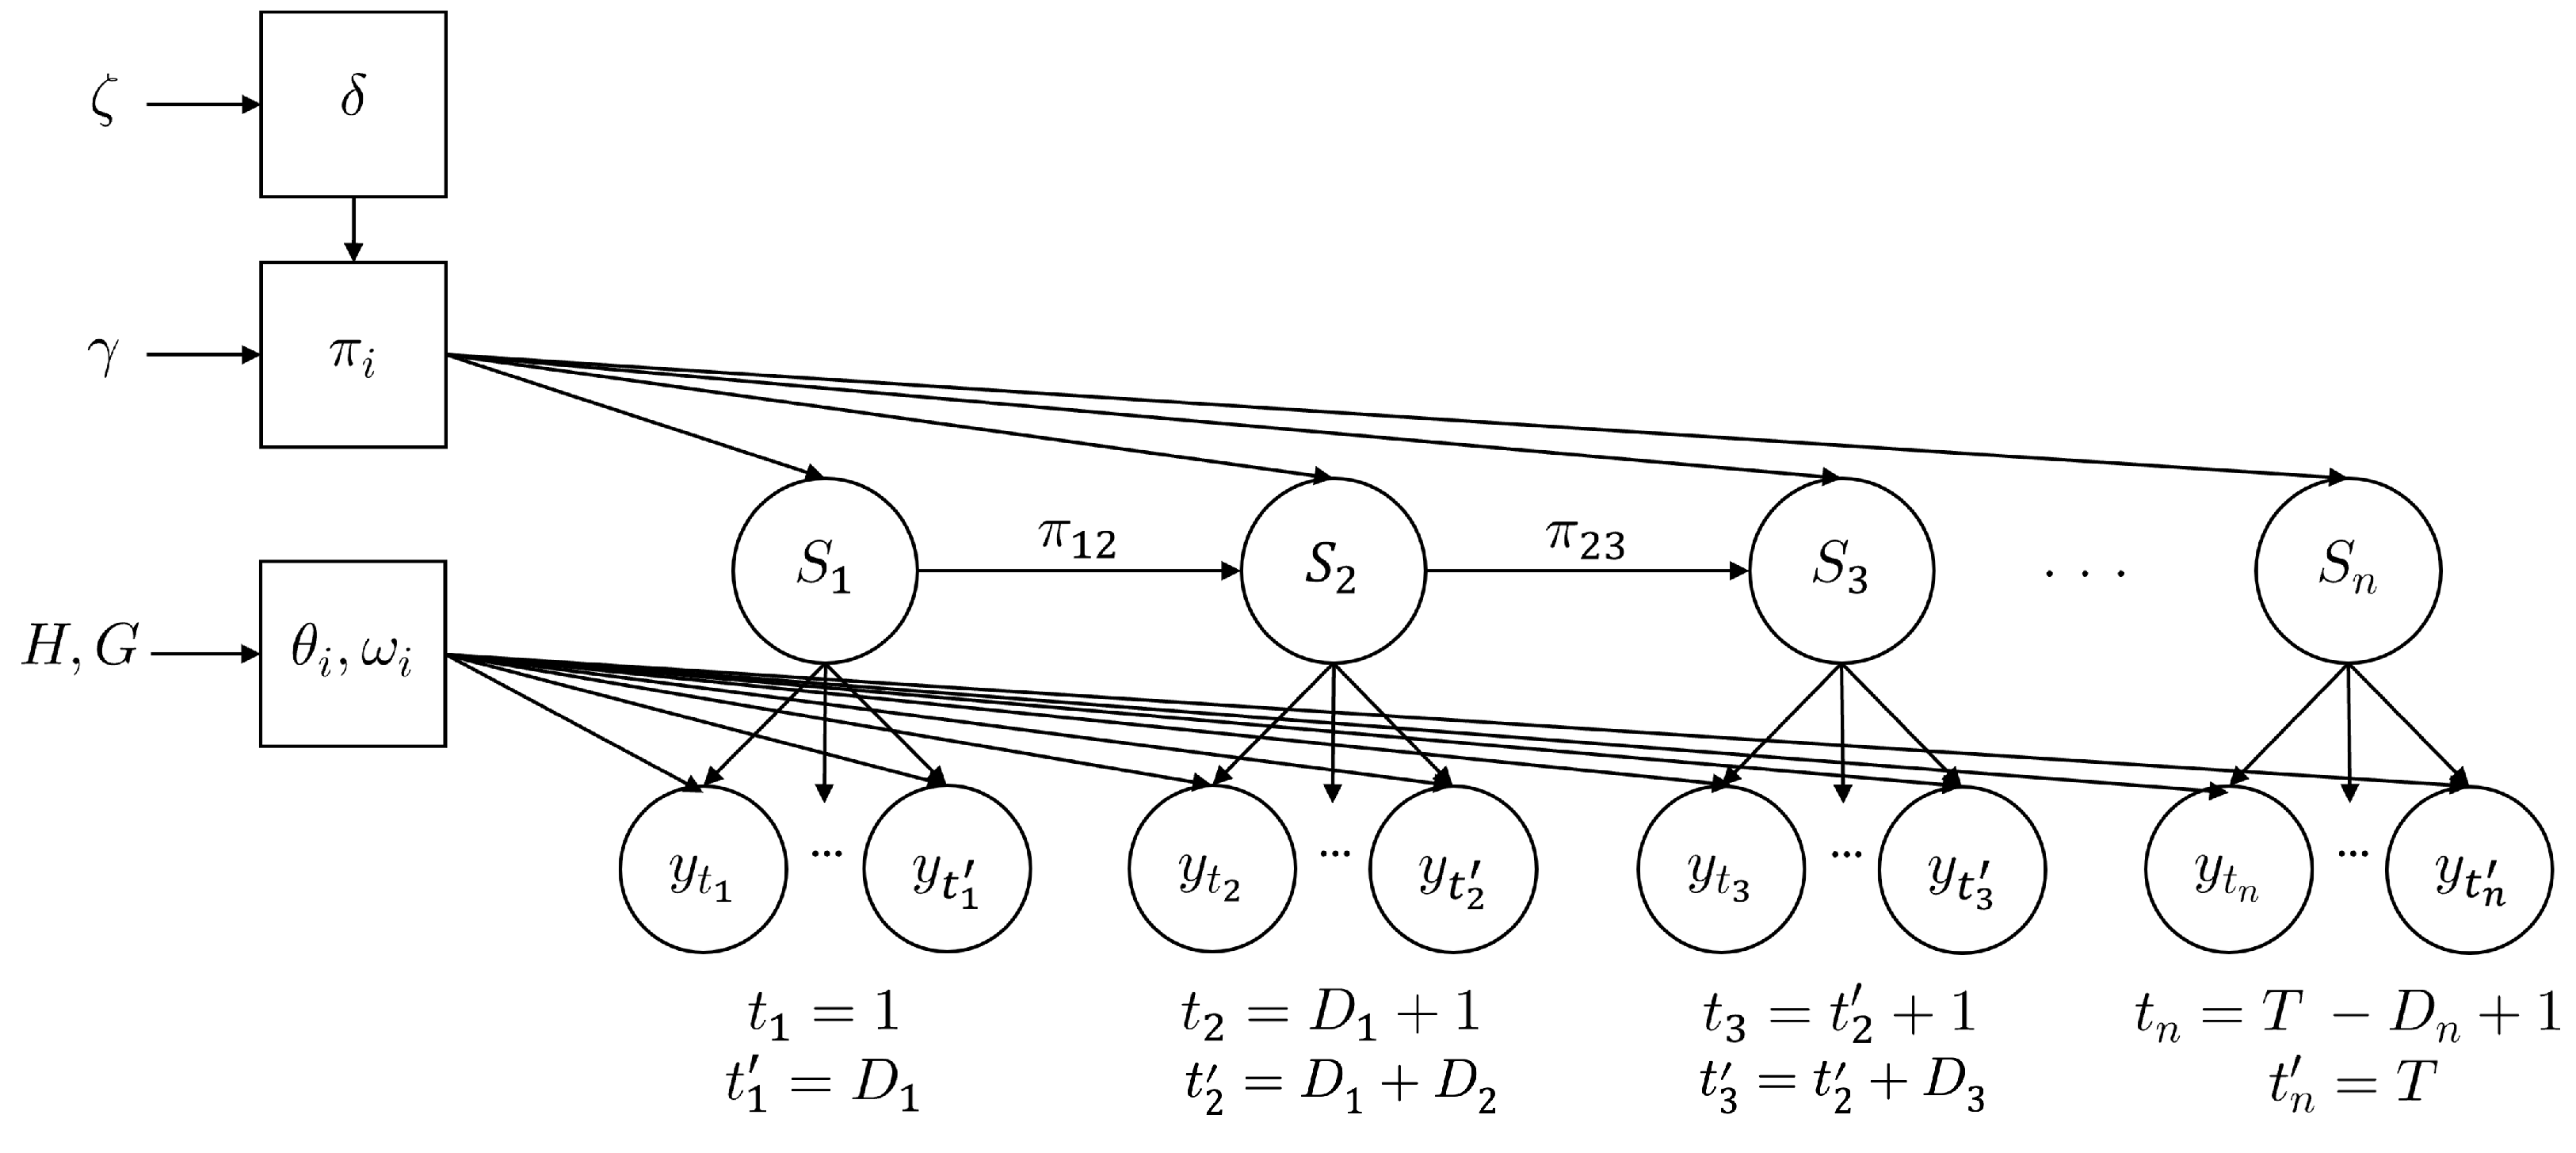
2.2. Model Description

A diagram illustrating the mathematical model used in this work is shown in Figure 1. The system is modelled as a set of states S i , which in this context represent the different activities. The system remains in a given state for the duration D i , which is a random variable. Then, it transitions to another state, and the whole process forms a Markov chain. The transition parameters π i , j , i , j = 1 , , n form the transition matrix π , where π i , j is the probability of transition from the state i to the state j. The corresponding observation, or emission variables, denoted by y, form another layer, as shown in Figure 1. An HSMM is fully modelled by the transition probability matrix π , observation sequence y and state duration D, whilst the observations are the accelerometer data, either in raw form or as features extracted from the raw data. An efficient Bayesian inference algorithm has been described in [19] for the HSMM message-passing inference. It is based on the explicit-duration hierarchical Dirichlet process HSMM (HDP-HSMM) and sampling algorithms for efficient posterior inference. The HDP-HSMM ( ζ , γ , H , G ) with n states, parameters ζ , γ and observation and duration parameter distributions H and G can be summarised as follows:
δ G E M ( ζ ) π i i i d D P ( γ , δ ) i = 1 , 2 , ( θ i , ω i ) i i d H × G S i π S i 1 D i g ( ω i ) y t i : t i i i d h ( θ i )
where the first line represents the sampling of the variable δ using a Dirichlet process with a single parameter ζ —a special case of the Dirichlet process called stick-breaking distribution (GEM) [20]. The next line denotes the sampling of the transition parameter from a Dirichlet process (DP), with parameters γ and δ ( i i d means independent and identically distributed random variables). The third line represents the sampling of the parameters θ and ω from distributions H and G (which we specify later). Then, the subsequent lines represent the sampling of the state S i , duration D i and observation y, sampled from distributions g and h (which are conjugate distributions of G and H).
The HSMM model parameters were estimated by using Bayesian inference. Bayesian inference is ideal in this application, as it allows the incorporation of prior knowledge on observed activity patterns through an appropriate prior distribution. For the prior distribution of the state duration, we used a Poisson distribution, with parameter λ equal to the mean duration of each state. However, for the acceleration values which we observed, we assumed a Gaussian prior with mean μ and variance σ 2 , since an HSMM with observations modelled by a Gaussian performs better in comparison to other distributions in classifying activities [21]. The parameters were estimated in a Bayesian manner with a hierarchical Dirichlet process, which allows for the number of states to be unknown and estimated by the algorithm [19]. The maximum number of states n and the maximum duration D m a x for each state can be set to reduce training time.
However, for the Bayesian calculations, we need to know the λ in the Poison distribution, which might be difficult to be accurately directly estimated from the observed data. The usual approach in that case is to use a conjugate prior of the Poisson distribution, which is the Gamma distribution, instead of the Poisson distribution. The Gamma distribution has two parameters α and β , which are related to λ with the relationship λ = α / β . This relationship can help us to estimate λ . Note that while here, we refer to the mean duration λ , each state has its own estimated duration λ i , such that i = 1 D λ i / i = λ . The choice of the hyperparameters α and β is crucial for duration inference. Setting values for α and β determines the effect that the data will have on the posterior: larger values imply larger confidence. Several values for α and β were examined to select the most accurate model.
The same approach was adopted for the mean state magnitude μ , and a Gaussian prior with parameters μ 0 and σ 0 was used. Table 1 shows a summary of the magnitude and duration distributions and their priors with the corresponding parameters.
The HSMM model parameters were inferred with the Python library pyhsmm [19].

2.3. Model Validation

The performance of the model was evaluated by comparing the state inference to the labelled accelerometer data provided by Willetts et al. [7]. Firstly, the total weekly time spent in each activity was calculated. Pearson’s correlation coefficients were calculated for each activity, and the agreement between the two methods was assessed with a Bland–Altman analysis [22]. In order to enable such comparison, the inferred states were mapped to the classified activities (sedentary behaviour, moderate-to-vigorous physical activity, walking, light tasks and sleep) based on the Euclidean acceleration. Additionally, the usefulness of the HSMM-inferred activity for epidemiological research was validated through a regression analysis by comparing the coefficients estimated using the HSMM-inferred states and the activities classified by Willetts et al. [7]. Two known associations between physical behaviours and anthropometric measures were chosen, namely BMI and WC. Data from the UK Biobank were used for this purpose.
The accelerometer data from the UK Biobank were used in the association analyses following a compositional paradigm [23]. In a compositional framework, the time spent in different activities is considered as a relative proportion of the overall time budget (24 h), such that the vector x = x 1 , x 2 , , x D R D , with D being the number of activities and with i = 1 D x i = C , is constrained by the closure constant C = 24 h. The closure constant implies multicollinearity among the activities and thus conventional statistical methods cannot be employed with compositional data [24]. The isometric log-ratio (ILR) transformation maps the data from the constrained simplex space to the unconstrained real space, which allows for the application of regression. Therefore, the transformation z = I L R x was applied to the accelerometer data as follows:
z i = D 1 D i + 1 l n x i j = i + 1 d x j D i w i t h i = 1 , , D 1

3. Results

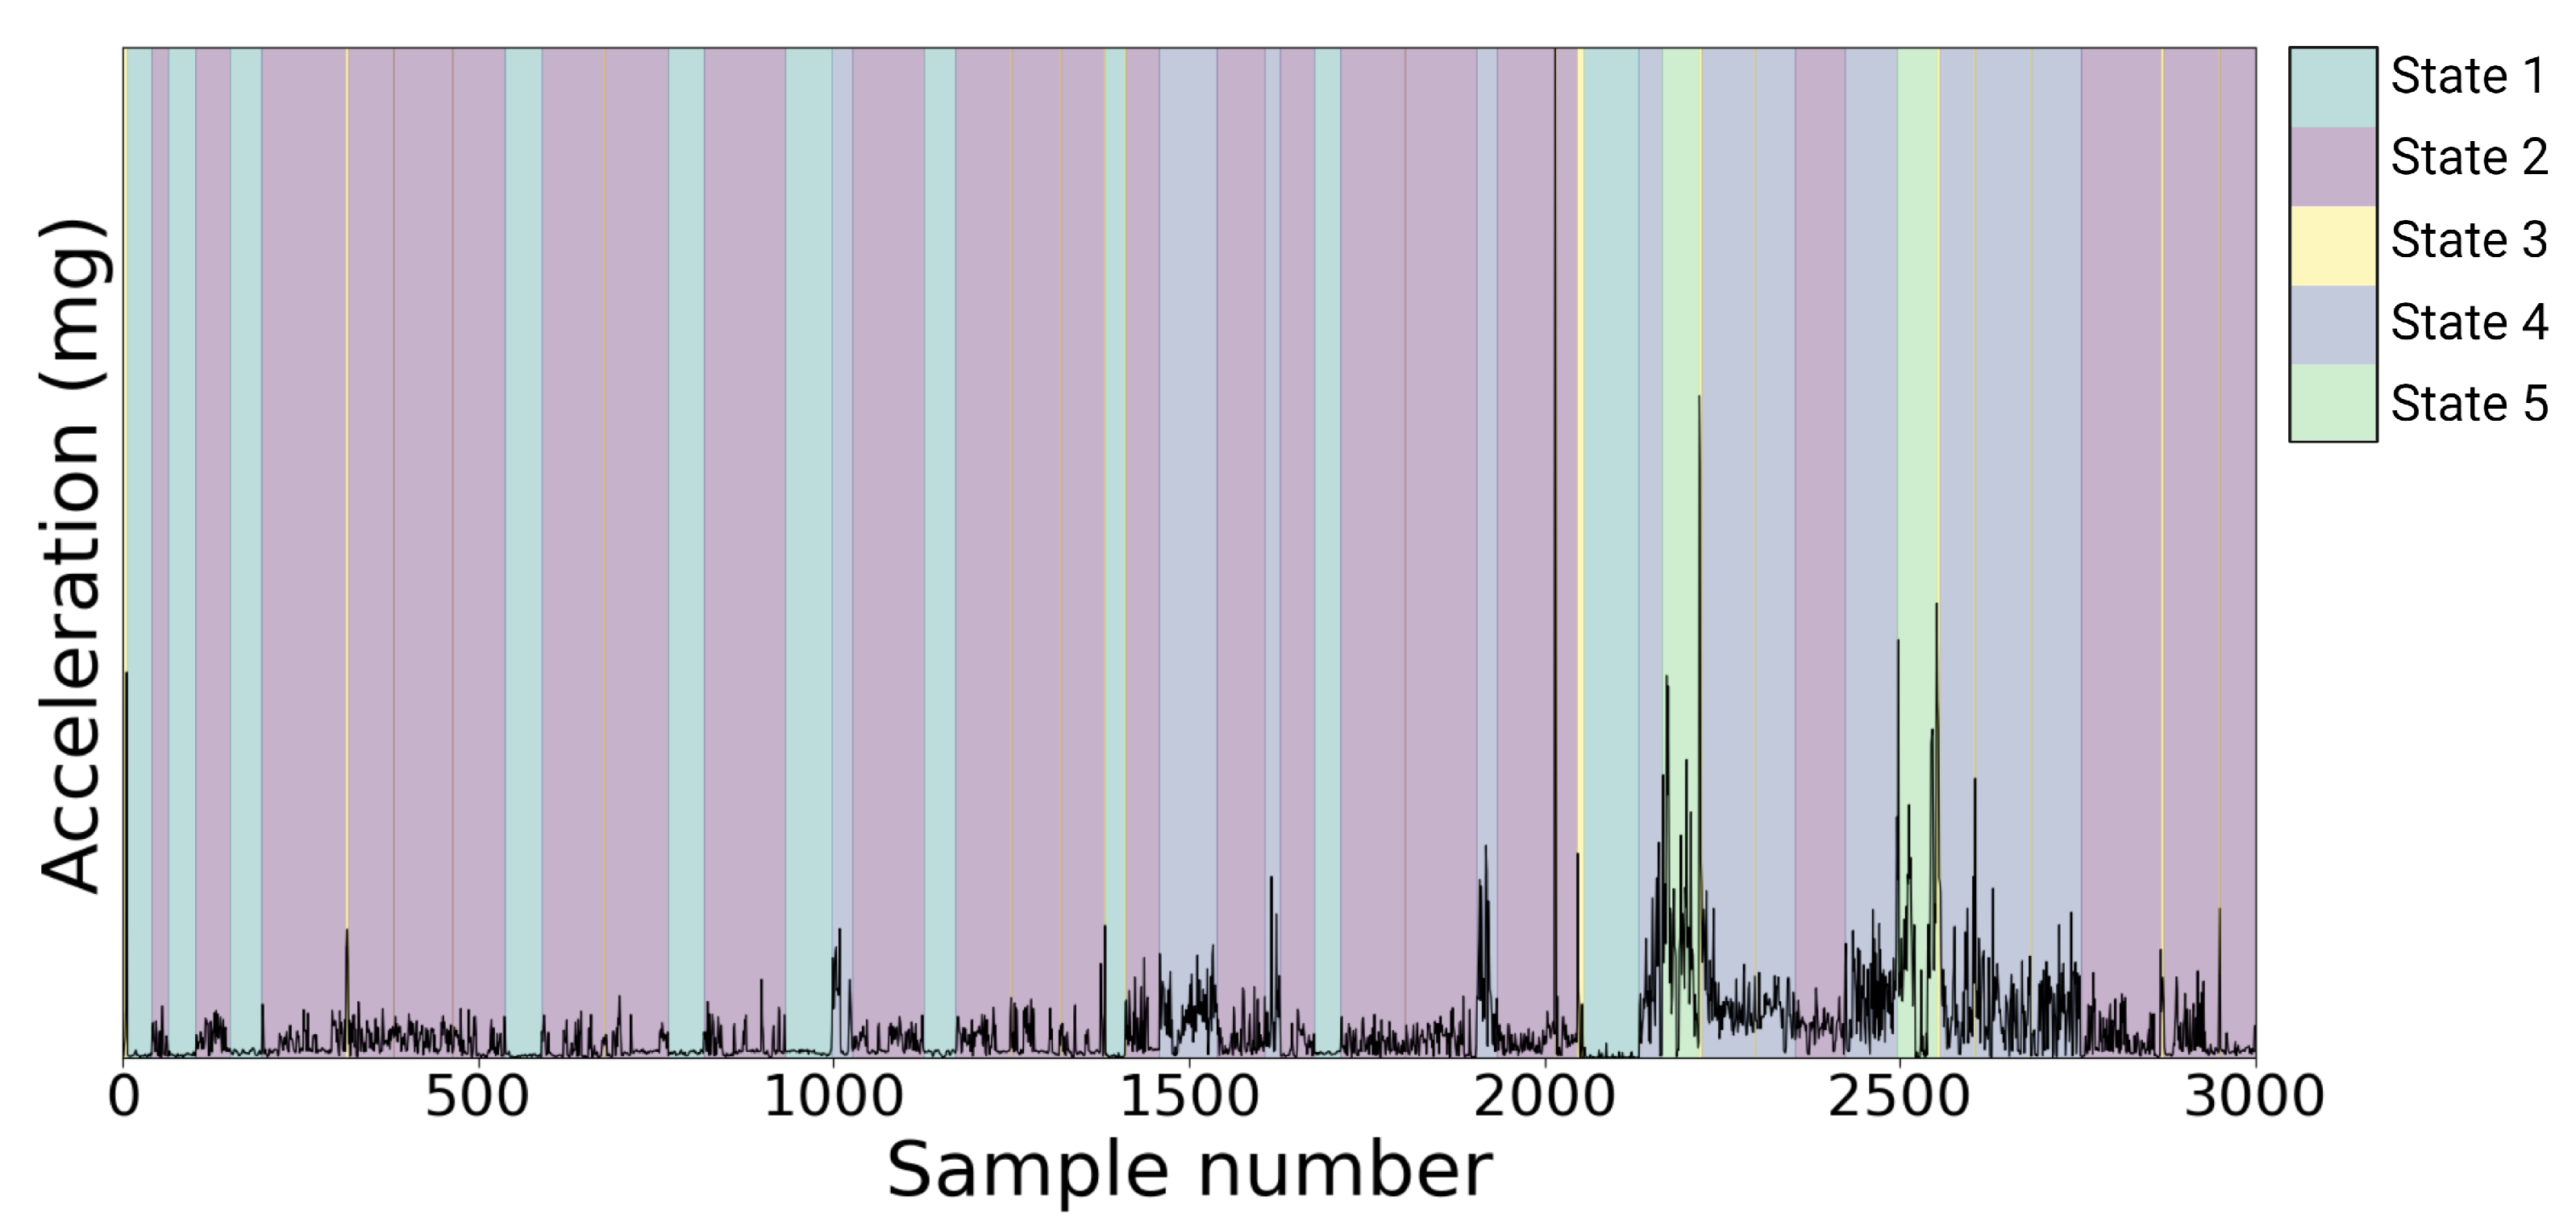
3.1. Dataset Description

A sample of 500 participants was selected from the UK Biobank, and a description of the sample is provided in Table 2. The average activity duration and acceleration for the labelled data by Willetts et al. [7] were calculated for each activity, namely moderate activity (MPA), sedentary time (SB), sleep, light tasks and walking (see Table 3).

3.2. Model Selection

Several model parameters were compared in order to select the optimal model, which would produce the best results, including the data features and the hyperparameters for the prior distribution. First, the effect of features was assessed by comparing the correlation coefficients of models trained with acceleration magnitude only, with axes acceleration only, with both magnitude and axes acceleration and with magnitude acceleration and axes angles. For this comparison, the durations’ prior hyperparameters were set to α = 360 and β = 2—this is the case of the so-called “medium informativeness”. Furthermore, these values corresponded to λ = 180 s, which was the average duration of an activity according to the accelerometer data. Table 4 shows the correlation between time spent in activities estimated with our unsupervised model and with a supervised method for different feature sets [7]. Magnitude alone performed best and was therefore selected for testing the different priors.
The effect of the prior parameters α and β was examined by comparing the “medium informative” prior ( α = 360 and β = 2) with a “very informative” ( α = 1800 and β = 10) and a “very uninformative” prior ( α = 18 and β = 0.1). Table 5 shows how different priors affect the correlation between activities classified with our unsupervised HSMM-inferred and the supervised method.
On the basis of this analysis, we chose the model trained with magnitude acceleration only and with a “very uninformative” prior. An example of activity segmentation with the chosen model is shown in Figure 2.

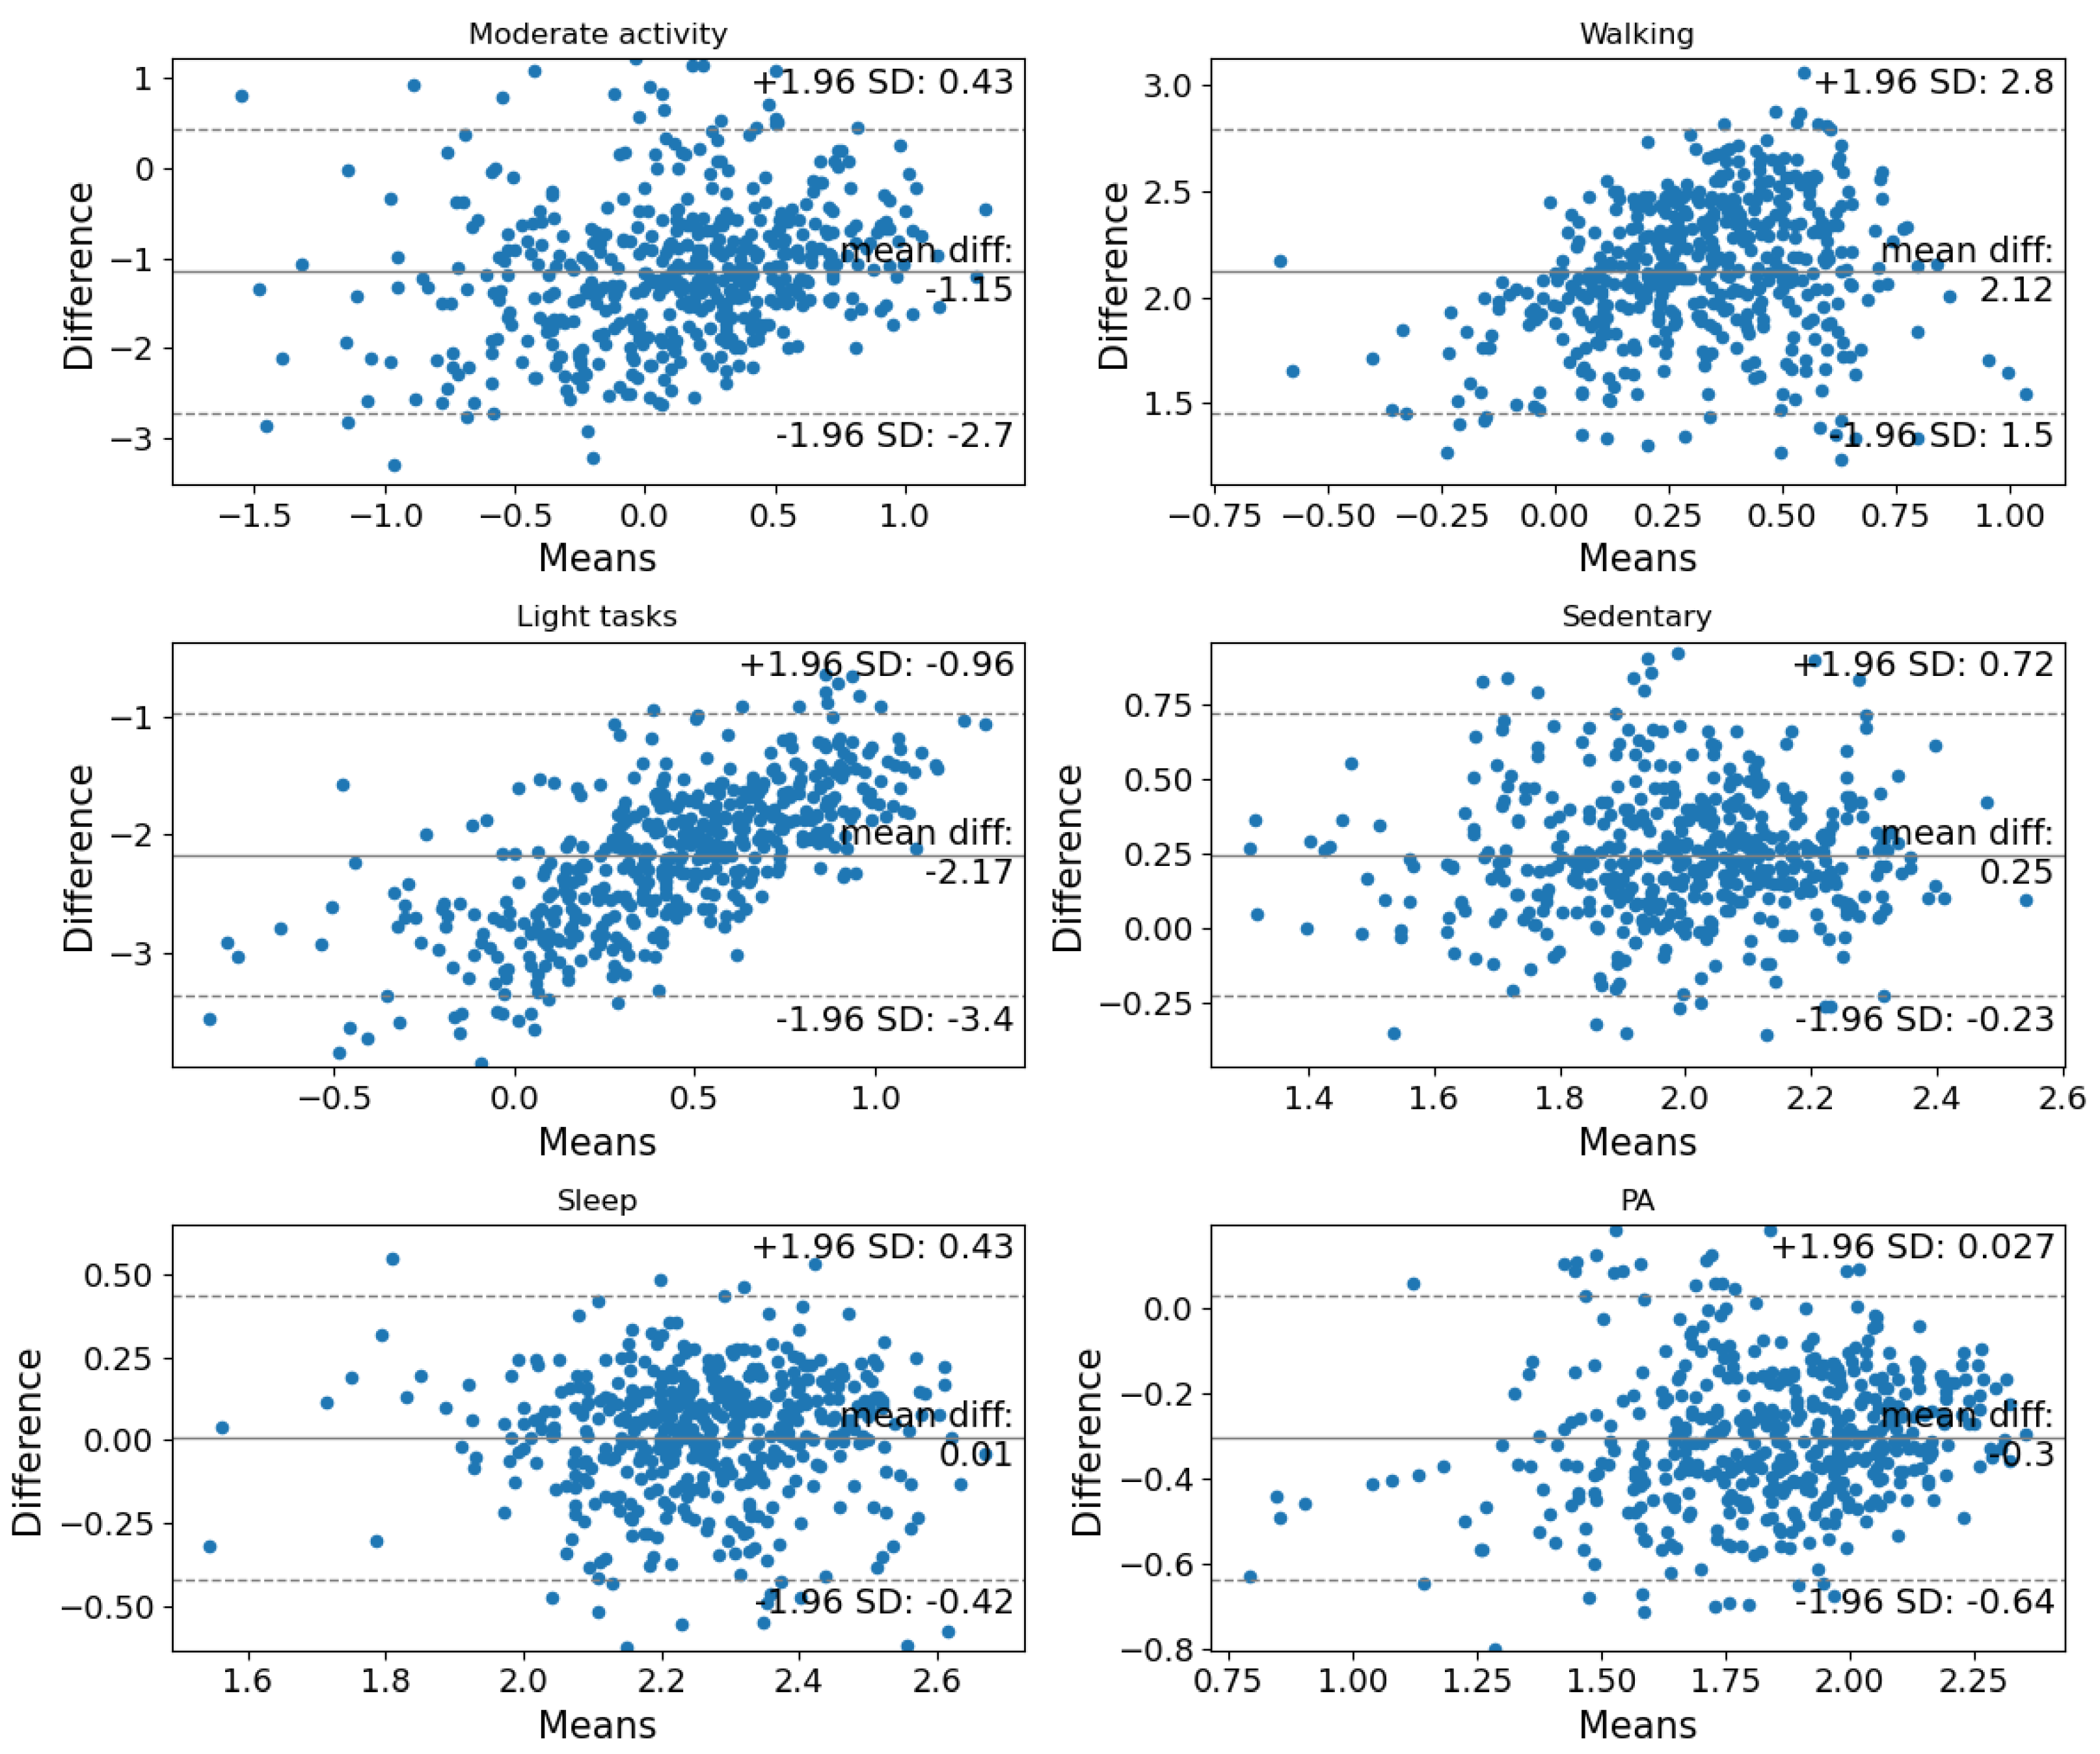
3.3. Model Validation

The model trained with magnitude acceleration only and with a very uninformative prior was chosen. The inferred parameters for the distributions characterising acceleration magnitude and state duration are shown in Table 6. The durations found ranged from 7.5 min for sleeping to 8 s for walking states, which are reasonable as sleep should be the longest activity and walking is often a transition activity. The Bland–Altman plots in Figure 3 show the agreement between the time spent in activities classified by Willetts et al. [7] and the states inferred by the HSMM for sleep, sedentary time and overall physical activity (calculated as the sum of walking, moderate activity and light tasks). On the contrary, there is a visible proportional bias for moderate activity, walking and light tasks, suggesting a poor agreement between the methods for these activities.
Finally, the significance of the HSMM-inferred states was tested with a linear regression between physical behaviours and anthropometric measures. For this analysis, only the regression coefficients for z 1 are reported, since the regression coefficient β 1 for the first ILR coordinate z 1 represents the strength of the association between the chosen activity and the outcome, while z 1 + i cannot be interpreted in a meaningful way. The time spent in each activity was calculated for classified activities and HSMM-inferred states and was transformed with an isometric log-ratio transformation to express it as the time spend in a certain activity with respect to others. Given the poor correlation and agreement between moderate activity, light tasks and walking, only the overall physical activity was considered. From Table 7, it can be seen that there is a high agreement between the estimated regression coefficients and p-values, indicating that the HSMM is a viable method to infer activities from accelerometer data to uncover health-related associations.

4. Discussion

A lack of physical activity is the fourth leading cause of global mortality [25]. However, accurately measuring physical activity is a challenging task, as its objective proxy is body energy expenditure, which can be precisely measured only in laboratory conditions. Various wearable sensory systems have been developed to provide information about physical activity, but the time-varying signals generated by the sensors need adequate processing in order to produce reliable results. However, sensors and algorithms create results that are strongly dependent on the subject wearing them, and significant research effort has been invested into finding ideal positions for the sensors, such as those for inertial measurements [26,27], in order to reduce the estimation error. Our approach is using standard accelerometers (on a smartwatch or smartphone) that are readily available and an unsupervised algorithm to process the time-varying signal and make inferences about the class of the physical activity.
Unsupervised methods for activity inference are a powerful tool for epidemiological research studies, as they allow trials to be conducted without an ad hoc calibration study for the specific wearable device and population tested, thus saving time and resources. With this aim, we used an HSMM as an unsupervised method to classify activity from accelerometer data. We used a Bayesian framework to infer the parameters of the model described in Equation (1) and selected the optimal model based on features used and informativeness of the prior. On the basis of this analysis related to the feature choice and parameter selection, we found the best model to be the one which used the accelerometer magnitude and a very uninformative prior, as it achieved the highest Pearson’s correlation between the inferred activities and the reference ones, as shown in Table 4 and Table 5. We evaluated the agreement between the HSMM and supervised classification using Bland–Altman plots (Figure 3) and showed a good method agreement for sedentary behaviour and overall physical activity. We also validated the model by reproducing the widely accepted association between physical activity and sedentary time with BMI and waist circumference. We showed that the activities inferred by the HSMM produced linear regression coefficients similar to the ones achieved by activities classified using supervised methods (Table 7).
A limitation of the current work with the HSMM is the failure to differentiate between activity types, namely moderate activity, walking and light tasks. In fact, the HSMM seems to only reliably distinguish between activity intensities. This is likely due to the features employed in the inference. While using acceleration magnitude only ensures shorter computational times and an easier interpretation of the states, limiting the inference to only this feature may be preventing successful segmentation of different activities with similar intensities. Although the effect of axes angles was explored and did not produce good correlations, future work should explore the use of other time- and frequency-related features.

5. Conclusions

In this work, we presented an unsupervised method for activity inference from accelerometer data using a hidden semi-Markov model. This work presented an unsupervised method that successfully tackles the issues associated with conventional methods for activity classification from accelerometers, namely the need for calibration studies or for large labelled datasets. We implemented the proposed algorithm on a sample from the UK Biobank, and selected the best model based on features and prior informativeness. Additionally, we verified the usefulness of the model for epidemiological research by testing some well-known association between physical behaviours and anthropometric measures, namely BMI and WC. The results showed that the activities inferred with the proposed method had good correlation and agreement with true activities, and the comparability of the regression coefficients proved that the method was a viable alternative for research exploring the effects of physical behaviours on health.

Author Contributions

Conceptualisation, F.R.C.; methodology, F.R.C.; software, F.R.C.; validation, F.R.C.; formal analysis, F.R.C.; investigation, F.R.C.; resources, F.R.C. and C.T.; data curation, F.R.C.; writing—original draft preparation, F.R.C.; writing—review and editing, F.R.C. and K.N.; visualisation, F.R.C.; supervision, K.N. and C.T.; funding acquisition, C.T. All authors have read and agreed to the published version of the manuscript.

Funding

This research was funded by the EPSRC Doctoral Training Partnership.

Institutional Review Board Statement

The ethics approval for the UK Biobank study was obtained from the North West Centre for Research Ethics Committee (REC reference: 21/NW/0157).

Informed Consent Statement

Informed consent was obtained from all subjects involved in the UK Biobank study.

Data Availability Statement

The data used in this study can be obtained from the UK Biobank. From more information please visit https://www.ukbiobank.ac.uk (accessed on 16 August 2022).

Conflicts of Interest

C.T. is the co-founder of DnaNudge Ltd. The funders had no role in the design of the study; in the collection, analyses, or interpretation of data; in the writing of the manuscript; or in the decision to publish the results.

Abbreviations

The following abbreviations are used in this manuscript:
BMIBody mass index
CPMCounts-per-minute
HSMMHidden semi-Markov model
HSMHidden Markov model
METMetabolic equivalent
MPAModerate physical activity
PAPhysical activity
SBSedentary behaviour
WCWaist circumference

References

  1. Ekelund, U.; Steene-Johannessen, J.; Brown, W.J.; Fagerland, M.W.; Owen, N.; Powell, K.E.; Bauman, A.; Lee, I.M. Does physical activity attenuate, or even eliminate, the detrimental association of sitting time with mortality? A harmonised meta-analysis of data from more than 1 million men and women. Lancet 2016, 388, 1302–1310. [Google Scholar] [CrossRef]
  2. Ekelund, U.; Tarp, J.; Steene-Johannessen, J.; Hansen, B.H.; Jefferis, B.; Fagerland, M.W.; Whincup, P.; Diaz, K.M.; Hooker, S.P.; Chernofsky, A.; et al. Dose-response associations between accelerometry measured physical activity and sedentary time and all cause mortality: Systematic review and harmonised meta-analysis. BMJ 2019, 366, l4570. [Google Scholar] [CrossRef] [PubMed]
  3. Dempsey, P.C.; Biddle, S.J.; Buman, M.P.; Chastin, S.; Ekelund, U.; Friedenreich, C.M.; Katzmarzyk, P.T.; Leitzmann, M.F.; Stamatakis, E.; van der Ploeg, H.P.; et al. New global guidelines on sedentary behaviour and health for adults: Broadening the behavioural targets. Int. J. Behav. Nutr. Phys. Act. 2020, 17, 1–12. [Google Scholar] [CrossRef] [PubMed]
  4. Tremblay, M.; Colley, R.; Saunders, T.; Healy, G.; Owen, N. Physiological and health implications of a sedentary lifestyle. Appl. Physiol. Nutr. Metab. 2010, 35, 725–740. [Google Scholar] [CrossRef]
  5. Haskell, W.L.; Lee, I.M.; Pate, R.R.; Powell, K.E.; Blair, S.N.; Franklin, B.A.; MacEra, C.A.; Heath, G.W.; Thompson, P.D.; Bauman, A. Physical activity and public health: Updated recommendation for adults from the American College of Sports Medicine and the American Heart Association. Med. Sci. Sport. Exerc. 2007, 39, 1423–1434. [Google Scholar] [CrossRef]
  6. Watson, K.B.; Carlson, S.A.; Carroll, D.D.; Fulton, J.E. Comparison of accelerometer cut points to estimate physical activity in US adults. J. Sport. Sci. 2014, 32, 660–669. [Google Scholar] [CrossRef]
  7. Willetts, M.; Hollowell, S.; Aslett, L.; Holmes, C.; Doherty, A. Statistical machine learning of sleep and physical activity phenotypes from sensor data in 96,220 UK Biobank participants. Sci. Rep. 2018, 8, 7961. [Google Scholar] [CrossRef]
  8. Farrahi, V.; Niemelä, M.; Kangas, M.; Korpelainen, R.; Jämsä, T. Calibration and validation of accelerometer-based activity monitors: A systematic review of machine-learning approaches. Gait Posture 2019, 68, 285–299. [Google Scholar] [CrossRef]
  9. Trabelsi, D.; Mohammed, S.; Chamroukhi, F.; Oukhellou, L.; Amirat, Y. An unsupervised approach for automatic activity recognition based on Hidden Markov Model regression. IEEE Trans. Autom. Sci. Eng. 2013, 10, 829–835. [Google Scholar] [CrossRef]
  10. Ong, W.H.; Koseki, T.; Palafox, L. An unsupervised approach for human activity detection and recognition. Int. J. Simul. Syst. Sci. Technol. 2013, 14, 42–49. [Google Scholar] [CrossRef]
  11. Weber, N. Unsupervised Learning in Human Activity Recognition: A First Foray Into Clustering Data Gathered from Wearable Sensors. Ph.D. Thesis, Department of Electrical Engineering and Computer Science, Massachusetts Institute of Technology, Cambridge, MA, USA, 2014. [Google Scholar]
  12. Duong, T.V.; Bui, H.H.; Phung, D.Q.; Venkatesh, S. Activity recognition and abnormality detection with the switching hidden semi-Markov model. In Proceedings of the 2005 IEEE Computer Society Conference on Computer Vision and Pattern Recognition (CVPR’05), San Diego, CA, USA, 20–25 June 2005; pp. 838–845. [Google Scholar] [CrossRef]
  13. Van Kasteren, T.L.; Englebienne, G.; Kröse, B.J. Activity recognition using semi-Markov models on real world smart home datasets. J. Ambient Intell. Smart Environ. 2010, 2, 311–325. [Google Scholar] [CrossRef]
  14. Van Kuppevelt, D.; Heywood, J.; Hamer, M.; Sabia, S.; Fitzsimons, E.; Van Hees, V. Segmenting accelerometer data from daily life with unsupervised machine learning. PLoS ONE 2019, 14, e0208692. [Google Scholar] [CrossRef]
  15. Wirth, K.; Klenk, J.; Brefka, S.; Dallmeier, D.; Faehling, K.; Roqué i Figuls, M.; Tully, M.A.; Giné-Garriga, M.; Caserotti, P.; Salvà, A.; et al. Biomarkers associated with sedentary behaviour in older adults: A systematic review. Ageing Res. Rev. 2017, 35, 87–111. [Google Scholar] [CrossRef]
  16. Silva, B.G.C.; Silva, I.C.M.; Ekelund, U.; Brage, S.; Ong, K.K.; De Lucia Rolfe, E.; Lima, N.P.; da Silva, S.G.; de França, G.V.; Horta, B.L. Associations of physical activity and sedentary time with body composition in Brazilian young adults. Sci. Rep. 2019, 9, 1–10. [Google Scholar] [CrossRef]
  17. Sudlow, C.; Gallacher, J.; Allen, N.; Beral, V.; Burton, P.; Danesh, J.; Downey, P.; Elliott, P.; Green, J.; Landray, M.; et al. UK Biobank: An open access resource for identifying the causes of a wide range of complex diseases of middle and old age. PLoS Med. 2015, 12, 1–10. [Google Scholar] [CrossRef]
  18. Doherty, A.; Jackson, D.; Hammerla, N.; Plötz, T.; Olivier, P.; Granat, M.H.; White, T.; Van Hees, V.T.; Trenell, M.I.; Owen, C.G.; et al. Large scale population assessment of physical activity using wrist worn accelerometers: The UK Biobank study. PLoS ONE 2017, 12, e0169649. [Google Scholar] [CrossRef]
  19. Johnson, M.J.; Willsky, A.S. Bayesian nonparametric Hidden semi-Markov models. J. Mach. Learn. Res. 2013, 14, 673–701. [Google Scholar]
  20. Teh, Y.W. Dirichlet Process. Encycl. Mach. Learn. 2010, 1063, 280–287. [Google Scholar]
  21. Witowski, V.; Foraita, R.; Pitsiladis, Y.; Pigeot, I.; Wirsik, N. Using hidden Markov models to improve quantifying physical activity in accelerometer data—A simulation study. PLoS ONE 2014, 9, e114089. [Google Scholar] [CrossRef]
  22. Bland, M.J.; Altman, D.G. Statistical methods for assessing agreement between two methods of clinical measurement. Lancet 1986, 327, 307–310. [Google Scholar] [CrossRef]
  23. Chastin, S.F.M.; Palarea-Albaladejo, J.; Dontje, M.L.; Skelton, D.A. Combined effects of time spent in physical activity, sedentary behaviors and sleep on obesity and cardio-metabolic health markers: A novel compositional data analysis approach. PLoS ONE 2015, 10, e0139984. [Google Scholar] [CrossRef]
  24. Dumuid, D.; Pedišić, Ž.; Stanford, T.E.; Martín-Fernández, J.A.; Hron, K.; Maher, C.A.; Lewis, L.K.; Olds, T. The compositional isotemporal substitution model: A method for estimating changes in a health outcome for reallocation of time between sleep, physical activity and sedentary behaviour. Stat. Methods Med Res. 2019, 28, 846–857. [Google Scholar] [CrossRef]
  25. World Health Organization. Global Health Risks: Mortality and Burden of Disease Attributable to Selected Major Risks; WHO: Geneva, Switzerland, 2009. [Google Scholar]
  26. Slade, P.; Kochenderfer, M.; Delp, S.E.A. Sensing leg movement enhances wearable monitoring of energy expenditure. Nat. Commun. 2021, 12, 4312. [Google Scholar] [CrossRef]
  27. Slade, P.; Habib, A.; Hicks, J.L.; Delp, S.L. An Open-Source and Wearable System for Measuring 3D Human Motion in Real-Time. IEEE Trans. Biomed. Eng. 2022, 69, 678–688. [Google Scholar] [CrossRef]
Figure 1. The hidden semi-Markov model. Each state S i contains a D i number of observations y. The state transitions are modelled by the transition probabilities π i , j . T denotes the total observation time. The rest of the notation is explained in the main text.
Asi 05 00083 g001
Figure 2. Example of activity segmentation with HSMM inference on the average acceleration.
Asi 05 00083 g002
Figure 3. Bland–Altman plots for method agreement. The methods compared are the classification of activity by Willetts et al. [7] and by the HSMM. PA denotes the overall physical activity, as calculated by summing the time spent in moderate activity, walking and light tasks.
Asi 05 00083 g003
Table 1. Distributions and parameters for state duration and magnitude and their conjugate priors.
DurationObservations
DistributionPoissonGaussian
Parameters λ μ , σ 2
Conjugate priorGammaGaussian
Hyperparameter α , β μ 0 , σ 0
Table 2. Descriptive characteristics of the sample used in the analyses: the mean values and standard deviations (in brackets). BMI: body mass index, MPA: moderate physical activity.
Variablen = 500
Sex (% males)49
Age (years)56.08 (7.89)
BMI (kg/m 2 )29.57 (4.22)
Waist circumference (cm)95.46 (12.47)
MPA (hours/day)0.79 (0.54)
Walking (hours/day)4.16 (1.28)
Light tasks (hours/day)0.63 (0.37)
Sedentary time (hours/day)8.45 (1.94)
Sleep (hours/day)9.83 (1.91)
Overall activity (hours/day)5.58 (1.45)
Table 3. Average acceleration and duration of each activity, for the labelled data by Willetts et al. [7]. Data presented as means and standard deviations. SB—sedentary behaviour.
ActivityMagnitudeX-AxisY-AxisZ-AxisDuration (s)
MPA0.084 (0.147)−0.042 (0.536)−0.078 (0.433)0.165 (0.634)44
SB0.014 (0.022)−0.077 (0.531)−0.009 (0.527)0.14 (0.613)196
Sleep0.003 (0.007)−0.015 (0.495)−0.006 (0.563)0.114 (0.649)471
Light tasks0.049 (0.096)−0.08 (0.446)−0.065 (0.734)0.001 (0.411)53
Walking0.088 (0.078)−0.027 (0.563)−0.091 (0.606)−0.074 (0.401)125
Average0.048−0.048−0.050.069178
Table 4. Effect of different features on the correlation between time spent in activities as estimated by our unsupervised HSMM model and by the supervised model of Willetts et al. [7]. Data presented as Pearson’s correlation coefficients and 95% confidence intervals, unless otherwise stated.
ActivityMagnitudeMagnitude + AxesAxesMagnitude + Angles
MPA0.11 [0.02–0.19]0.12 [0.03–0.21]0.23 [0.15–0.31]−0.02 [−0.11–0.07]
Walking0.5 [0.43–0.57]0.49 [0.42–0.56]−0.06 [−0.15–0.03]0.45 [0.38–0.52]
Light tasks0.11 [0.03–0.2]0.1 [0.01–0.18]0.13 [0.04–0.21]0.04 [−0.05–0.12]
SB0.22 [0.13–0.3]0.26 [0.18–0.34]−0.04 [−0.13–0.05]0.18 [−0.05–0.12]
Sleep0.35 [0.27–0.42]0.22 [0.14–0.30]−0.12 [−0.21–−0.03]0.29 [0.21–0.37]
Overall PA0.59 [0.53–0.64]0.55 [0.48–0.61]0.03 [−0.06–0.12]0.48 [0.41–0.55]
Average (std)0.31 (0.2)0.29 (0.19)0.03 (0.13)0.09 (0.32)
Table 5. Effect of activities durations prior on the correlation between time spent in activities as estimated by our unsupervised HSMM-based classification and by the supervised method of Willetts et al. [7]. Data presented as Pearson’s correlation coefficients and 95% confidence intervals, unless otherwise stated.
ActivityVery InformativeMediumVery Uninformative
MPA0.17 [0.08–0.25]0.11 [0.02–0.19]0.18 [0.1–0.2]
Walking0.35 [0.27–0.43]0.5 [0.43–0.57]0.28 [0.2–0.36]
Light tasks0.19 [0.10–0.27]0.11 [0.03–0.2]0.19 [0.1–0.27]
Sedentary0.37 [0.29–0.44]0.22 [0.13–0.3]0.48 [0.41–0.55]
Sleep0.34 [0.26–0.41]0.35 [0.27–0.42]0.39 [0.31–0.46]
Overall PA0.71 [0.67–0.75]0.59 [0.53–0.64]0.81 [0.31–0.84]
Average (std)0.36 (0.19)0.31 (0.2)0.39 (0.23)
Table 6. Acceleration magnitude and duration for each activity estimated by the HSMM.
MagnitudeDuration
Activity μ σ 2 λ (s)
Walking0.170.0588
Tasks0.040.001308
SB0.010.0001366
Sleeping0.0023 × 10 6 452
MPA0.110.005254
Table 7. Linear regression coefficients for the associations between overall physical activity (PA), sedentary behaviour (SB) and sleep (Sleep) with anthropometric measures: BMI (body mass index) and WC (waist circumference). The coefficients represent the increase in outcome for each extra hour/day spend in each activity. The time spent in PA is calculated as the sum of time in moderate activity, walking and light tasks. The reference coefficients were estimated by using the labelled data by Willetts et al. [7], while the inferred coefficients were estimated by using our HSMM approach. (*: p-value < 0.05, **: p-value < 0.01, ***: p-value < 0.001).
OutcomeActivityReferenceInferred
BMI (kg/m 2 )SB (h/day)3.27 ***4.51 ***
BMI (kg/m 2 )PA (h/day)−3.43 ***−2.74 **
BMI (kg/m 2 )Sleep (h/day)0.16−1.77 *
WC (cm)SB (h/day)9.96 ***12.54 ***
WC (cm)PA (h/day)−11.46 ***−7.62 **
WC (cm)Sleep (h/day)1.51−4.92
Publisher’s Note: MDPI stays neutral with regard to jurisdictional claims in published maps and institutional affiliations.

