Article

Intelligent Medical Velostat Pressure Sensor Mat Based on Artificial Neural Network and Arduino Embedded System

by
Marek Kciuk
1,†,
Zygmunt Kowalik
1,†,
Grazia Lo Sciuto
1,2,*,†,
Sebastian Sławski
3,† and
Stefano Mastrostefano
4,†
1
Department of Mechatronics, Silesian University of Technology, Akademicka 2A, 44-100 Gliwice, Poland
2
Department of Electrical, Electronics and Informatics Engineering, University of Catania, Viale Andrea Doria, 6, 95125 Catania, Italy
3
Department of Theoretical and Applied Mechanics, Silesian University of Technology, Konarskiego 18A, 44-100 Gliwice, Poland
4
ENEA, C.R. Frascati, Via E.Fermi 45, 00044 Frascati, Italy
*
Author to whom correspondence should be addressed.
All authors contributed equally to this work.
Appl. Syst. Innov. 2023, 6(5), 84; https://doi.org/10.3390/asi6050084
Submission received: 16 August 2023 / Revised: 16 September 2023 / Accepted: 21 September 2023 / Published: 26 September 2023
(This article belongs to the Section Medical Informatics and Healthcare Engineering)

Abstract

:
The promising research on flexible and tactile sensors requires conducting polymer materials and an accurate system for the transduction of pressure into electrical signals. In this paper, the intelligent sensitive mat, based on Velostat, which is a polymeric material impregnated with carbon black, is investigated. Various designs and geometries for home-made sensor mats have been proposed, and their electrical and mechanical properties, including reproducibility, have been studied through the tests performed. The mat pressure sensors have been interfaced with an Arduino microcontroller in order to monitor, read with high precision, and control the variation of the resistance under applied pressure. An approximation method was then developed based on a neural network algorithm to explore the relationship between different mat shapes, the pressure and stresses applied on the mat, the resistance of the conductive Velostat material, and the number of active sensing cells in order to control system input signal management.

1. Introduction

A safe and healthy office environment is essential to improve worker productivity [1,2]. Sensor technology applications can support workers by measuring and monitoring their work exposures to prevent adverse health effects and increase the quality and comfort of the indoor environment. Pressure sensors are adopted to measure the physical forces exerted by the body. The piezoelectric sensors in semiconductor technology are considered the most popular sensors. However, low manufacturing cost, high flexibility, and the simplicity of the data acquisition circuits are the characteristics for which piezoresistive flexible pressure sensors are widely used. Versatile and flexible pressure transducer and tactile sensors compatible with the skin, which are sufficiently sensitive, are applied in human motion monitoring, health monitoring devices, consumer electronics, and soft robotics [3]. Experimental studies have demonstrated that it is possible to implement Velostat-based sensors in both static and dynamic flexible systems [4,5,6]. The typical design of a flexible pressure sensor consists of Velostat as a piezoresistive layer and a conductive silver nylon over a neoprene insulation layer [6,7,8,9,10]. Pressure-sensitive systems are used to monitor the user’s presence and to obtain information about the user’s health status by detecting possible anatomical abnormalities. In medical diagnosis and sports applications, the body posture control associated with the analysis and measurement of plantar pressure distribution reveals the pressure interface between the plantar surface of the foot and the sole of the shoe. Neonatal constant monitoring, sports training monitoring, and elderly care are applications of the Velostat-based pressure sensitive mat (PSM) [11,12,13]. The plantar pressure distribution allows for the analysis of the rhythm and size of the step, weight distribution between heel and foot, and timing of the gait phases by means of Velostat-based foot sensors installed in the shoe lining [14]. Moreover, flexible pressure sensors can be designed to identify the main characteristics of the human body mass distribution [15]. Prolonged sitting, especially with bad posture, can lead to a stiff neck, tight shoulders, and back pain. In light of this problem, the Velostat pressure sensors can be chosen in the acquisition system to monitor the driver’s posture and the intensity of prolonged sitting or reclining activity [16]. The ergonomic and performant smart cushion, based on a pressure-sensor array using the piezoresistive material Velostat as the core, is designed for sedentary people to correct their sitting posture and for drivers to improve their driving safety [17]. In fact, different human behaviors can produce different sitting postures, resulting in different pressure distributions on a seat. Unlike stand-alone pressure sensors, the pressure-sensor array can be distributed over the entire seat to gather comprehensive information about the pressure distribution of the human body. To identify incorrect sitting posture, a smart mat is embedded with pressure-sensing elements made by a low-cost E-Textile arranged in a matrix form [18]. Pressure distribution sensors located on the surface of the seat and backrest of the chair enable real-time acquisition of contact information between the chair and the occupant. Studies on standing posture and stability use, as a quantitative measure, the displacement of the center of pressure (CoP) calculated through a force platform in aged or diabetic subjects, children with cerebral palsy, or subjects in the neonatal stage. Pressure-sensitive mats (PSMs) are generally adopted to measure pressure on seats, beds, or floors, for interactive multimedia systems, for interactive toys, and for measuring CoP and train sitting balance [11,19]. Elderly or long-term hospitalized patients with diseases have a significant risk of pressure sores, which are wounds of the skin and internal tissues caused by continuous pressure on a specific area of the body. Sleep posture monitoring can prevent events such as sleep apnea or pressure ulcers that can generate pain, infection, and even death and, thus, negatively impact patient health and public health costs [7]. For this reason, several studies have been conducted on a bed pressure monitoring system suitable for daily use to prevent pressure ulcers, proposing complex solutions. Various types of pressure sensors, accelerometers, and gyroscope sensors have been used for sleep pattern and posture recognition [20]. The smart mat system, based on a dense flexible sensor array and printed electrodes for sleep posture recognition and sleep activity monitoring, is presented in [20]. Force-sensing resistors are incorporated into the mat to capture the pressure distribution of the human body, and machine learning methods including pre-processing and deep residual networks are applied to classify sleep postures [7]. The IoT-based smart bed systems are designed to support care assistants for elderly patients and patients with limited mobility. The use of the Internet of Things (IoT) and artificial intelligence in modern healthcare has promising technological, economic, and social implications [21]. All health information can be collected, managed, and used more efficiently due to the global connectivity of IoT. Wearable health management systems offer low-cost solutions for non-invasive personal health monitoring, enabling early diagnosis and better treatment for various medical conditions. The advanced intelligent IoT proposes the innovative textile pressure Velostat sensors to observe twenty-one people in four lying positions for preventing fall accidents and bedsores through the message queuing telemetry transport (MQTT) protocol and Arduino-based hardware [22]. Additionally, an intelligent Velostat mat for monitoring body position by obtaining pressure distribution on the patient’s body and posture prediction by ANN for medical applications is presented in [23]. A low-cost pressure sensor array consisting of conductive fabric and wires has been designed for sleep posture recognition by a shallow convolutional neural network (CNN) or by multiple accelerometers. The current paper presents the characterization of a sensitive mat based on Velostat and a control system adopted as the target solution to improve medical diagnosis.
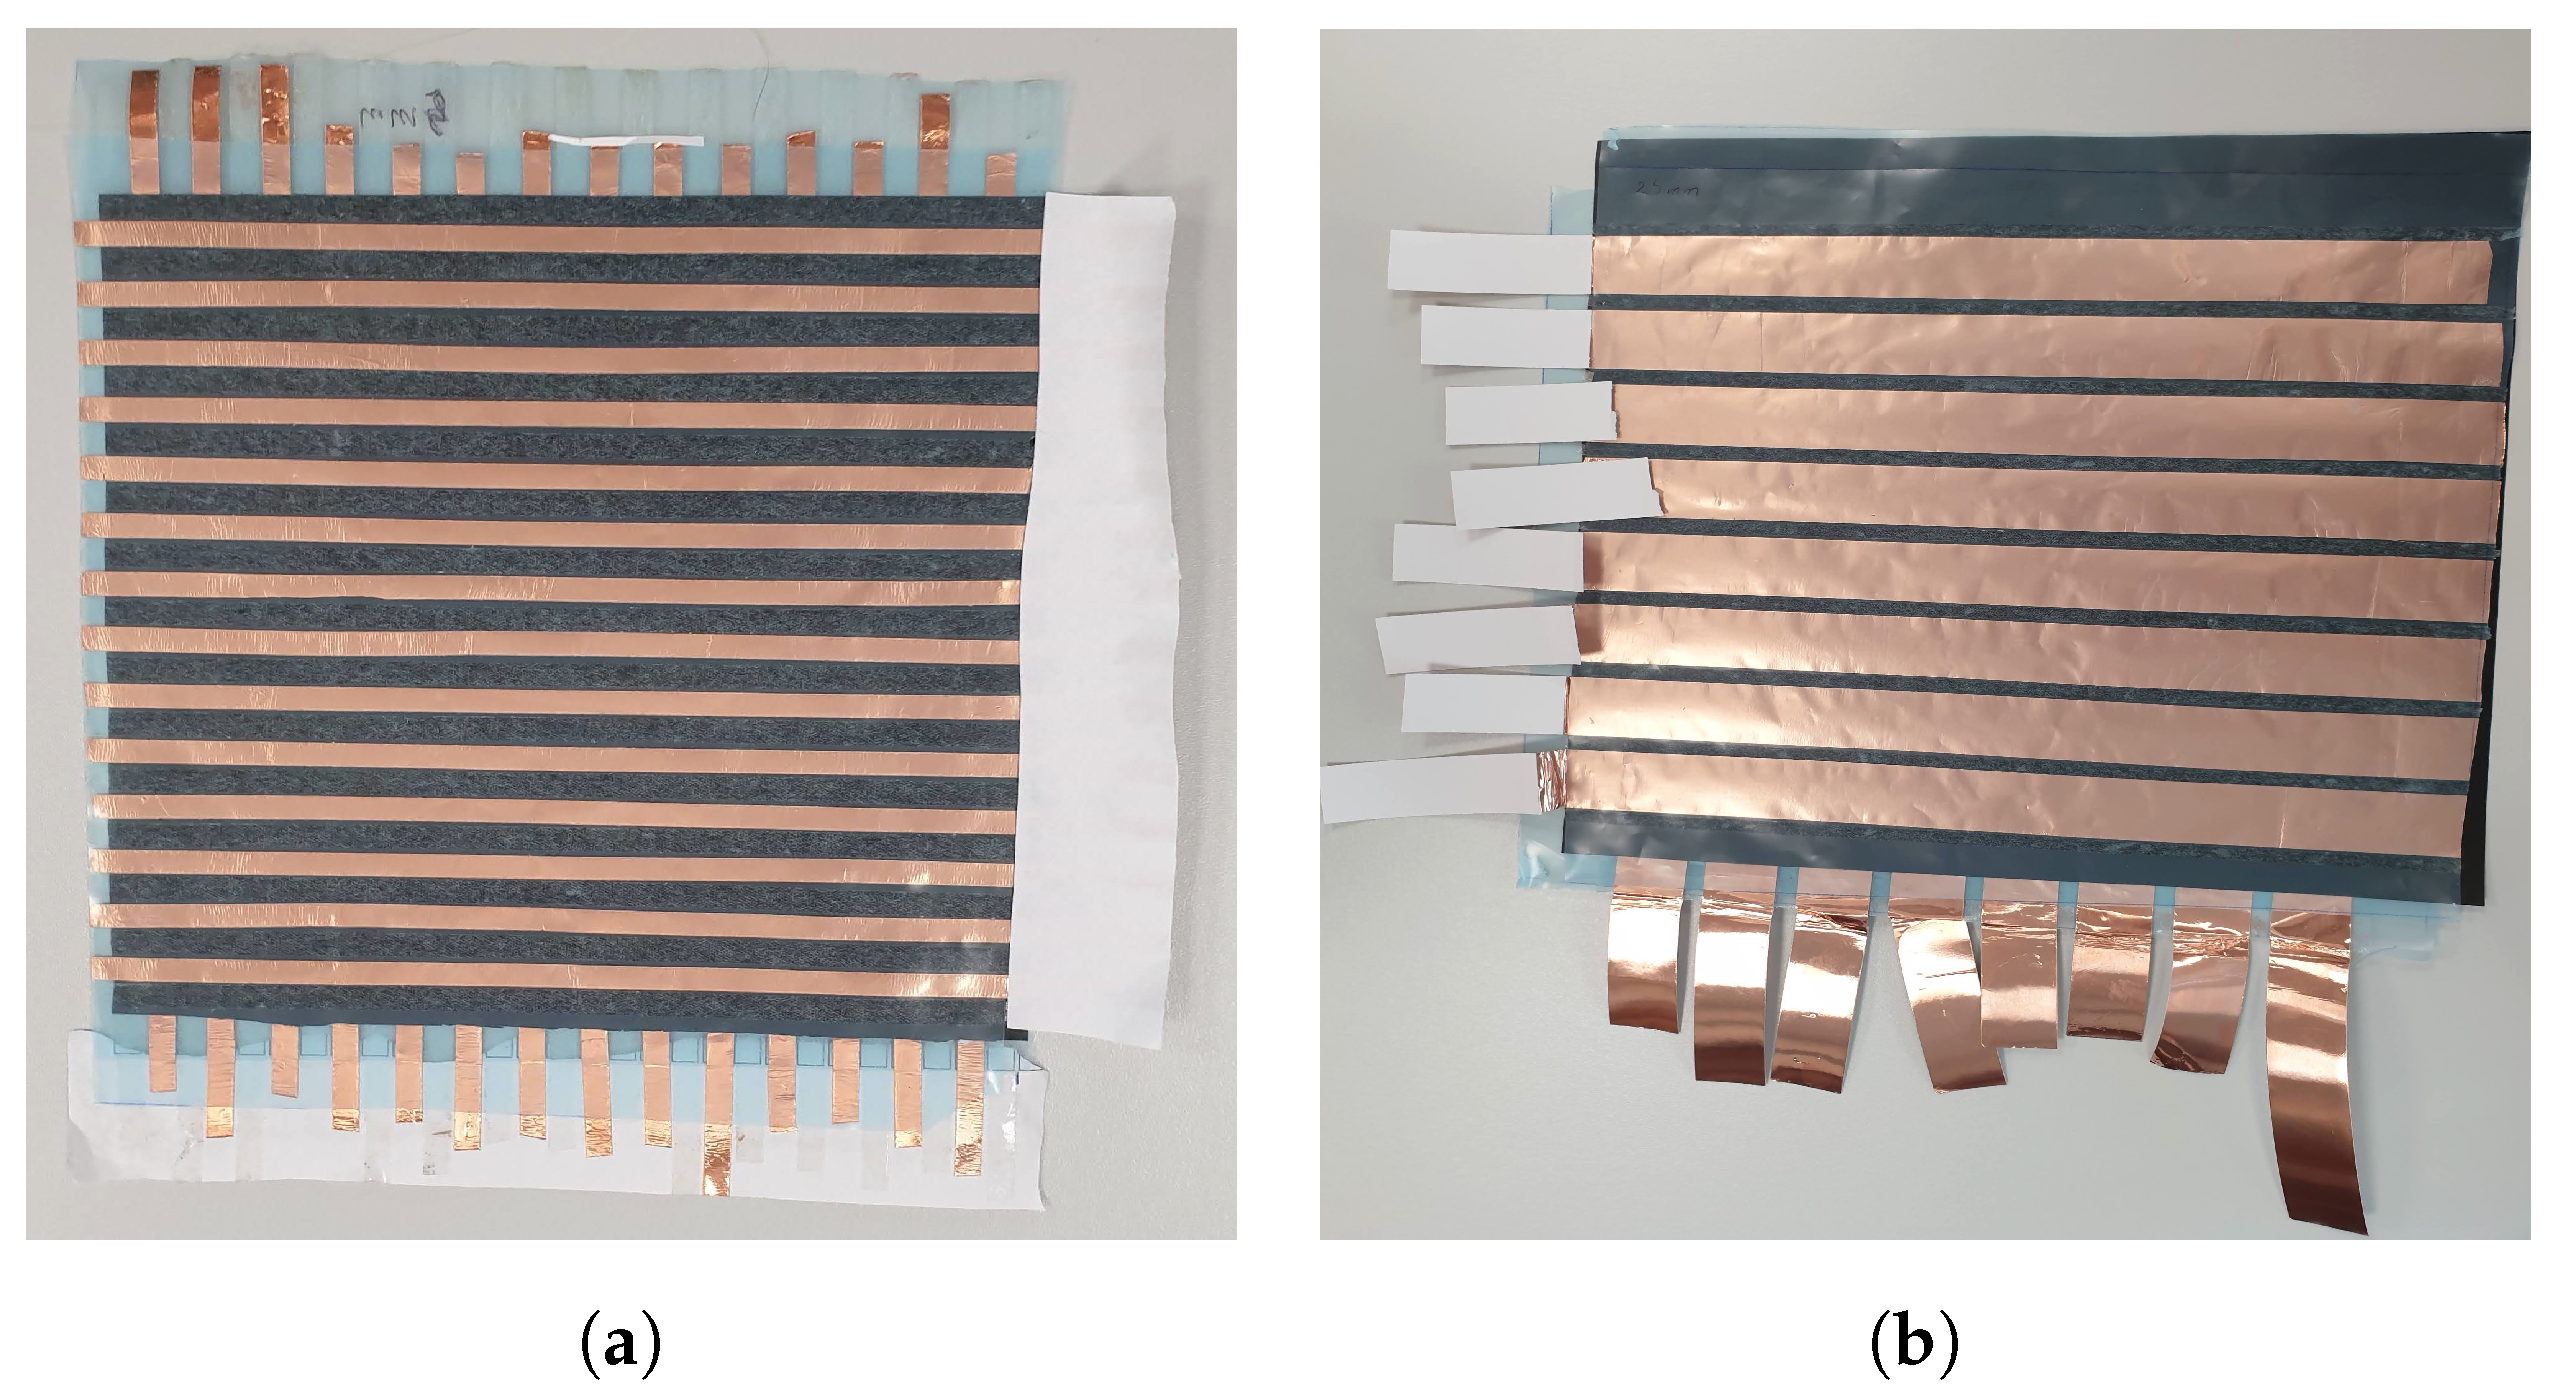
  • The fabrication, method, and materials of the mat surface are described using simple facilities.
  • The different design and geometry of homemade sensor mats (Figure 1a,b) are proposed to explore the electrical and mechanical properties, including repeatability, through the conducted tests.
  • A data acquisition system using software and an Arduino microcontroller is provided to automate the measurements of mat sensors in the test bench.
  • Thus, the approximation method based on the neural network algorithm is developed to achieve a relation between the different geometries of mats, the pressure and voltages applied to the mat, the resistance of the conductive material, and the number of sensing cells.
Figure 1. (a) Prototype Velostat pressure sensing mat n.1 with a sensitive cell size of 5 × 5 mm 2 , (b) Prototype Velostat pressure sensing mat n.2 with a sensitive cell size of 25 × 25 mm 2 .
Asi 06 00084 g001
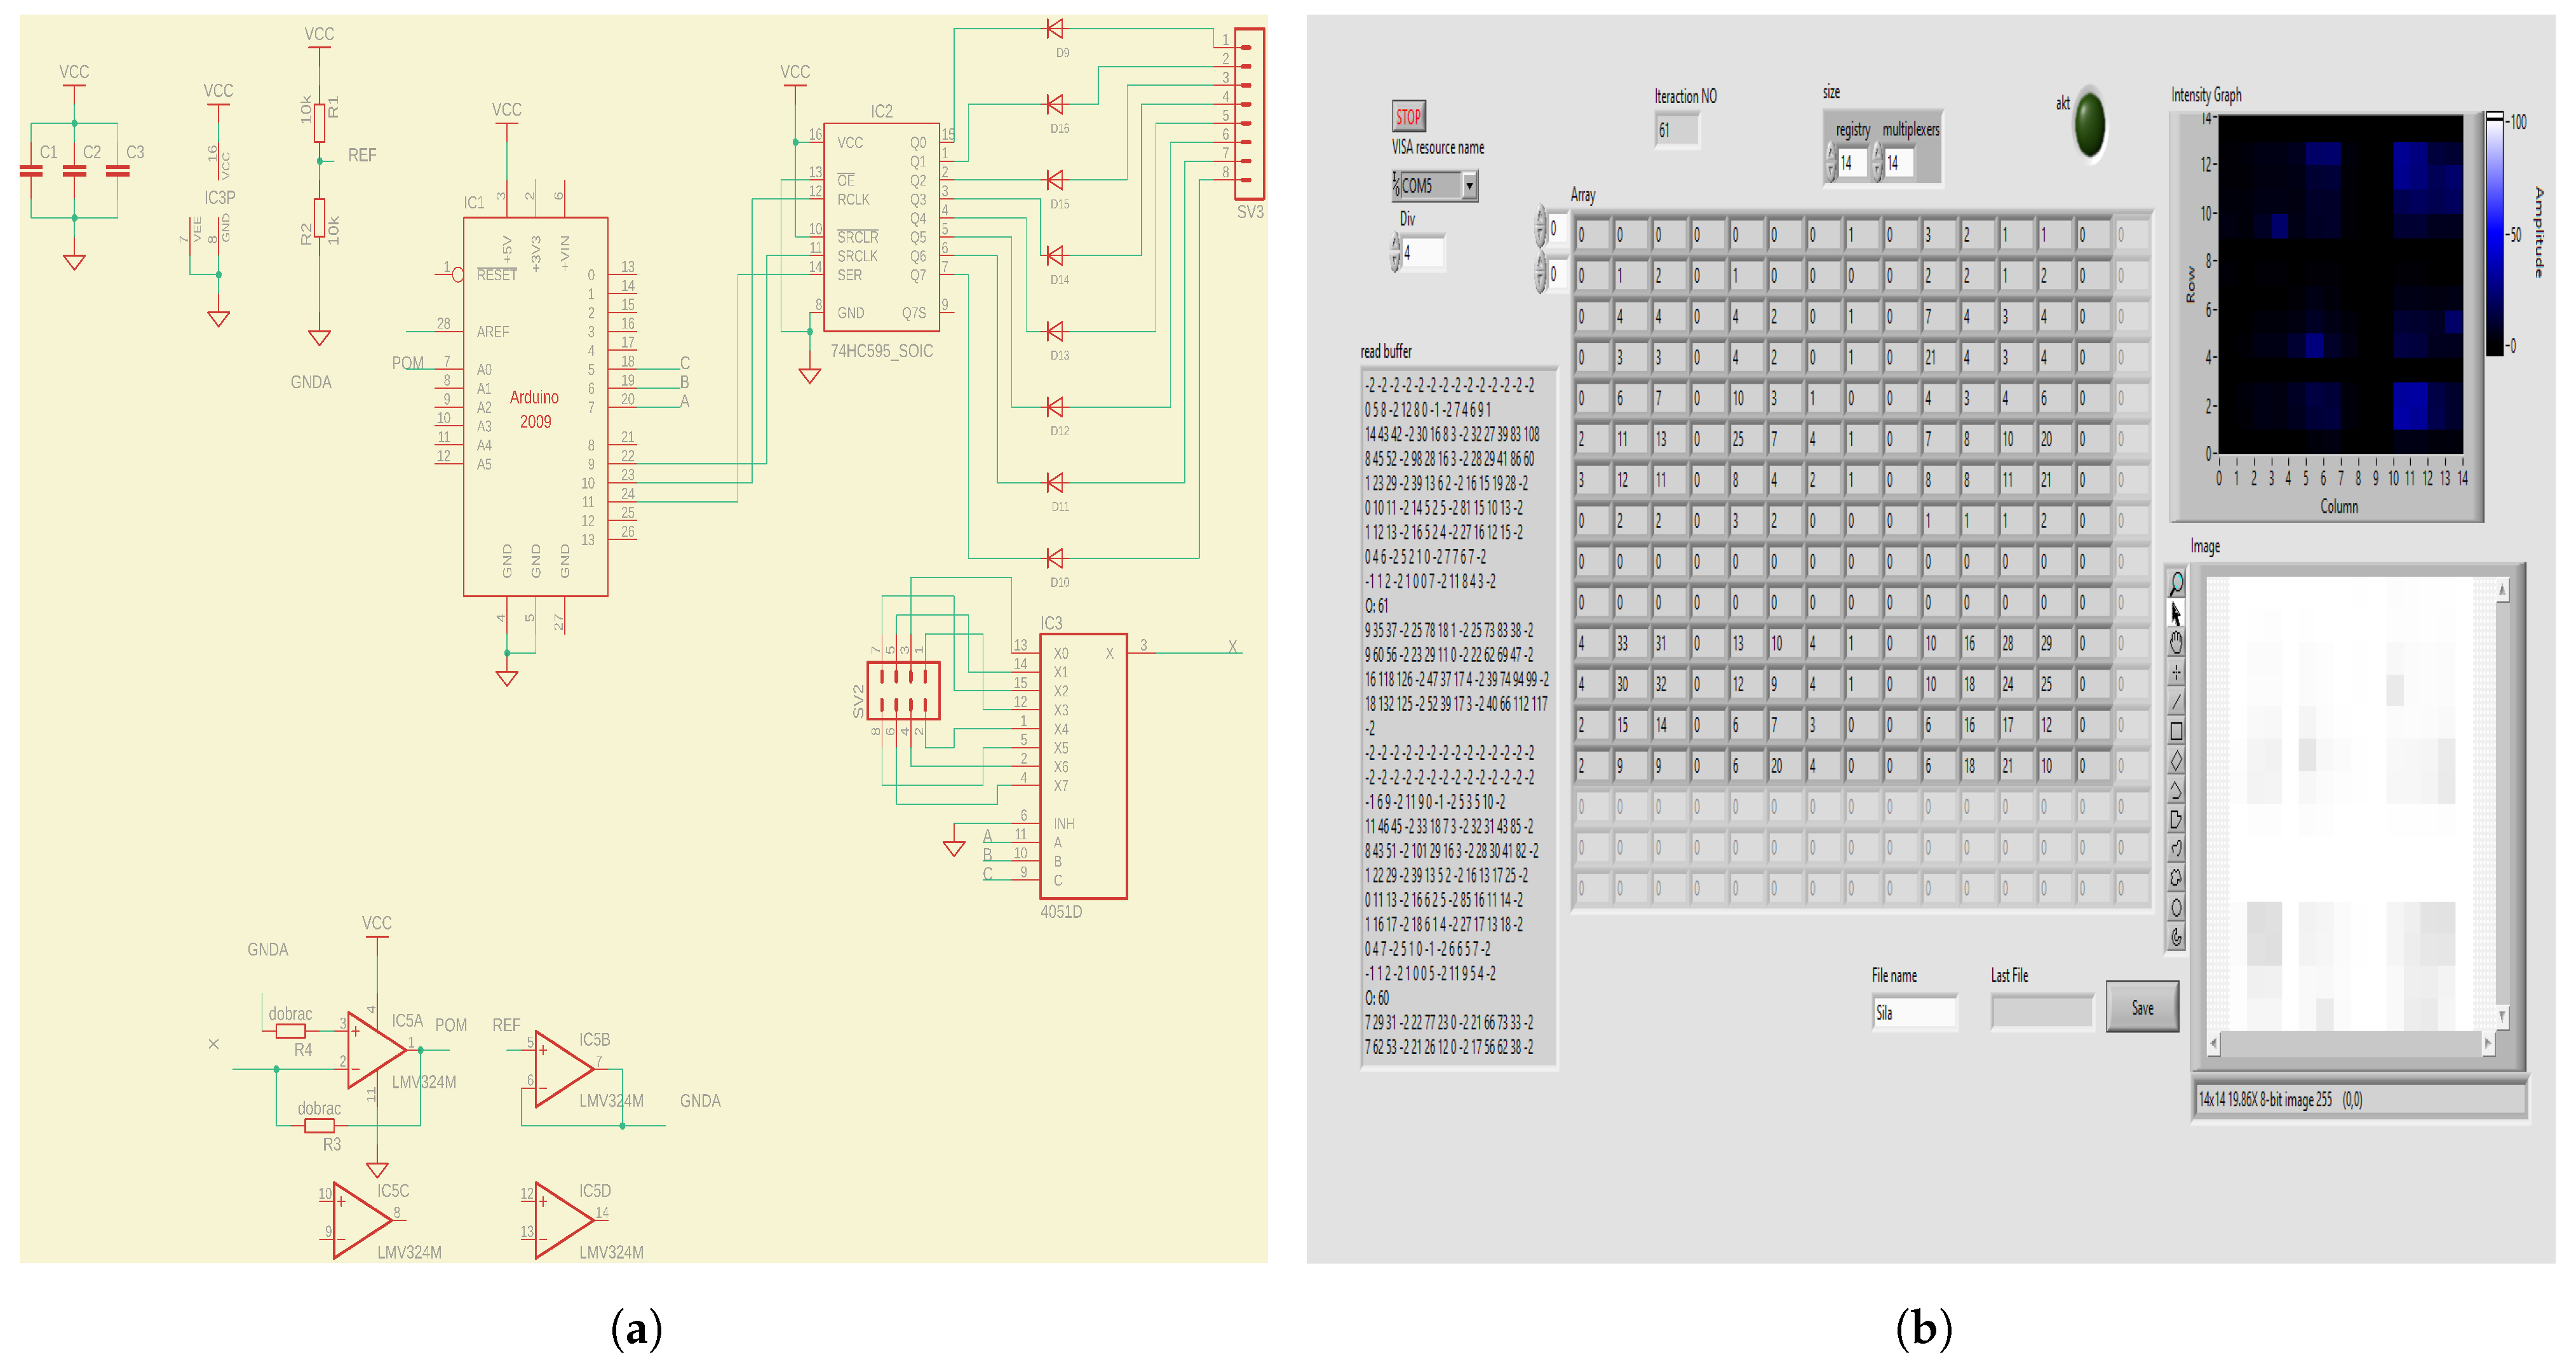
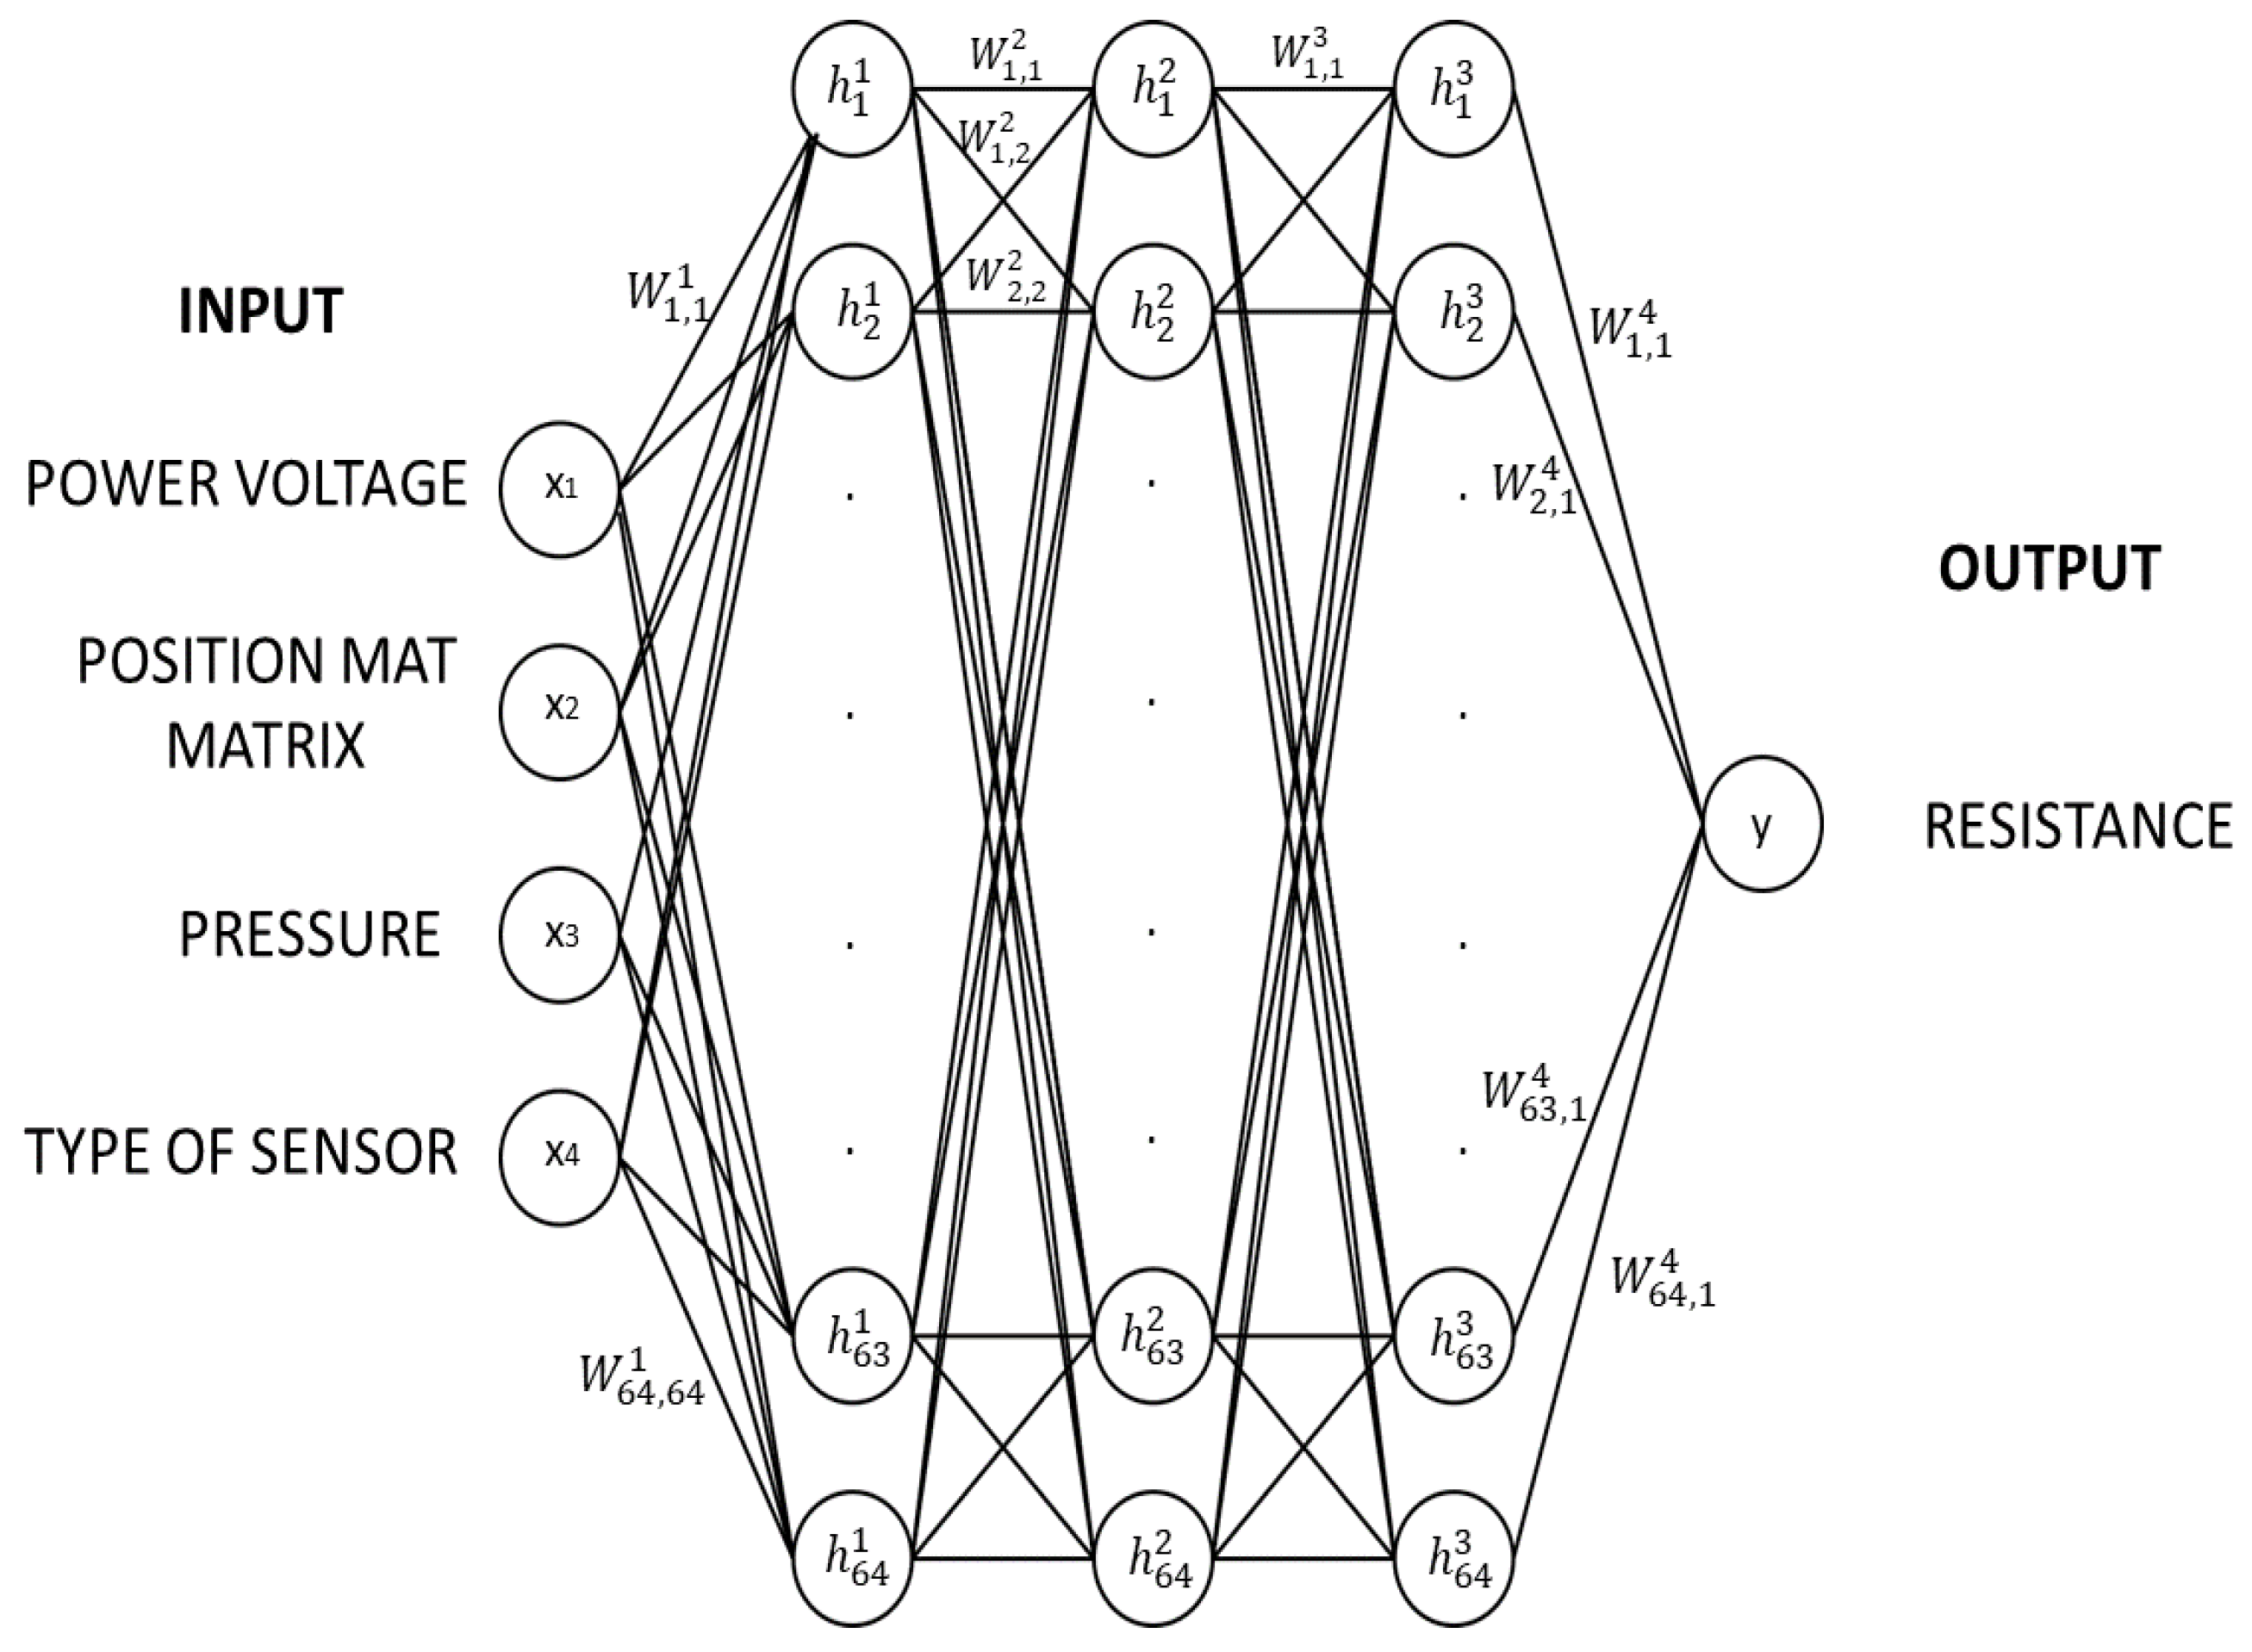
The novelty of this method involves an intelligent system completed by a measurement system, a micro-controller, and peripherals, including an innovative algorithm for the description of the characteristics of the 2D pressure-sensing matrix based on commercial materials that can be integrated in real-life conditions, i.e., installed onto a patient’s bed. Additionally, a neural network for assisting in positional detection of applied pressure was developed in that system. The smart mats can be integrated with innovative technology and materials in order to improve the design process and user comfort while providing health benefits such as sleep monitoring functionality, sleep quality and anti-snoring, detecting human postures, and counting posture cycles. A variety of different data such as heart rate, respiration, sleep quality, and blood pressure can be provided by smart mat sensors able to analyze the psycho-physical factors related to sleep in a non-invasive way. The analysis of the electrical performance of the mat using new techniques can help manufacturers to create higher quality and efficient products, to monitor sleep and rest patterns, and to optimize sleep activity connecting with smart devices, Wi-Fi, and IoT. The pressure-sensitive mats based on Velostat and the embedded Arduino system were manufactured and developed in the Laboratory of the Department of Mechatronics, Silesian University of Technology, Gliwice, Poland. In Section 2, the Velostat material is analyzed and in Section 3 are presented the different measurements tests, including the data visualization through Arduino conducted in laboratory on the sensor mat. Based on the experimental results obtained in laboratory, the methodology of the neural network algorithm and the results are described in Section 4 and Section 5, respectively. The conclusions are drawn in Section 6.

2. Material

The mat sensors were manufactured using the material Velostat, also known as “Linqstat”. This material is made by impregnating a conductive polyethylene resin film with carbon black (Figure 2a).
Velostat’s conductivity does not depend on humidity and age [24]. Antistatic plastics such as the Velostat film typically have a surface resistance less than 100,000 ohms-per-square. Electrically conductive plastics start with a surface resistivity of less than 10,000 ohms-per-square and can go as low as 10 ohms-per-square. The film is heat-sealable, flexible, and offers exceptional abrasion resistance. The film gives good thermal stability and chemical resistance, as shown in Table 1.
The carbon blacks provide physical cleanliness and excellent film smoothness. In Figure 2a, the Velostat material composed of the carbon black in an agglomeration of particles is shown under a digital microscope G1200 Digital Microscope 7 Inch Large Color Screen Large Base LCD Display 12MP 1–1200X Continuous Amplification Magnifier. The Velostat material can be used for many applications such as smartcard and micromodule interleavers, antistatic packaging, EMI and RF shielding, pressure sensors, TENS electrodes, digital whiteboards, and wearable electronics. In fact, this material is sensitive to pressure. The resistance changes when pressure is applied, making it useful for creating flexible sensors. The homemade fabricated mat consists of Velostat foil between two layers of strip copper wires arranged transversely to each other.The Velostat foil changes the resistance depending on the pressure force applied onto its surface. By testing the resistance at many different points on a sheet, the force acting on the sheet can be measured. The foil used in this application has a size of 280 × 280 mm and a thickness of 0.1 mm.

Mat Construction

The prototype of the flexible sensory mat was compared to existing solutions in the market, such as the Zebris gait cycle mats that respond to changes in force or pressure caused by walkers in a rigid structure or flat surface. The determination of force distribution on individual parts of the mat is referred to the International Standard PN-EN 60601-2-52: 2019, which covers medical electrical devices and detailed requirements for basic safety and the essential performance of medical beds. IEC 60601-2-52:2009 applies to the basic safety and essential performance of medical beds intended for adults, as defined in 201.3.212. Each medical bed contains a mattress support platform and is intended to assist the patient in diagnosis, monitoring, prevention, treatment, alleviation of disease, or compensation for an injury or handicap. The medical bed needs to be provided by a motion lockout control, which is an auxiliary subsystem that deactivates motion controls, pendant control handheld devices, undercarriages, side rails for physical barriers, rigid loading boards, and specialty mattresses. The mattress is intended for prophylactic or therapeutic effect [25]. The parts of the medical bed (Figure 3a) on which the mat is placed are headrest, rear section, seat section, upper legs, shank section, and footrest.
The IEC 60601-2-52 safety standard focuses on adult medical beds, including the safe working load. The safe working load (SWL) is defined as the maximum permissible load comprising patient, mattress, bed linen, and accessories that can be safely lifted by the bed as reported in [26,27]. All the medical beds are listed with the maximum patient or user weight and the safe working load of the bed [26]. The SWL for a medical bed is estimated to 1700 N, which is the sum of the minimum load considered in Table 2.
In the case of a foot rest, the partial SWL distribution for the weight of the patient is distributed over an area of 0.1 m 2 . In this work, a prototype of a flexible mat used in a hospital bed is developed and characterized. The materials used were Velostat foil, self-adhesive copper tapes, surface protection film, and 5 mm wide double-sided tape (Figure 2a). The adhesive copper tapes are positioned on Velostat foil at uniform distances apart. On the other side of the Velostat material, the same method was carried out, but the copper tapes were placed at the same distance but in the opposite direction, as shown in Figure 4. Finally, the isolated wires are adhered into place between the mat’s copper side columns. The transparent blue protective coatings are welded onto the mat. The conductive copper tape is designed to conduct electricity and is considered an isotropic conductive adhesive, i.e., conductive in all directions. This is coated with an acrylic adhesive that is uniformly dispersed with conductive spheres to provide a very low rate of electrical resistance through the tape. Therefore, the wide copper strip of 5 mm was preferred instead of a larger copper strip in further experimental tests to obtain good results. The self-adhesive EMI copper tape of 10 mm × 30 m provides excellent insulation against electromagnetic fields and related interference. The tape is 25 μ m thick, 30 m long, and 10 mm wide. The sensor matrix was created using the copper tape and the Velostat material. The copper tape was cut in equal lengths and located on both sides of the mat, one with copper columns and one with copper rows. The cables were soldered to the selected prototype, in particular, connected to the copper columns and rows of the mat. The prepared mat prototype of the entire foil of the Velostat between the copper strips can generate noise and interference in the tested cell (so-called crosstalk). For this reason, the prototype of the sensor mat has included the isolated wire and the surface protection film with a transparent blue color made of PE film with a thickness of 50 μ m.
In Figure 2a, the top view of the Velostat sensor exhibits the copper wire and the Velostat foil observed under the Andostar AD407microscope. In order to perform the tests in the appropriate measuring range, the calculation of the pressure for each part of the mat is required.

3. Experimental Results

3.1. Measurements of Mat Pressure Sensor

The resistance of the pressure sensing mat was investigated as a function of pressure. Different types of tests were conducted to investigate the sensor characteristics.

3.1.1. First Experimental Test

Initially, the measurements were performed on selected mat prototypes with the geometrical and technical details presented in Table 3.
The resistance of the mat was measured using a technical method with a specific supply voltage, and the load on the mat was increased with a known weight. In the first test experiment, the measuring system was connected to the sensor mat and consisted of a power supply, two digital multimeters, and cables. The voltage and resistance measurements were conducted by using a resistor R of 250 Ω connected in series to the mat, as displayed in Figure 3c. The supply voltage V g is set to 5 V. The multimeters used to measure the electrical voltage and resistance were a PC510 Sanwa MULTIMETER, DIGITAL, with specifications of a voltage measuring range of AC 500 mV and 0.08% basic accuracy, and a Sanwa CD771, MULTIMETER, DIGITAL, with a measuring range of 400 mV and the best accuracy of (0.5% + 2) (Figure 5a). The DC power supply used is the TEKTRONIX PWS2323 BENCH POWER SUPPLY, 32VDC, 3A. The electronic balance Łucznik KS-509 S is used to measure the weight of the materials and the foil.
Four tests were conducted by using different contact elements to be applied on the mat, as shown in Figure 6. The pressure force was calculated on the mat using as contact element:
  • a wooden disc with a radius of 48.3 mm and thickness of 4 mm (Test1)
  • a steel cylinder with a radius of 35.5 mm (Test2)
  • a small sponge (Test3)
Figure 6. Resistance in function of pressure force applied on mat.
Asi 06 00084 g006
The variation in mat resistance ( Ω ) in the function of pressure force expressed in Newtons for the different conducted tests is reported in Figure 6. As the force applied to the mat sensor increases, the mat exhibits a decrease in resistance.

3.1.2. Second Experimental Test

In the second test experiment, the measurements of the pressure sensor mat were carried out using as pressure force the calibration weights cylinders. Calibration weights based on four cylinders of diameter d equal to 9.75 mm and a foam base were applied to the mat on different sensitive cells of the sensor matrix mats to measure the resistance. The variation in mat resistance ( Ω ) in the function of pressure force expressed in Newtons for different sensitive cells (B1, E1, B4, E4) of the mat is reported in Figure 7.
The rows and columns of the mat matrix are numbered, respectively, with letters (A, B, C …) and with numbers (1, 2, 3 …), as shown in Figure 3b. The weights of the load applied on the mat are 50 g of plate, 221 g of board, and 220 g of steel cylinder. The supply voltage V g is 4 V. The repeatability of the sensor mat experiment was tested, providing the same result of resistance under the same measurement procedure for the same weights, as shown in Figure 8.
The additional pressures were obtained by increasing weights from 500 g to 5000 g and reading the current value from the multimeter with a constant voltage excitation ( V g = 5 V), and then, the opposite measurements were achieved for decreasing weights from 5000 g to 500 g.

3.1.3. Third Experimental Test

In the third test experiment, the measurements of the pressure sensor mat were carried out using the Rigol DM3058E 5½ Digit Digital Multimeter, the RS PRO Power Supply, and Force gauge FB200 200 N (20 kg) 0.05N (Figure 5a). The force meter is dedicated to measuring force while pressing, and its graphical display allows for easy to read indications or present measurement results on a histogram or chart. The force gauge is equipped with a socket for an external power supply unit, RS232C interface (RJ joint), USB interface and optional Bluetooth interface, or THR (thresholds) output. The terminal set of the force gauge, in particular, the tip (Figure 9c), made of steel, suitable for the measurement to be conducted on the mat surface, was designed in Autodesk Inventor (Figure 9b). The terminal end of the dynamometer has a surface area of 28.274 mm 2 and the technical drawing is shown in Figure 9a.
To perform the measurements, the dynamometer was mounted on a support in the vertical position and properly calibrated. The force gauge was used to apply different loads and measure the pressure on the prototypes of mats with different geometries, as shown in Figure 5a. The matrix of the mat is a square arrangement of elements into rows and columns (Figure 3b). The columns and rows of the mat matrix are numbered with letters (A, B, C …) and numbers (1, 2, 3 …), respectively. The pressure sensitive mat in Figure 1a consists of a matrix of 14 × 14 sensing elements. The pressure sensitive mat in Figure 1b consists of a matrix of 8 × 8 sensing elements. To measure the current and voltage, the multimeter was used, and a supply voltage is assumed of 5 V, 3.3 V, and 7.5 V for the mat with 14 × 14 sensing active elements. The cell elements considered under the pressure of the force gauge are H14, N14, H10, L7, and G11, as shown in Figure 10. The variation in mat resistance ( Ω ) in the function of pressure force expressed in Newtons for different conducted tests is reported in the Figure 10.
The voltage V g is assumed to be 5 V for a mat with 8 × 8 active sensing elements. The cell elements under pressure of the force gauge are B8, H8, D3, B6, and F5, as shown in Figure 11.

3.1.4. Fourth Experimental Test

In the last test experiment, the electrical properties of the mat sensors were analyzed using the Arduino embedded system and the force gauge FB200 200 N (20 kg) 0.05 N (Figure 5b). In order to acquire the electrical signals from the pressure sensor mat, the interface between the measuring mat pressure, electronic components, and circuits was developed. The active mat sensor cells are arranged in columns and rows connected to the output of the shift register, which adds I/O pins to the Arduino system. The SN74HC595 device contains an 8-bit, serial-in, parallel-out shift register that feeds an 8-bit D-type storage register. The shift register has a direct overriding clear input, serial input, and serial outputs for cascading. When the output-enabled input is high, the outputs are in the high-impedance state. The diodes were connected to SN74HC595 outputs to block the possibility of the returning voltage from the mat to the system switching to the next levels. The Multiplexer CD4051D was used to read the resistance values.
The SN74HC595 device controls the response signal and switches on one active column of the sensitive mat. The Multiplexer CD4051D controls the signal response of the mat and selects the active row of the mat connected to ADC and provides the reading (Figure 12a). Its operation resembles a normally open switch that is activated by specifying the appropriate binary value. The signal from the mat is amplified by an operational amplifier. The op-amp is connected as well to the Arduino board (Figure 12b). The purpose of the code-program in Arduino is to control the shift register and the multiplexer for retrieving serial data input from the mat. The first part of the software program provides the changing of the time between the data samples, expressed in milliseconds, and the input/output pins on the microcontroller, for which the digital states can be read and the values assigned and changed. The program code (Supplementary Materials) can provide continuous measurements and establish serial communication with LabVIEW-Arduino using UART to transfer continuous stream data. The variables indicate the physical position of the pins; the time interval (minimum jump time is 50 ms) and the size of the matrix represent the mat expressed in rows and columns. In particular, the analog pin is used to read data downloaded from the mat, the digital pin is used to control the multiplexer, and the SRCLK shift register clock pin is changed (set to 1-high 0-low) according to the microcontroller connection and information transfer. The following statements and declarations are executed in the program code (Supplementary Materials):
-
number of rows and columns measurement
-
declaration of pin settings on the shift register, in case of a changing number of columns
-
position in the matrix
-
declaration of connection via UART
-
declaration of pin operation
Figure 12. (a) Schematic of the electrical circuit in the Autodesk Eagle program using the ESP system, (b) LabVIEW Front Panel.
Asi 06 00084 g012
As reported in the S1.
The Arduino has a USB interface used for sending data from the mat sensor to the host computer. The mat sensor data received from the Arduino hardware are displayed using the LabVIEW 2021 Q interface. The front panel window (Figure 12b) presents the interactive input and output terminals of the user interface for LabVIEW code VI. The front panel window is the user interface for the VI and exhibits controls and indicators, which are the interactive input and output terminals, respectively, of the VI. The mat matrix (14 × 14) is connected to Arduino platform and LabVIEW 2021 Q in order to read and properly detect the data of pressure force on mat in real time for each cells of mat as shown in the LabVIEW front panel (Figure 12b). The measuring system connected to the mat sensor consists of a power supply, a multiplexer, an Arduino board, and cables (Figure 2b). The voltage and resistance measurements were conducted connecting a resistor R of 2 k Ω in series to the mat, as shown in the schematic electric circuit of Figure 3c. The supply voltage V g is 4.2 V for the mat with 14 × 14 active sensing elements.

4. Method

Neural Network Approach to the Sensor Mat

A neural network is a computational model inspired by the structure and function of the human nervous system. It can be used to recognize complex patterns and to carry out relationships in data. It is used in many fields, for example, natural language processing, computer vision, nuclear fusion, and many other applications. The artificial neural network (ANN) consists of node collections, known as “artificial neurons”, that are organized into blocks called layers and connected to each other by weights. Each artificial neuron receives inputs from other neurons and produces an output as an adopted feed-forward algorithm, which is then assigned to the next neurons. In particular, an appropriate mathematical function, known as an activation function, maps inputs to the corresponding outputs.
Some activation functions help to capture strong non-linearity in the data, and for this reason, the neural networks have been explored for the experimental data from mat sensors collected in the laboratory.
In order to define a relationship between the data, the optimal weights and biases have to be set to minimize the error between the predicted and true outputs. Technically, this method is based on a backward propagation algorithm. To achieve these, it is important to use an appropriate loss function during the training process, which is an objective function to be optimized. The smaller the objective function, the better the designed network is trained. The network is trained on an initial subset of data (training data set), and the remaining test data set is used to validate the network.
The neural network model is developed to establish the mathematical formula for the Velostat sensitive mat; for instance, a neural network’s relationship between input x and output y is:
y ( x ) = σ n ( W n σ n 1 ( W n 1 σ 0 ( W 0 x + b 0 ) + b n 1 ) + b n )
where σ i is the function as activation function, x is the input, and W i and b i are weights and biases with i = 0, … n − 1.
In our case, the different geometries of mats, the pressure and voltages applied on the mat, and the number of sensing cells are considered for the approximation method based on the neural network model.
The supply voltages, which varied in the range 5 V, 3.3 V, and 7.5 V, were measured by the RS PRO Power Supply during the laboratory tests. In the mat sensor, the active cells H14, N14, H10, L7, and G11 are subjected to the pressure applied by the FB200 200 N force gauge. The resistances R are obtained by formula R = V / I , where V is the voltage measured by the RS PRO Power Supply, and I is the current measured by the Rigol DM3058E Digital Multimeter.
The neural network provides as additional input the position of the active cell within the matrix mat identified by grid lines and coordinates, the pressure exerted on the cell, and the geometry of the mat Velostat. In this case, two types of sensor mat geometries, presented in Figure 1a,b, were considered, with the technical characteristics given in Table 3. The positions of the active cell are expressed as matrix elements arranged in specific rows and columns.
To increase the efficiency of the learning algorithm of the neural network model based on the relation between the pressure applied on the mat and the resistance of the Velostat material, the information about the rows and column position cells of the mat matrix are requested as input. The neural network provides a relevant configuration model suitable for both geometries of mats with a high generalization performance, as shown in Figure 13.
Thus, all the inputs mentioned above such as power voltages, position mat matrix, pressure, and type of sensor are included in the array x. Finally, y is the resistance predicted and the output of the neural network defined as the target.

5. Results

Neural Networks Results

The considered network structure consists of three layers: one input layer, one hidden layer, and one output containing 64 nodes for each layer (Figure 13). The rectified linear unit (ReLU) is used as a non-linear activation function in the deep learning domain. The main advantage of using the ReLU function over other activation functions is that it activates all the neurons over time. This means that the neurons are deactivated if the output of the linear transformation is less than 0, instead of returning the input value itself for positive input values. The mean squared logarithmic error (MSLE), known as loss function, can be interpreted as a measure of the ratio between the actual and predicted values. The MSLE loss function, commonly used to predict values that can cover a wide range of magnitudes, has provided 0.0077 for the training procedure and 0.1059 for the test procedure as results.
The optimization of the MSLE loss function was obtained by the adaptive moment estimation (ADAM) optimizer. It is a variant of stochastic gradient descent (SGD) that uses adaptive learning rates to update the model parameters. The ADAM optimizer combines two optimization algorithms, AdaGrad and RMSProp. The ADAM provides a learning rate for each parameter based on historical gradient information. However, unlike AdaGrad and RMSProp, ADAM incorporates an exponentially decaying average of past gradients and a moving average of the second moments of gradients. These additional steps help to smooth out the learning rate and to enhance the convergence of the algorithm.
The parameters, typically the weights of the neural network model connections, are learned during the training stage. These weights and biases W i and b i are, respectively, in values equal to 8705. For instance, Table 4, Table 5, and Table 6 show some of the weight values for the first, second, and third layers, respectively.
The mathematical relationship obtained by the neural network model is reported in the following formula:
y = i = 1 64 W i 1 4 h i 3 + b i 4 ,
h j 1 = R e L U ( i = 1 4 W i j 1 x i + b i 1 ) , j = 1 , , 64
h j 2 = R e L U ( i = 1 64 W i j 2 h i 1 + b i 2 ) , j = 1 , , 64
h j 3 = R e L U ( i = 1 64 W i j 3 h i 2 + b i 3 ) , j = 1 , , 64
where W i j r are the weights, r is the number of the layer, i is referred to the i-th node of the r − 1 layer, and j refers to the j-th node of the r layer.
b i r are biases of nodes; i is referred to as the i-th node of the r layer.
h i r is the output of layer r − 1 or, equivalently, the input of layer r; i is referred to the index of the i-th output node in layer r − 1.
x i is the input data of the neural network; i is referred to the features of the input; in this case, i = 1 stands for number cell, i = 2 stands for pressure, and i = 3 for voltage applied.
The predicted values of the target (resistance) relative to the training data set and the test data set are shown, respectively, in Figure 14a,b. The presented results show a good performance in terms of prediction; however, the maximum error is around 7 % . As the magnitude of the resistance value increases, the predicted values of resistance deviate from the true values. Furthermore, in Figure 15a,b, the relative error of the predicted value of the sensor’s resistance compared to the true value on the training and test data sets is represented, respectively. Then, the same neural network architecture was used to validate the data forces achieved by the Arduino platform and LabVIEW for easy detection. In particular, Figure 16a shows the matrix of response at the pressure force (F = 1.05 N) applied on the active cell (I11). Figure 16b exhibits the comparison between the true and predicted force targets obtained by ANN, expressed by a good performance in prediction. Therefore, the relative approximation error of the prediction distribution of the force applied on the mat is shown in Figure 16c. The result reveals that the approximation error equals 0 due to the Arduino embedded system. The structure of the neural network has been developed and defined using the coding language Python with libraries of Keras in TensorFlow.

6. Conclusions

This article describes sensitive smart mats based on the polymeric Velostat material. Various designs, geometries, electrical, and mechanical properties of homemade sensor mats have been investigated through the tests performed in the laboratory. The pressure sensor mat was interfaced with LabVIEW and the Arduino microcontroller in order to monitor and control the variation in resistance under applied pressure. The Arduino-based board was used to transfer the measured data into a laptop for evaluation and visualization. In addition, an approximation method based on neural network algorithms was developed to determine the relationship between different shapes of the mat, the pressure and stress exerted on the mat, the resistance of the conductive material, and the number of active sensing cells. The developed neural network model easily solves the complexity and non-linearity of the sensor matrix data, combining the design and tests processed through Arduino. In the future work, the authors will investigate the real size mat with its feasibility and issues, including new technologies.

Supplementary Materials

The following supporting information can be downloaded at: https://www.mdpi.com/article/10.3390/asi6050084/s1.

Author Contributions

All authors have contributed equally. All authors have read and agreed to the published version of the manuscript.

Funding

This research was supported as part of the project “Including students in scientific research through research clubs and project-oriented teaching” in connection with the participation of the Silesian University of Technology in the “Initiative of Excellence-Research University” program (contract No. 08/IDUB/2019/84 of 16 December 2019).

Institutional Review Board Statement

Not applicable for studies.

Informed Consent Statement

This article does not contain any studies with human participants or animals performed by any of the authors.

Data Availability Statement

The data sets generated during and/or analyzed during the current study are available from the corresponding author on reasonable request.

Acknowledgments

The authors would like to express their gratitude to Aleksandra Bańczyk, Mateusz Szpala, Adam Zaraś, Michał Wȩgrzyk, Patryk Radek, Jan Łata, Kacper Krysiak and Agata Abela for their support during the research activity. The authors and entire staff have consented to the acknowledgement.

Conflicts of Interest

The authors declare that there are no conflicts of interest.

References

  1. Spook, S.M.; Koolhaas, W.; Bültmann, U.; Brouwer, S. Implementing sensor technology applications for workplace health promotion: A needs assessment among workers with physically demanding work. BMC Public Health 2019, 19, 1100. [Google Scholar] [CrossRef] [PubMed]
  2. Kciuk, M.; Bijok, T.; Lo Sciuto, G. Design and Modeling of Intelligent Building Office and Thermal Comfort Based on Probabilistic Neural Network. SN Comput. Sci. 2022, 3, 1–15. [Google Scholar] [CrossRef]
  3. Jin, Y.; Chen, G.; Lao, K.; Li, S.; Lu, Y.; Gan, Y.; Li, Z.; Hu, J.; Huang, J.; Wen, J.; et al. Identifying human body states by using a flexible integrated sensor. NPJ Flex. Electron. 2020, 4, 1–8. [Google Scholar] [CrossRef]
  4. de Fazio, R.; Perrone, E.; Velázquez, R.; De Vittorio, M.; Visconti, P. Development of a self-powered piezo-resistive smart insole equipped with low-power ble connectivity for remote gait monitoring. Sensors 2021, 21, 4539. [Google Scholar] [CrossRef] [PubMed]
  5. Dzedzickis, A.; Sutinys, E.; Bucinskas, V.; Samukaite-Bubniene, U.; Jakstys, B.; Ramanavicius, A.; Morkvenaite-Vilkonciene, I. Polyethylene-carbon composite (Velostat®) based tactile sensor. Polymers 2020, 12, 2905. [Google Scholar] [CrossRef] [PubMed]
  6. Han, J.W.; Park, J.; Kim, J.H.; Entifar, S.A.N.; Prameswati, A.; Wibowo, A.F.; Kim, S.; Lim, D.C.; Lee, J.; Moon, M.W.; et al. Stretchable and Conductive Cellulose/Conductive Polymer Composite Films for On-Skin Strain Sensors. Materials 2022, 15, 5009. [Google Scholar] [CrossRef] [PubMed]
  7. Tang, K.; Kumar, A.; Nadeem, M.; Maaz, I. CNN-based smart sleep posture recognition system. IoT 2021, 2, 119–139. [Google Scholar] [CrossRef]
  8. Esposito, D.; Centracchio, J.; Andreozzi, E.; Bifulco, P.; Gargiulo, G.D. Design and Evaluation of a Low-Cost Electromechanical System to Test Dynamic Performance of Force Sensors at Low Frequencies. Machines 2022, 10, 1017. [Google Scholar] [CrossRef]
  9. Veeramuthu, L.; Venkatesan, M.; Benas, J.S.; Cho, C.J.; Lee, C.C.; Lieu, F.K.; Lin, J.H.; Lee, R.H.; Kuo, C.C. Recent progress in conducting polymer composite/nanofiber-based strain and pressure sensors. Polymers 2021, 13, 4281. [Google Scholar] [CrossRef] [PubMed]
  10. Nascimento, D.H.A.; Magalhães, F.A.; Sabino, G.S.; Resende, R.A.; Duarte, M.L.M.; Vimieiro, C.B.S. Development of a Human Motion Analysis System Based on Sensorized Insoles and Machine Learning Algorithms for Gait Evaluation. Inventions 2022, 7, 98. [Google Scholar] [CrossRef]
  11. Martinez-Cesteros, J.; Medrano-Sanchez, C.; Plaza-Garcia, I.; Igual-Catalan, R.; Albiol-Pérez, S. A Velostat-Based Pressure-Sensitive Mat for Center-of-Pressure Measurements: A Preliminary Study. Int. J. Environ. Res. Public Health 2021, 18, 5958. [Google Scholar] [CrossRef] [PubMed]
  12. van Donselaar, R.; Chen, W. Design of a smart textile mat to study pressure distribution on multiple foam material configurations. In Proceedings of the 4th International Symposium on Applied Sciences in Biomedical and Communication Technologies, Barcelona, Spain, 26–29 October 2011; pp. 1–5. [Google Scholar]
  13. Li, E.; Lin, X.; Seet, B.C.; Joseph, F.; Neville, J. Low profile and low cost textile smart mat for step pressure sensing and position mapping. In Proceedings of the 2019 IEEE International Instrumentation and Measurement Technology Conference (I2MTC), Auckland, New Zealand, 20–23 May 2019; IEEE: Piscataway, NJ, USA, 2019; pp. 1–5. [Google Scholar]
  14. Bucinskas, V.; Dzedzickis, A.; Rozene, J.; Subaciute-Zemaitiene, J.; Satkauskas, I.; Uvarovas, V.; Bobina, R.; Morkvenaite-Vilkonciene, I. Wearable feet pressure sensor for human gait and falling diagnosis. Sensors 2021, 21, 5240. [Google Scholar] [CrossRef] [PubMed]
  15. Cui, X.; Huang, F.; Zhang, X.; Song, P.; Zheng, H.; Chevali, V.; Wang, H.; Xu, Z. Flexible pressure sensors via engineering microstructures for wearable human-machine interaction and health monitoring applications. IScience 2022, 25, 104148. [Google Scholar] [CrossRef] [PubMed]
  16. Hudec, R.; Matúška, S.; Kamencay, P.; Benco, M. A smart IoT system for detecting the position of a lying person using a novel textile pressure sensor. Sensors 2020, 21, 206. [Google Scholar] [CrossRef] [PubMed]
  17. Yuan, L.; Li, J. Smart cushion based on pressure sensor array for human sitting posture recognition. In Proceedings of the 2021 IEEE Sensors; IEEE: Piscataway, NJ, USA, 2021; pp. 1–4. [Google Scholar]
  18. Xu, W.; Li, Z.; Huang, M.C.; Amini, N.; Sarrafzadeh, M. ecushion: An etextile device for sitting posture monitoring. In Proceedings of the 2011 International Conference on Body Sensor Networks; IEEE: Piscataway, NJ, USA, 2011; pp. 194–199. [Google Scholar]
  19. Kyvelidou, A.; Harbourne, R.T.; Shostrom, V.K.; Stergiou, N. Reliability of center of pressure measures for assessing the development of sitting postural control in infants with or at risk of cerebral palsy. Arch. Phys. Med. Rehabil. 2010, 91, 1593–1601. [Google Scholar] [CrossRef] [PubMed]
  20. Bennett, S.; Ren, Z.; Goubran, R.; Rockwood, K.; Knoefel, F. In-bed mobility monitoring using pressure sensors. IEEE Trans. Instrum. Meas. 2015, 64, 2110–2120. [Google Scholar] [CrossRef]
  21. Tomasic, I.; Petrović, N.; Fotouhi, H.; Lindén, M.; Björkman, M. Data flow and collection for remote patients monitoring: From wireless sensors through a relational database to a web interface in real time. In Proceedings of the EMBEC & NBC 2017: Joint Conference of the European Medical and Biological Engineering Conference (EMBEC) and the Nordic-Baltic Conference on Biomedical Engineering and Medical Physics (NBC), Tampere, Finland, 11–15 June 2017; Springer: Berlin/Heidelberg, Germany, 2018; pp. 89–92. [Google Scholar]
  22. Yuan, L.; Qu, H.; Li, J. Velostat sensor array for object recognition. IEEE Sens. J. 2021, 22, 1692–1704. [Google Scholar] [CrossRef]
  23. Alinia, P.; Samadani, A.; Milosevic, M.; Ghasemzadeh, H.; Parvaneh, S. Pervasive lying posture tracking. Sensors 2020, 20, 5953. [Google Scholar] [CrossRef] [PubMed]
  24. Adafruit 1361. Botland-Botland Website. Available online: https://botland.com.pl/czujniki-nacisku/5014-membrana-przewodzaca-do-pomiaru-sily-nacisku-adafruit-1361-5903351249782.html?cd=1050025856&ad=50530953494&kd=&gclid=Cj0KCQiAmaibBhCAARIsAKUlaKTcTg59nzf4ZqZtV8HA5U0ZgUJgm2soAl0A9va7cFGrRUrRUdtRC28aAnzFEALw_wcB (accessed on 1 January 2021).
  25. IEC 60601-2-52:2009; Medical Electrical Equipment-Part 2-52: Particular Requirements for the Basic Safety and Essential Performance of Medical Beds. 2009. Available online: https://www.iso.org/obp/ui/en/#iso:std:iec:60601:-2-52:ed-1:v1:en (accessed on 1 January 2022).
  26. Safe Working Load Test on Medical Beds Safe Working Load Test on Medical Beds. Available online: https://www.itcindia.org/safe-working-load-test-on-medical-beds/ (accessed on 30 September 2010).
  27. What Is the Weight Capacity of a Hospital Bed? Available online: https://www.medstrom.com/solution/what-is-the-weight-capacity-of-a-hospital-bed/ (accessed on 30 September 2010).
Figure 2. (a) View of Velostat under an Andostar AD407 microscope (1200 times magnification). Top view of the mat with the visualization of insulation tape, (b) Velostat foil, and copper tape under an Andostar AD407 microscope.
Asi 06 00084 g002
Figure 3. (a) Typical medical bed; (b) matrix Velostat sensor; (c) concept of the schematic electric circuit.
Asi 06 00084 g003
Figure 4. Mat construction.
Asi 06 00084 g004
Figure 5. (a) Laboratory stand consists of the Velostat pressure sensor mat, force gauge, digital multimeter, and power supply; (b) Laboratory stand used for measurements conducted using the Arduino embedded system (board, cables etc.) and laptop compatibility with LabVIEW 2018 SP1.
Asi 06 00084 g005
Figure 7. Resistance in the function of the force applied on the mat for different active cells.
Asi 06 00084 g007
Figure 8. Resistance in function of the weight applied on the mat. By applying some weights to the mat, the resistance changes.
Asi 06 00084 g008
Figure 9. (a) Technical drawing of the terminal tip (set); (b) Terminal set of the force gauge designed in Autodesk Inventor; (c) Realized terminal set of the force gauge.
Asi 06 00084 g009
Figure 10. Resistance in the function of the force applied on the Velostat pressure sensing mat n.2 for different points.
Asi 06 00084 g010
Figure 11. Resistance in the function of the force applied on Velostat pressure sensing mat n.1 for different points.
Asi 06 00084 g011
Figure 13. Neural Network Structure.
Asi 06 00084 g013
Figure 14. Comparison between True and Predicted Target: (a) training data set (b) test data set.
Asi 06 00084 g014
Figure 15. Relative approximation error of prediction distribution: (a) training data set (b) test data set.
Asi 06 00084 g015
Figure 16. ANN results carried out by the Arduino platform and LabVIEW: (a) matrix containing the pressure force of 1.05 N applied on active cells of the mat. (b) Comparison between the true and predicted target of force applied on the mat. (c) the relative approximation error of the prediction distribution of force applied on the mat.
Asi 06 00084 g016
Table 1. Technical details of Velostat.
Technical DetailsAdafruit 1361 Velostat
Membrane dimensions280 mm × 280 mm
Membrane thickness4 mil/0.1 mm
Weightapprox. 18.66 g
Working Temperaturefrom −45 ° C to +65 ° C (−50  ° F to 150  ° F)
Heat sealableYes
Longitudinal resistance<500 Ω /cm
Surface resistivity31,000 Ω /cm 2
Table 2. The safe working load generated by the patient on the individual parts of the medical bed.
Safe Working Load (SWL) [N]Mass
1350patient of 135 kg
200mattress of 20 kg
450accessories of weighing 45 kg
Table 3. Geometrical and technical specifications.
Velostat Pressure Sensing Matn.1n.2
Transparent Plastic [cm]21.5 × 17.516 × 11
Copper Tape Conductive Adhesive [cm]0.5 × 202.5 × 34.5
Number of Copper Tapes148
Insulation Tape Adhesive [cm]0.4 × 170.4 × 30.5
Number of Insulation Tapes159
Velostat Conductive Sheet [cm]17 × 1730.5 × 30.5
Table 4. Weights W i j 1 of the first layer of the neural network.
i/j1264
1−0.23−0.67−0.31
20.030.17−0.04
4−0.370.53−0.33
Table 5. Weights W i j 2 of the second layer of the neural network.
i/j1264
10.12−0.44−0.08
20.361.220.33
640.190.450.2
Table 6. Weights W i j 3 of the third layer of the neural network.
i/j1264
1−1.03−0.330.55
2−0.17−0.39−0.06
64−0.32−0.66−0.13
Disclaimer/Publisher’s Note: The statements, opinions and data contained in all publications are solely those of the individual author(s) and contributor(s) and not of MDPI and/or the editor(s). MDPI and/or the editor(s) disclaim responsibility for any injury to people or property resulting from any ideas, methods, instructions or products referred to in the content.

