Article

Optical, Dielectric and Magnetic Properties of La1−xNdxFeO3 Powders and Ceramics

1
Institute of Low Temperature and Structure Research, PAS, PL-50422 Wroclaw, Poland
2
Nanoceramics Inc., PL-50422 Wroclaw, Poland
3
Scientific and Practical Materials Research Center NAS Belarus, BY-220072 Minsk, Belarus
4
Physics Department and CICECO, Aveiro Institute of Materials, University of Aveiro, PT-3810-193 Aveiro, Portugal
5
School of Natural Sciences and Mathematics, Ural Federal University, 620000 Ekaterinburg, Russia
*
Author to whom correspondence should be addressed.
Ceramics 2019, 2(1), 1-12; https://doi.org/10.3390/ceramics2010001
Submission received: 13 November 2018 / Revised: 13 December 2018 / Accepted: 14 December 2018 / Published: 21 December 2018

Abstract

:
Nanocrystalline La1−xNdxFeO3 powders with different concentrations of Nd3+ have been synthesized using a modified Pechini method. Their structures were studied by X-ray powder diffraction (XRD). Furthermore, La1−xNdxFeO3 nanoceramics were prepared using a high pressure sintering technique. The luminescence spectra of the powders were investigated as a function of concentration of active dopant to check the possible energy transfers observed due to Nd3+ concentration changes. The electrical and magnetic properties of the powders and ceramics were investigated to determine the effect of Nd3+ doping on the dielectric permittivity and magnetization in the wide frequency range.

1. Introduction

The LaFeO3 (LFO) perovskite series have been extensively studied for their interesting physical properties and potential applications in catalysis, solid oxide fuel cells, permeation membranes, ultrasensitive magnetic read heads, gas sensors, interconnecting materials for the solar cells and magnetic memory elements [1,2]. One of the most studied properties of rare-earth (RE) orthoferrites, REFeO3, is their unique magnetic responses, such as spin reorientation, spin canting, ultra-fast spins switching, magneto-optics, and magnetization reversal [3,4,5,6]. Spin reorientation is closely related to excellent coupling between electric and magnetic degrees of order, and this coupling is very important to search for novel magneto-electric multiferrorics [7]. Another interesting property of such perovskites is their use as a proton-conductive material for efficient negative-electrode for Ni-MH batteries [8]. Among the rare-earth perovskite orthoferrites, LFO is a very well-known canted antiferromagnetic insulator with an orthorhombically distorted perovskite structure (containing only trivalent iron and exhibiting a high value of the Néel temperature (TN ~ 740 K)) [9]. Although a number of papers, related to the structural and magnetic properties of LFO, have been reported [10,11], only few present multiferroic behavior in LFO [12].
Substitution of lanthanum ions with other RE elements with smaller ionic radii leads to a shrinkage of the unit cell, accompanied with a modification of the oxygen octahedral rotation and corresponding changes in the length and angles of Fe–O chemical bonds. Notable changes in the structural parameters lead to a modification of magnetic, dielectric, transport and optical properties of the doped compounds. Doping with neodymium ions, which have a small difference in the ionic radii with lanthanum ions, allows the control of structural parameters and manipulation of physical properties of the LaFeO3–based compounds.
Application potential of REFeO3 compounds depends strongly on their electric, magnetic and optical properties. Therefore, it is important to study the influence of different parameters of the materials’ characteristics. For example, nanoparticles may show unusual magnetic properties due to the finite-size effects, surface anisotropy effects, interface effects or shape anisotropy effect [13]. Therefore, it is also interesting to study ceramics composed of nanograins. Here, we discuss the properties of LaFeO3 nanocrystals and nanoceramics varied with Nd3+ ions doping.

2. Materials and Methods

Nanocrystalline La1-xNdxFeO3 powders with different concentrations of Nd3+ (x = 0 ÷ 0.1) have been synthesized using a modified Pechini method [14]. The material was prepared by dissolving the stoichiometric amount of La2O3 (Sigma-Aldrich, St. Louis, MO, USA, 99.9%) and Nd2O3 (Sigma Aldrich, 99.9%) in HNO3 (POCH, Gliwice, Poland, 65% analytical grade) to obtain rare-earth (RE) nitrates. To eliminate nitric acid, nitrates were dissolved in the deionized water and evaporated three times. The RE nitrates, Fe(NO3)3•9H2O (Sigma Aldrich, 99.95%), citric acid (CA) (Sigma Aldrich, 99%) and ethylene glycol (Sigma Aldrich, 99.8%) were dissolved in deionized water. The stoichiometric molar ratio of metal ions to CA was 1:5. The mixtures were continuously stirred for 1 h and then transferred to a dryer. The temperature was kept at 80 °C. After one week, the solution formed brown resin that was transferred to the crucibles and fired at 850 °C in a furnace for 8 h. The powder products were ground in the agate mortar and taken to the analysis and ceramic sintering process. The details of the ceramic sintering process based on the high pressure technique is reported elsewhere [15]. Briefly, LaFeO3 and La1-xNdxFeO3 powders were formed in pellets under the pressure of 0.1 GPa at room temperature. The pellets were placed in a special-shaped container with a resistance heater and separated by boron nitride layers. The force exerted by the anvils produced quasi-isostatic pressure of 8 GPa and the ceramic was sintered at 500 °C.
Structural studies were performed by powder X-ray diffraction (XRD) using a PANalytical X’Pert diffractometer (Malvern Panalytical, Almelo, The Netherlands) with Ni-filtered Cu Kα radiation, λ = 0.15418 nm. Atomic force microscopy (AFM) methods were used to inspect grain structure of ceramics and their compositional homogeneity. AFM was done using commercial scanning probe microscope Ntegra Aura (NT-MDT Spectral Instruments, Moscow, Russia) by Budget Sensors ElectriTap300-G tips with the curvature less 25 nm, resonance frequency about 300 kHz and 20 N/m force constant. In order to clarify chemical homogeneity at the local scale, we used Kelvin probe force microscopy (KPFM) allowing direct inspection of the work function distribution across the surface with high spatial resolution [16]. The possible secondary phases would result in an apparent variation of electronic structure and work function. KFPM was done using conventional two-pass approach with 2 V ac voltage applied to the tip and a 50 nm lift distance.
Optical properties of the powders doped with Nd3+ ions were studied with a Renishaw Microscope (Wotton-under-Edge, UK) equipped with a CCD camera (0.1 nm resolution), 2400 line/mm gratings and argon laser as an excitation source (λexc: 514 nm, 100 mW). Electric impedance was measured using an Alpha analyzer (Novocontrol GmbH, Montabaur, Germany) with active sample cell operating in a frequency range 10−2–106 Hz at room temperature with an ac voltage amplitude of 0.1 V. The measured sample was supplied with gold electrodes. Isothermal magnetization measurements were performed in magnetic fields up to ±14 Т at 5 and 300 K using Physical Properties Measurement Systems from Cryogenic Ltd. (London, UK).

3. Results

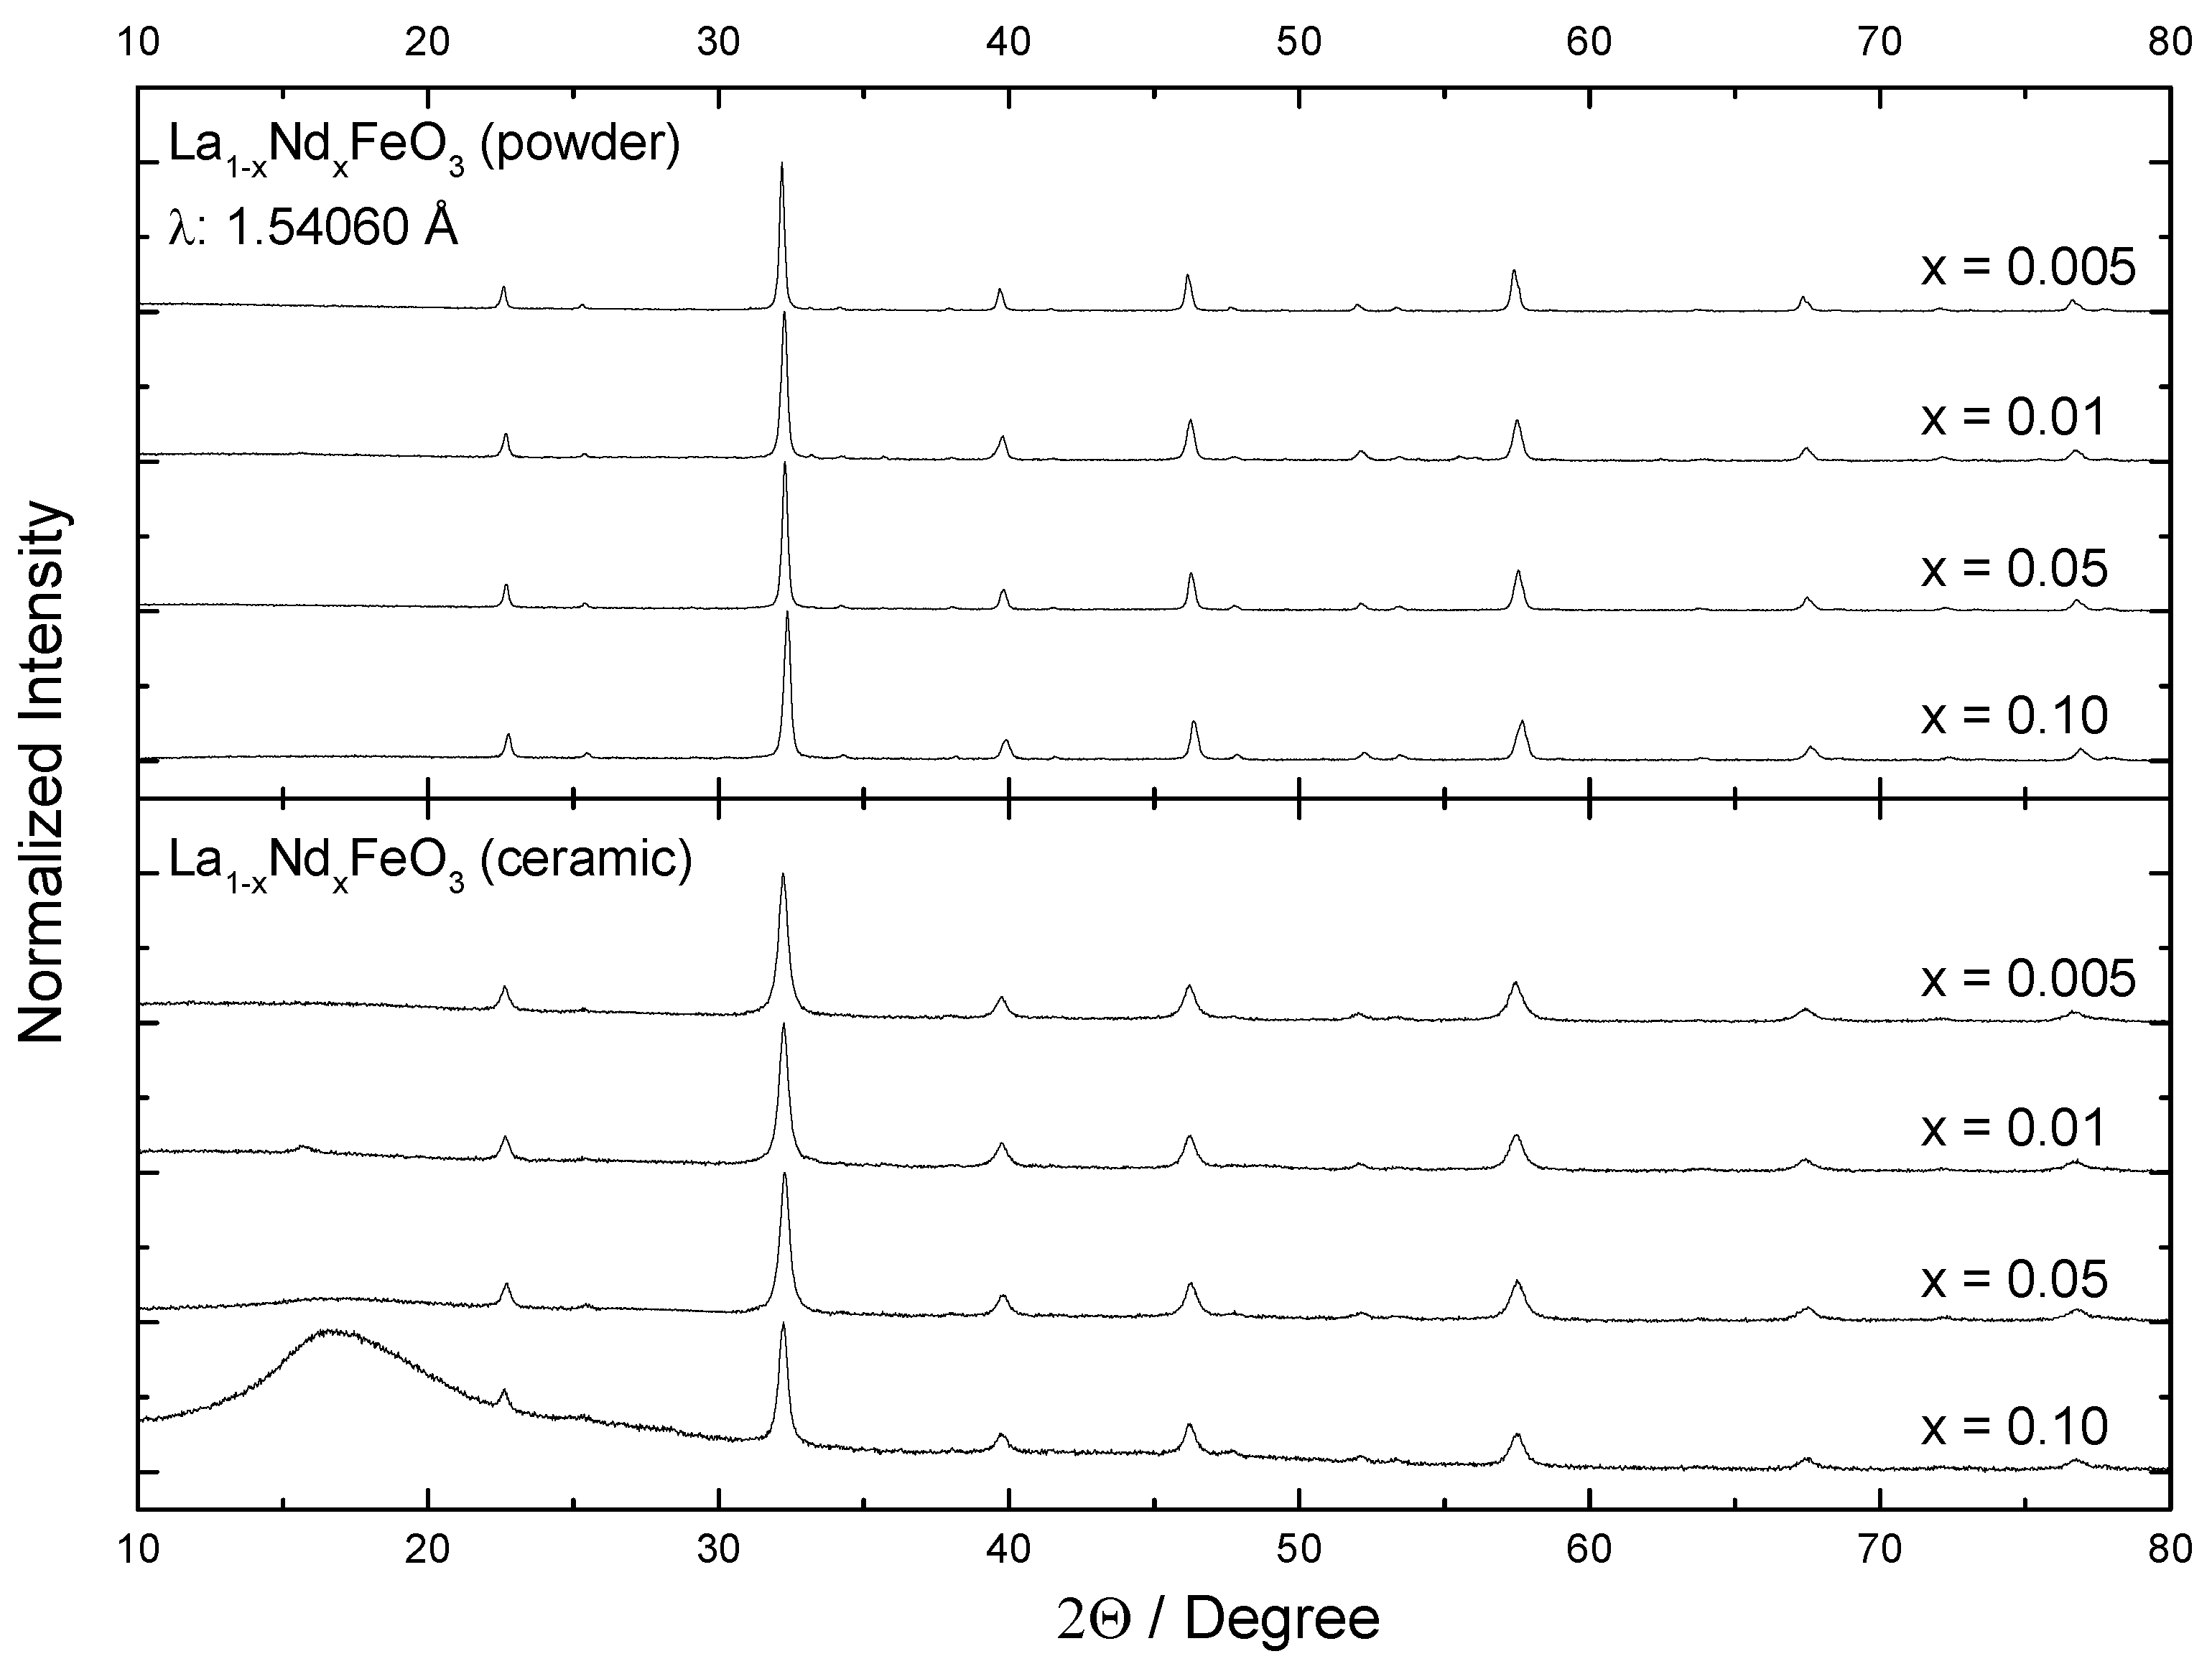
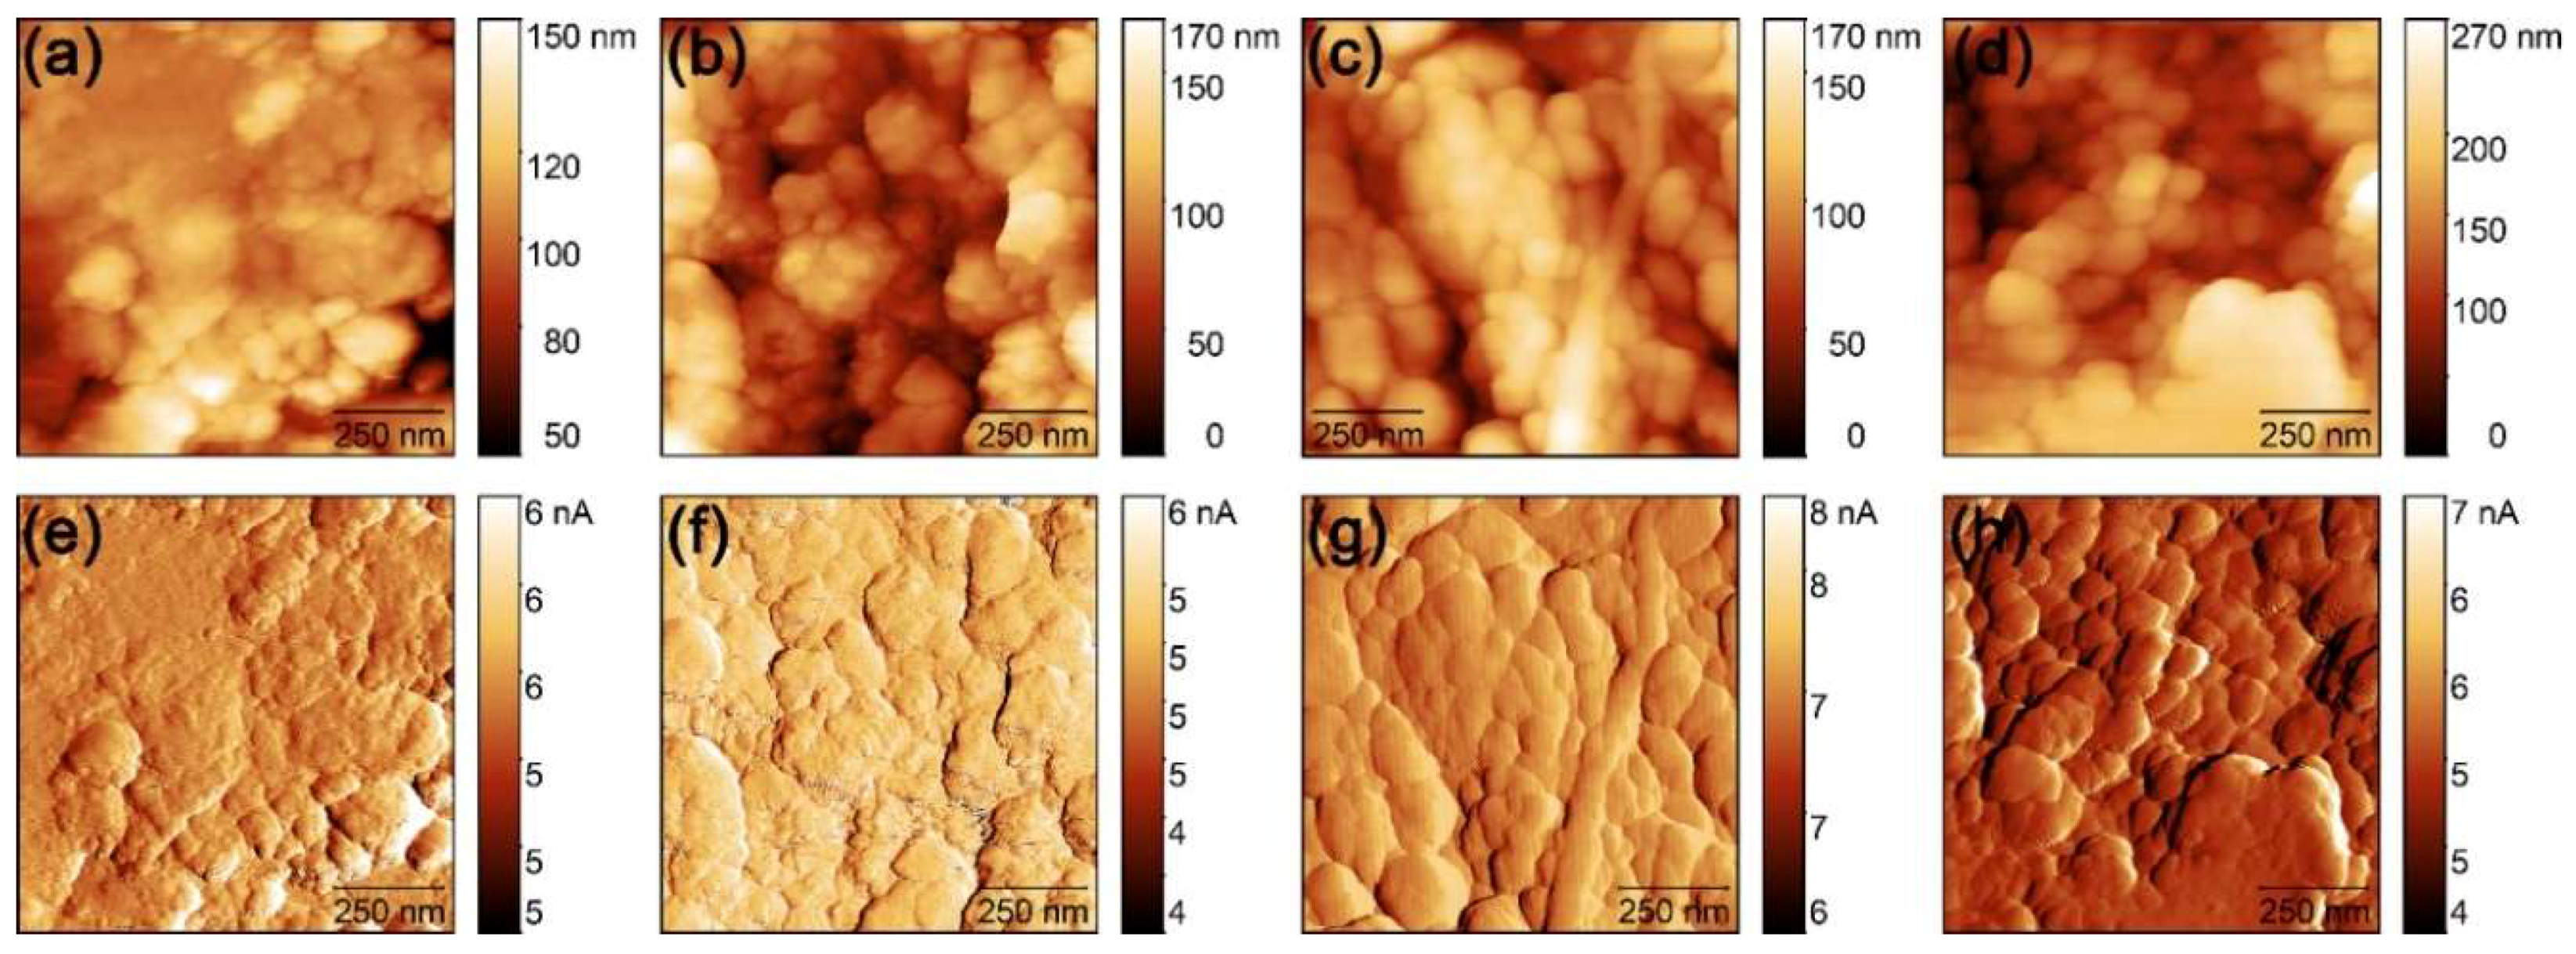
3.1. Structure and Morphology

LaFeO3 is an orthorhombically distorted perovskite structure with space group Pbnm [17]. Powder X-ray diffraction (XRD) patterns of all powders were consistent with the orthorhombic structure of LaFeO3 in the standard from JCPDS 88-0641 (Figure 1). The average crystallite sizes and cells parameters of all samples were calculated from X-ray line broadening of the peaks using Rietveld Refinement in X’Pert HighScore Plus software and are presented in Table 1. All samples had crystallites below 100 nm and microstrains of about 0.02%. With increasing Nd content, we observed shortening of the b and c axes in the crystallites. This suggests that the distances between the ions located along [010] and [001] directions decreases. It can be also seen that parameter a increased with increasing concentration of Nd3+. Only for a sample with a 1% Nd the parameter deviated from the trend. This may be related to the wide distribution of grains for this powder, as well as the appearance of additional strains in nanocrystallites. It can be seen that the maximal difference in a-parameter for x = 0.01 with another powder sample (x = 0.005) is still quite small (~0.13%) and it can be also caused by certain uncertainties in the XRD calculations. It is interesting that after applying pressure during sintering, the peaks are broadened due to decrease of grain size and microstrains are increased. The broad band observed about 18 degrees for La0.9Nd0.1FeO3 ceramic, which is related to the amorphous phase of the nanocrystal located on the surface of the grains. This behavior was observed also in other ceramics prepared from nanocrystals and it is related to the decomposition of the surface of nanocrystals and increase of the strains on the grain boundaries [18].
Nanosizes of the grains in the ceramics were confirmed using AFM images (Figure 2). The average grain size in ceramics was about 20–30 nm and it gradually increased with Nd3+ doping. Most of the compositions had quite dense structure without significant amount of pores. KPFM analysis showed high quality homogeneity of all compositions (see Supplementary Materials, Figure S1). The only variation of contact potential difference was found at the grain boundaries, which can be attributed to typical artifacts of KPFM measurements [16]. Measured contact potential difference values increased slightly with doping, due to apparent variation of the electronic structure of the material with composition.

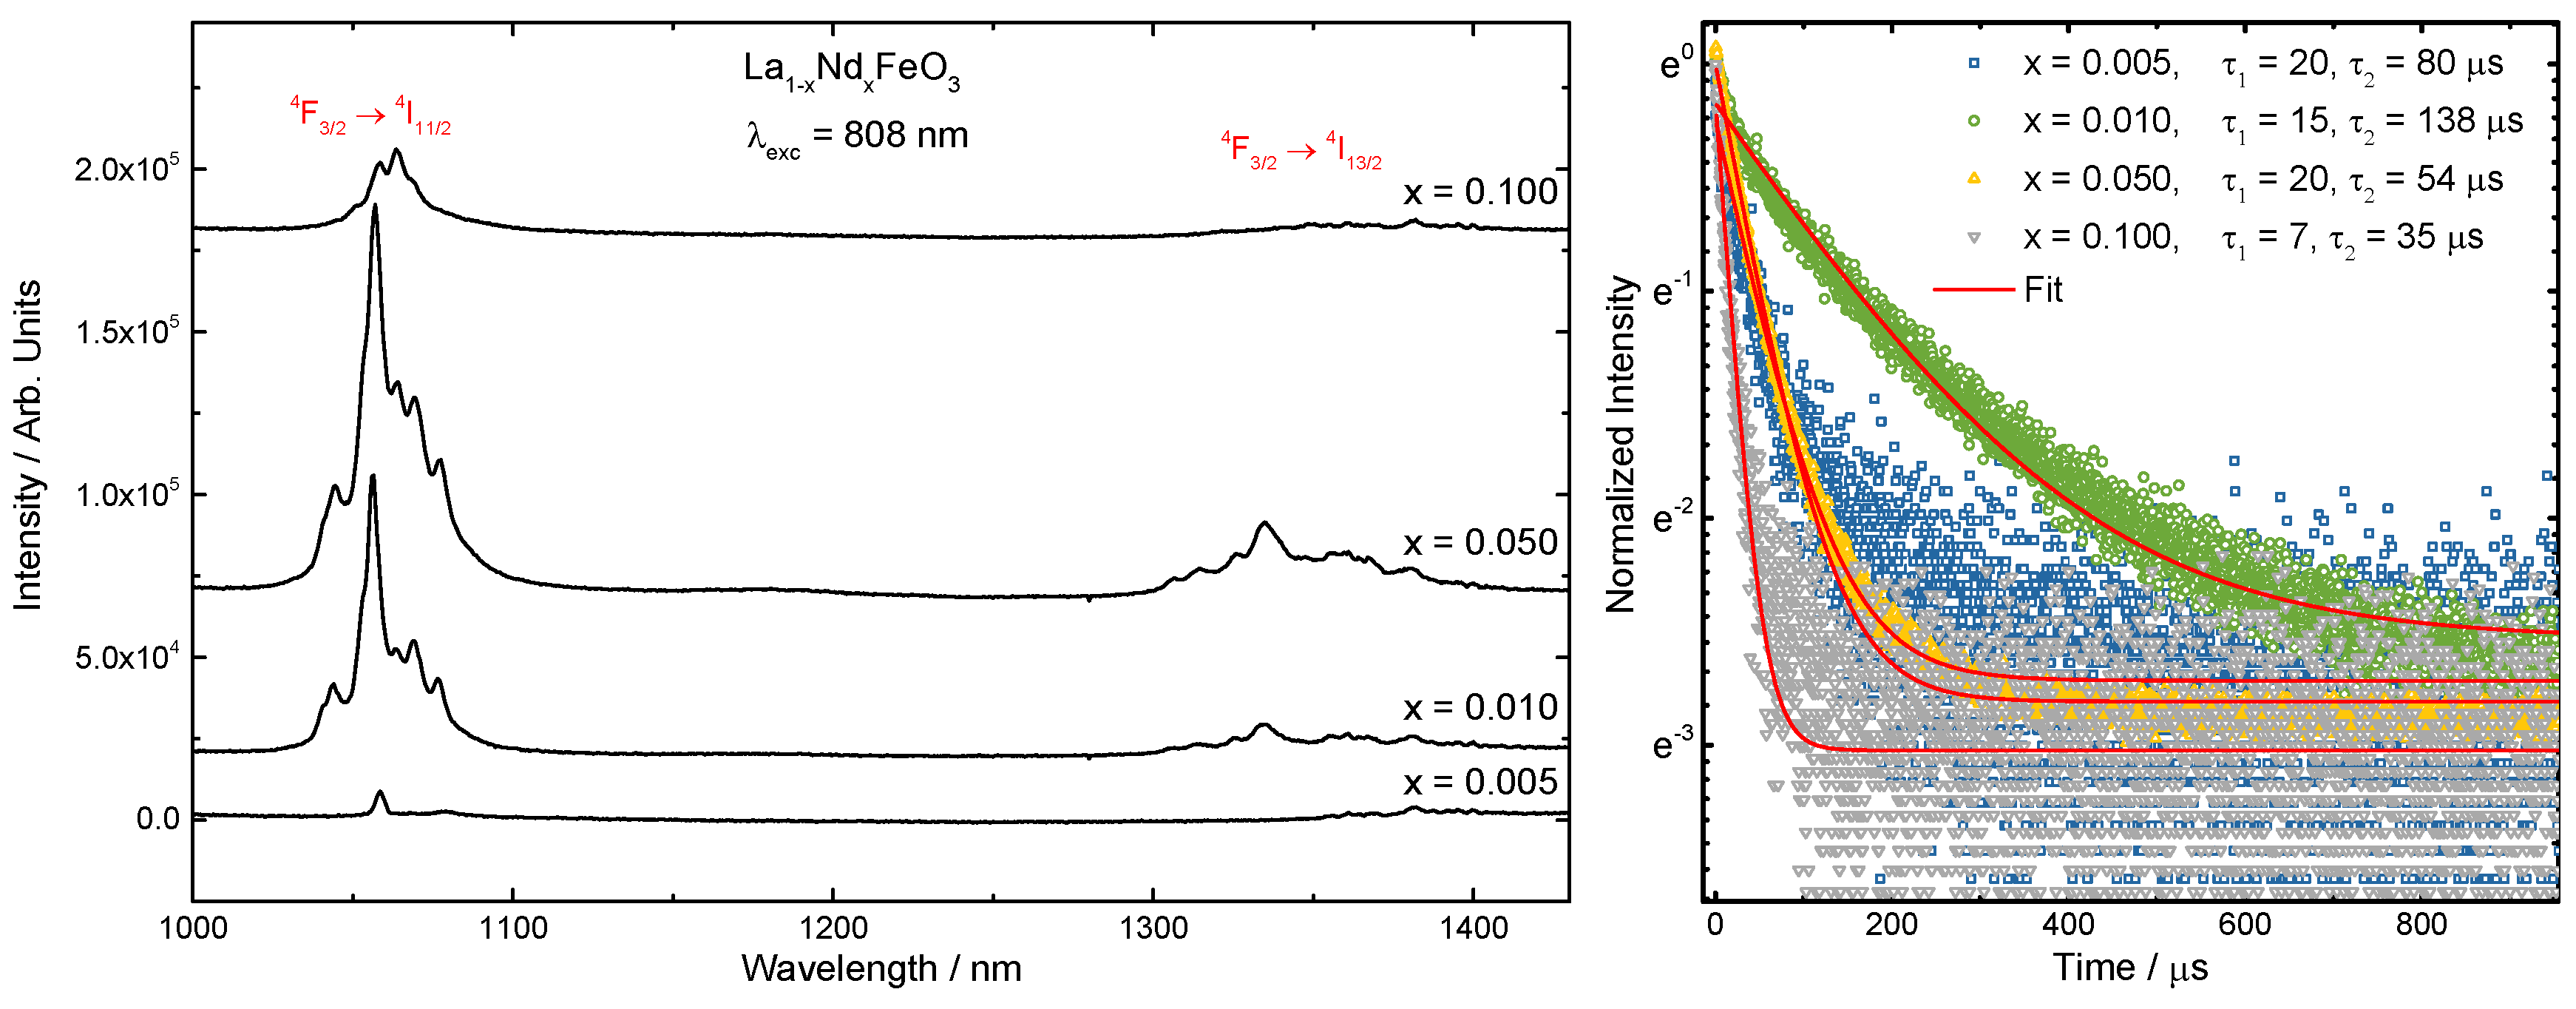
3.2. Optical Properties

The Nd3+ concentration dependence of photoluminescence of La1−xNdxFeO3 nanocrystals was measured at room temperature (Figure 3). The observed luminescence bands at 1057 and 1335 nm were assigned to the 4F3/24I11/2 and 4F3/24I13/2 transitions of Nd3+, respectively. Figure 3 shows the effects of Nd3+ ions concentration on luminescence spectra and suggests that concentration quenching effects took place when doped with 10 mol% of Nd3+ ions. Low emission intensity and unexpected shorter decay time of the La0.995Nd0.005FeO3 nanocrystals is related to low concentration of the Nd ions and high absorption of the material (i.e., dark brown color). The concentration quenching is related to the different distances between donors and acceptors and smaller separation between pairs. For Nd3+ ion–ion energy transfer is generally described on the basis of dipole–dipole interactions. The processes involved in cross-relaxation are 4F3/2,4I9/24I15/2,4I15/2, and/or 4F3/2,4I9/24I13/2,4I15/2; and in energy migration, 4F3/2,4I9/24I9/2,4F3/2. Additional process that lead to the quenching of the luminescence is the thermalization effect that is strengthened by the small size of the grains (due to inefficient removal of heat) and result in enhancement of local temperature in individual grains. The concentration quenching have been confirmed by measurement of kinetics of Nd3+ emission. The decay time of emission from 4F3/2 level decreases significantly when dopant concentration is higher than 1 mol%. Two components of the decay time result from the fact that nanoparticles are considered as core-shell structure (crystalline core and amorphous or heavily deformed shell). Due to the high impact of surface effects (e.g., adsorption of OH group), the emission decay from ions located in the shell is shorter than it is recorded for volume ions [19]. For the ceramics, photoluminescence measurements were impossible to be performed due to the black color of the ceramics after sintering and total absorption of the visible excitation light.

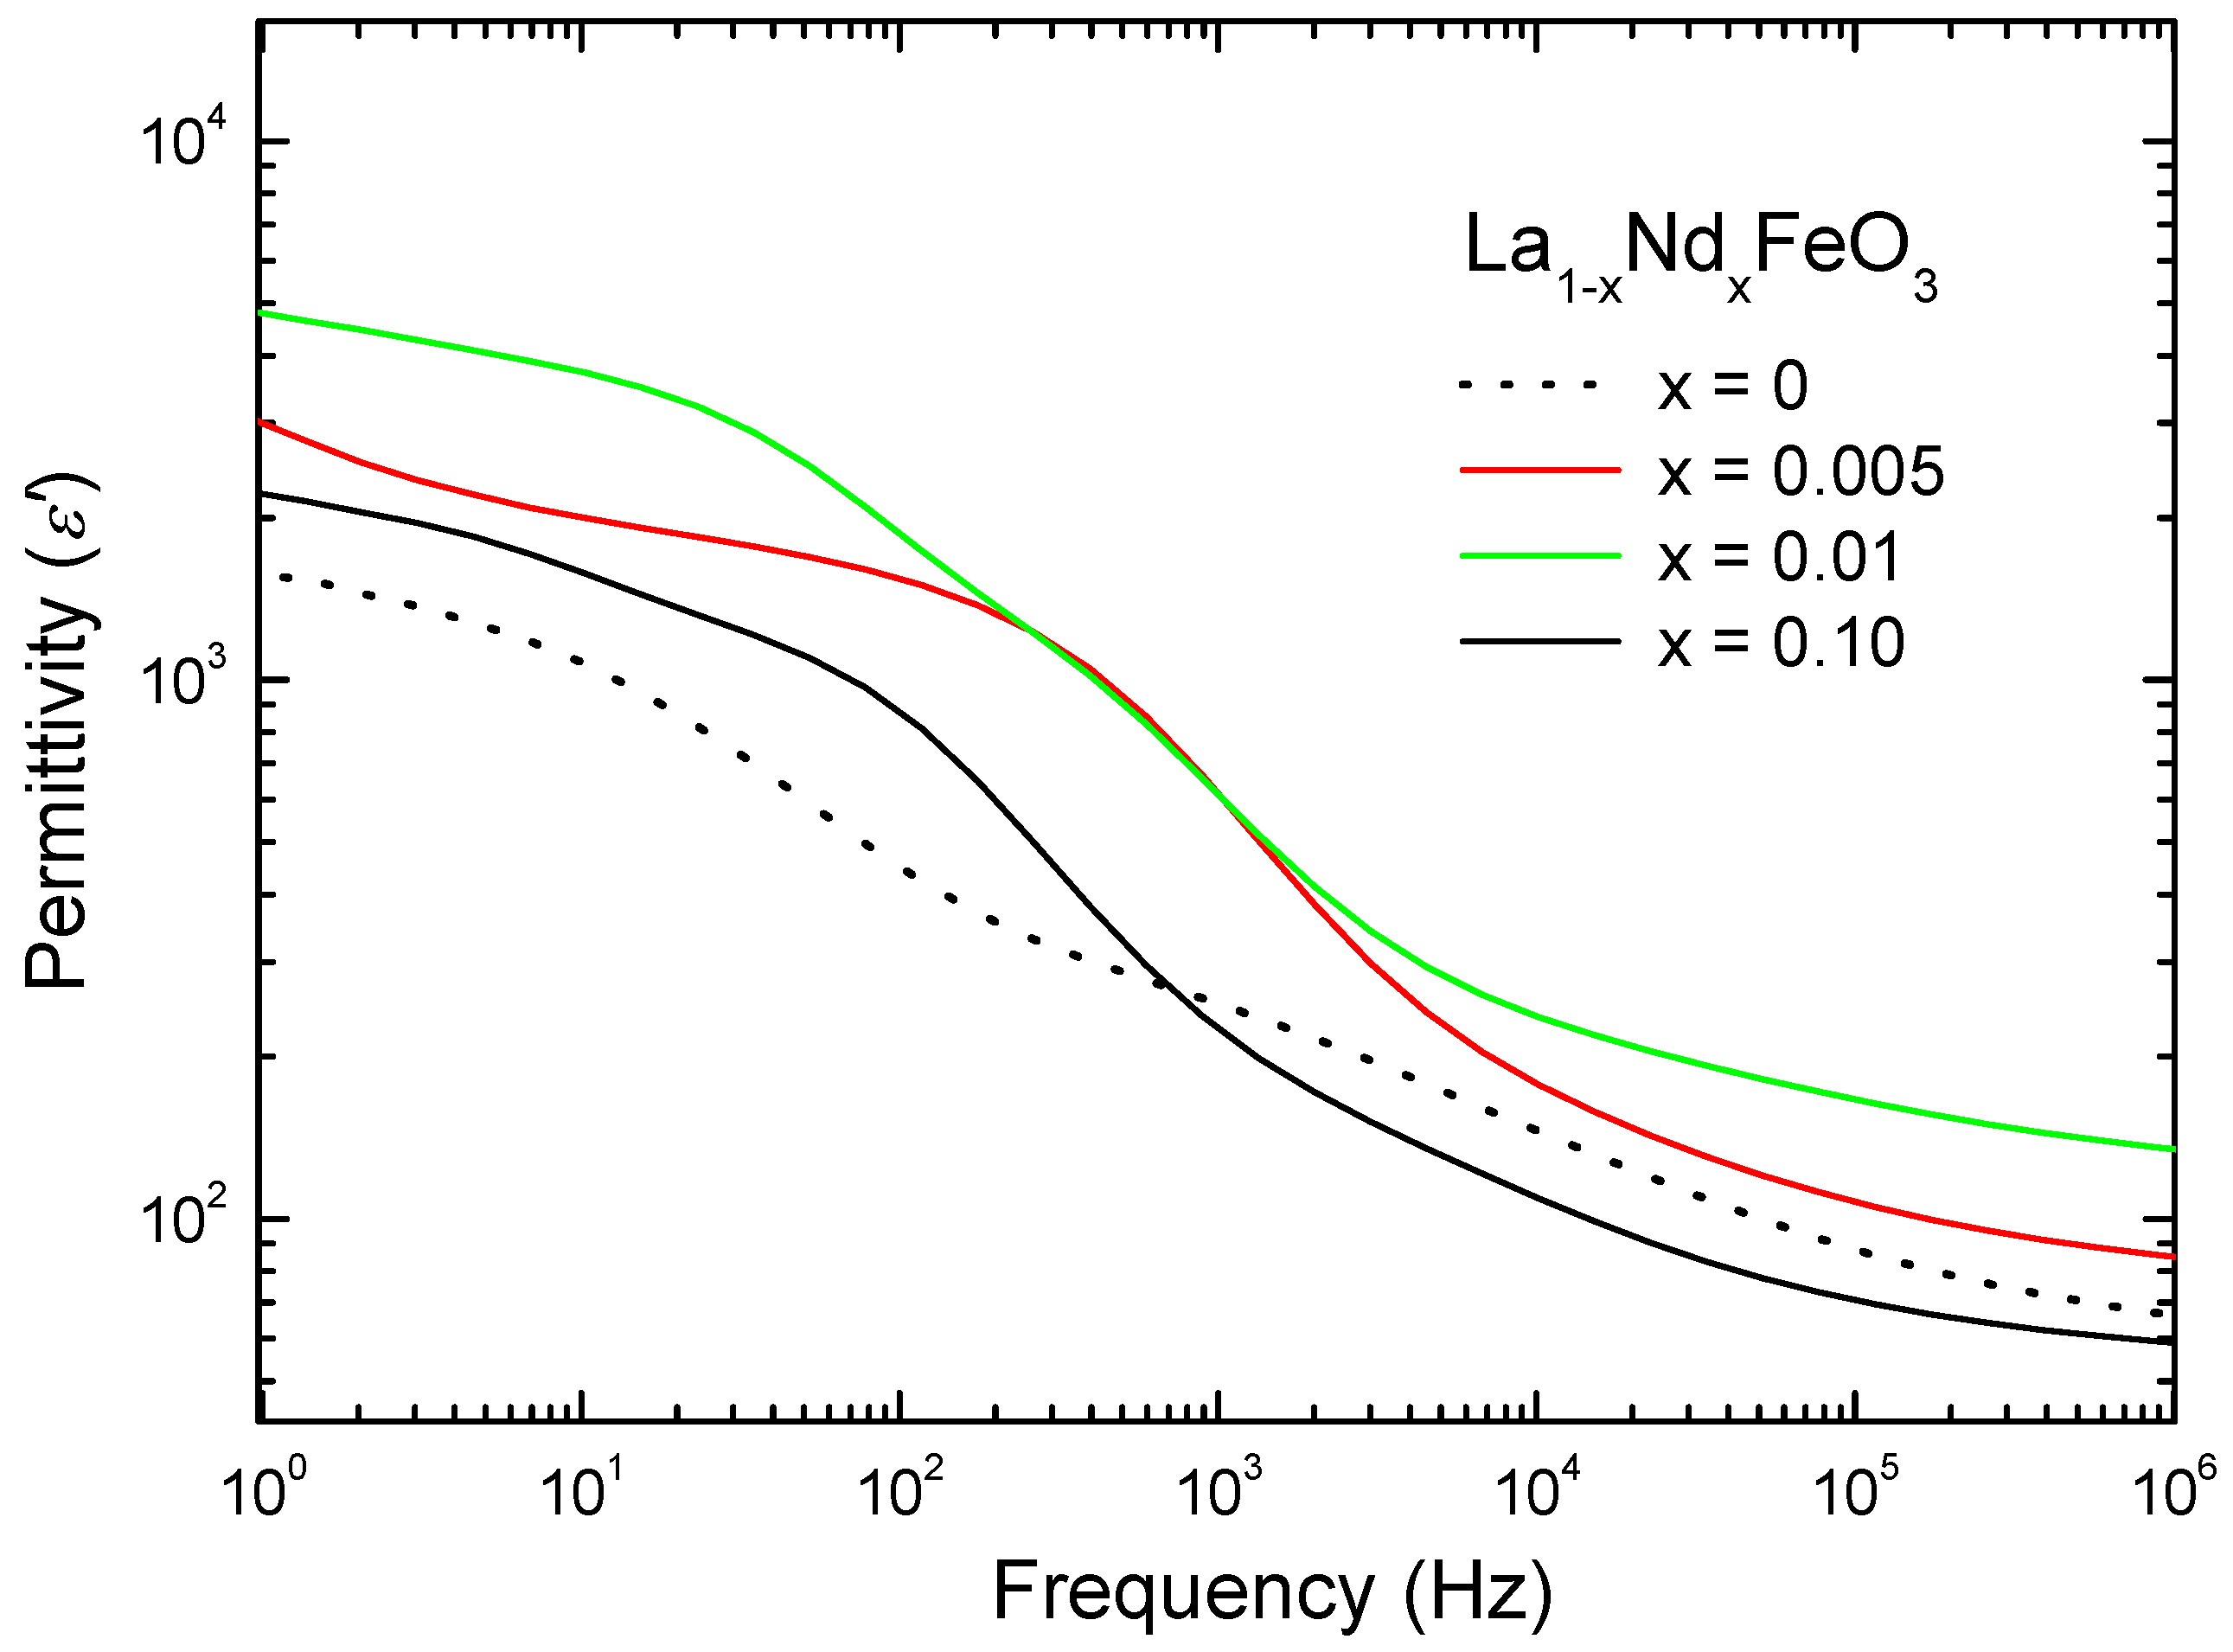
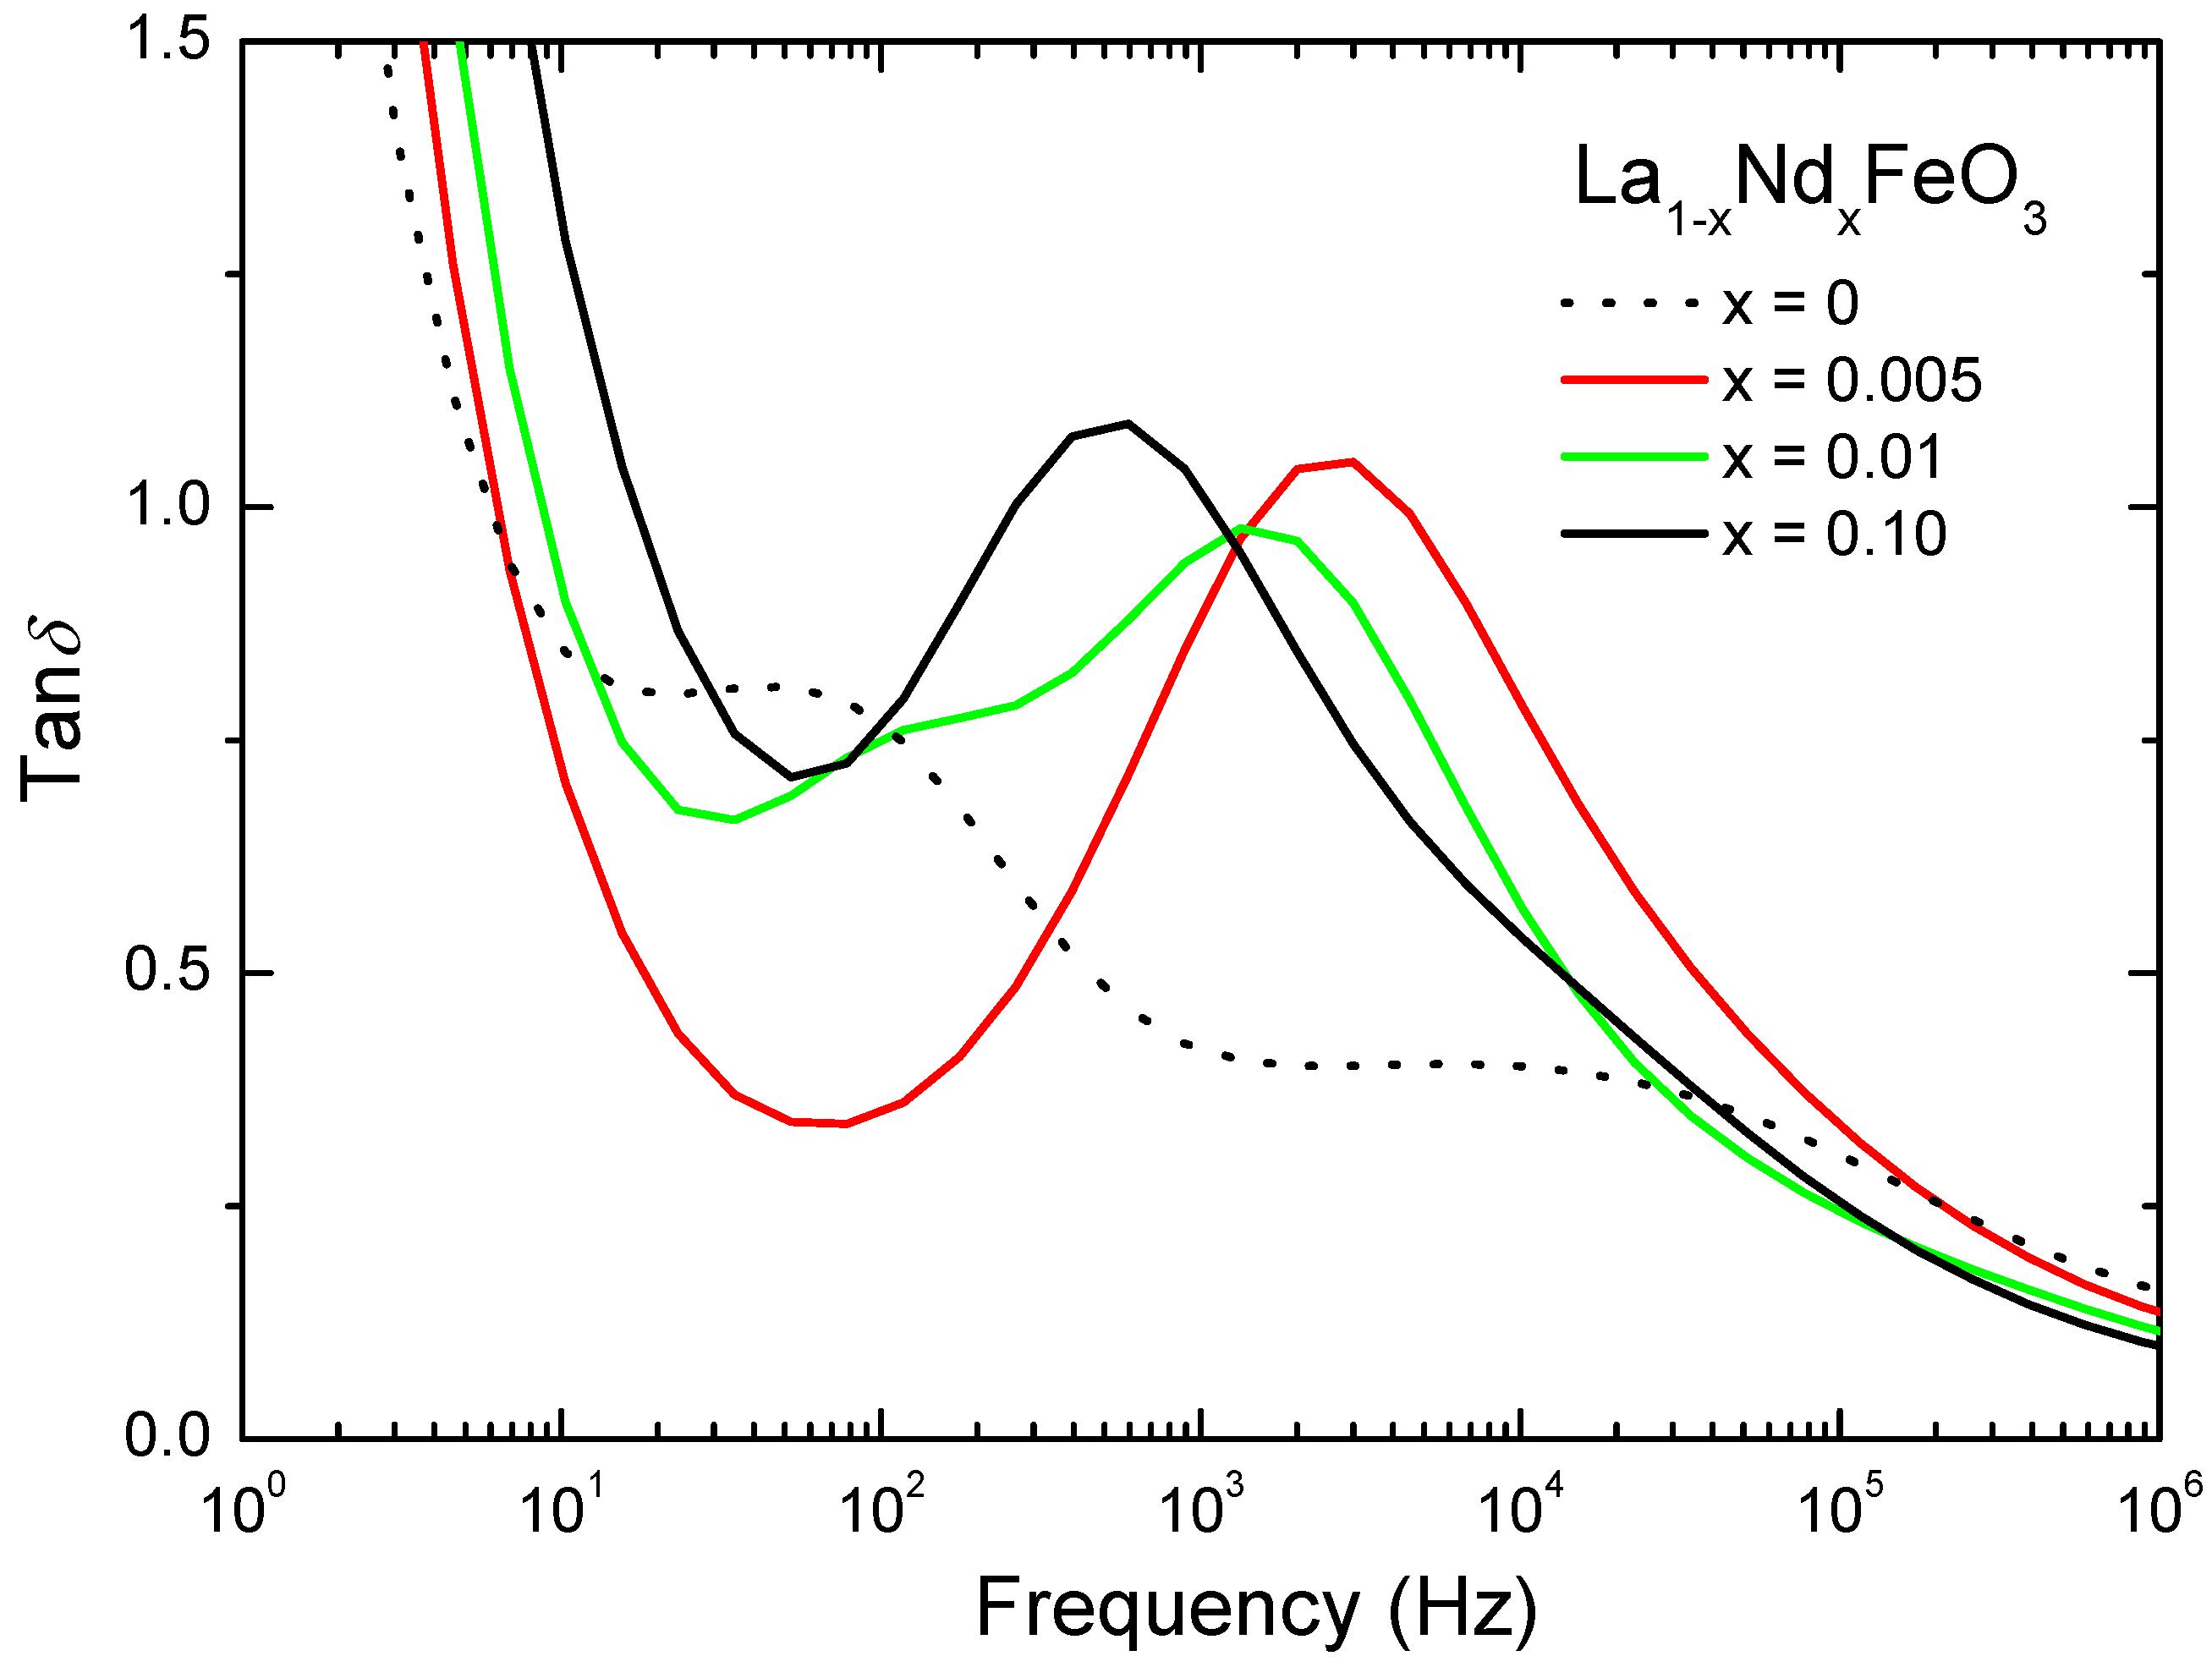
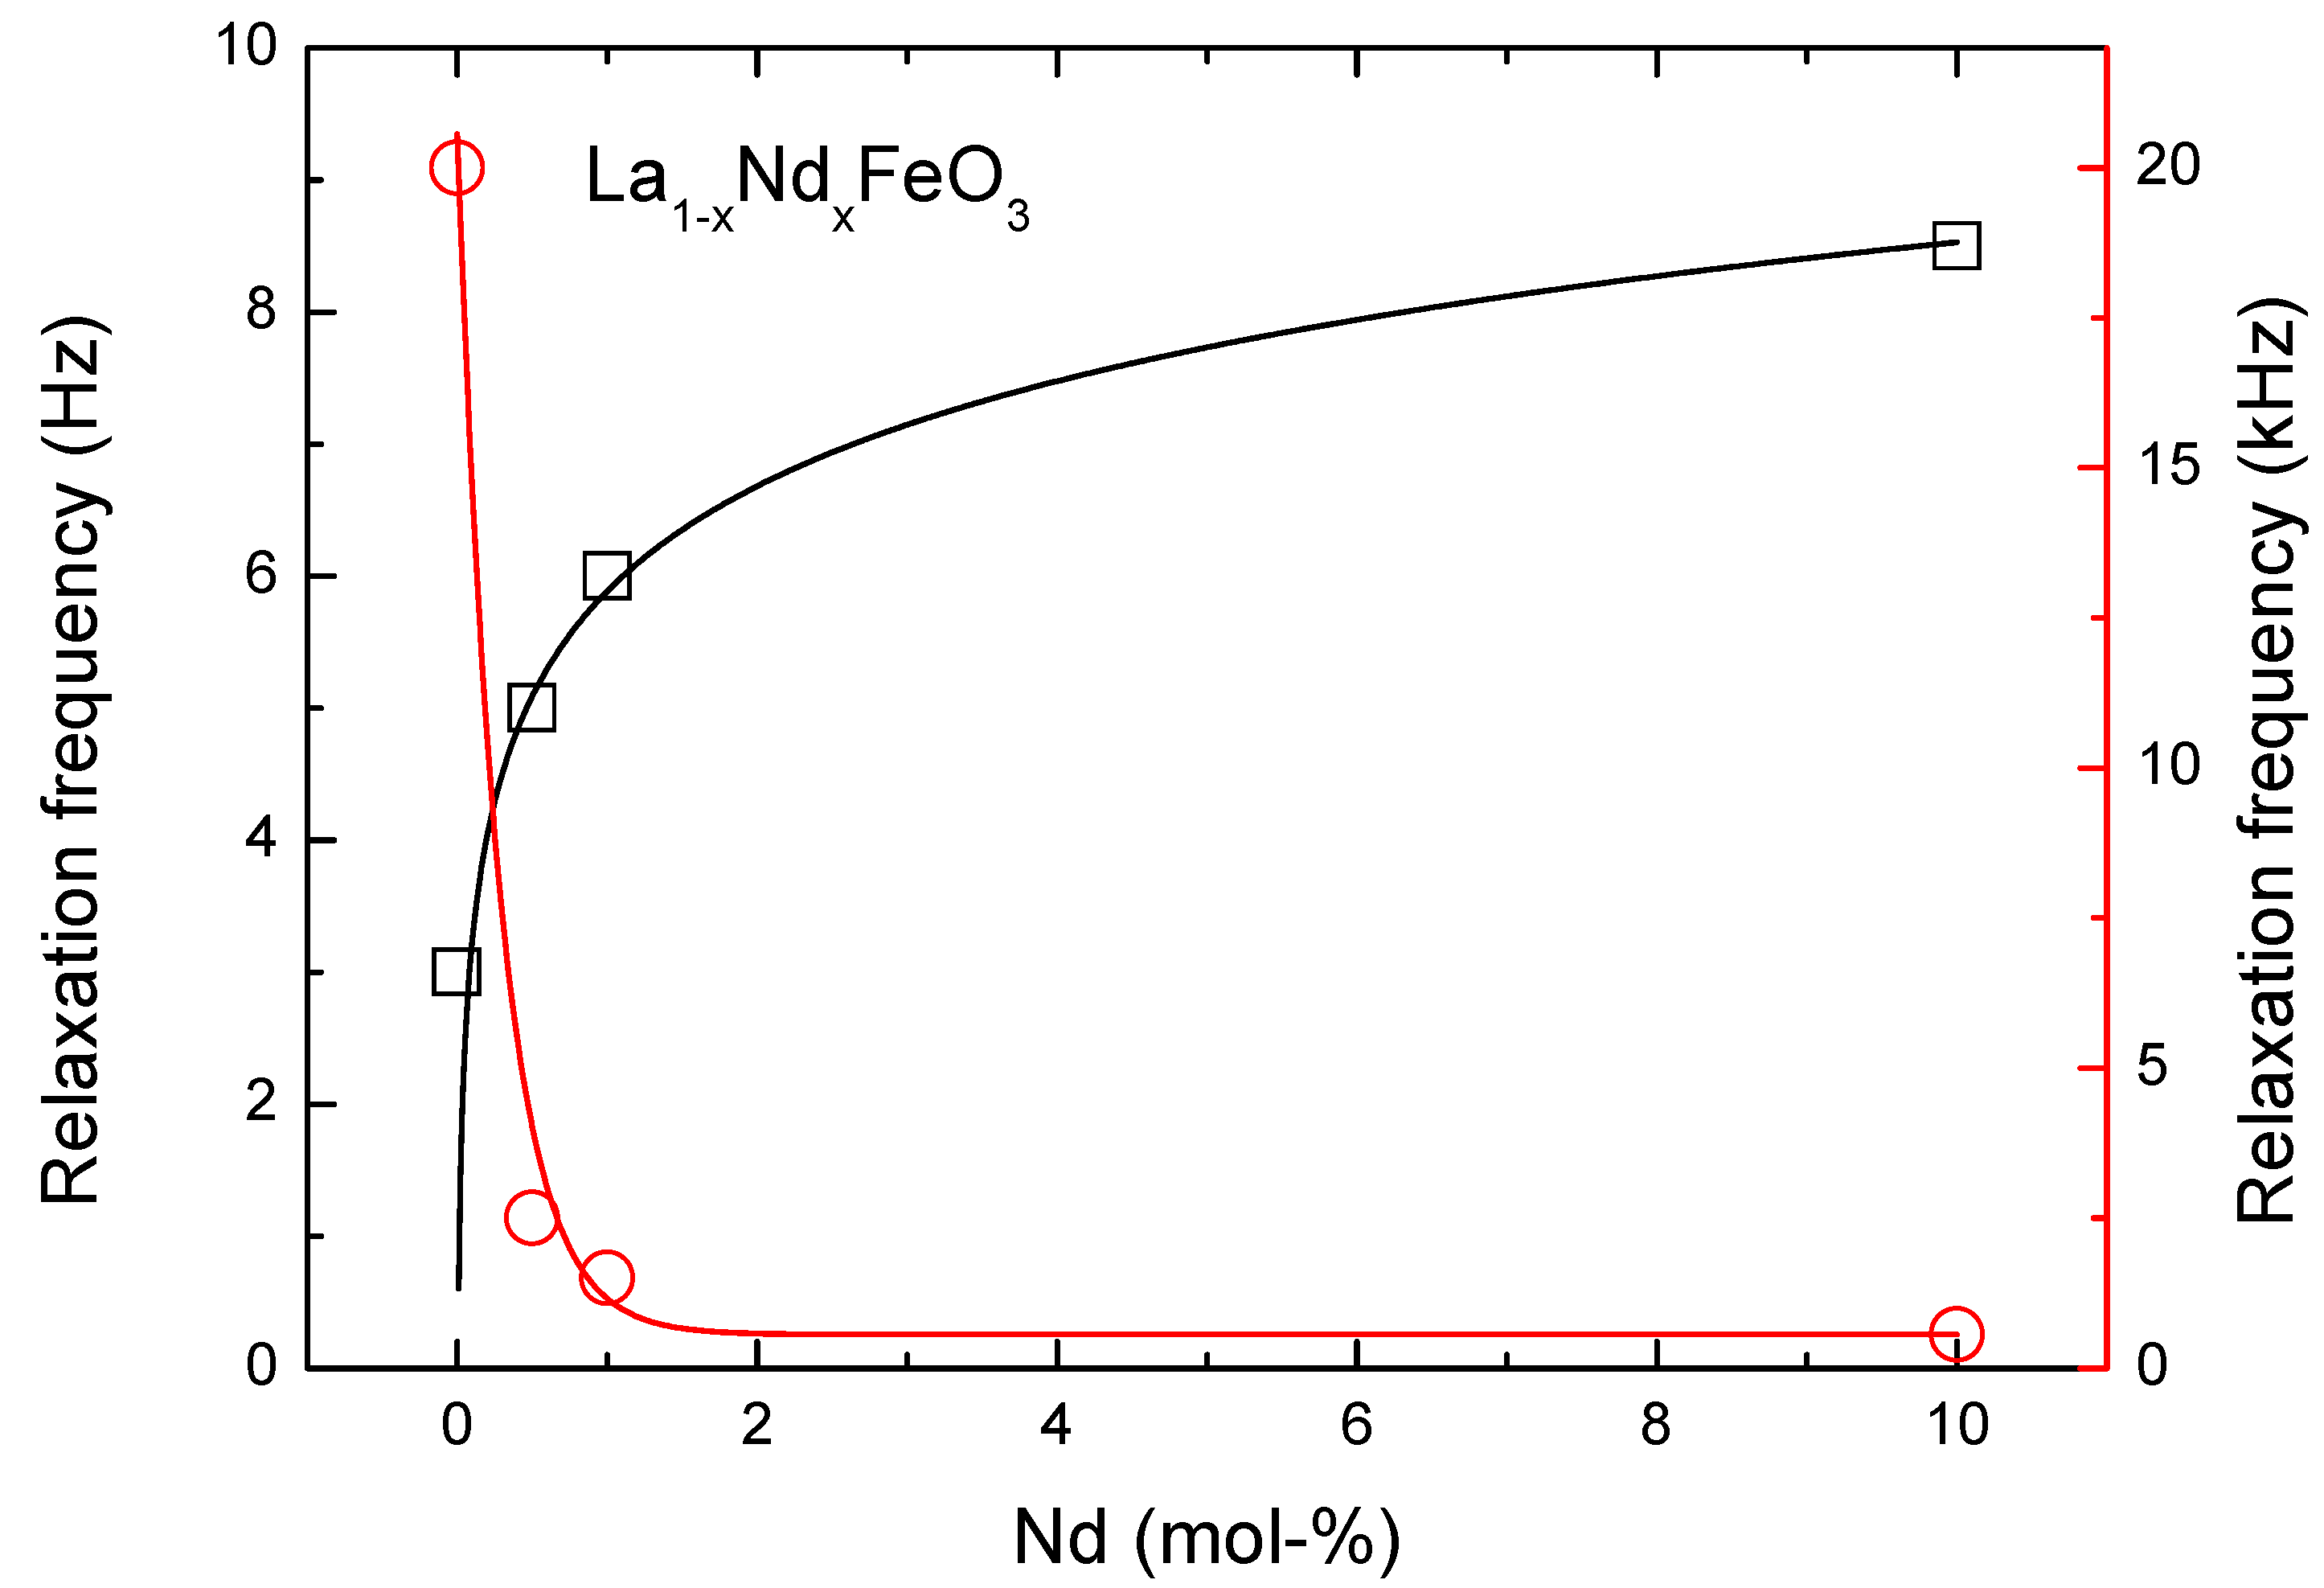
3.3. Electric Properties

The electrical properties were measured for ceramic samples. Frequency dependencies of the real part of permittivity as a function of Nd3+ doping level of the La1−xNdxFeO3 nanoceramics were measured and are shown in Figure 4. The dotted line corresponds to the undoped sample.
All the samples revealed similar type of dependencies, characterized by high values of the dielectric permittivity. Generally, the values of permittivity increased with doping, as it can be clearly seen for the samples doped from 0 to 1% of Nd. However, the values of sample doped by 10% of Nd are lower than those doped by 0.5% and 1%. Furthermore, permittivity of 10% doped sample is lower than for undoped sample at high frequencies. One of the reasons of such behavior can be the influence of Nd incorporation on the charge transfer. Small amount of Nd can only increase permittivity by introduction of localized charge carriers. However, at high concentration of Nd, the charge carriers became partially delocalized, thus contributing to the screening of applied electric field especially at low frequencies.
The frequency dependence of conductivity allows determination of the direct influence of charge carriers doping on the charge transport properties of the nanoceramics (Figure 5).
The character of dependencies is similar for all the samples, suggesting ion conductivity contribution as conductivity increases with frequency in the whole range. This type of conductivity can be described by Equation (1) [20,21]:
σ’(ω) = σ0 + Aωn,
where ω is the angular frequency (ω = 2πf, f is the frequency of the applied electric field), σ0 is the dc conductivity, A is a constant, and 0 < n < 1. dc conductivity can be estimated from the plateaus at low frequencies. As it can be seen, the values of dc conductivity increase with doping logarithmically (see inset in Figure 5). This is a result of doping by charge carriers. It is worth noting that doping by 10% of Nd3+ changes the values of conductivity by order of magnitude.
The simple way to explore the relaxation processes is through the data representation in the Cole–Cole plot (Figure 6).
It is clear that all the samples show relaxation depending on Nd content at low frequencies. The relaxation frequency increases with amount of Nd. There are also relaxations at high frequencies, but it is difficult to observe them in presented plots. In order to determine relaxation processes at high frequencies, the dependencies of loss tangent were analyzed (Figure 7).
Depending on the doping level, relaxations appear in the wide frequency range. One can see that the frequency of the loss peak systematically decreases with doping. It should be noted that undoped sample revealed two relaxation peaks at 60 Hz and 20 kHz. Similar behavior was observed for 80 nm LaFeO3 sample [22]. In this frequency range, the loss peaks could be explained by the dipole relaxations.
A summary of the influence of Nd doping on the relaxation processes and relaxation frequency as a function of Nd concentration is shown in Figure 8.
As mentioned above, doping with Nd shifts relaxation frequency to higher frequencies for low frequency relaxations. However, the increase of relaxation frequency is not linear in this case. Results of low frequency relaxations can be fitted by the relation (Equation (2)):
f0 = 5.88 + 1.15 ln(n),
where f0 is the relaxation frequency; and n is the Nd mol% concentration. As it can be seen, weak doping has stronger effect than the high doping.
High frequency relaxation processes have completely opposite character compared to the low frequency ones; increasing of Nd content decreases the relaxation frequency (see red line in Figure 8). The values of relaxation frequencies can be fitted by asymptotic exponential dependency (Equation (3)):
f0 = 560 + 20,000*0.03n,
Taking into account that low frequency relaxation is mostly determined by the interfacial and space charge behavior, whereas high frequency relaxations are results of the dipole interactions, one can conclude: the Nd doping has an effect on both relaxations and electrical properties of the nanoceramics that can be adjusted by chemical composition via Equations (1) and (2).

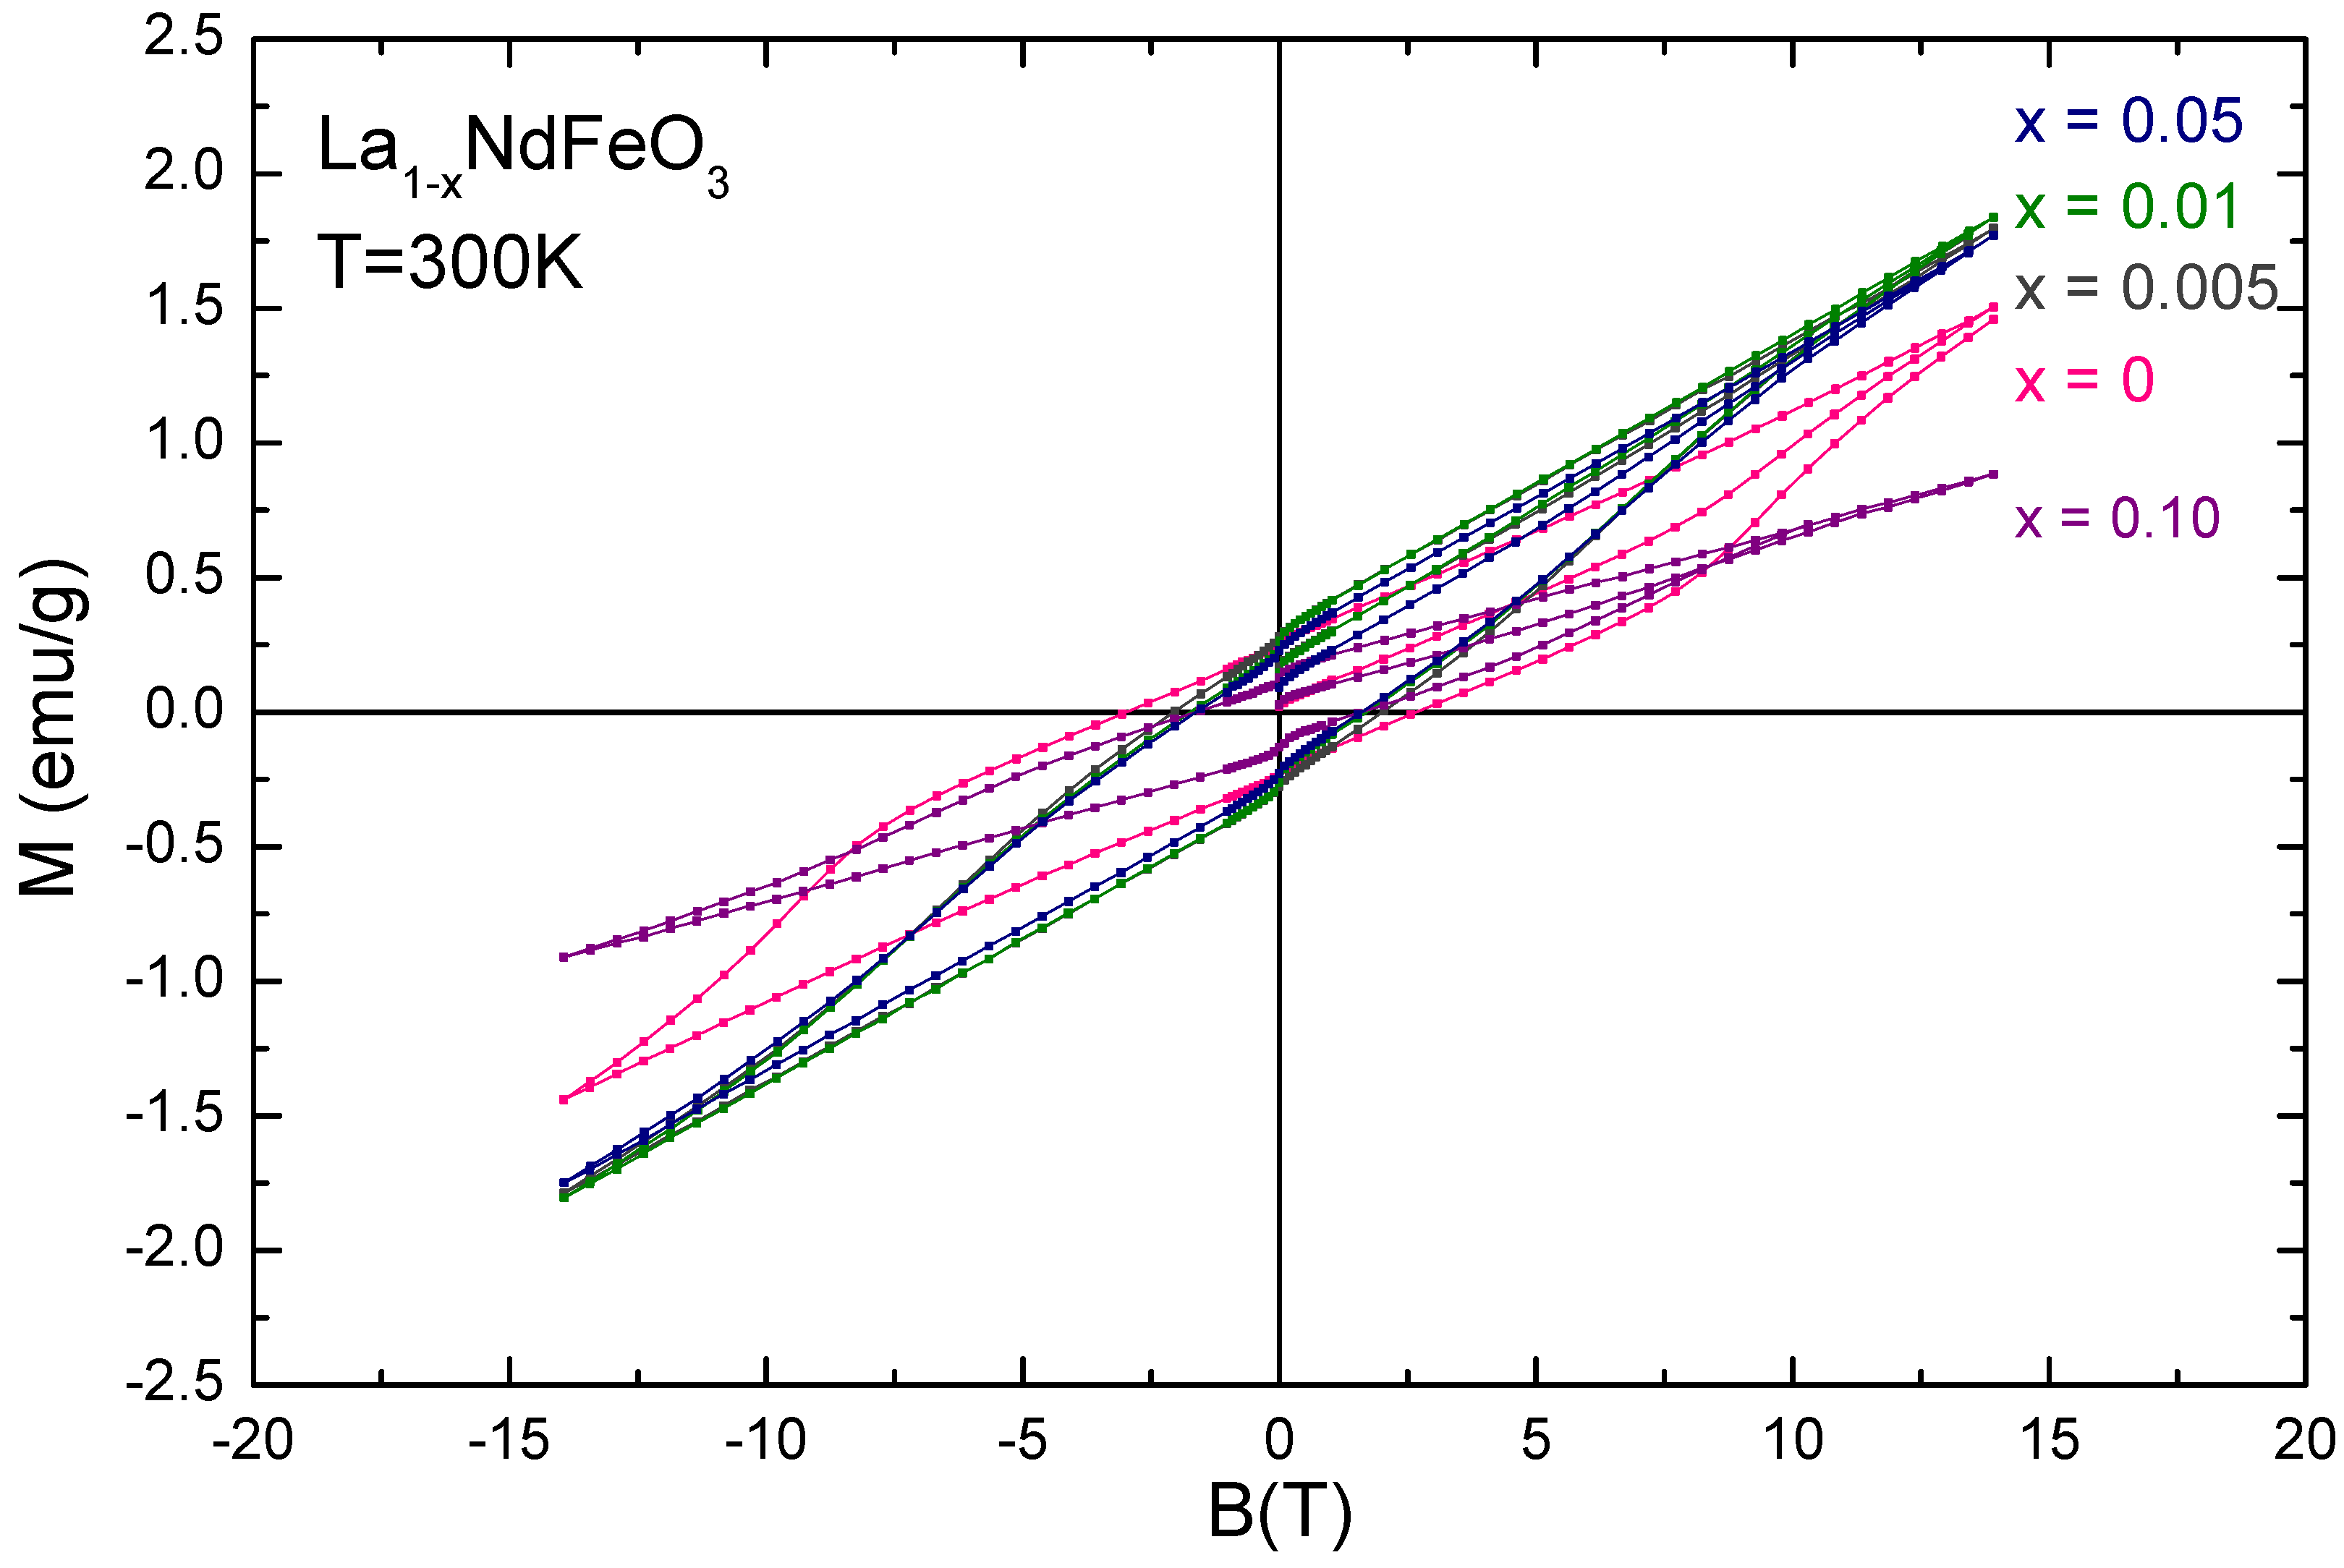
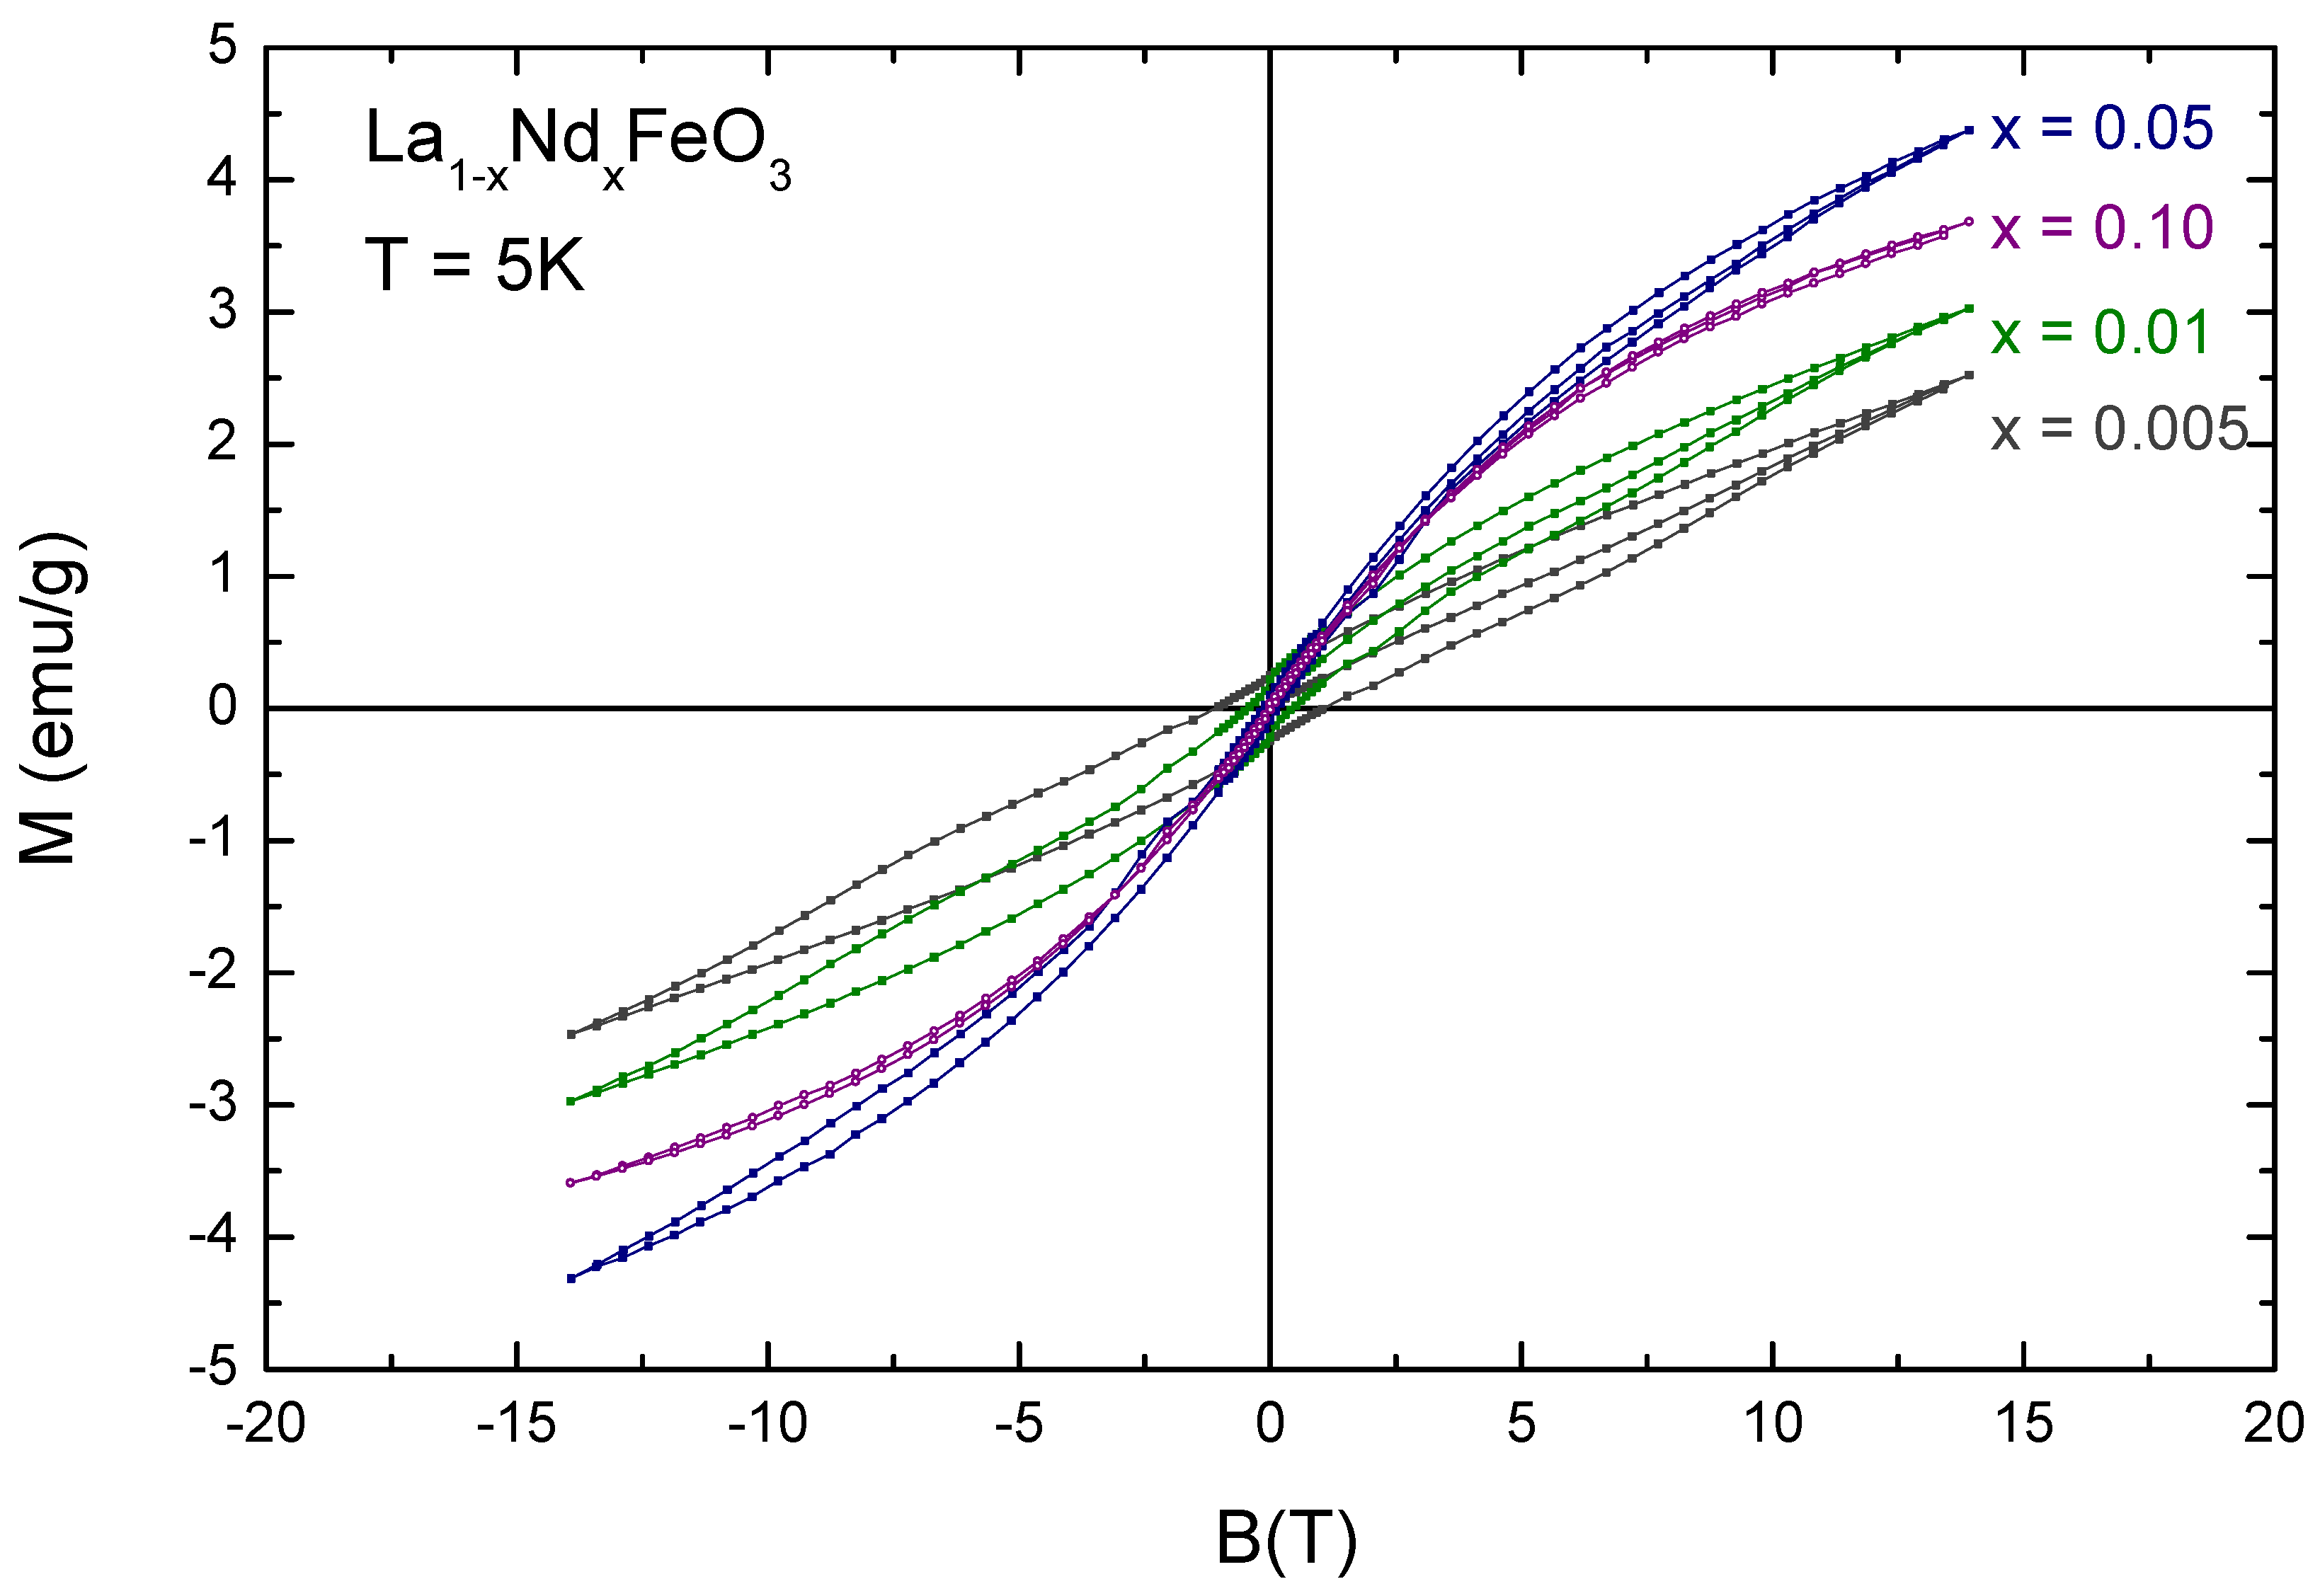
3.4. Magnetic Properties

Magnetization measurements of the La1−xNdxFeO3 ceramics performed at 300 K and 5 K temperatures have testified an evolution of the magnetic properties as a function of dopant concentration and temperature (Figure 9). The M(H) dependencies obtained at room temperature demonstrate a notable reduction in coercivity of the compounds with increasing dopant concentration. As little as 0.5% of neodymium concentration significantly modifies magnetic anisotropy of the compounds which leads to a drastic (40%) reduction in coercivity while a coercive field does not significantly change with further increase of the dopant content in the measured concentration range (up to 10%). Modification in the magnetic structure caused by the chemical substitution also leads to about 15% increase in the in-field magnetization, which is most probably associated with an alteration in the chemical bond angle Fe–O–Fe. It should be noted that magnetic structure of the compounds remains to be antiferromagnetic while small ferromagnetic contribution is related to uncompensated surface spin, originated from nanoscale crystallites, as well as by weak ferromagnetism related to a canting of the magnetic moment associated with Dzyaloshinsky-Moria interactions [23]. An increase in the dopant content up to 10% causes a reduction of ferromagnetic component in the magnetic interactions and compound La0.9Nd0.1FeO3 is characterized by nearly collinear antiferromagnetic structure.
Isothermal magnetization measurements performed at 5 K testify a strong reduction in the coercivity of the compounds while magnetic moment becomes notably larger in strong magnetic fields. Strong decrease in the coercive field of the compounds at low temperature is related to spin flip transition occurred in LaFeO3-based compounds at about 150 K. A decrease in coercivity of the compounds takes place gradually upon dopant concentration increase, thus pointing at progressive alteration of the easy magnetization axis. An increase of magnetization occurring upon the dopant content is most probably caused by positive exchange interactions formed between Fe and Nd ions. An increase in the dopant content above 5% leads to a gradual strengthening of the antiferromagnetic component caused by negative exchange interactions formed between Nd ions, while an in-field magnetization observed for the compound with x = 0.1 still remains much larger than that observed for the lightly-doped compounds.
The compounds having the same nominal chemical compositions as those mentioned above but in different form (powder and ceramic) are apparently characterized by different magnetic properties. The compounds in a form of ceramic pieces show gradual increase of room temperature in-field magnetization with Nd content up to 10% while the ground compounds have nearly the same magnetization, which remains to be stable regardless of Nd concentration (except for the compound with maximal content of the dopant ions). Gradual increase in the in-field magnetization points at progressive modification of the magnetic properties of the compounds, which is most probably associated with an increased contribution from uncompensated spins formed near structural defects. It should be noted that the magnetic structure of the compounds 0 < x < 0.1 remains unaffected and it is similar to the characteristics for the ground samples. The compounds with x = 0.1 of both compared series testify an alteration in their magnetic structure expressed as a drastic decrease in the magnetization and coercive field, which signifies a strengthening of antiferromagnetic interactions induced by the chemical substitution. The differences of the magnetic properties observed for the compounds in the form of ceramic pellets and ground ones is caused by their different crystalline morphology and defectiveness of the compounds, while the magnetic structure remains similar.

4. Conclusions

In this work we have fabricated and characterized a series of nanopowders and nanoceramics of La1-xNdxFeO3 doped with different Nd3+ concentration. It was observed that with the increase of doping, the unit cell become smaller, which have impact on the magnetic and dielectric properties of the nanostructures. In the luminescence spectra, we observed concentration quenching due to cross relaxation, energy migration and thermal depopulation of excited states. Luminescence may be observed only for powder samples because in the ceramics, due to change of the color after sintering, emission is absorbed by the material. An interesting observation was that magnetization of the La1−xNdxFeO3 is different for powders and for ceramics. This is caused by internal strains induced by sintering process in nanoceramics. It was also observed that the change of the Nd concentration has an impact on the magnetization, which is most probably caused by positive exchange interactions formed between Fe and Nd ions. All samples revealed relatively high values of dielectric permittivity, which can be improved by small amount of doping. There were observed ionic and dipole relaxations, which appeared in different frequency ranges. Ionic relaxation frequency has logarithmic dependence on Nd content, whereas dipole relaxation has an asymptotic exponential one. The most important conclusion is the possibility of adjusting desired electric and magnetic properties of La1−xNdxFeO3 nanoceramics by changing the concentration of introduced Nd.

Supplementary Materials

The following are available online at https://www.mdpi.com/2571-6131/2/1/1/s1, Figure S1. (a–d) Topography and (e–h) surface potential of La1−xNdxFeO3 in dependence of Nd doping degree. (a,e) 0.5%; (b,f) 1%; (c,g) 5%; (d,h) 10%.

Author Contributions

Powder synthesis, XRD analysis, luminescence studies, writing—original draft preparation P.G.; electric properties measurements analysis, K.O.; ceramic preparation, R.T.; writing—review, A.Ł.; writing—review, supervision, W.S.; magnetic measurements and analysis, D.K.; AFM measurements, D.A.; morphology analysis and discussion of results, A.K.

Funding

This project has received funding from the European Union’s Horizon 2020 research and innovation programme under the Marie Skłodowska-Curie grant agreement No 778070—TransFerr—H2020-MSCA-RISE-2017. Part of the work was developed within the scope of the project CICECO-Aveiro Institute of Materials, POCI-01-0145-FEDER-007679 (FCT Ref. UID/CTM/50011/2013), financed by national funds through the FCT/MEC and when appropriate co-financed by FEDER under the PT2020 Partnership Agreement.

Acknowledgments

The authors would like to thank Bogusław Macalik for help in ac impedance measurements.

Conflicts of Interest

The authors declare no conflict of interest. The funders had no role in the design of the study; in the collection, analyses, or interpretation of data; in the writing of the manuscript, or in the decision to publish the results.

References

  1. Nolting, F.; Scholl, A.; Stoohr, J.; Seo, J.W.; Fompeyrine, J.; Siegwart, H.; Locquet, J.-P.; Anders, S.; Luning, J.; Fullerton, E.E.; et al. Direct observation of the alignment of ferromagnetic spins by antiferromagnetic spins. Nature 2000, 405, 767–769. [Google Scholar] [CrossRef] [PubMed]
  2. Khetre, S.M.; Jadhav, H.V.; Jagadale, P.N.; Kulal, S.R.; Bamane, S.R. Studies on electrical and dielectric properties of LaFeO3. Adv. Appl. Sci. Res. 2011, 2, 503–511. [Google Scholar]
  3. Bhattacharjee, S.; Rahmedov, D.; Wang, D.; Iguez, J.; Bellaiche, L. Ultrafast Switching of the Electric Polarization and Magnetic Chirality in BiFeO3 by an Electric Field. Phys. Rev. Lett. 2014, 112, 147601. [Google Scholar] [CrossRef]
  4. Kimel, A.V.; Kirilyuk, A.; Hansteen, F.; Pisarev, R.V.; Rasing, T. Nonthermal optical control of magnetism and ultrafast laser-induced spin dynamics in solids. J. Phys. Condens. Matter 2007, 19, 043201. [Google Scholar] [CrossRef]
  5. Karpinsky, D.V.; Troyanchuk, I.O.; Sikolenko, V.; Efimov, V.; Kholkin, A.L. Electromechanical and magnetic properties of BiFeO3-LaFeO3-CaTiO3 ceramics near the rhombohedral-orthorhombic phase boundary. J. Appl. Phys. 2013, 113, 187218. [Google Scholar] [CrossRef]
  6. Karpinsky, D.V.; Troyanchuk, I.O.; Bärner, K.; Szymczak, H.; Tovar, M. Crystal structure and magnetic ordering of the LaCo1−xFexO3 system. J. Phys. Condens. Matter 2005, 17, 7219. [Google Scholar] [CrossRef]
  7. Mao, A.J.; Tian, H.; Kuang, X.Y.; Jia, J.W.; Chai, J.S. Structural phase transition and spin reorientation of LaFeO3 films under epitaxial strain. RSC Adv. 2016, 6, 100526–100531. [Google Scholar] [CrossRef]
  8. Zhu, Z.; Peelaers, H.; Van de Walle, C.G. Electronic and protonic conduction in LaFeO3. J. Mater. Chem. A 2017, 5, 15367–15379. [Google Scholar] [CrossRef]
  9. Eibschutz, M.; Shtrikman, S.; Treves, D. Mössbauer Studies of Fe57 in Orthoferrites. Phys. Rev. 1967, 156, 562–577. [Google Scholar] [CrossRef]
  10. Coutinho, P.V.; Cunha, F.; Barrozo, P. Structural, vibrational and magnetic properties of the orthoferrites LaFeO3 and YFeO3: A comparative study. Solid State Commun. 2017, 252, 59–63. [Google Scholar] [CrossRef]
  11. Phokha, S.; Pinitsoontorn, S.; Maensiri, S.; Rujirawat, S. Structure, optical and magnetic properties of LaFeO3 nanoparticles prepared by polymerized complex method. J. Sol-Gel Sci. Technol. 2014, 71, 333–341. [Google Scholar] [CrossRef]
  12. Acharya, S.; Mondal, J.; Ghosh, S.; Roy, S.K.; Chakrabarti, P.K. Multiferroic behavior of lanthanum orthoferrite (LaFeO3). Mater. Lett. 2010, 64, 415–418. [Google Scholar] [CrossRef]
  13. Winkler, E.; Zysler, R.D.; Mansilla, M.V.; Fiorani, D. Surface anisotropy effects in NiO nanoparticles. Phys. Rev. B 2005, 72, 132409. [Google Scholar] [CrossRef]
  14. Pechini, M.P. Method of Preparing Lead and Alkaline Earth Titanates and Niobates and Coating Method Using the Same to Form a Capacitor. U.S. Patent 3,330,697, 11 July 1967. [Google Scholar]
  15. Fedyk, R.; Hreniak, D.; Łojkowski, W.; Stręk, W.; Matysiak, H.; Grzanka, E.; Gierlotka, S.; Mazur, P. Method of preparation and structural properties of transparent YAG nanoceramics. Opt. Mater. 2007, 29, 1252–1257. [Google Scholar] [CrossRef]
  16. Collins, L.; Kilpatrick, J.I.; Kalinin, S.V.; Rodriguez, B.J. Towards nanoscale electrical measurements in liquid by advanced KPFM techniques: A review. Rep. Prog. Phys. 2018, 81, 086101. [Google Scholar] [CrossRef] [PubMed]
  17. Selbach, S.M.; Tolchard, J.R.; Fossdal, A.; Grande, T. Non-linear thermal evolution of the crystal structure and phase transitions of LaFeO3 investigated by high temperature X-ray diffraction. J. Solid State Chem. 2012, 196, 249–254. [Google Scholar] [CrossRef]
  18. Gluchowski, P.; Strek, W. Luminescence and excitation spectra of Cr3+:MgAl2O4 nanoceramics. Mater. Chem. Phys. 2013, 140, 222–227. [Google Scholar] [CrossRef]
  19. Parchur, A.K.; Prasad, A.I.; Ansari, A.; Rai, S.B.; Ningthoujam, R.S. Luminescence properties of Tb3+-doped CaMoO4 nanoparticles: Annealing effect, polar medium dispersible, polymer film and core-shell formation. Daton Trans. 2012, 41, 11032–11045. [Google Scholar] [CrossRef]
  20. Elliott, S.R. Ac conduction in amorphous chalcogenide and pnictide semiconductors. Adv. Phys. 1987, 36, 135–217. [Google Scholar] [CrossRef]
  21. Mott, N.F.; Davis, E. Electronic Processes in Non-crystalline Materials; Clarendon: Oxford, UK, 1979; pp. 59–62. [Google Scholar]
  22. Qiu, Y.; Luo, Y.S.; Zou, Z.J.; Tian, Z.M.; Yuan, S.L.; Xi, Y.; Huang, L.Z. Size effect on magnetic and dielectric properties in nanocrystalline LaFeO3. J. Mater. Sci. Mater. Electron. 2014, 25, 760–764. [Google Scholar] [CrossRef]
  23. Ederer, C.; Spaldin, N.A. Weak ferromagnetism and magnetoelectric coupling in bismuth ferrite. Phys. Rev. B 2005, 71, 060401. [Google Scholar] [CrossRef]
Figure 1. XRD of the La1−xNdxFeO3 powders and ceramics doped with different concentration of Nd3+.
Ceramics 02 00001 g001
Figure 2. (ad) Topography and (eh) deflection signal (differential topography) of La1−xNdxFeO3 ceramics in dependence of Nd doping degree. (a,e) 0.5%; (b,f) 1%; (c,g) 5%; (d,h) 10%.
Ceramics 02 00001 g002
Figure 3. NIR luminescence of the La1−xNdxFeO3 powders under 808 LD excitation (left) and the decay time of 4F3/2 level of Nd3+, measured at 1057.5 nm (right).
Ceramics 02 00001 g003
Figure 4. The real part of permittivity as a function of frequency for La1-xNdxFeO3 ceramics. Dotted line corresponds to the undoped sample.
Ceramics 02 00001 g004
Figure 5. Frequency dependence of the conductivity of La1-xNdxFeO3 ceramics. Dotted line corresponds to the undoped sample. Inserted figure shows the dc conductivity as a function of Nd content.
Ceramics 02 00001 g005
Figure 6. Cole–Cole plots for the La1−xNdxFeO3 ceramics. Dotted line corresponds to the undoped sample.
Ceramics 02 00001 g006
Figure 7. Frequency dependencies of loss tangents of the La1-xNdxFeO3 ceramics. Dotted line corresponds to the undoped ceramic.
Ceramics 02 00001 g007
Figure 8. Relaxation frequency as a function of Nd mol% content.
Ceramics 02 00001 g008
Figure 9. Field dependencies of magnetization recorded for La1−xNdxFeO3 ceramics at room temperature (top) and at a temperature of 5 K (bottom).
Ceramics 02 00001 g009aCeramics 02 00001 g009b
Table 1. Cell parameters and crystallite sizes of the La1−xNdxFeO3 powders and ceramics.
La1−xNdxFeO3Crystallite Size/nmabcStrains/%
powder
x = 0.005675.5633(2)7.8510(3)5.5529(9)0.021
x = 0.01525.5709(1)7.8450(0)5.5480(6)0.021
x = 0.05615.5657(6)7.8448(7)5.5447(0)0.019
x = 0.10505.5666(8)7.8375(7)5.5364(8)0.022
ceramic
x = 0.005245.5656(9)7.8833(4)5.5339(7)0.045
x = 0.01255.5658(7)7.8825(6)5.5351(9)0.042
x = 0.05245.5625(3)7.8780(2)5.5333(5)0.044
x = 0.10305.5628(0)7.8689(0)5.5251(6)0.044

