Article

Functionalization of Hydroxyapatite Ceramics: Raman Mapping Investigation of Silanization

Université de Limoges, CNRS, IRCER, UMR 7315, F-87000 Limoges, France
*
Author to whom correspondence should be addressed.
Ceramics 2019, 2(2), 372-384; https://doi.org/10.3390/ceramics2020029
Submission received: 19 April 2019 / Revised: 8 May 2019 / Accepted: 16 May 2019 / Published: 22 May 2019
(This article belongs to the Special Issue Ceramics for Biomedical Applications)

Abstract

:
Surface modification of bioceramic materials by covalent immobilization of biomolecules is a promising way to improve their bioactivity. This approach implies the use of organic anchors to introduce functional groups on the inorganic surface on which the biomolecules will be immobilized. In this process, the density and surface distribution of biomolecules, and in turn the final biological properties, are strongly influenced by those of the anchors. We propose a new approach based on Raman 2D mapping to evidence the surface distribution of organosilanes, frequently used as anchors on biomaterial surfaces on hydroxyapatite and silicated hydroxyapatite ceramics. Unmodified and silanized ceramic surfaces were characterized by means of contact angle measurements, atomic force microscopy (AFM) and Raman mapping. Contact angle measurements and AFM topographies confirmed the surface modification. Raman mapping highlighted the influence of both the ceramic’s composition and silane functionality (i.e., the number of hydrolysable groups) on the silane surface distribution. The presence of hillocks was shown, evidencing a polymerization and/or an aggregation of the molecules whatever the silane and the substrates were. The substitution of phosphate groups by silicate groups affects the covering, and the spots are more intense on SiHA than on HA.

1. Introduction

In the field of bone surgery, the treatment of pathologies such as the repair of large osseous defects, still requires a satisfactory solution [1]. To overcome this limitation, research efforts are currently being made to improve the performances of synthetic bone graft substitutes. Several strategies have been developed including biomaterial surface functionalization by molecules of interest that are able to enhance osteointegration by osteoinduction, i.e., the ability for the biomaterial to generate in vivo cell colonization and induce bone formation by the presence of biomolecules inducing the differentiation of cells involved in bone synthesis [2]. Since the 1980s, calcium phosphate hydroxyapatite (HA, Ca10(PO4)6(OH)2) has received a great deal of attention as a material for bone substitution. Its chemical composition is close to the mineral part of bone, which induces interactions between the bone tissue and the biomaterial leading to a strong interface after implantation. Hydroxyapatite ceramics are osteoconductive, i.e., they allow bone growth on their surface, but they have limited bioactivity [3,4,5]. Several strategies are being developed to increase their biological performances including the substitution of various ionic species in the apatitic structure [6]. In this field, silicon is known to influence the strength, the formation and the calcification of the bone tissue [7,8], and this has led to the development of silicon containing biomaterials [9]. Among these biomaterials particular attention has been given to silicated hydroxyapatite (SiHA, Ca10(PO4)6−x(SiO4)x(OH)2−x) ceramics [10,11,12], whose biological properties are currently being investigated [13,14,15]. Functionalizing the surface with specific biomolecules [16] could increase HA ceramics biointegration by stimulating the behavior of the cells involved in angiogenesis and/or osteogenesis. This functionalization can be carried out by adsorption or by covalent immobilization via anchor agents such as organofunctional alkoxysilane molecules [17]. For the latter, most of the protocols are based on a “grafting-from” approach, which involves three steps: (i) silanization of material surface by a silane (i.e., an anchor) having a functional terminal amine group (mainly 3-aminopropyltrimethylethoxysilane) [18,19], (ii) bonding of a cross-linker/spacer with the silane (e.g., N-succinimidyl-3-maleimido propionate (SMP) [20,21,22], carbodiimide coupling agent [23,24], suberic acid bis-N-hydroxysuccinimide ester (DSS) [25], heparin [26] and (iii) immobilization of the biomolecule on the cross-linker (e.g., peptide sequences [20,21,25,27] or proteins [23,24,26]). Whatever the grafting protocol is, the surface density and distribution of immobilized biomolecules is directly determined by those of the anchor agent. In this way, the biological properties of the hybrid biomaterial will also depend on the initial silanization. Thus, good knowledge of this silanization step is of prime importance in the development of such functionalized biomaterials. In the literature, most of the investigations have been devoted to proving the presence of the molecule on the ceramic surface in order to determine its quantity, or in some cases to propose a mechanism of interaction between the calcium phosphate surface and the silane [19]. The most common characterization techniques found in these articles are spectroscopic methods such as energy-dispersive spectroscopy, secondary ion mass spectrometry, infrared spectroscopy (FTIR) or attenuated total reflection Fourier transform infrared spectroscopy (ATR-FTIR) and X-ray photoelectron spectroscopy (XPS). They are used to get information on the constituent elements, organic modifiers and chemical composition of the surface after functionalization [17]. In parallel, thermogravimetry analyses (TGA) coupled with mass spectroscopy (MS) are employed for the study of the interaction strength between the attached organic groups and the surface and estimate the quantity of immobilized molecules [28]. However, none of them give an overview of the chemistry of the substrate surface, i.e., spatial repartition and coverage of the ceramic surface by organosilane molecules. 2D Raman mapping is a relevant technique to analyze large samples and to access various kinds of information like mechanical stresses in nanomaterials [29,30], crystallographic orientations [31,32], chemical compositions (pigment [33], algae [34]) or to study corrosion phenomena [35], etc. Some studies are also available in the health domain for drug delivery analysis [36,37,38] or characterization of bone composition [39,40,41].
This study proposes an approach based on Raman mapping to chemically characterize a silanized surface and highlight the influence of the silane functionality (i.e., the number of hydrolysable groups) and the chemical composition of the substrate on the surface coverage. HA was chosen as a reference bioceramic material. As a consequence, silicon-substituted HA was retained due to its potentially improved biological properties when compared to HA but also because silicate groups in SiHA could provide preferential sites for silane immobilization at the ceramic surface via Si-O-Si covalent bonding [42]. Two organosilanes containing one and three hydrolysable groups, respectively, were used. The 3-aminopropyltriethoxysilane (APTES) was chosen as it is commonly used and well known for inducing polymerization due to its tri-ethoxy groups, and the 3-aminopropyldimethylethoxysilane (APMES) was chosen to assess the feasibility of the functionalization with mono-functional organosilanes. The properties of silanized ceramic surfaces were characterized by means of three complementary methods: atomic force microscopy for surface topography measurements, contact angle for wettability measurements and calculation of the surface free energy, and Raman spectroscopy to obtain a chemical image of the surface and deduce the surface distribution and the coverage of organosilanes.

2. Results

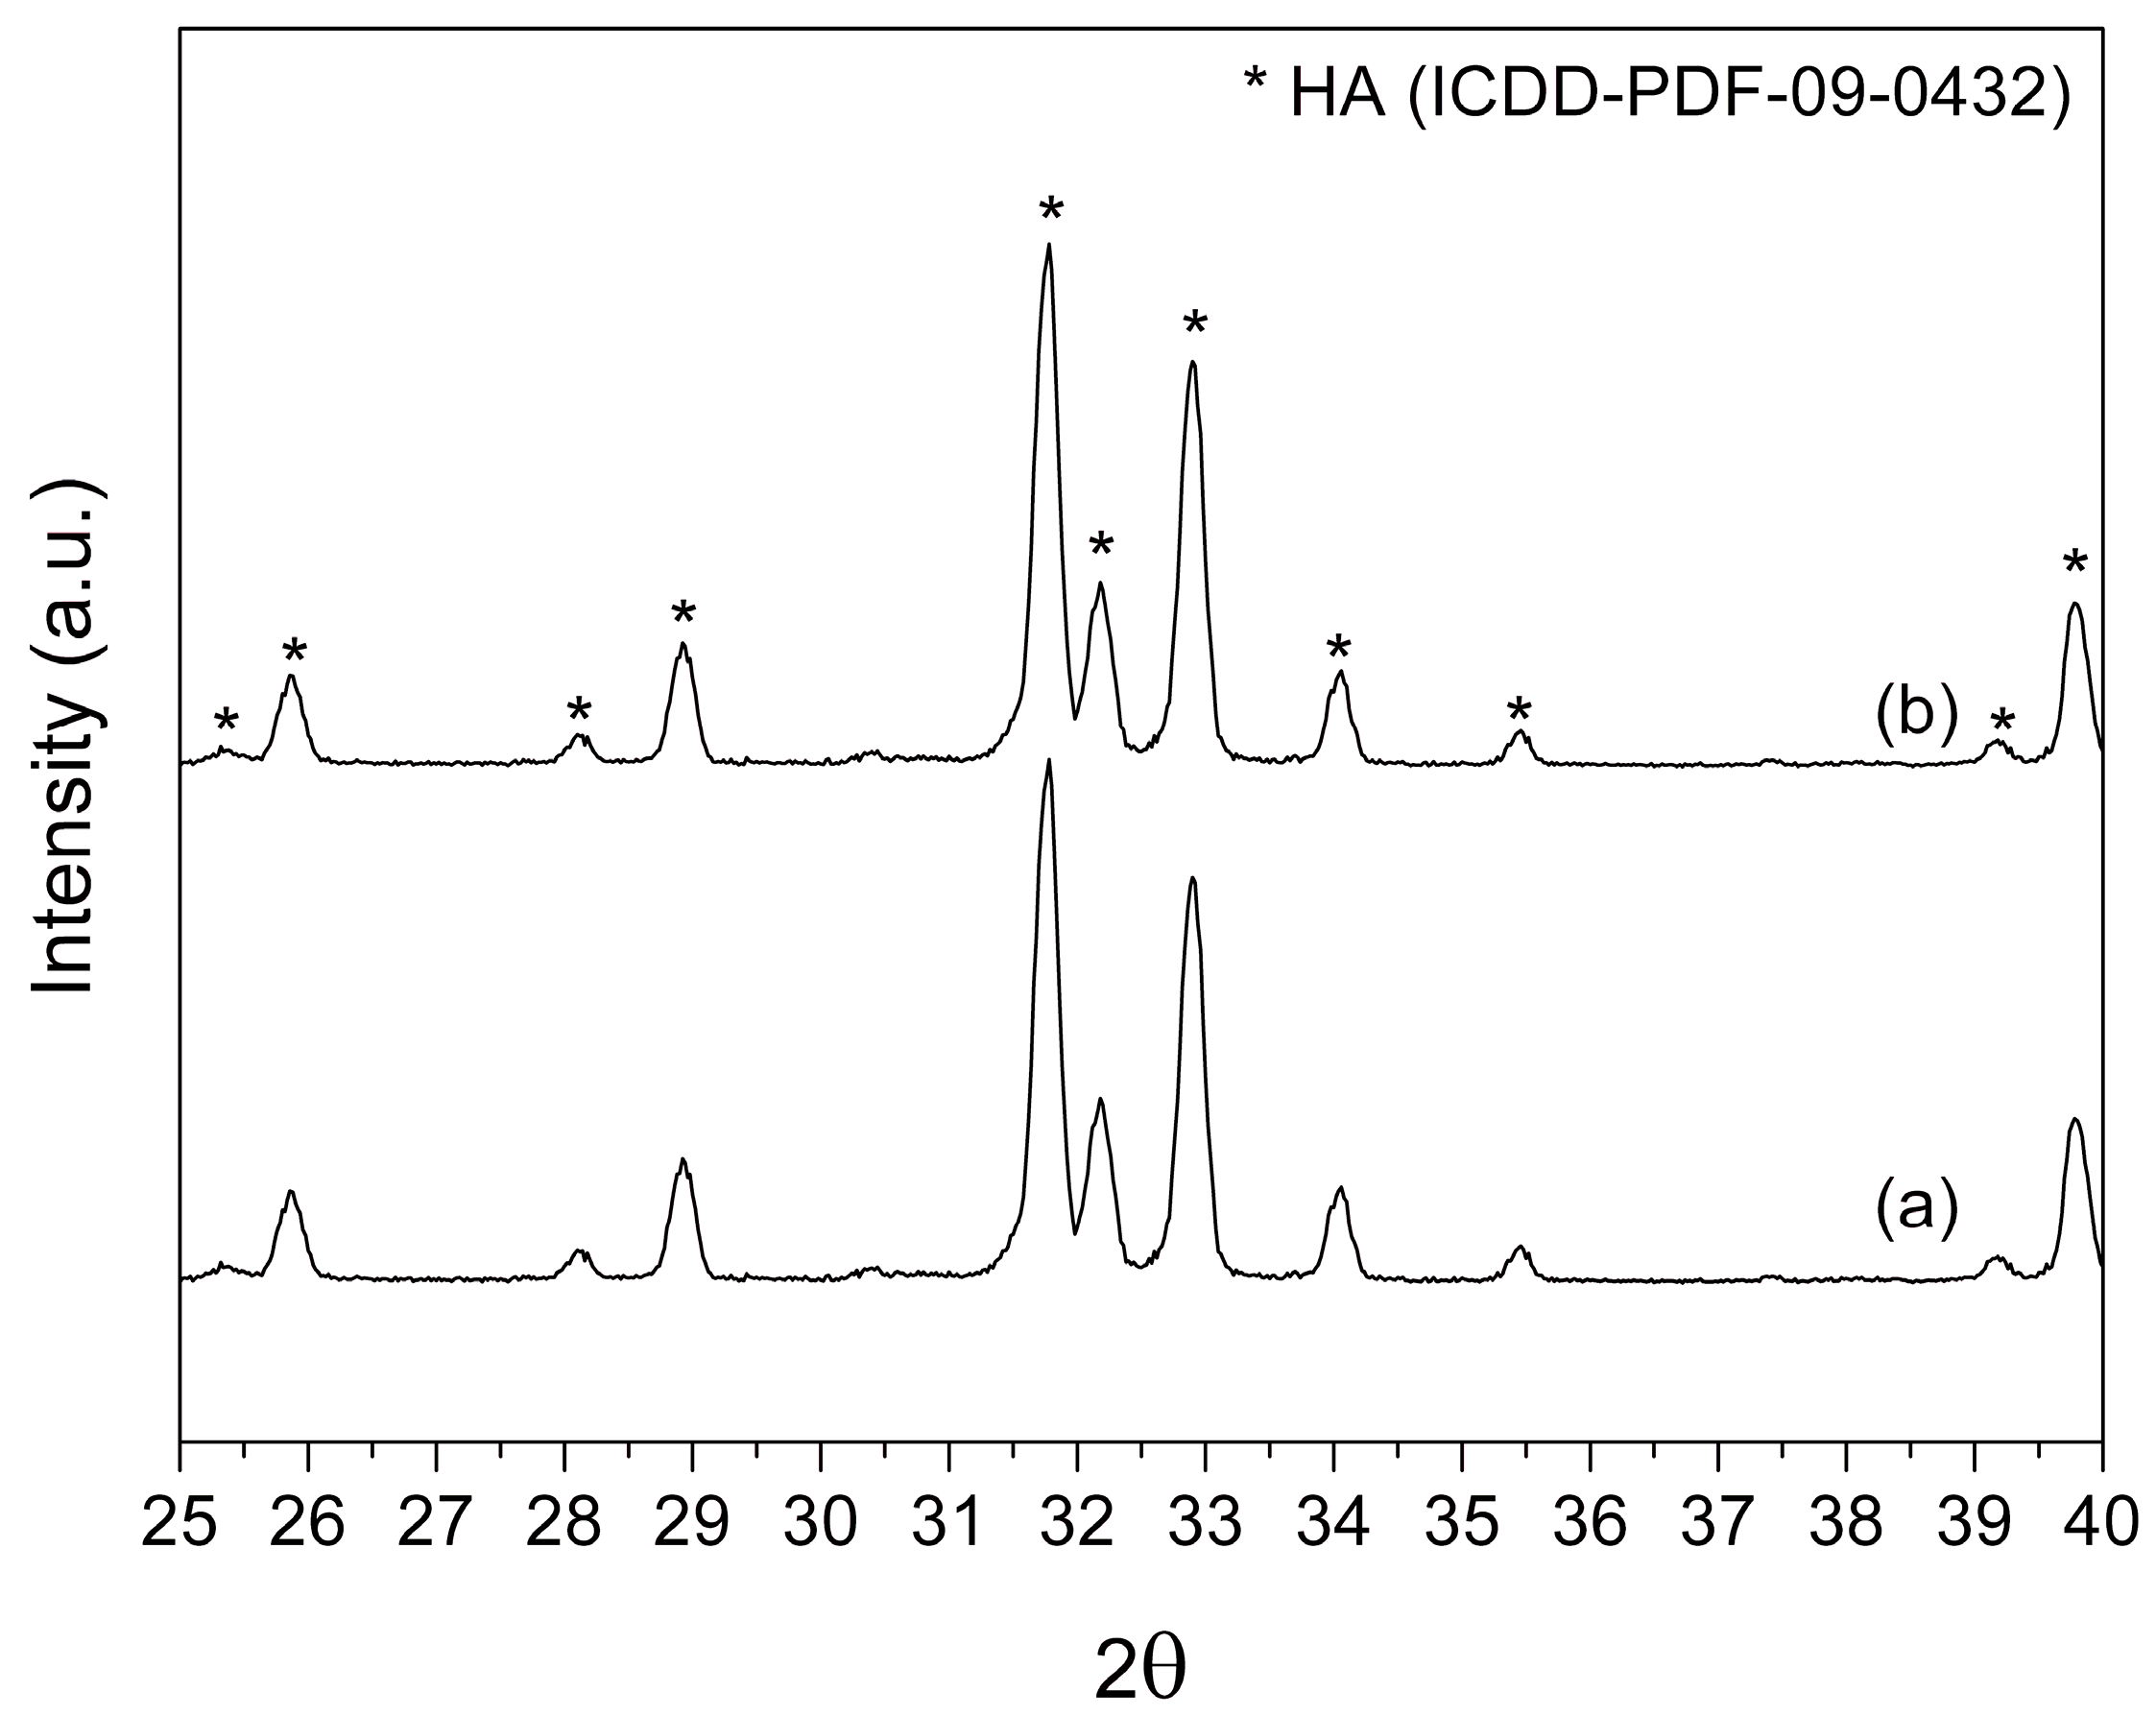
2.1. X-ray Diffraction

The XRD patterns of HA and SiHA pellets are shown in Figure 1. They exhibited a unique crystalline hydroxyapatite phase indexed with the pattern PDF 9-432 of the apatite structure. No secondary crystalline phase was detected as expected [11,43].

2.2. Atomic Force Microscopy

AFM topography images of bare (i.e., before silanization) HA and SiHA substrates and those of silanized substrates, with APMES and APTES molecules, are presented in Figure 2. Before silanization, the bare surfaces were quite flat and homogeneous with a roughness (RMS) inferior to 10 nm (Figure 2a,b), even though some polishing scratches were observed. The HA-M (14 nm, Figure 2c) and SiHA-M (15 nm, Figure 2d) pellets present homogeneous and gloss-like surfaces and the roughness is increased compared to bare HA (8 nm) and SiHA (6 nm) ceramics. A discontinous film presenting some hillocks can be observed, suggesting an aggregation of APMES molecules on the surface, espacially on SiHA ceramics. It can be noted that there is no visible polishing-related scratch. The roughness of HA-T (Figure 2e) and SiHA-T (Figure 2f) is five times higher than that of bare samples (≈40 nm versus ≈6–8 nm), moreover, the z-amplitude of the surfaces is wide (≈300 nm). Even though some scratches are present, they cannot explain these results. The surfaces are homogeneous with a gloss-like aspect, suggesting the presence of a continuous film with numerous aggregates covering the surface for both the HA-T and SiHA-T samples. Thus, in all cases, silanization modifies the surface topography of ceramics and the influence of silanization on the roughness depends on the molecule used: the greater the functionality of the silane, the greater the impact on the substrate topography.

2.3. Wettability and Free Surface Energies

The surface free energies of bare HA and SiHA ceramics are 41 mJ/m2 and 47 mJ/m2, respectively (Table 1). The difference observed between these two substrates is due to the fact that their behavior is not the same regarding water. HA is a little less hydrophilic than SiHA, which is highlighted by the water contact angles (θw,HA = 62°; θw,SiHA = 52°) and the polar components of surface free energies (γps,HA = 14 mJ/m2; γps,SiHA = 19 mJ/m2). After functionalization, the behavior of substrates is modified, especially in the case of water as liquid and HA as substrate. The contact angle θw increases after functionalization (θw,HA-M = 80°; θw,HA-T = 88° and θw,SiHA-M = 64°; θw,SiHA-T = 69°) leading to an important decrease in the polar component of surface free energies (γps,HA-M = 5 mJ/m2; γps,HA-T = 1 mJ/m2 and γps,SiHA-M = 16 mJ/m2; γps,SiHA-T = 9 mJ/m2). This highlights the more hydrophobic behavior of the silanized surfaces. The dispersive components (γds) of surface free energies slightly increase from 28 mJ/m2 for HA to 40 mJ/m2 for HA-T, and from 28 mJ/m2 for SiHA to 33 mJ/m2 for SiHA-T. Globally, the total surface free energies of silanized HA are in the same order of magnitude as for bare HA, though a slight decrease can be observed when the functionality of the silane decreases. A more important decrease is observed in the case of SiHA. After functionalization, the surface free energies drop from 47 mJ/m2 down to 38–42 mJ/m2. However, whatever the substrate is, for a given silane, the surface free energies are the same and after silanization the dispersive components increase and the polar ones decrease accordingly.

2.4. Raman Mapping

To evidence the relevant vibrational signatures that will be chosen to reconstruct the Raman maps, individual Raman spectra of HA, SiHA and tri-functional-silane (APTES) were recorded (Figure 3). For both HA and SiHA ceramics, in agreement with the literature data [44], the four vibration modes of the PO4 unit in the apatite structure at 430 cm−1 (symmetric bending mode ν2), 580 cm−1 (antisymmetric bending mode ν4), 962 cm−1 (symmetric stretching mode ν1), and 1047 cm−1 (antisymmetric stretching mode ν3) are evidenced (Figure 3b,c). The stretching mode of the OH bond is observed at 3574 cm−1 [44,45]. In the case of SiHA, the symmetric stretching mode of SiO4 units are observed at 840 and 892 cm−1 [46] (Figure 3c).
The region below 1500 cm−1 of the trifunctional-silane APTES spectrum (Figure 3a) presents numerous weak bands attributed to the spectral fingerprinting of the molecule. Among them, the stretching modes of SiO and SiC units (ν(SiO), ν(SiC)) are observed at 621 cm−1; the stretching modes of CC (ν(CC)) units coupled with the twisting of CH2 units (γ(CH2)) and the rocking of NH2 units (δ(NH2)) at 1076 cm−1, and finally the scissoring of CH3 and CH2 units (δ(CH3), δ(CH2)) at 1407 cm−1 and 1450 cm−1, respectively [47]. The region above 2800 cm−1 presents strong bands due to symmetric and antisymmetric stretching modes of CH bonds in the CH3 and CH2 units (from 2760 to 3060 cm−1) and those of NH bonds in the amine group NH2 around 3300 cm−1. This spectrum is typical of the silanes used in this study although the response of the monofunctional-silane APMES CH modes is weaker because there are fewer of them. As the aliphatic stretching bands are intense and not overlapped by those of phosphate or hydroxide groups, they can be used to evidence the presence of the silanes on the ceramic substrates and reconstruct the Raman maps.
Three different maps of 150 × 150 µm2 were performed for each condition in order to obtain a representatitive information of the surface of each sample (Figure 4). Spectra were recorded between 2650 and 3500 cm−1. Then, the maps were reconstructed according to the integrated intensity of the CH modes of both CH3 and CH2 units from 2760 to 3060 cm−1. To allow the comparison of samples, the color bar of integrated intensities was calibrated from 0 up to 40,000 (a.u). The more intense the red color is, the more numerous the C-H aliphatic groups (and therefore the silanes) are. Whatever the organosilane and the substrate may be, the functionalization is heterogeneous (Figure 4). Nevertheless, trends emerge. For both HA-M and SiHA-M, some spots are randomly distributed on the surface while for ceramics functionalized by the tri-functional organosilane the covered surface seems more important and tends toward a film covering the whole surface.
An image segmentation method, the “Particle Analysis” module of the Wire software (version 4.3, Renishaw, Wotton-under-Edge, UK), was used to estimate the surface covered by the organosilane. Images were generated from the bicolor (black and red) Raman maps for which the well-depth was fixed at 10%, thus allowing the segmentation of the image domains. The surface coverage (in percentages) was then estimated by dividing the obtained area by the total surface of the analyzed samples (22.5 × 103 μm2). The mean values (± standard deviation) correspond to the average of the three measurements performed on each substrate. The presence of disseminated spots observed on HA-M and SiHA-M suggests a low and heterogeneous coverage of the surface (respectively, 8 ± 8% and 2 ± 3%, Table 2). More precisely, SiHA-M presents wide and intense spots (Image 2 in Figure 4) when compared to HA-M for which smaller and less intense spots are observed. SiHA-T and HA-T samples show high coverage rates of 26 ± 26% and 17 ± 5%, respectively. However, the standard deviations highlight that HA-T samples are more homogeneous than Si-HA ones.

3. Discussion

The surface of inorganic bioceramics can be functionalized by adsorption or by covalent grafting of organic biomolecules. In the latter case, most of functionalization protocols are based on specific and successive reactions, implying at least an intermediate anchor between the ceramic surface and the biomolecule. As a consequence, the surface distribution of the biomolecules is strongly influenced by that of the initial anchor, e.g., organosilanes. So, one of the key points is the silane distribution onto the substrate surface, which will depend on the nature of the silane and the substrate’s chemical composition.
Silanization corresponds to a condensation of alkoxy functions. The hydrolysis of the alkoxy groups leads either to homo-condensation, i.e., the formation of oligomers and then of a 3D network between silane molecules, or to hetero-condensation, i.e., a silane condensation onto a surface presenting hydroxyl function. The mechanisms of these two reactions are similar and mainly influenced by the pH and nature of the solvent, the reaction time and temperature, the concentration of the organosilane in solution, and the nature of the carbon chains (functionality, length and nature of the carried functions) [18]. In most cases, continuous and structured films are expected [48] which has led some authors to use tri-functional silanes such as APTES [49]. While the presence of silanes can be confirmed, their surface distributions are not studied. In the cases studied here, the terminal functions of silanes are amine functions, and the length of the alkyl chains and the reaction conditions are the same in order to limit the number of influencing parameters.
Before functionalization, the surface of the HA and SiHA pellets is smooth with a roughness inferior to 9 nm (Figure 2) and hydrophilic (see θw and γps in Table 1). Their surface free energies are around 41–47 mJ/m2 depending on the pellets’ composition, which is in accordance with the values found in the literature [14]. After silanization, the wettability decreases (see θw in Table 1). The total surface free energies remain globally unchanged, the polar γps components decrease in favor of the dispersive ones γds (Table 1). A slight decrease in the dispersive γds component is noticed when the silane functionality decreases. This evolution is typical of a surface modified by hydrophobic functions containing alkyl chains [48] and proves that a chemical modification of the surface occurred for all the silanized samples. However, these measurements only give an overall view: the drop has a volume of 4.4 µL, which corresponds approximately to a contact surface area around 5 mm2, depending on the wettability and the liquid used. Thus, considering these results, all the substrate surfaces are modified in the same way and the presence of a film is suggested.
At the local scale, i.e., AFM (for which the analyzed surface area is 2.5 × 10⁻³ mm2), the roughness and z-amplitude increase with the functionality of the silane molecules. The RMS values ranging from 14 to 40 nm and the z-amplitudes ranging from 100 up to 300 nm, are too high to correspond to a silane monolayer. Thus, they indicate a surface modification by silane’s polymerization onto the ceramics surface even in the case of APMES molecules, which are not supposed to. However, with AFM alone, it is not possible to make a conclusion on the influence of the substrate since the results obtained for HA-M and SiHA-M and for HA-T and SiHA-T are similar.
With an analyzed surface area of 22.5 × 10⁻³ mm2, Raman mapping offers a chemical and thus, the largest view. In the case of HA-T and SiHA-T, between 17% and 26% of the surface is covered and the surface roughness increases more significantly (Figure 2). This is related to the formation of hillocks with a continuous film due to its polymerization (homo-condensation and hetero-condensation). Regarding the HA-M and SiHA-M samples, only a few spots are visible on Raman maps and they cover less than 8% of the surface (Figure 4 and Table 2), and the surface roughness values are twice the values measured on bare samples (Figure 2). The APMES can only dimerize as it has only one ethoxy group. The presence of the small hillocks evidences a dimerization and/or an aggregation of the molecules, which raises the question of the interactions between the silane molecules and the substrate surface as well as the availability of amine functions. The silane should not only interact with the ceramics but also with its ethoxy function, as proposed in the literature. The substitution of phosphate groups by silicate groups should provide preferential sites for silane immobilization via Si-O-Si covalent bonding. It is interesting to note that the silicate groups are not essential for functionalization but their presence affects it. The spots are more intense on SiHA than on HA. In the case of APTES, the covering is more heterogeneous with SiHA than HA, which highlights an influence of the silicate groups of the apatite on the behavior of the silane. The presence of silicate groups changes the surface properties of the ceramics and influences the polymerization of the silane and the silane/ceramic interactions.

4. Materials and Methods

4.1. Silanised Ceramic Substrates

HA (Ca10(PO4)6(OH)2) and SiHA (Ca10(PO4)5.6(SiO4)0.4(OH)1.6) powders were synthesized by a conventional aqueous precipitation method from the addition of a di-ammonium phosphate solution ((NH4)2HPO4, purity: 99%; Sigma–Aldrich, France) and, in the case of SiHA, a silicon tetraacetate solution (Si(OCOCH3)4, purity: 98%; Sigma–Aldrich, France), into a calcium nitrate solution (Ca(NO3)2,H2O, purity: 99%; Sigma–Aldrich, France) under controlled pH, temperature and atmosphere [11,43]. For each composition, pellets (Ø = 10 mm) were elaborated by uniaxial pressing (125 MPa) of 300 mg of calcined powder (650 °C/30 min for HA and 700 °C/120 min for SiHA) [50,51]. Pellets were sintered at 1200 °C for 30 min in a Super Kanthal furnace under air atmosphere. Sintered dense pellets were polished with a sequence of SiC papers (up to P4000 grit). Then an ultrasonic cleaning in technical ethanol was performed.
The organosilanes were purchased from Sigma Aldrich (France): APMES (3-aminopropyldimethylethoxysilane, NH2(CH2)3Si(CH3)2OCH2CH3, purity: 97%) and APTES (3-aminopropyltriethoxysilane, NH2(CH2)3Si(CH3)2(OCH2CH3)3, purity > 98%). The silanization of pellets was made on dried substrates, using anhydrous toluene (purity: 99.8%; Sigma–Aldrich, France) under inert conditions (Ar). Five pellets made of HA or SiHA were introduced in a 100 mL Schlenk round bottom flask. When the temperature reached 60 °C, the organosilane was added drop by drop with a syringe in order to have a final concentration in the media of 0.20 ± 0.06 mol/L. The media was refluxed during 3 h and then held at 60 °C for 12 h. The silanized-substrates were rinsed twice with toluene and one time with technical ethanol, dried at 100 °C overnight in an oven, and finally under vacuum for 3 h. Functionalized pellets are noted as HA-M and SiHA-M after silanization with APMES, and HA-T and SiHA-T after silanization with APTES.

4.2. X-ray Diffraction

The purity of powders was controlled according to the standard specifications of ISO 13779 3:2008 [52]. The crystalline phases of sintered pellets were determined using a Siemens (Germany), D5000 diffractometer (Cu Kα1, λ = 1.54056 Å, 2θ range [25–40°], step size of 0.02°, counting time 4 s). The identification of crystalline phases was achieved with EVA software® by comparing the diffraction patterns with the International Center for diffraction Data-Powder Diffraction Files (ICDD-PDF).

4.3. Atomic Force Microscopy

AFM images of samples surface were obtained in air using an Agilent 5500 LS AFM (newly Keysight, Santa Rosa, CA, USA) in contact mode (AppNano ACT). The tip radii were smaller than 10 nm and the surface topography was obtained on an area of 50 × 50 µm2. The set-point applied by the cantilever corresponded to a maximum of 1.2 V and the speed was 1.2 lines per second. The resulting images were treated using the Gwyddion software (2.4 version, Free data analysis software, http://gwyddion.net/). The surface topography was measured and the root-mean-square roughness (RMS) was calculated for each surface as a function of N and M, which designate the definition of the image, i.e., 512, and the number of lines, i.e., 512, respectively. The RMS is given by the standard deviation of the z-values (amplitude) determined for each point of coordinates (x,y) in the image (Equation (1)).
R M S ( N , M ) = 1 N M x = 1 N y = 1 M ( z ( x , y ) z ¯ ( N , M ) ) 2

4.4. Raman Mapping

Raman mapping was performed using an inVia Reflex Renishaw Raman spectrophotometer (Wotton-under-Edge, UK). The 2D mapping module was used in streamline mode with a 40 × 2 μm2 laser beam. The high number of spectra recorded (13,456 spectra for a 150 × 150 µm2 2D map with a step size of 1.3 µm) enables high spatial resolution images to be generated. Spectra were recorded at the wavelength of 532 nm with low power to avoid any damage to the samples (3.2 mW at the sample), using a ×50 LWD (Long Working Distance) objective. The use of a 2400 grooves/mm grating permitted a resolution of 1.2 cm−1. For silanized ceramic substrates, spectra were recorded between 2650 and 3508 cm−1 to focus on the region of aliphatic C-H stretching modes.

4.5. Contact Angle and Surface Free Energy Measurements

Contact angle was measured with a Dynamic Contact Angle Measuring Instrument GBX DGD-MCAT (Digidron Goniometer GBX PixeLINK, Ireland). Drops (having a volume of 4.4 μL) were deposited automatically on polished and silanized pellet surfaces (previously cleaned with an argon stream) using the sessile drop method. The pictures of the drops were recorded by a camera coupled to a light microscope and analyzed using Digidrop software in polynomial mode. Measurements were made at room temperature after a time delay (20 s) to ensure the droplets equilibrium. Each contact angle value was the average of twenty measurements made on two different regions of ten pellets. In order to determine the surface free energy (γSL) of the samples, three solvents having different surface tension were used: distilled water (H2O), ethylene glycol (HO(CH2)2OH, purity: 99.8%; Sigma–Aldrich, France) and diiodomethane (CH2I2, purity: 99%; Sigma–Aldrich, France). The calculus of the surface free energy (γSL) and the determination of its dispersive and polar components were achieved with Young’s and Owen-Wendt’s equations (Equations (2) and (3)). In these equations, γSL, γSV and γLV are the surface free energy of the solid-liquid, the solid-vapor and the liquid-vapor equilibria, respectively. The “d” and “p” exponents denote whether the variable stands for the dispersive (γd) or the polar (γp) component of surface free energy.
γ S L = γ S V γ L V cos ( θ )
γ L V ( 1 + cos ( θ ) ) = 2 γ S V d γ L V d + 2 γ S V p γ L V p
Equation (2) is valid assuming that the drop, the surface and the atmosphere are in equilibrium. Equation (3), which is based on the fact that the total surface tension (γ) is a sum of the dispersive (γd) and the polar (γp) components, was used to calculate the surface tension for liquid-vapor equilibrium (γLV). The surface free energy of solid-liquid equilibrium (γSL) and the surface free energy of solid-vapor equilibrium (γSV) are deduced from the contact angle values measured with the testing liquids for which the characteristics (γLV, γdL, γpL) are summarized in Table 3.

5. Conclusions

The influence of the silane functionality (i.e., the number of hydrolysable groups) and chemical composition of the substrates (HA versus SiHA) on bioceramic surface coverage was assessed by three methods: contact angle measurements, AFM and Raman mapping. The contact angle measurements and the free surface free energies give an overview of the samples’ silanization whereas AFM provides local information on topography. As for Raman maps, they were useful to provide information on both the relative quantity and the surface distribution of the silanes at the ceramics’ surface. The presence of hillocks was showed, evidencing a polymerization and/or an aggregation of the molecules whatever the silane and the substrates are. The substitution of phosphate groups by silicate groups affects the covering, and the spots are more intense on SiHA than on HA. Taking into account the step of biomolecule immobilization on the anchor following the silanization, the optimal functionalized material is not necessarily the one presenting the largest amount of anchor molecules, but rather the one having the freest terminal functions for the following step of functionalization. Because of its polymerization, the APTES molecule enables the formation of a continuous film with a more homogeneous covering in the case of HA whereas the APMES molecule leads to a partial coverage. The latter configuration should allow for grafting biomolecules with a low surface density in order to control their released amounts and their activity while providing access to the bioactive substrate surface for both biological fluids and bone cells. However, it is necessary to ensure that the free amine functions required for the following functionalization steps are not engaged in the silanization reaction. Raman mapping appears to be a powerful tool for the characterization of inorganic material surfaces functionalized by organic molecules. It will be implemented in the further development of osteoinductive biomaterials in order to characterize the various steps of biomaterials’ surface functionalization, i.e., silanization (cross-linker), immobilization of spacers and then of proteins, as a tool to optimize the synthesis process of such modified surfaces.

Author Contributions

Conceptualization, C.D.; Investigation, D.S., Z.H. and N.E.F.; Methodology, M.D.-C. and J.C.; Supervision, M.D.-C., E.C. and C.D.; Visualization, D.S.; Writing—original draft, D.S.; Writing—review & editing, D.S., M.D.-C., E.C. and C.D.

Funding

This research was funded by the French Conseil Régional du Limousin and the French Agence Nationale de la Recherche in the scope of the LabEx SigmaLim (ANR-10-LABX-0074-01).

Acknowledgments

The authors thank the French Région Limousin and the French Agence Nationale de la Recherche in the scope of the LabEx SigmaLim (ANR-10-LABX-0074-01) for their financial support. The authors are grateful to Valérie Coudert and the Service commun de Caractérisation des Matériaux de Limoges (CARMALIM) for AFM acquisitions. The authors also thank Pr. Pascal Tristant for his assistance in contact angle measurements and Emeline Renaudie for her assistance in elaboration of calcium phosphate ceramics and their functionalization.

Conflicts of Interest

The authors declare no conflict of interest.

References

  1. Palmero, P.; Cambier, F.; De Barra, E. Ceramic devices for bone regeneration: Mechanical and clinical issues and new perspectives. In Advances in Ceramic Biomaterials: Materials, Devices and Challenges, 1st ed.; Woodhead Publishing: Cambridge, UK, 2017; pp. 279–311. [Google Scholar]
  2. Hench, L.L.; Polak, J.M. Third-Generation Biomedical Materials. Science 2002, 295, 1014–1017. [Google Scholar] [CrossRef] [PubMed] [Green Version]
  3. Jarcho, M. Calcium phosphate ceramics as hard tissue prosthetics. Clin. Orthop. Relat. Res. 1981, 157, 259–278. [Google Scholar] [CrossRef]
  4. Elliott, J.C. Structure and Chemistry of the Apatites and other Calcium Orthophosphates; Elsevier: Amsterdam, The Netherlands; New York, NY, USA, 1994; ISBN 9781483290317. [Google Scholar]
  5. De Bruijn, J.D.; van Blitterswijk, C.A.; Davies, J.E. Initial bone matrix formation at the hydroxyapatite interface in vivo. J. Biomed. Mater. Res. 1995, 29, 89–99. [Google Scholar] [CrossRef]
  6. Ratnayake, J.T.B.; Mucalo, M.; Dias, G.J. Substituted hydroxyapatites for bone regeneration: A review of current trends. J. Biomed. Mater. Res. B 2017, 105, 1285–1299. [Google Scholar] [CrossRef] [PubMed]
  7. Carlisle, E.M. Silicon: A possible factor in bone calcification. Science 1970, 167, 279–280. [Google Scholar] [CrossRef] [PubMed]
  8. Carlisle, E.M. Silicon: An essential element for the chick. Science 1972, 178, 619–621. [Google Scholar] [CrossRef]
  9. Henstock, J.; Canham, L.; Anderson, S. Silicon: The evolution of its use in biomaterials. Acta Biomater. 2015, 11, 17–26. [Google Scholar] [CrossRef]
  10. Gibson, I.R.; Best, S.M.; Bonfield, W. Chemical characterization of silicon-substituted hydroxyapatite. J. Biomed. Mater. Res. 1999, 44, 422–428. [Google Scholar] [CrossRef]
  11. Palard, M.; Champion, E.; Foucaud, S. Synthesis of silicated hydroxyapatite Ca10(PO4)6−x(SiO4)x(OH)2−x. J. Solid State Chem. 2008, 181, 1950–1960. [Google Scholar] [CrossRef]
  12. Marchat, D.; Bouët, G.; Lueckgen, A.; Zymelka, M.; Malaval, L.; Szenknect, S.; Dacheux, N.; Bernache-Assollant, D.; Chevalier, J. Physico-Chemical Characterization and In Vitro Biological Evaluation of Pure SiHA for Bone Tissue Engineering Application. Key Eng. Mater. 2012, 529, 351–356. [Google Scholar] [CrossRef]
  13. Vandiver, J.; Dean, D.; Patel, N.; Botelho, C.; Best, S.; Santos, J.D.; Lopes, M.A.; Bonfield, W.; Ortiz, C. Silicon addition to hydroxyapatite increases nanoscale electrostatic, van der Waals, and adhesive interactions. J. Biomed. Mater. Res. A 2006, 78, 352–363. [Google Scholar] [CrossRef] [PubMed]
  14. Botelho, C.M.; Brooks, R.; Kanitakahara, M.; Ohtsuki, C.; Best, S.; Lopers, M.A.; Rushton, N.; Bonfield, W.; Santos, J.D. Effect of Protein Adsorption onto the Dissolution of Silicon-Substituted Hydroxyapatite. J. Encapsul. Adsorpt. Sci. 2011, 1, 72–79. [Google Scholar] [CrossRef] [Green Version]
  15. Szurkowska, K.; Kolmas, J. Hydroxyapatites enriched in silicon - Bioceramic materials for biomedical and pharmaceutical applications. Prog. Nat. Sci. Mater. Int. 2017, 27, 401–409. [Google Scholar] [CrossRef]
  16. Bose, S.; Tarafder, S. Calcium phosphate ceramic systems in growth factor and drug delivery for bone tissue engineering: A review. Acta Biomater. 2012, 8, 1401–1421. [Google Scholar] [CrossRef] [PubMed] [Green Version]
  17. Treccani, L.; Klein, T.Y.; Meder, F.; Pardun, K.; Rezwan, K. Functionalized ceramics for biomedical, biotechnological and environmental applications. Acta Biomater. 2013, 9, 7115–7150. [Google Scholar] [CrossRef]
  18. Plueddemann, E.P. Silane Coupling Agents; Plenum Press: New York, NY, USA, 1982. [Google Scholar] [CrossRef]
  19. Michelot, A.; Sarda, S.; Audin, C.; Deydier, E.; Manoury, E.; Poli, R.; Rey, C. Spectroscopic characterisation of hydroxyapatite and nanocrystalline apatite with grafted aminopropyltriethoxysilane: nature of silane-surface interaction. J. Mater. Sci. 2015, 50, 5746–5757. [Google Scholar] [CrossRef]
  20. Durrieu, M.C.; Pallu, S.; Guillemot, F.; Bareille, R.; Amédée, J.; Baquey, C.; Labrugère, C.; Dard, M. Grafting RGD containing peptides onto hydroxyapatite to promote osteoblastic cells adhesion. J. Mater. Sci. Mater. Med. 2004, 15, 779–786. [Google Scholar] [CrossRef]
  21. Nelson, M.; Balasundaram, G.; Webster, T.J. Increased osteoblast adhesion on nanoparticulate crystalline hydroxyapatite functionalized with KRSR. Int. J. Nanomed. 2006, 1, 339–349. [Google Scholar]
  22. Bilem, I.; Chevallier, P.; Plawinski, L.; Sone, E.D.; Durrieu, M.C.; Laroche, G. RGD and BMP-2 mimetic peptide crosstalk enhances osteogenic commitment of human bone marrow stem cells. Acta Biomater. 2016, 36, 132–142. [Google Scholar] [CrossRef]
  23. Zurlinden, K.; Laub, M.; Jennissen, H.P. Chemical Functionalization of a Hydroxyapatite Based Bone Replacement Material for the Immobilization of Proteins. Mater. Sci. Eng. Technol. 2005, 36, 820–827. [Google Scholar] [CrossRef]
  24. Schuessele, A.; Mayr, H.; Tessmar, J.; Goepferich, A. Enhanced bone morphogenetic protein-2 performance on hydroxyapatite ceramic surfaces. J. Biomed. Mater. Res. A 2009, 90, 959–971. [Google Scholar] [CrossRef]
  25. Wang, V.; Misra, G.; Amsden, B. Immobilization of a bone and cartilage stimulating peptide to a synthetic bone graft. J. Mater. Sci. Mater. Med. 2008, 19, 2145–2155. [Google Scholar] [CrossRef]
  26. Goonasekera, C.S.; Jack, K.S.; Bhakta, G.; Rai, B.; Luong-Van, E.; Nurcombe, V.; Cool, S.M.; Cooper-White, J.J.; Grøndahl, L. Mode of heparin attachment to nanocrystalline hydroxyapatite affects its interaction with bone morphogenetic protein-2. Biointerphases 2015, 10, 04A308. [Google Scholar] [CrossRef]
  27. Balasundaram, G.; Sato, M.; Webster, T.J. Using hydroxyapatite nanoparticles and decreased crystallinity to promote osteoblast adhesion similar to functionalizing with RGD. Biomaterials 2006, 27, 2798–2805. [Google Scholar] [CrossRef] [PubMed]
  28. Damia, C.; Marchat, D.; Lemoine, C.; Douard, N.; Chaleix, V.; Sol, V.; Larochette, N.; Logeart-Avramoglou, D.; Brie, J.; Champion, E. Functionalization of phosphocalcic bioceramics for bone tissue engineering. J. Mater. Sci. Eng. C 2019, 95, 343–354. [Google Scholar] [CrossRef]
  29. Stadelmann, R.; Hughes, B.; Orlovskaya, N.; Grasso, S.; Reece, M.J. 2D Raman mapping and thermal residual stresses in SiC grains of ZrB2-SiC ceramic composites. Ceram. Int. 2015, 41, 13630–13637. [Google Scholar] [CrossRef]
  30. Dumpala, R.; Kumar, N.; Kumaran, C.R.; Dash, S.; Ramamoorthy, B.; Ramachandra Rao, M.R. Adhesion characteristics of nano- and micro-crystalline diamond coatings: Raman stress mapping of the scratch tracks. Diam. Relat. Mater. 2014, 44, 71–77. [Google Scholar] [CrossRef]
  31. Ishihara, M.; Koga, Y.; Kim, J.; Tsugawa, K.; Hasegawa, M. Direct evidence of advantage of Cu(111) for graphene synthesis by using Raman mapping and electron backscatter diffraction. Mater. Lett. 2011, 65, 2864–2867. [Google Scholar] [CrossRef]
  32. Ueda, H.; Ida, Y.; Kadota, K.; Tozuka, Y. Raman mapping for kinetic analysis of crystallization of amorphous drug based on distributional images. Int. J. Pharm. 2014, 462, 115–122. [Google Scholar] [CrossRef] [PubMed]
  33. Halac, E.B.; Reinoso, M.; Luda, M.; Marte, F. Raman mapping analysis of pigments from Proas Iluminadas by Quinquela Martín. J. Cult. Herit. 2012, 13, 469–473. [Google Scholar] [CrossRef]
  34. Abbas, A.; Josefson, M.; Abrahamsson, K. Characterization and mapping of carotenoids in the algae Dunaliella and Phaeodactylum using Raman and target orthogonal partial least squares. Chemom. Intell. Lab. Syst. 2011, 107, 174–177. [Google Scholar] [CrossRef]
  35. Dubois, F.; Mendibide, C.; Pagnier, T.; Perrard, F.; Duret, C. Raman mapping of corrosion products formed onto spring steels during salt spray experiments. A correlation between the scale composition and the corrosion resistance. Corros. Sci. 2008, 50, 3401–3409. [Google Scholar] [CrossRef]
  36. Clarke, F.C.; Jamieson, M.J.; Clark, D.A.; Hammond, S.V.; Jee, R.D.; Moffat, A.C. Chemical Image Fusion. The Synergy of FT-NIR and Raman Mapping Microscopy to Enable a More Complete Visualization of Pharmaceutical Formulations. Anal. Chem. 2001, 73, 2213–2220. [Google Scholar] [CrossRef]
  37. Gordon, K.C.; McGoverin, C.M. Raman mapping of pharmaceuticals. Int. J. Pharm. 2011, 417, 151–162. [Google Scholar] [CrossRef]
  38. Ewing, A.V.; Wray, P.S.; Clarke, G.S.; Kazarian, S.G. Evaluating drug delivery with salt formation: Drug disproportionation studied in situ by ATR-FTIR imaging and Raman mapping. J. Pharm. Biomed. Anal. 2015, 111, 248–256. [Google Scholar] [CrossRef]
  39. Kazanci, M.; Roschger, P.; Paschalis, E.P.; Klaushofer, K.; Fratzl, P. Bone osteonal tissues by Raman spectral mapping: Orientation-composition. J. Struct. Biol. 2006, 156, 489–496. [Google Scholar] [CrossRef]
  40. Bonifacio, A.; Beleites, C.; Vittur, F.; Marsich, E.; Semeraro, S.; Paoletti, S.; Sergo, V. Chemical imaging of articular cartilage sections with Raman mapping, employing uni- and multi-variate methods for data analysis. Analyst 2010, 135, 3193–3204. [Google Scholar] [CrossRef] [Green Version]
  41. Krafft, C.; Codrich, D.; Pelizzo, G.; Sergo, V. Raman mapping and FTIR imaging of lung tissue: congenital cystic adenomatoid malformation. Analyst 2008, 133, 361–371. [Google Scholar] [CrossRef] [Green Version]
  42. Walcarius, A.; Etienne, M.; Lebeau, B. Rate of Access to the Binding Sites in Organically Modified Silicates. 2. Ordered Mesoporous Silicas Grafted with Amine or Thiol Groups. Chem. Mater. 2003, 15, 2161–2173. [Google Scholar] [CrossRef]
  43. Raynaud, S.; Champion, E.; Bernache-Assollant, D.; Thomas, P. Calcium phosphate apatites with variable Ca/P atomic ratio I. Synthesis, characterisation and thermal stability of powders. Biomaterials 2002, 23, 1065–1072. [Google Scholar] [CrossRef]
  44. Rey, C.; Combes, C.; Drouet, C.; Grossin, D. Bioactive Ceramics: Physical Chemistry. In Comprehensive Biomaterials; Ducheyne, P., Healy, K., Hutmacher, D., Grainger, D.E., Kirkpatrick, J., Eds.; Elsevier: Amsterdam, The Netherlands, 2011; pp. 187–221. [Google Scholar]
  45. Li, H.; Ng, B.S.; Khor, K.A.; Cheang, P.; Clyne, T.W. Raman spectroscopy determination of phases within thermal sprayed hydroxyapatite splats and subsequent in vitro dissolution examination. Acta Mater. 2004, 52, 445–453. [Google Scholar] [CrossRef]
  46. Black, L. Raman spectroscopy of cementitious materials. Spectrosc. Prop. Inorg. Organomet. Compd. 2009, 40, 72–127. [Google Scholar]
  47. Bistričić, L.; Volovšek, V.; Dananić, V. Conformational and vibrational analysis of gamma-aminopropyltriethoxysilane. J. Mol. Struct. 2007, 834, 355–363. [Google Scholar] [CrossRef]
  48. Böhmler, J.; Ploux, L.; Ball, V.; Anselme, K.; Ponche, A. Necessity of a Thorough Characterization of Functionalized Silicon Wafers before Biointerface Studies. J. Phys. Chem. C 2011, 115, 11102–11111. [Google Scholar] [CrossRef]
  49. Damia, C.; Sarda, S.; Deydier, E.; Sharrock, P. Study of two hydroxyapatite/poly(alkoxysilane) implant coatings. Surf. Coat. Technol. 2006, 201, 3008–3015. [Google Scholar] [CrossRef]
  50. Raynaud, S.; Champion, E.; Bernache-Assollant, D. Calcium phosphate apatites with variable Ca/P atomic ratio II. Calcination and sintering. Biomaterials 2002, 23, 1073–1080. [Google Scholar] [CrossRef]
  51. Palard, M.; Combes, J.; Champion, E.; Foucaud, S.; Rattner, A.; Bernache-Assollant, D. Effect of silicon content on the sintering and biological behaviour of Ca10(PO4)6−x(SiO4)x(OH)2−x ceramics. Acta Biomater. 2009, 5, 1223–1232. [Google Scholar] [CrossRef]
  52. ISO 13779-3: Implants for Surgery-Hydroxyapatite-Part 3: Chemical Analysis and Characterization of Crystallinity and Phase Purity. Available online: https://www.sis.se/api/document/preview/80008203/ (accessed on 21 May 2019).
Figure 1. XRD patterns of (a) HA pellet and (b) bare SiHA pellet.
Ceramics 02 00029 g001
Figure 2. AFM surface topographies of (a) bare HA pellet, (b) bare SiHA pellet, (c,e) silanized HA pellets, and (d,f) silanized SiHA pellets. The standard deviation of the RMS values is determined with regard to the average of three values obtained from three different AFM topographies and for each sample. It is worth ± 4 nm for all samples.
Ceramics 02 00029 g002
Figure 3. Raman spectra in the 50–4000 cm−1 wavenumber range of (a) APTES molecule, (b) HA and (c) SiHA bare ceramics.
Ceramics 02 00029 g003
Figure 4. Raman maps of silanized HA and SiHA ceramics. To give an overview of surface properties, three maps of 150 × 150 µm2 are presented for each condition (i.e., each silane and each substrate used).
Ceramics 02 00029 g004
Table 1. Contact angles (°) obtained with water (θw), diiodomethane (θdm) and ethylene glycol (θeg) and surface free energies (mJ/m2), dispersive (γds) and polar (γps) components of substrates calculated from the Owens-Wendt equation (Equation (3)). The standard deviation of the contact angles values is determined with regard to the average of twenty measurements.
SamplesContact Angle (°)Surface Free Energy (mJ/m2)
Mean θw Mean θdmMean θegγds γpsγs
HA62 ± 245 ± 151 ± 2281441
HA-M80 ± 246 ± 154 ± 132537
HA-T88 ± 236 ± 154 ± 240141
SiHA52 ± 240 ± 143 ± 2281947
SiHA-M64 ± 258 ± 151 ± 2231638
SiHA-T69 ± 138 ± 150 ± 233942
Table 2. Percentages of the surface covered by organic compounds calculated from the images presented in Figure 3 and using Particle Analysis module of 4.3 Wire software (Renishaw). The standard deviation of the mean values is determined with regard to the average of the three measurements performed on each substrate.
SubstrateImage 1 (Left)Image 2 (Middle)Image 3 (Right)Mean
HA-M17528 ± 8%
HA-T17231317 ± 5%
SiHA-M1602 ± 3%
SiHA-T2751026 ± 26%
Table 3. Total surface tension of each liquid used (γLV) and its dispersive (γdL) and polar (γpL) components (mJ/m2).
Liquid Total Surface Tension (mJ/m2)γLVγdLγpL
Water72.021.350.7
Diiodomethane50.349.90.4
Ethylene glycol48.429.319.1

