Static Fatigue of SiC Multifilament Tows at Temperatures up to 1200 °C in Air

LMT (CNRS/Ecole Normale Supérieure Paris-Saclay) 61, avenue du Président Wilson, 94230 Cachan, France
Ceramics 2019, 2(3), 426-440; https://doi.org/10.3390/ceramics2030033
Submission received: 5 May 2019
/
Revised: 23 May 2019
/
Accepted: 25 June 2019
/
Published: 1 July 2019
(This article belongs to the Special Issue Damage and Lifetime of Ceramic Matrix Composites)
Abstract
:SiC-based fibers are sensitive to delayed failure under constant load at high temperatures in air. Static fatigue at intermediate temperatures < 800 °C was attributed to slow crack growth from flaws located at the surface of fibers, driven by the oxidation of free carbon at grain boundaries. The present paper examines the static fatigue behavior of SiC-based Hi-Nicalon fibers at high temperatures up to 1200 °C and Hi Nicalon S fibers at intermediate temperatures (500–800 °C). The degradation of stress- rupture time relation of multifilament tows with increasing temperature was investigated. Predictions of tow lifetime based on critical filament-based model of tow failure were compared to experimental stress-rupture time diagrams. Critical filaments are characterized by strength–probability relation. The critical filament-based model was found to describe satisfactorily the static fatigue behavior of fiber tows at these temperatures. The influence of various factors on lifetime as well as the origins of variability is analyzed.
1. Introduction
Continuous fiber reinforced ceramic matrix composites (CMCs) exhibit a combination of superior properties over monolithic ceramics which makes them attractive for high temperature applications. This results from the presence of fiber reinforcement that is responsible for damage tolerance, high resistance to fatigue, to creep, and to fracture, and reliable behavior. Furthermore, the CMCs are endowed with a remarkable faculty of versatility. Which means that the behavior of CMCs can be tailored with respect to expected performances through the selection of appropriate fiber and matrix types.
Filament tows that form composite preform (one-dimensional (1D), two dimensional (2D), three-dimensional (3D)) are fundamental constituents that warrant attention with respect to the above considerations. Their mechanical behavior under various conditions of loading, environment and temperature must be well documented. The present paper investigates the static fatigue behavior of SiC-based Hi-Nicalon and Hi Nicalon S fiber tows at high temperatures up to 1200 °C in air. SiC-based fibers are employed for the reinforcement of SiC-matrix composites.
The delayed failure of SiC-based multifilament tows in air was essentially investigated at intermediate temperatures (between 500–800 °C). It was found to result from slow crack propagation from surface defects, as a result of the consumption of the free carbon at grain boundaries and the local stresses induced by the SiC → SiO2 transformation at the crack tip [1,2,3]. Both phenomena may contribute simultaneously (Nicalon fibers) or sequentially (Hi-Nicalon S and SA3 fibers, which contain a little free carbon not connected) [3]. The Hi Nicalon fiber is essentially made of ~10 nm β-SiC nano-grains and a free carbon network [3]. Furthermore, sensitivity to delayed failure was found to decrease with the amount of oxygen present in the environment [3]. The power function V = A KIn has been shown to provide a sound description of subcritical crack propagation, although the exact relationship between crack velocity V and stress intensity factor KI is not known [1,2,4,5].
Most of the papers in the literature on high temperature behavior of fibers and composites examined either the creep behavior under constant load (at temperatures > 1200 °C), or strength degradation of after heat treatment or oxidation (at temperatures (> 1000 °C) on unloaded fibers. Strength degradation of fibers was attributed to various phenomena including flaw size increase, nucleation of new flaws, formation of silica layer on the surface of fibers and grain growth [6,7,8,9,10,11,12,13,14,15]. Lara-Curzio [13,14] modeled the stress-rupture time behavior of fiber bundles and composites. Delayed failure was attributed to the formation of a silica layer on fiber surface; the thickness of this layer was introduced in place of the critical flaw size in the linear fracture mechanics equation of strength. An outcome of this model is that fiber bundle strength decreases with time as t−1/4, which corresponds to a fiber type independent stress exponent (denoted n in the paper) n = 4. For modeling strength loss by oxidation of unloaded SiC fibers, Parthasarathy et al. [15] postulated also that the loss in fiber strength is predictable by assuming the strength-limiting flaw to be the same size as the scale thickness. DiCarlo et al. [7,12,16,17] examined the strength dependence on time, temperature and size for a variety of oxide and SiC-based fibers. Their phenomenological approach that was based on empirically determined Larson-Miller and Monkman-Grant rupture plots is restricted to fiber comparison purposes.
The present paper investigates the static fatigue behavior in air at intermediate temperatures (500–800 °C) for Hi Nicalon S fibers and at high temperatures (500–1200 °C) for Hi-Nicalon tows, on the basis of results of static fatigue tests on tows and single filaments and predictions of the lifetime of the critical filaments in tow. Critical filaments are characterized by strength–failure probability relation. The influence of various factors on lifetime as well as the origins of lifetime variability is analyzed.
2. Theory
2.1. Single Filaments
2.1.1. Slow Crack Growth under Constant Stress
The subcritical crack growth model is based on the simple power form of crack velocity versus stress intensity factor, which is usually employed to describe the slow propagation of cracks caused by environment under load in ceramics and glass materials [18,19,20,21]:
where V is crack velocity, a is crack length, t is time, KI is the stress intensity factor, KIC is the critical stress intensity factor and V* and n are constants depending, respectively, on environment and material. The environment dependence of V* is assumed to be defined by the Arrhenius law:
where T is temperature, V0* is temperature independent material parameter, Ea is activation energy (Table 1) and R = 8.314 J K−1 mol−1.
2.1.2. Filament Residual Strength
During time period tF under constant stress σ on filament, crack propagates from initial flaw size ai to length aR, and the stress intensity factor increases from KIi to KIR. The basic equation for time period tF is derived from Equation (1):
where Y is the flaw shape parameter ( for a penny-shaped crack).
Integrating gives:
From the following relations in Equation (5) between initial flaw size ai, crack size aR, applied stress σ, filament strengths σf and relevant stress intensity factors, the relations in Equation (6) is derived:
where σf is the filament reference tensile strength in the absence of slow crack growth (it will be referred to as the reference strength) and σR is the residual strength.
Introducing relations (6) into Equation (4) leads to the expression of residual strength σR:
Filament strengths display wide variability as a result of random distribution of fracture inducing flaws. Filament initial strength σf generally follows a Weibull statistical distribution:
where P is failure probability, m and σ0 are statistical parameters, v is the volume of a single filament and v0 is reference volume (v0 = 1 m3 in the present paper); strengths being ordered from smallest to largest. The reference strength of the jth filament with failure probability Pj is derived from Equation (8):
2.1.3. Filament Lifetime
Failure occurs when filament residual strength σR has decreased to the applied stress σ. Filament lifetime is derived from Equation (4) or σR = σ:
The Strength-Probability-Time relation for filaments is derived from the combination of Equations (9) and (10) [23]:
where P(t, σ, v) is the failure probability at time t, under constant stress σ, for a filament with volume v. t* is a stress dependent scale factor: .
2.2. Stress-Rupture Time Diagrams for Tows
Slow Crack Growth in Fiber Tows
The bundle model [24,25,26] describes the behavior of a population of parallel, independent and identical filaments under a tensile load. When a filament breaks the surviving filaments carry equally the applied load. The corresponding force on tow is:
where σ is the stress on surviving filaments. Note that σ ≥ strengths of those N filaments that failed. Sf is filament cross sectional area; N0 is the initial number of filaments carrying the load. α = N/N0 is the fraction of fibers broken individually, which represents the failure probability P of the Nth filament, with filament strengths being in ascending order.
Under constant and uniform applied strain εa, the stress σ on surviving filaments is constant according to Equation (13):
where Ef is filament Young’s modulus. The force carried by tow decreases when filaments break (Equation (12)). The lifetime of tow is reached when F = 0 and N = N0. It is given by Equation (10) for the extreme value of σf.
Under constant force F, according to Equation (12), σ increases when a filament fails. This filament exhibits the longest lifetime dictates lifetime of tow. It is referred to as critical filament. Under constant strain, this is the strongest filament in the tow. Under constant force, when the filaments fail one after one, the critical filament is defined by the following expression of failure probability associated to this filament strength in the filament strength distribution [27]:
The lifetime of a tow is given by the following equation derived from Equation (10) for the value of probability that defines the critical filament, i.e., P = αt under constant force when filaments are independent and fail one after one.
3. Static Fatigue Tests
3.1. Determination of Stress-Rupture Time Diagrams
Experimental stress-rupture time results have been produced on single filaments and on fiber tows. The principle of the test is to measure the rupture time of a test specimen subjected to constant load at high temperature in controlled air.
The static fatigue-loading mode is generally constant force. The disadvantage of this technique for testing tows and continuous fiber reinforced composites is that the stress state is not constant over time: the stress on filaments increases when a load-carrying filament fails.
The alternative loading technique consists in applying constant deformation. The advantage of this technique for tow testing is that the stress state is uniform and constant. It was successfully applied to glass fibers at room temperature [18]. It requires reliable deformation measurement at high temperature for long time.
Static fatigue tests under constant force were carried out on Hi-Nicalon and Hi-Nicalon S fibers (Nippon Carbon, Tokyo, Japan) at temperatures between 500 and 1200 °C in air. These SiC-based fibers present interesting properties for SiC/SiC composite reinforcement. They are produced as tows of 500 filaments having average diameter of 15 µm each. Single filaments were tested separately [2]. The cross sectional area of tows St was derived from the mass of tows [1,2] using the following equation:
where g is gravity constant, ρ is tow density, l0 is the gauge length and mt is tow mass.
The experimental procedure was detailed in previous papers [2,4,23,28]. Only the main features are repeated here. The gauge length is defined as the distance between the grips (25 mm). It was located in the furnace hot-zone at uniform temperature (hot grip technique). A silica tube protected the test specimen and allowed environment control through a constant gas flow (N2/O2). The test specimens were heated up to the test temperature before loading (heating rate ~ 20 °C/min). Then a dead-weight-load was hung slowly (this operation took < 10 s). Computer captured lifetime automatically when specimen failed. The fractured specimens were examined using scanning electron microscopy.
3.2. Determination of Filament Slow Crack Growth Parameters
The slow crack growth parameters were estimated from statistical distribution of rupture times measured at given stress on single filaments tested separately [2]. Tests on single filaments provide intrinsic estimates since filaments are free of external phenomena that affect the stress state.
Rupture times were ordered from smallest to largest and the cumulative distributions of rupture times P(tj) were obtained using the following estimator (Figure 1):
where tj is the jth rupture time under constant stress σ and Nt is the total number of specimens.
The slow crack growth constants n and V*(T) were estimated by fitting Equation (11) to the experimental distributions of rupture times (Figure 1) [23]. The activation energy Ea and the temperature independent constant were derived from the values of V*(500 °C) and V*(800 °C) estimated from rupture time distributions at 500 and 800 °C respectively [23]. The values of V*(900 °C), V*(1000 °C) and V*(1200 °C) were calculated using Equation (2). The characteristics of the filaments required for the calculations are summarized in Table 1.
4. Results
4.1. Stress—Rupture Time Diagrams for Tows
4.1.1. Intermediate Temperatures (500–800 °C)
As has been established in previous papers [1,2], the rupture time of tows decreases with increasing applied stress or strain and intermediate temperatures (Figure 2). The stress-rupture time diagram is fitted by the following relation at temperatures ≤ 800 °C with a reasonable scatter, as opposed to the single filaments that exhibited a statistical distribution of lifetimes at given stress, due to the presence of populations of flaws [23]:
where A and p are constants.
The estimated values of A and p are given in Table 2. The stress exponent is temperature independent whereas the constant A decreases with increasing temperature.
The strain-rupture time diagrams of Figure 2 show that Hi Nicalon and Hi Nicalon S exhibit comparable fatigue behavior when subjected to the same initial strain. This result can be related to the opening displacement of flaws. It is consistent with the mechanism of slow crack growth by oxidation of grain boundaries that initiates from surface located flaws [2,3]. It has been demonstrated that the delayed failure of SiC-based fibers at temperatures below 800 °C results from the sub-critical crack growth of the surface defects by the oxidation of the grain boundaries (free carbon) and the SiC nanograins at the crack tip [2,3].
The relative values of constant A indicate that the Hi Nicalon S fiber is more resistant to static fatigue than the Hi Nicalon fiber when they are subjected to the same stress.
Specimen deformations were found to be negligible during the tests, which indicates that the Young’s modulus remained constant. It also suggests that the fibers did not experience significant overall degradation.
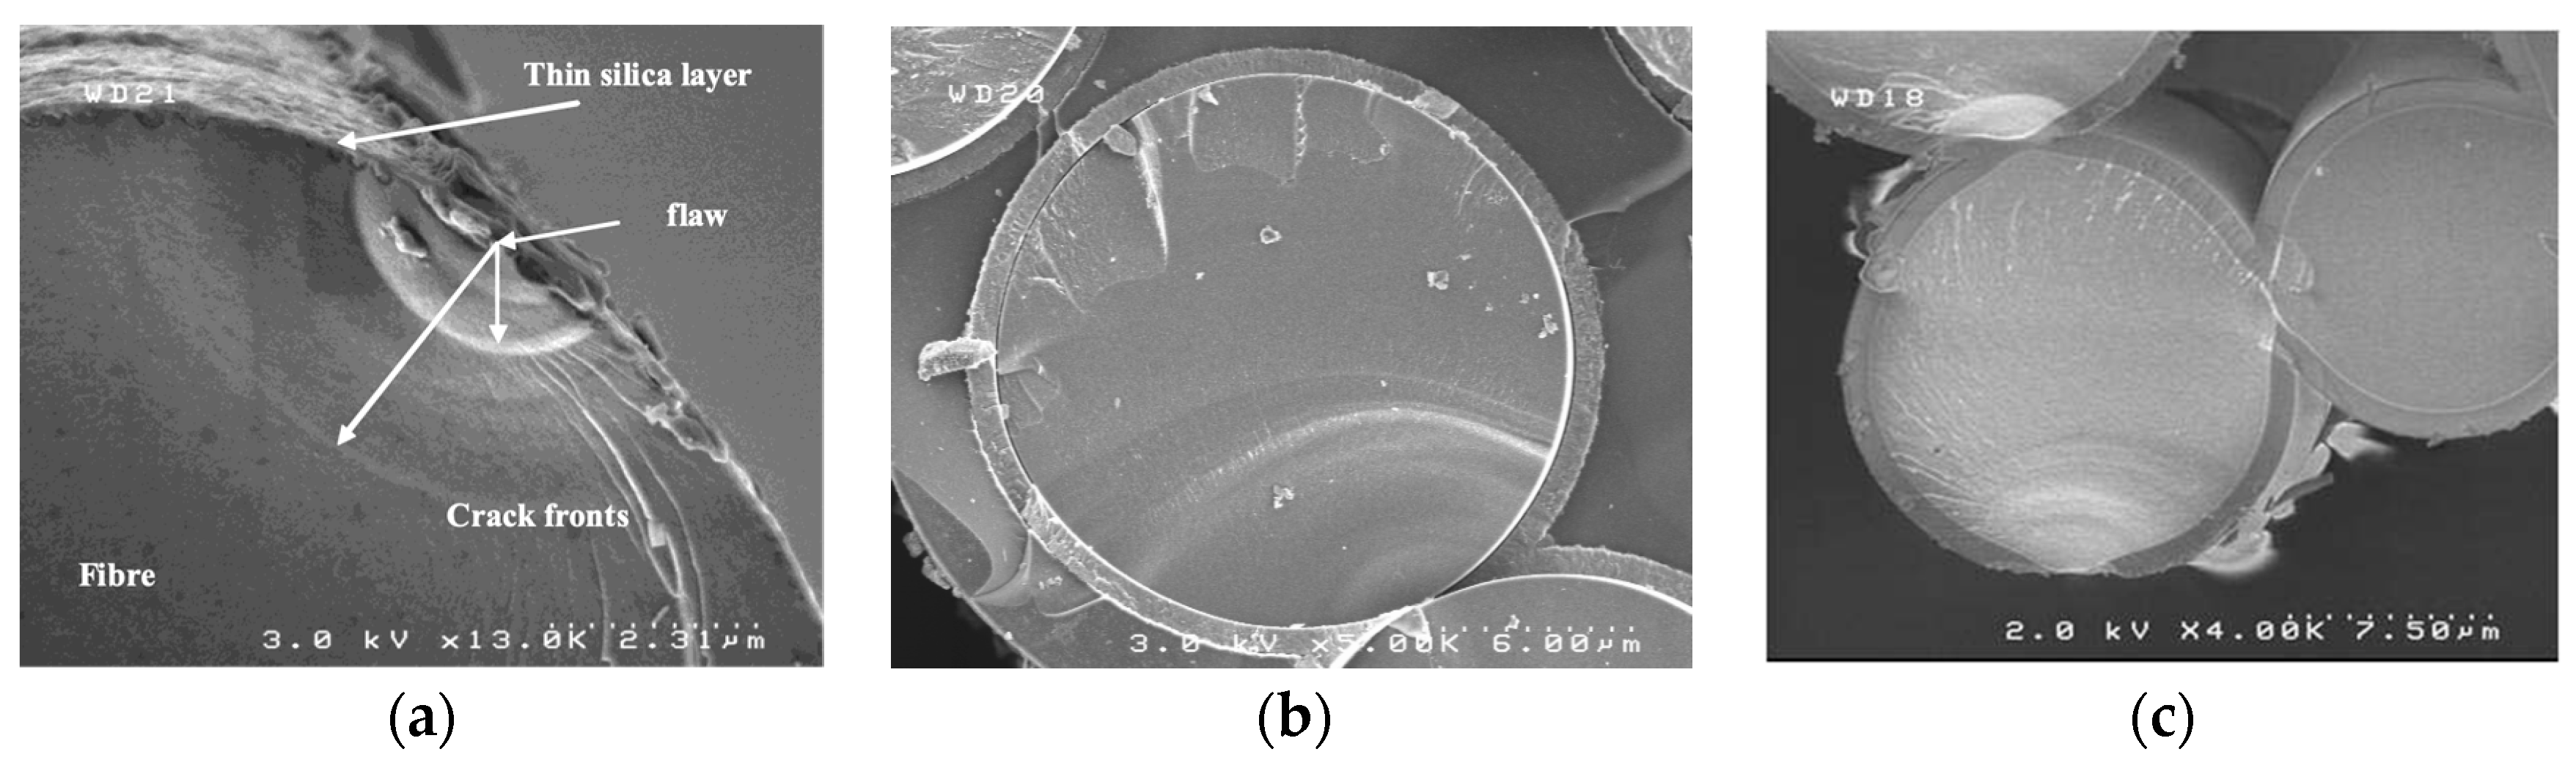
Scanning Electron Microscopy (SEM) on fiber tows after static fatigue showed the presence of fracture patterns of successive crack tips in the fracture surface of fibers, indicative of slow crack growth (Figure 3). The cracks were initiated from a pre-existing surface flaw (Figure 3a) or from the contact point of two fibers (Figure 3b). Fibers with a fracture mirror were also identified, which indicated that they experienced brittle fracture at instability when the critical fiber fails and the remaining fibers are unable to carry the load. A thin film of oxide was observed at these temperatures on the external surface of fibers. The analyses showed that the growth of the silica scale on filaments is not responsible for fracture [3]. It was also found that growth of the silica layer and oxygen diffusion is enhanced under load [3].
4.1.2. Temperatures ≥ 900 °C
At temperatures ≥ 900 °C, shorter rupture times were measured under various constant loads. More significant scatter in rupture times at given stress is also observed (Figure 4). Fitting Equation (18) to the stress-rupture time data diagram led to the estimates of p and A given in Table 3. These estimates show a trend at variance with that observed at intermediate temperatures: they both increase significantly with temperature.
Three types of fracture surfaces indicative of different failure modes were evidenced by SEM:
- Slow crack growth fracture patterns, similar to intermediate temperatures.
- Fracture mirrors after fatigue at 900 °C, while no fracture mirrors were detected at higher temperatures.
- Smooth fracture surfaces in groups of stuck fibers which were located in the plane of the slowly propagated crack (Figure 3c).
The oxide scale was much thicker at 1000 °C on those fibers having the same lifetime. Stuck fibers formed groups.
Strain measurement at 1000 °C showed the absence of anelastic deformation during static fatigue. Creep deformations were observed at 1200 °C at stresses larger than 200 MPa. The mechanism of slow crack growth played a leading role in the fracture of fibers and tows at 900 °C, 1000 °C and 1200 °C.
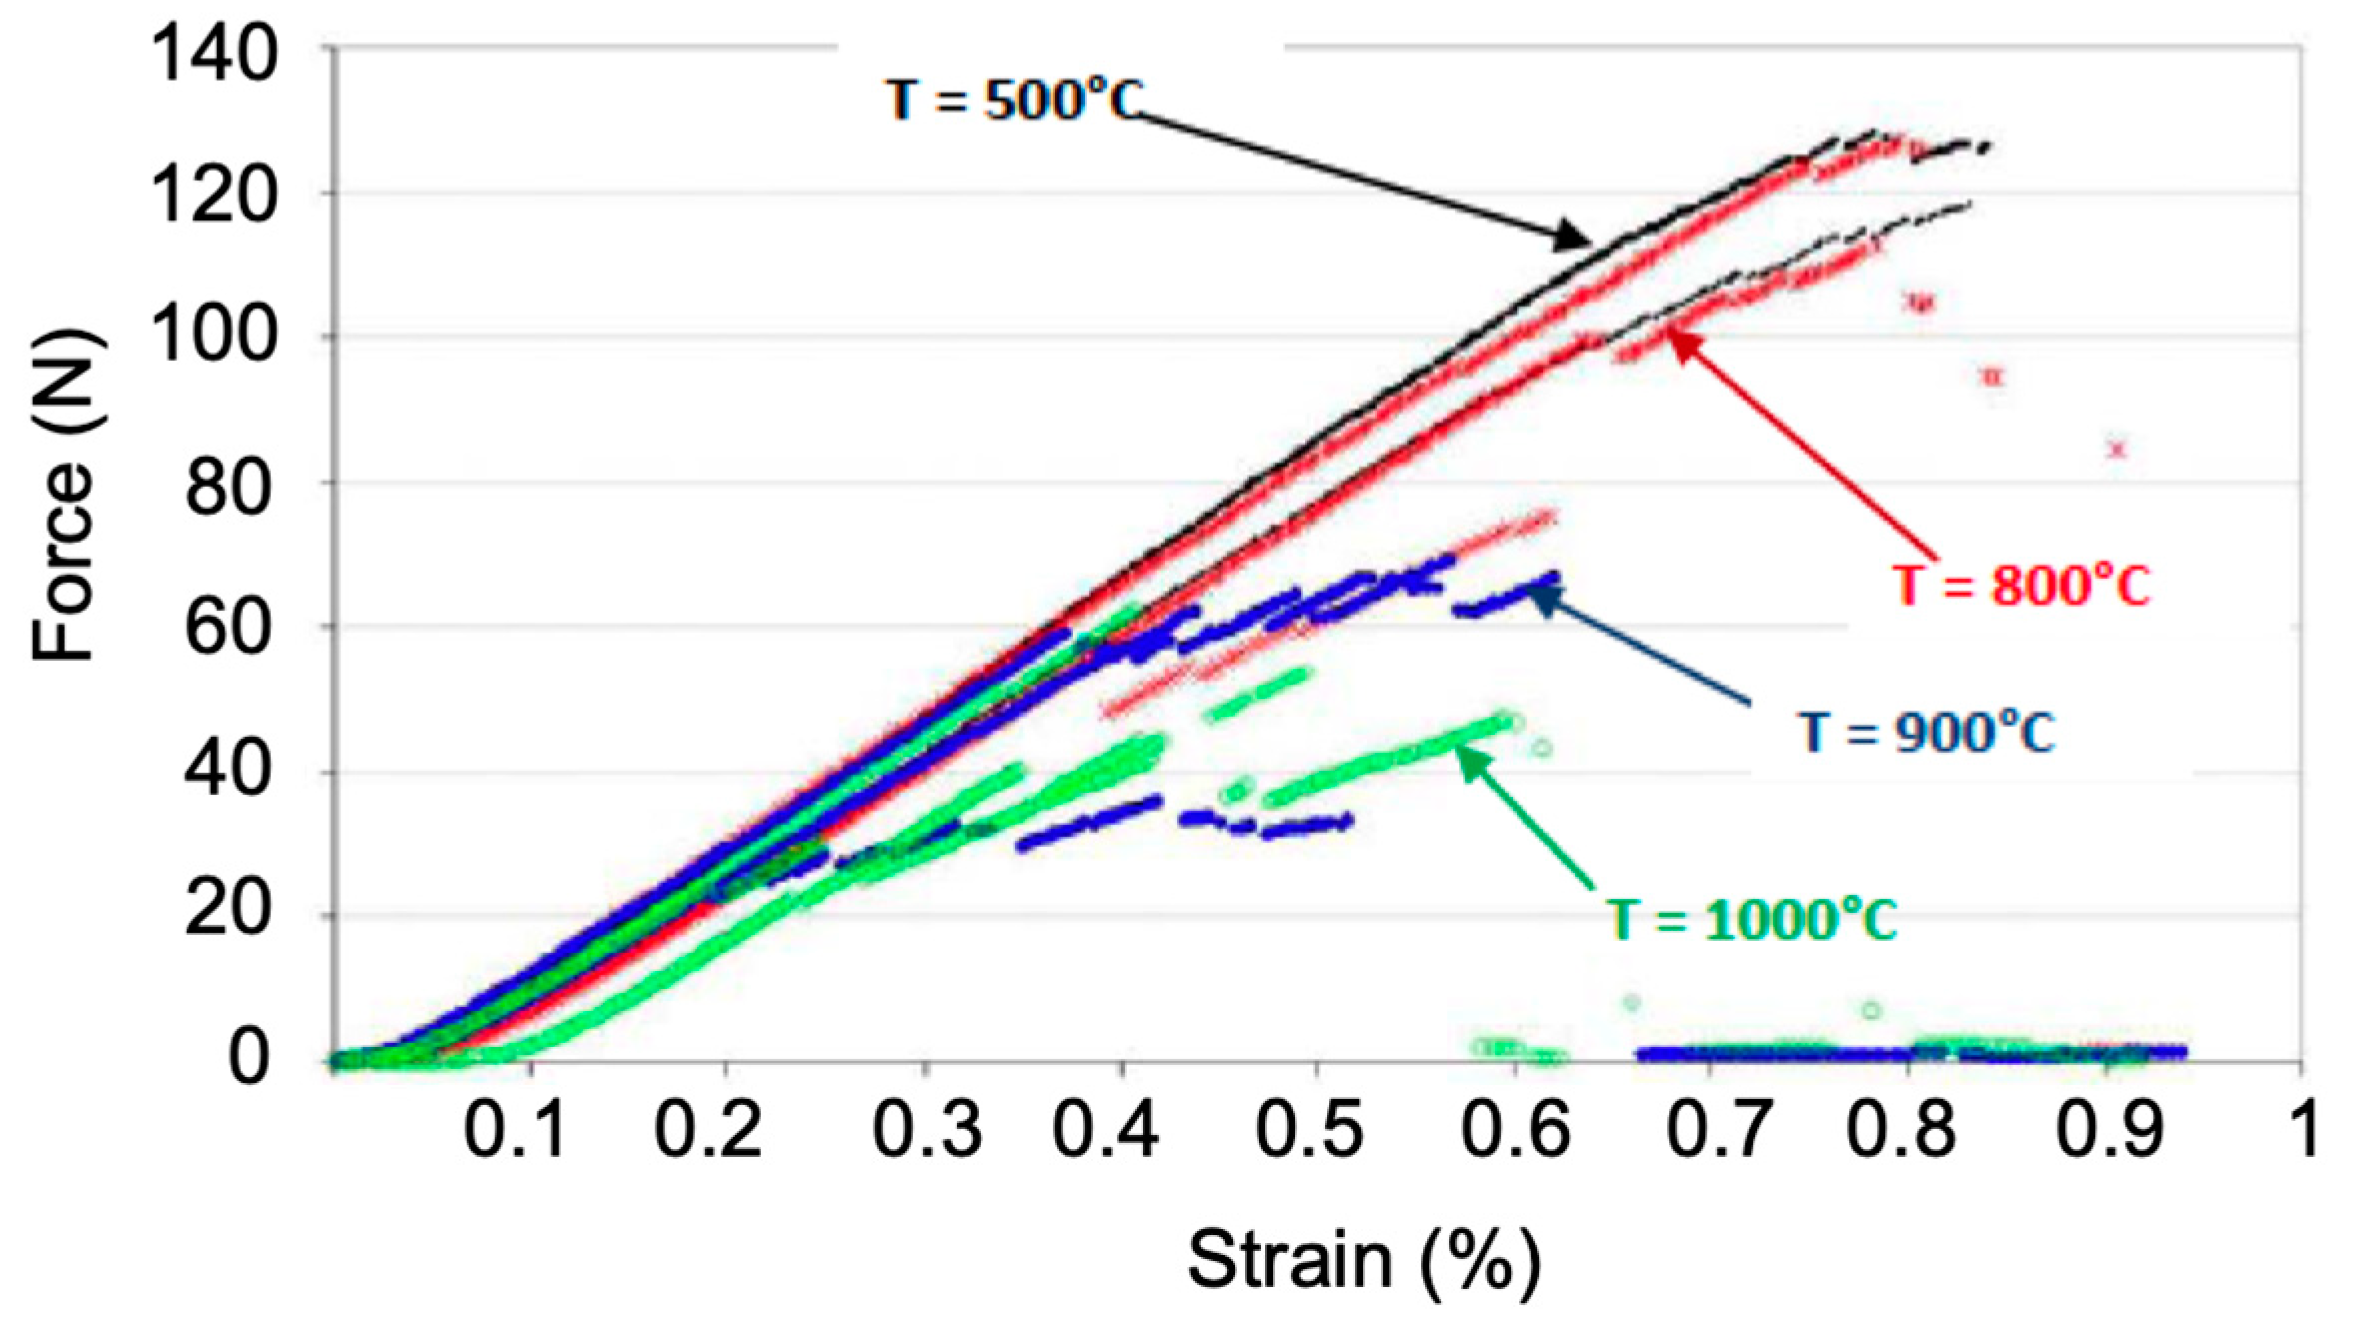
The bonding of fibers by the oxide scale weakened the tows. This effect is illustrated by tow tensile behavior at room temperature after interrupted static fatigue tests (15 min–2 h under a stress of 0.2 MPa). Figure 5 shows that the residual stress-strain behavior is highly dependent on the static fatigue test temperature. After fatigue at 500 °C, the stress-strain behavior is identical to that reference one obtained on as-received tows. The rupture stress is unchanged (1800 MPa, 130 N) and the stress-strain curves exhibit the typical downward curvature reflecting individual fiber breaks prior to ultimate failure. The elastic limit is about 1300 MPa (100 N).
After static fatigue at higher temperatures, the stress-strain behavior was tremendously affected. The failure stress decreased as low as 500 MPa (35 N), well below the elastic limit of reference behavior. The strength decrease is commensurate with the test temperature (Table 4). It can be attributed to the increasing size of groups of bonded fibers. The curve does not exhibit a continuous downward curvature, but instead load drops and linear segments, reflecting the failure of groups of fibers.
4.2. Stress-Rupture Time Diagrams for Particular Filaments
The experimental stress-rupture time diagrams were compared to the static fatigue behavior of particular single filaments identified by their reference strength measured in the absence of slow crack growth and environmental effects. These filaments are referred to as critical filaments because their individual failure corresponds to tow instability. Filament strengths exhibit a statistical distribution, so that the associated failure probability is a convenient equivalent way of identifying a particular filament. The strengths being in ascending order, failure probability represents the fraction α of individually broken fibers [24]. The stress-rupture time diagrams were calculated using Equation (15) for critical fibers having the following values of failure probability: P = 0.12 = αt, the theoretical critical fraction of fibers broken individually in static fatigue derived tows derived from Equation (14), P = 0.04 and P = 0.002 = 1/500, the probability of fracture of the weakest fiber.
Figure 6 compares the experimental stress-rupture time diagrams obtained on tows to the diagrams predicted for particular filaments. It allows the critical filament responsible for tow instability during fatigue to be identified. The comparison of filaments and tows lifetimes reveals variability in critical fiber. In Figure 6a, the interval of tow lifetimes is bounded by the lifetimes of the weakest filament (P = 0.002) and those of the theoretical critical fiber (P = αt = 0.12), while most of the data fell close to the upper bound P = 0.12. On SiC Nicalon tows, Forio et al. [1] measured values of P = α at instability 0.008 and 0.076 using acoustic emission data. These results are at variance with theory that predicts no scatter (Equation (14)). During static fatigue under constant force, the filaments fail one by one or by groups. The size of a group depends on oxidation rate, temperature and lifetime. The strength of a group depends on the composition of the group in terms of strengths of the filaments present in the group.
Furthermore, when considering a given value of rupture time, the data indicate a weakening of tows, which reflects the presence of weaker critical fibers, whjch can be logically attributed to interfiber mechanical interactions that affect the stress state in tows [24]. Note that at 500 °C, there was no significant oxide scale on the fibers. DiCarlo and Yun [29] performed TGA (thermal gravimetric analysis) studies, which suggest that the primary strength degradation mechanisms of tow strength decrease after thermal treatment in air were sizing removal, intrinsic carbon layer removal, and fiber-fiber bonding by surface oxide growth.
At 800 °C, the same trend was observed on Hi Nicalon and Hi Nicalon S tows (Figure 6b,c). However, most data were located in the vicinity of the lower bound, suggesting weaker critical fibers when comparing with results at 500 °C. For the few data that fall below the lower bound, fractures might have been caused by extrinsic flaws that are more severe than the pre-existing flaws, such as contact point flaws as observed by SEM (Figure 3).
At temperatures ≥ 900 °C, lifetime looked controlled by the weakest fiber, while some premature ruptures may be noted on Figure 6d–f. These trends agree with the SEM observations and the temperature dependence of residual behavior that highlight the effect of growth of oxide scale on fibers in tows. The lifetime of tows remained comparable to that of weakest single filament, which indicates that the phenomenon of slow crack growth was not slowed down by the oxide scale.
Figure 7 summarizes the above trends in the influence of temperature. It highlights the temperature threshold at 900 °C above which lifetime becomes preponderantly dictated by the weakest fibers.
5. Discussion
5.1. Comparison of n and p
Results show that p is significantly different from the intrinsic slow crack growth exponent n derived from the statistical distribution of single filaments lifetimes (Table 1). The p estimate cannot be confused with the value of the n exponent of the Equation of slow crack growth. The value of p was obtained from data points at different values of probability (or σf). According to Equation (11), at constant σf (or probability), the values of t for various values of σ, correspond to a unique value of n. Variability in the p estimate results from the structural phenomena that affect the critical fiber in tow by fiber contacts, bonding and reloading. As a consequence, Equation (18) is not robust.
An important implication is that the slow crack growth parameters must be derived from the statistical distribution of lifetimes of filaments tested separately under a given constant and uniform tensile stress. For this purpose note that two methods can be used: fitting either the Equation (11) or the linearized Equation (19) to the experimental distribution of lifetimes. The following linearized Equation is obtained for t > t*:
Figure 1 illustrates the method of curve fitting.
5.2. Influence of Initial Applied Stress on Stress—Rupture Time Diagrams
Uncertainty in the value of applied stress might be a second cause of variability in stress-rupture diagrams obtained on tows under constant force. The initial applied stress generally used is smaller than the actual stress operating on the critical fiber as a result of reloading during individual failure of filaments. This discrepancy is negligible at low stresses and αc:
Δσ/σ = −αc/(1 − αc)
It increases with applied stress and with α according to Equation (20). However, the maximum uncertainty is about 140 MPa for α = αt = 0.12 and σ = 1200 MPa. Thus, taking the initial stress underestimates the actual stresses on critical fiber so that the stress—rupture time curve is slightly steeper.
Another cause might be the loading history of filaments. As filaments fail individually, the stress on the critical filament increases, so that the measured lifetime is different from that that would have been obtained if the stress at failure were kept constant during the total lifetime. As a consequence, the lifetime associated to initial applied stress is overestimated. It seems that underestimation of the stress on critical fiber is counterbalanced, and that the stress-rupture time diagram is not tremendously affected.
5.3. Variability in Critical Fiber Strength
The models [23,24,27] and SEM fractography support the concept of critical fiber that governs instability in tow behavior. Fracture mirrors reflected brittle fracture of fibers (at T ≤ 900 °C) and smooth surfaces fracture of groups of bonded fibers (T = 1000 °C) after the failure of individual fibers by slow crack growth. Forio et al. [1] measured values of α at instability (α) 0.008 and 0.076 on Nicalon tows using acoustic emission data. The theoretical value of α derived from Equation (14) is about 0.12 for Hi Nicalon and Hi Nicalon S fiber tows.
The simulations performed in [27] showed that intermediate and high strength filaments are broken as well during slow crack growth, as a result of increase of the stress on filaments, whereas few filaments at low strength extreme failed. As indicated above, under a constant deformation, the maximum lifetime is that of the filament having maximum reference strength. By contrast, the maximum lifetime under a constant force is obtained for a critical filament identified by P = αc ≤ αt (αt = 0.12, for the fibers of this paper (Equation (14)). When fibers fail according to ascending strength order, it seems reasonable to consider that P = αc ≤ 0.12 defines the critical filament that controls the lifetime of tow under constant force. Shorter lifetimes and smaller αc were obtained when filaments did not fail independently. Simulations [27] for particular scenarios of fiber failures by groups confirmed that αc ≤ 0.12. However, it was assumed that the weakest filaments acted as initiating filaments at least during the initial steps. This means that they were not located within a group of bonded fibers, which would protect the weakest filaments against slow crack growth. This configuration would lead to tows more resistant to slow crack growth, and αc > αt. The probability of occurrence of this configuration is not nil.
Slow crack growth initiates from surface located flaws. Previous studies on Nicalon fibers have shown that fibers contain concurrent populations of flaws located at the surface and in the volume of fibers [30]. Brittle fracture at room temperature generally occurs from surface located flaws at lower strength extreme, and from volume-located flaws at higher strength extreme. Thus, the weaker fibers should be prone to slow crack growth, whereas the stronger fibers that fail from volume flaws at room temperature should be less sensitive to slow crack growth since they contain less severe surface flaws than the weaker fibers. This bimodal distribution of fibers may influence the critical fiber. However, this phenomenon has not received attention yet. The distribution of flaws in Hi Nicalon and Hi Nicalon S has not been investigated deeply.
Thus, it appears that there are extrinsic causes to the variability for tow lifetime: that are related to fiber distribution and independence in the tow, which affects the stress state on filaments. The extrinsic causes are events erratic in nature that do not follow classical statistical distributions. Anyway, it can be foreseen that the tow with the lowest resistance to slow crack growth will dictate lifetime of a population of tows as encountered in composites. This issue will be more deeply investigated in a forthcoming paper.
5.4. Influence of Oxidation
Growth of oxide scale at fiber surface exerts essentially a structural effect by fiber bonding. The oxide scale affects lifetime by the creation of fiber aggregates, which weakens the tows. However, the comparison of tow and filament lifetimes did not reveal a slowdown of crack growth or a strength increase. Typical crack patterns indicative of slow crack growth were observed for temperatures up to 1200 °C [4,28]. Then, it was shown in [3] that fiber elongation favors the oxygen diffusion through the oxide layer. Thus, at temperatures up to 1200 °C, slow crack growth seems to dictate delayed failure of tows. The critical fiber strength is affected by creation of aggregates of fibers as temperature increases above 900 °C.
The effect of crack blunting by oxide scale was not shown by the results, which agrees with the previous result that showed that the oxide scale did not slow down the process of crack growth. Under load, slow crack propagation initiates from flaws before the effect of oxidation is effective. For the same reason, the mechanism of decreasing flaw size due to the recession of the fiber surface that was postulated by Parthasarathy et al. [15] for the effect of oxidation on unloaded fibers does not seem to operate significantly on fibers subjected to constant load.
6. Conclusions
The paper has shown that the static fatigue behavior of SiC Hi Nicalon tows at high temperatures (up to 1200 °C) in air is dictated by the delayed failure of a critical filament. Failure of this critical filament results from slow crack growth initiated from a surface located flaw. This critical filament is characterized by initial strength-failure probability relation. It depends on loading mode and temperature. Under constant load, when filaments remain independent as observed at relatively low temperature (500 °C), the critical filament is characterized by initial strength value corresponding to the theoretical value of failure probability αt = 0.12. When temperature increases, the critical filament is characterized by lower values of initial strength and failure probability. Filament characteristic failure probability decreases to 0.002, corresponding to the weakest filament in the tow. Lower values may be observed when extrinsic flaws are created by interfiber contact. The growth of oxide scale on fiber surface fosters the formation of groups of bonded fibers that fail simultaneously, which weakens the tow.
Variability in lifetimes results from phenomena that minimize the independence of filaments in tow, including interfiber friction or bonding by oxide scale. These phenomena are erratic, so that their occurrence cannot be predicted using conventional continuous relations. Their occurrence remains between bounds, corresponding to the theoretical and the minimum values of initial strength-failure probability relation. The size of interval decreases with increasing temperature, to minimum given by the strength of the weakest filament in tow having probability of 0.002. Lower values of lifetime can be obtained when extrinsic flaws are created by fiber contact.
These phenomena affect deeply the stress-rupture time diagram of tows which exhibits more or less lifetime loss. The corresponding estimate of stress exponent of the power law is smaller than the slow crack growth constant n. It should not be confused with n.
The failure of tows in static fatigue is driven by slow crack growth mechanism from surface flaws at all temperatures ≤ 1200 °C, even in the presence of oxide scale. The mechanism during static fatigue is different from that considered in the literature for the strength degradation of unloaded fibers.
Funding
This research received no external funding.
Acknowledgments
The author acknowledges the contribution of former Ph.D. students Dr. A. Laforêt and Dr. W. Gauthier, who produced experimental static fatigue results.
Conflicts of Interest
The author declares no conflict of interest.
References
- Forio, P.; Lavaire, F.; Lamon, J. Delayed failure at intermediate temperatures (600 °C–700 °C) in air in silicon carbide multifilament tows. J. Am. Ceram. Soc. 2004, 87, 888–893. [Google Scholar] [CrossRef]
- Gauthier, W.; Lamon, J. Delayed failure of Hi-Nicalon and Hi-Nicalon S multifilament tows and single filaments at intermediate temperatures (500–800 °C). J. Am. Ceram. Soc. 2009, 92, 702–709. [Google Scholar] [CrossRef]
- Gauthier, W.; Lamon, J.; Pailler, R. Oxidation of silicon carbide fibers in air at intermediate temperature during static fatigue in air at intermediate temperatures. J. Am. Ceram. Soc. 2009, 92, 2067–2073. [Google Scholar] [CrossRef]
- Laforet, A.; Lamon, J. Static fatigue of multifilament tows at high temperatures above 900 °C. Ceram. Eng. Sci. Proc. 2010, 31, 173–184. [Google Scholar]
- Ladeveze, P.; Genet, M. A new approach to the subcritical cracking of ceramic fibers. Comput. Sci. Technol. 2010, 70, 1575–1583. [Google Scholar] [CrossRef] [Green Version]
- Berger, M.; Hochet, N.; Bunsell, A.R. Small diameter SiC-based fibers. In Fine Ceramic Fibers; Bunsell, A.R., Berger, M.H., Eds.; Marcel Dekker: New York, NY, USA, 1999; p. 265. [Google Scholar]
- Yun, H.M.; Di Carlo, J.A. Time/temperature-dependent tensile strength of SiC and Al2O3-based fibers. In Ceramic Transactions, Advances in Ceramic-Matrix Composites II; Bansal, N.P., Singh, J.P., Eds.; American Ceramic Society: Westerville, OH, USA, 1996; Volume 74, pp. 17–26. [Google Scholar]
- Bodet, R.; Bourrat, X.; Lamon, J.; Naslain, R. Tensile creep behaviour of a silicon carbide fiber with a low oxygen content. J. Mater. Sci. 1995, 30, 661–677. [Google Scholar] [CrossRef]
- Bunsell, A.R.; Piant, A. A review of the development of three generations of small diameter silicon carbide fibers. J. Mater. Sci. 2006, 41, 823–839. [Google Scholar] [CrossRef]
- Shimoo, T.; Okamura, K.; Mutoh, W. Oxidation behavior and mechanical properties of low-oxygen SiC fibers prepared by vacuum heat-treatment of electron-beam-cured poly(carbosilane) precursor. J. Mater. Sci. 2003, 38, 1653–1660. [Google Scholar] [CrossRef]
- Sha, J.J.; Park, J.S.; Hinoki, T.; Kohyama, A. Tensile properties and microstructure characterization of Hi-Nicalon SiC fibers after loading at high temperature. Int. J. Fract. 2006, 142, 1–8. [Google Scholar] [CrossRef]
- DiCarlo, J.A.; Yun, H.M. Non-oxyde silicon carbide fibers. In Handbook of Ceramics and Glasses; Bansall, N., Ed.; Kluwer Academic Publishers: New York, NY, USA, 2005; pp. 33–52. [Google Scholar]
- Lara-Curzio, E. Stress-rupture of Nicalon/SiC continuous fiber ceramic composites in air at 950 °C. J. Am. Ceram. Soc. 1997, 80, 3268–3272. [Google Scholar] [CrossRef]
- Lara-Curzio, E. Oxidation induced stress-rupture of fiber bundles. J. Eng. Mater. Technol. 1998, 120, 105–109. [Google Scholar] [CrossRef]
- Parthasarathy, T.A.; Przybyla, C.P.; Hay, R.S.; Cinibulk, M.K. Modeling Environmental Degradation of SiC-Based Fibers. J. Am. Ceram. Soc. 2016, 99, 1725–1734. [Google Scholar] [CrossRef]
- DiCarlo, J.A.; Yun, H.M. Creep of ceramic fibers: Mechanisms, fundamentals and applications. In Creep Deformation: Fundamentals and Applications; Mishra, R.S., Earthman, J.C., Raj, S.V., Eds.; The Minerals, Metals and Materials Society: Warrendale, PA, USA, 2002; pp. 195–208. [Google Scholar]
- DiCarlo, J.A.; Yun, H.M. Factors controlling stress-rupture of fiber reinforced ceramic composites. In Proceedings of the ICCM-12, Paris, France, 7–9 July 1999; p. 750. [Google Scholar]
- R’Mili, M.; Lamon, J. Investigation of subcritical crack growth using load relaxation tests on fiber bundles. Acta Mater. 2011, 59, 2850–2857. [Google Scholar] [CrossRef]
- Davidge, R.W.; McLaren, J.R.; Tappin, G. Strength-probability-time (SPT) relationships in ceramics. J. Mater. Sci. 1973, 8, 1699–1705. [Google Scholar] [CrossRef]
- Charles, R.J.; Hillig, W.B. The kinetics of glass failure by stress corrosion. In Proceedings of the Symposium on Mechanical Strength of Glass and Ways of Improving It, Florence, Italy, 25–29 September 1961; Union Scientifique du Verre: Charleroi, Belgium, 1962. [Google Scholar]
- Wiederhorn, S.M. Subcritical crack growth in ceramics. In Fracture Mechanics of Ceramics; Plenum Press: New York, NY, USA, 1974; Volume 2, pp. 613–646. [Google Scholar]
- Lamon, J.; Mazerat, S.; R’Mili, M. Reinforcement of ceramic matrix composites: Properties of SiC-based filaments and tows. In Ceramic Matrix Composites: Materials, Modeling and Applications; Bansal, N.P., Lamon, J., Eds.; John Wiley and Sons Inc.: Hoboken, NJ, USA, 2014. [Google Scholar]
- Lamon, J.; R’Mili, M. Resistance to Fatigue at Intermediate Temperatures in Air for SiC Hi-Nicalon Fibers: Statistical Distributions of Lifetimes and Strength Degradation. J. Am. Ceram. Soc. 2012, 1–9. [Google Scholar] [CrossRef]
- Calard, V.; Lamon, J. Failure of fiber bundles. Comput. Sci. Technol. 2004, 64, 701–710. [Google Scholar] [CrossRef]
- Coleman, B.D. Time dependence of mechanical breakdown in bundles of fibers. I. Constant Total Load. J. Appl. Phys. 1957, 28, 1058. [Google Scholar] [CrossRef]
- Daniels, H.E. The statistical theory of the strength of bundles of threads I. Proc. R. Soc. 1945, 183, 405–435. [Google Scholar]
- Lamon, J.; R’Mili, M. Damage and failure of SiC fiber tows during environment activated slow crack growth: Residual behavior and Strength-Probability-Time diagrams. Acta Mater. 2017, 131, 197–205. [Google Scholar] [CrossRef]
- Laforet, A. Durée en Fatigue des Composites à Matrice Céramique à des Températures Comprises Entre 800 °C et 1400 °C (Lifetime of Ceramic Matrix Composites at Temperatures between 800–1400 °C). Ph.D. Thesis, University of Bordeaux, Bordeaux, France, April 2009. [Google Scholar]
- Yun, H.M.; DiCarlo, J.A. Thermomechanical Characterization of SiC Fiber Tows and Implications for CMCs. Available online: www.iccm-central.org-Proceedings-site-papers-pap594 (accessed on 28 June 2019).
- Lissart (Godin), N.; Lamon, J. Statistical analysis of failure of SiC fibers in the presence of bimodal flaw populations. J. Mater. Sci. 1997, 32, 6107–6117. [Google Scholar] [CrossRef]
Figure 1.
Fitting of Equation (11) to the experimental rupture time distributions obtained on Hi Nicalon SiC filaments at 800 °C and 1100 MPa [2].
Figure 1.
Fitting of Equation (11) to the experimental rupture time distributions obtained on Hi Nicalon SiC filaments at 800 °C and 1100 MPa [2].

Figure 2.
Plot of rupture times versus initial ratio of applied stress/initial Young’s modulus at intermediate temperatures.
Figure 2.
Plot of rupture times versus initial ratio of applied stress/initial Young’s modulus at intermediate temperatures.

Figure 3.
Typical fracture patterns detected on Hi Nicalon fibers after static fatigue tests at high temperatures: slow crack growth from pre-existing flaw at 700 °C (a), slow crack growth from fiber contact point (b), slow crack growth pattern and smooth fracture pattern in a group of stuck fibers after static fatigue at 1000 °C (c).

Figure 4.
Stress—rupture times diagrams at temperatures ≥ 900 °C. Also shown are the lifetime data obtained at 500 °C for comparison purpose.
Figure 4.
Stress—rupture times diagrams at temperatures ≥ 900 °C. Also shown are the lifetime data obtained at 500 °C for comparison purpose.

Figure 5.
Residual stress-strain behavior after short static fatigue tests measured at room temperature at 5 mm/min deformation rate. The static fatigue test conditions were as follows: hot grip technique, 25 mm gauge length, 20 min for heating up and for cooling down, 15 min at the test temperature; test temperatures = 500, 800, 900 and 1000 °C, applied stress = 1.7 MPa.

Figure 6.
Comparison of stress-rupture time diagrams predicted for potential critical filaments considered independently (identified by particular values of P = αc) and experimental lifetime data obtained on tows: (a) Hi Nicalon 500 °C, (b) Hi Nicalon 800 °C, (c) Hi Nicalon S 800 °C, (d) Hi Nicalon 900 °C, P = 0.002, (e) Hi Nicalon 1000 °C, P = 0.002, (f) Hi Nicalon 1200 °C, P = 0.002.


Figure 7.
Comparison of experimental tow lifetimes with predictions for the weakest filament (P = 0.002) under constant stress 300 and 600 MPa, showing temperature threshold at 900 °C.
Figure 7.
Comparison of experimental tow lifetimes with predictions for the weakest filament (P = 0.002) under constant stress 300 and 600 MPa, showing temperature threshold at 900 °C.


Table 1.
Filament and tow characteristics.
| Hi-Nicalon | Hi-Nicalon S | Reference | |
|---|---|---|---|
| Filaments | |||
| Young’s modulus: Ef (GPa) | 280 | 390 | |
| Filament radius: rf (μm) | 7 | 6 | |
| Gauge length: l0 (mm) | 25 | 25 | |
| Filament volume: vf (m3) | 3.85 10−12 | 2.83 10−12 | |
| KIC (MPa√m) | 1.7 | 1.9 | [22] |
| Y | 1.12 | 1.12 | |
| n | 12.6 | 12.6 | [23] |
| V0*(m/s) | 40.5 | 40.5 | [23] |
| V*(m/s) 500 °C | 4.98 10−9 | 4.98 10−9 | [23] |
| V*(m/s) 800 °C | 2.96 10−6 | 2.96 10−6 | [23] |
| V*(m/s) 900 °C | 1.15 10−5 | ||
| V*(m/s) 1000 °C | 3.76 10−5 | ||
| V*(m/s) 1200 °C | 2.48 10−4 | ||
| Activation energy (kJ/mol) | 146.7 | 146.7 | [23] |
| m | 6.8 | 7 | [2] |
| σ0 (MPa) | 61 | 99 | [2] |
| Reference volume: v0 (m3) | 1 | 1 | |
| Tows | |||
| Number of filaments: N0 | 500 | 500 |
Table 2.
Estimates of stress exponent p and constant A for Hi Nicalon and Hi Nicalon S tows at intermediate temperatures [2].
Table 2.
Estimates of stress exponent p and constant A for Hi Nicalon and Hi Nicalon S tows at intermediate temperatures [2].
| Temperature | p | A (MPan s) | Fiber | R2 |
|---|---|---|---|---|
| 500 °C | 8.45 | 1.05 1030 | Hi Nicalon | 0.73 |
| 800 °C | 8.34 | 3.36 1026 | Hi Nicalon | 0.76 |
| 600 °C | 7.25 | 3.15 1026 | Hi Nicalon S | |
| 800 °C | 7.24 | 3.33 1024 | Hi Nicalon S |
Table 3.
Estimates of stress exponent p and constant A at temperatures ≥ 900 °C for Hi Nicalon fibers [4,28].
| Temperature | p | A (MPan s) | R2 |
|---|---|---|---|
| 900 °C | 13.4 | 2.42 1037 | 0.58 |
| 1000 °C | 27.3 | 1.13 1071 | 0.53 |
| 1200 °C | 31.4 | 9.08 1077 | 0.9 |
Table 4.
Failures stresses measured on tows at room temperature after interrupted fatigue tests at various temperatures.
Table 4.
Failures stresses measured on tows at room temperature after interrupted fatigue tests at various temperatures.
| Fatigue Temperature | Failure Stress (MPa) |
|---|---|
| 500 °C | 1687–1750 |
| 800 °C | 1046–1769 |
| 900 °C | 498–964 |
| 1000 °C 15 min | 590–871 |
| 1000 °C 1 h | 366–803 |
| 1000 °C 2 h | 551–761 |
© 2019 by the author. Licensee MDPI, Basel, Switzerland. This article is an open access article distributed under the terms and conditions of the Creative Commons Attribution (CC BY) license (http://creativecommons.org/licenses/by/4.0/).
Share and Cite
MDPI and ACS Style
Lamon, J. Static Fatigue of SiC Multifilament Tows at Temperatures up to 1200 °C in Air. Ceramics 2019, 2, 426-440. https://doi.org/10.3390/ceramics2030033
AMA Style
Lamon J. Static Fatigue of SiC Multifilament Tows at Temperatures up to 1200 °C in Air. Ceramics. 2019; 2(3):426-440. https://doi.org/10.3390/ceramics2030033
Chicago/Turabian StyleLamon, Jacques. 2019. "Static Fatigue of SiC Multifilament Tows at Temperatures up to 1200 °C in Air" Ceramics 2, no. 3: 426-440. https://doi.org/10.3390/ceramics2030033